evaluation of active driving assistance …media.acg.aaa.com/content/1205/files/e_1_ research...
TRANSCRIPT

EVALUATION OF ACTIVE DRIVING ASSISTANCE SYSTEMS
AUGUST 2020
NewsRoom.AAA.com

2 © 2020 American Automobile Association, Inc.
Active Driving Assistance
(this page intentionally left blank)
3 © 2020 American Automobile Association, Inc.
Active Driving Assistance
Abstract
In 2018, AAA evaluated four vehicles equipped with active driving assistance (ADA) systems. In common language, these systems assist the driver with vehicle acceleration, braking and steering. SAE1 International defines various levels of driving automation within standard J3016 [1] and ADA systems currently available within the United States are considered to be Level 2 systems per this standard. To build upon work AAA conducted in 2018, the performance of five additional vehicles equipped with ADA systems was characterized.
Research Questions:
1. How do vehicles equipped with ADA systems perform during scenarios reasonably encountered
in highway driving situations?
Evaluated via closed-course testing
2. How do vehicles equipped with ADA systems perform during naturalistic highway driving?
Evaluated on public highways and interstates
Key Findings:
1. In general, evaluated ADA systems performed according to expectations derived from the
owner’s manuals during closed-course evaluations.
a. On fresh pavement with well-defined lane markers, all systems consistently traversed
the testing lane with some lateral offset relative to the lane center.
b. In aggregate, evaluated ADA systems made contact with a simulated disabled vehicle
66% of the time.
c. For a simulated stop-and-go scenario, none of the evaluated ADA systems made contact
with a lead vehicle for all tested deceleration rates.
2. Test drivers reached a consensus that over approximately 4,000 miles of total driving distance,
combining longitudinal and lateral control into a single system did not significantly enhance the
driving experience for the majority of encountered scenarios. On roadways utilized for
evaluation:
a. Lane-keeping events accounted for 73% of noted events.2
b. A total of 521 events were noted among all evaluated ADA systems. On average, this
resulted in a noteworthy event approximately every eight miles.
1 Society of Automotive Engineers 2 The Super Cruise™ system exhibited significantly less lane-keeping events in terms of distribution and frequency relative to other evaluated systems. However, test drivers expressed concern about sudden disengagements with little to no warning.
4 © 2020 American Automobile Association, Inc.
Active Driving Assistance
Contents
Abstract ........................................................................................................................................................ 3
1 Introduction .......................................................................................................................................... 6
2 Background ........................................................................................................................................... 7
2.1 SAE Driving Automation System Levels ......................................................................................................8
2.1.1 Level 0 Driving Support System ..........................................................................................................8
2.1.2 Level 1 Driving Support System ..........................................................................................................8
2.1.3 Level 2 Driving Support System ..........................................................................................................8
2.1.4 Level 3 Driving Automation System....................................................................................................9
2.1.5 Level 4 Driving Automation System....................................................................................................9
2.1.6 Level 5 Driving Automation System....................................................................................................9
2.2 Sensors Utilized for Active Driving Assistance ............................................................................................9
3 Vehicle Selection Methodology .......................................................................................................... 10
4 Test Equipment and Resources .......................................................................................................... 11
4.1 Vehicle Dynamics Equipment .................................................................................................................. 11
4.1.1 Closed-Course Test Instrumentation ............................................................................................... 11
4.1.2 Naturalistic Test Instrumentation ................................................................................................... 14
4.2 Test Facility .............................................................................................................................................. 15
5 Vehicle Preparation ............................................................................................................................ 16
6 Inquiry 1: How do vehicles equipped with ADA systems perform during scenarios commonly encountered in
highway driving situations? ........................................................................................................................ 16
6.1 Objective .................................................................................................................................................. 16
6.2 Methodology ........................................................................................................................................... 17
6.2.1 Lane Placement ............................................................................................................................... 17
6.2.2 Approaching a Disabled Vehicle ...................................................................................................... 20
6.2.3 Traffic Jam Assistance ...................................................................................................................... 25
6.3 Overall Summary of Closed-Course Performance ................................................................................... 35
7 Inquiry 2: How do vehicles equipped with ADA systems perform during naturalistic highway driving?
36
7.1 Objective .................................................................................................................................................. 36

5 © 2020 American Automobile Association, Inc.
Active Driving Assistance
7.2 Methodology ........................................................................................................................................... 36
7.3 Results and Observations ........................................................................................................................ 38
7.3.1 2019 BMW X7 .................................................................................................................................. 38
7.3.2 2019 Cadillac CT6 ............................................................................................................................. 40
7.3.3 2019 Ford Edge ................................................................................................................................ 42
7.3.4 2020 Kia Telluride ............................................................................................................................ 43
7.3.5 2020 Subaru Outback ...................................................................................................................... 45
7.4 Overall Summary of Naturalistic Evaluation ............................................................................................ 46
8 Overall Conclusions ............................................................................................................................ 48
9 Key Findings ........................................................................................................................................ 49
10 Summary Recommendations ............................................................................................................. 49
11 Appendix ............................................................................................................................................. 51
11.1 2019 BMW X7 .......................................................................................................................................... 51
11.2 2019 Cadillac CT6 ..................................................................................................................................... 54
11.3 2019 Ford Edge ........................................................................................................................................ 56
11.4 2020 Kia Telluride .................................................................................................................................... 60
11.5 2020 Subaru Outback .............................................................................................................................. 63
12 Bibliography ........................................................................................................................................ 66

6 © 2020 American Automobile Association, Inc.
Active Driving Assistance
1 Introduction
Any current discussion pertaining to the automotive industry will undoubtedly include the state of autonomous vehicle (AV) development. The eventual deployment of fully autonomous vehicles could bring many societal benefits including less roadway congestion and increased traffic flow, reduced emission of greenhouse gasses and more personal time for commuters. Additionally, there could be more transportation options for those with mobility challenges.
The most important benefit could be a significant reduction of traffic crashes and injuries. In 2018, more than 36,000 people died in motor vehicle crashes. While the road to autonomy will have bumps along the way, AAA believes that fully autonomous vehicles have the potential to save thousands of lives every year. Government and safety experts estimate that fully autonomous vehicles could prevent up to 80 percent of today’s crashes.
Figure 1: Fully autonomous vehicles will be required to analyze and react to highly dynamic environments Image Source:
AAA
While the concept of autonomous or “self-driving” cars was described as far back as the 1939 World’s Fair, actual research and development has only begun to make significant progress over the last decade. Current estimates of when fully autonomous vehicles will become widely available for the average motorist vary. Some optimistic technology companies believe they will come to market in the next few years whereas some automakers, legal experts and regulatory groups caution it may be decades before fully autonomous cars are ready to navigate all public roadways in significant volume

7 © 2020 American Automobile Association, Inc.
Active Driving Assistance
without any human interaction. Additionally, the widespread coverage of high-profile incidents involving autonomous test vehicles has somewhat tempered public enthusiasm related to the technology. A 2020 AAA survey on consumer sentiment towards automated vehicles found only 12% of U.S. drivers would feel comfortable riding in a vehicle that drives itself.
Regardless of the eventual outcome of autonomous vehicle deployment, “building blocks” of autonomy are already being deployed within vehicles available to the general public. Examples include adaptive cruise control, lane keeping assistance, automatic emergency braking, parking assistance and more. Active driving assistance (ADA) integrates both longitudinal and lateral motion control and is the most advanced semi-autonomous vehicle technology available to the consumer. Within the industry, these systems are known as Level 2 driver support features [1]. It is paramount to note that currently available systems are only capable of assisting the driver within certain environments; the driver must remain attentive and maintain control of the vehicle at all times.
The purpose of this research is to provide an ongoing evaluation of publicly available ADA systems. Within this work, the performance of ADA systems on vehicles available for sale throughout the U.S. were assessed. Evaluations were conducted on a closed-course and public access roadways to characterize performance in terms of lane-keeping and adaptive-cruise functionalities.
2 Background
According to the National Highway Traffic Safety Administration (NHTSA), there were approximately 6,734,000 police-reported motor vehicle crashes across the U.S in 2018, resulting in 2,710,000 injuries and 36,560 fatalities [2].
While society waits to see if the widespread deployment of fully autonomous vehicles ultimately becomes a reality, some advanced driver assistance systems (ADAS) are already contributing to a reduction in crash rates. A 2018 AAA Foundation analysis estimated that if driver assistance technologies were installed on all vehicles they would have had the potential to help prevent or mitigate roughly 40 percent of all crashes involving passenger vehicles [3]. Through Foundation research, AAA is also working to better understand driver performance and perceptions of the technology.
ADA systems are a subset of ADAS. The safety benefits of available ADA systems are less certain because they are typically designed to be engaged in highway driving environments where crashes are usually infrequent. Even if all interstate miles were covered by vehicles with ADA systems that prevented all fatalities and injuries, the maximum overall benefit would be a 17 percent reduction in crash fatalities and a 9 percent reduction in crash injuries [4]. Regardless of actual safety benefits, current ADA systems are designed to reduce the workload on the driver in highway driving environments which can potentially promote fatigue as a result of monotonous surroundings.
The number of vehicles with an ADA system as either standard or optional equipment on at least one trim level continues to increase with each subsequent model year. For the 2020 model year, ADA systems are standard on 10 percent of new vehicles sold in the United States. This figure increases to

8 © 2020 American Automobile Association, Inc.
Active Driving Assistance
34 percent for new vehicles that have an ADA system as either standard or optional on some or all trim levels.
2.1 SAE Driving Automation System Levels
Autonomous driving levels are defined by SAE International standard J3016 [1]. This standard describes motor vehicle driving automation systems that perform all or part of the dynamic driving task on a sustained basis. There are six levels ranging from 0 to 5. It is important to note a vehicle may be equipped with an AV system capable of delivering multiple driving automation features. The autonomous driving level assigned to a single feature is mutually exclusive; in other words, it is not possible to classify the same feature under multiple levels depending on the operating environment. However, it is possible for a vehicle equipped with multiple automation driving features to operate at different levels depending on the operating environment. For example, a vehicle could be equipped with level 1 adaptive cruise control that operates on most roadways, a level 3 traffic jam assistance feature and a level 4 automated parking feature.
The scope of primary research within this work exclusively focuses on vehicles equipped with ADA systems capable of level 2 operation within highway environments. Additional functionalities outside of this scope will not be evaluated. A detailed description of vehicle selection methodology and rationale can be found in Section 3.
2.1.1 Level 0 Driving Support System
No driving automation is present; the driver is required to maintain lateral and longitudinal control of the vehicle and situational awareness at all times. Vehicles equipped with anti-lock brakes, electronic stability control and/or automatic emergency braking are considered level 0 vehicles because these systems do not provide sustained automated intervention. Under SAE J3016, a driving system is required to provide an automated driving function on a continuing basis and respond to external events for the system to be classified beyond level 0. This requirement dictates conventional cruise control is level 0 because of its inability to adjust vehicle speed according to its environment.
2.1.2 Level 1 Driving Support System
Driver assistance functionality is present; the system provides either lateral or longitudinal motion control in a sustained manner. It is expected the human driver will perform the remainder of the driving task. While the automated system is in operation, the driver must monitor the performance of the system and maintain situational awareness at all times. Lane keeping assistance and adaptive cruise control systems are classified as level 1. For vehicles equipped with both systems, it cannot be assumed level 2 operation is possible without verification that both systems are integrated in order to provide lateral and longitudinal motion control in a coordinated manner.
2.1.3 Level 2 Driving Support System
For a system to be considered level 2, sustained lateral and longitudinal motion control must be provided simultaneously and in a coordinated manner. With level 2 driving support, the driver is expected to maintain situational awareness at all times for the specific purpose of responding to objects and/or events that may require the driver to assume full control immediately. The majority of
9 © 2020 American Automobile Association, Inc.
Active Driving Assistance
available level 2 systems require the driver keep his/her hands on the steering wheel throughout system operation. If a driver ignores repeated requests to place his/her hands back on the steering wheel, the system will disengage; some manufacturers will additionally disable system functionality for the remainder of the trip.
2.1.4 Level 3 Driving Automation System
Beginning with level 3 driving automation, the system performs the entire dynamic driving task. Level 3 systems are defined as “conditional driving automation.” In other words, the system can operate within specific environments with the expectation a human driver is available to assume full control when prompted by the vehicle. For example, the system can prompt a driver to assume control when it is approaching the end of a condition in which the system can operate, such as a limited access freeway. Additionally, an unexpected situation can arise within a system’s intended operating environment. In this case, the system should be capable of issuing a request to intervene with sufficient reaction time available to the driver. Additionally, a level 3 system can request human intervention if a system failure compromises autonomous operation.
2.1.5 Level 4 Driving Automation System
Level 4 systems are defined as “high driving automation”; the primary difference between levels 3 and 4 relates to expectations placed on human drivers/occupants. Level 3 systems are designed with the expectation a human driver will respond appropriately to a request to intervene whereas a level 4 system operates without any expectations pertaining to vehicle occupants within its operational domain.
While level 4 systems still operate within specific environments, i.e. a limited access freeway, the system is capable of unlimited vehicle operation within that environment. If a human driver or remote operator fails to resume control when the vehicle reaches the end of its operating environment, the system will automatically achieve a “minimal risk condition” in which the vehicle either comes to a stop or operates in a “limp” mode. Additionally, the system is capable of addressing any system failure that may occur during operation. If a vehicle equipped with a level 4 driving system is designed to not operate outside of its intended environment, driver controls such as a steering wheel and brake/accelerator pedal may be omitted from the passenger compartment.
2.1.6 Level 5 Driving Automation System
A level 5 system represents the apex of autonomous vehicle operation. These systems are defined as “full driving automation” because they can operate in all environments manageable by a capable human driver. In other words, it is possible a vehicle equipped with a level 5 system could be designed without a steering wheel and brake/accelerator pedals while being capable of operation in any environment suitable for a human driver. Additionally, these systems are capable of maintaining safe vehicle operation in the event of a system failure via a “limp” mode.
2.2 Sensors Utilized for Active Driving Assistance
ADAS and autonomous vehicle systems rely on a variety of sensors in order to gather data about the surrounding environment. Every sensor consists of a hardware and software component; the hardware
10 © 2020 American Automobile Association, Inc.
Active Driving Assistance
is composed of the physical parts necessary to emit and/or receive electromagnetic radiation as well as signal conditioning and data processing. The software component is responsible for converting raw data into useful information about the dynamic environment around the vehicle as well as determining an appropriate response.
Current ADA systems utilize both front-facing radar and image sensors (cameras) to obtain kinematic data pertaining to surrounding vehicles and objects as well as the position of lane markers. These systems typically utilize the same sensors as adaptive cruise and lane keeping assistance systems. The major difference originates in the software component which is responsible for effecting lateral and longitudinal control in a coordinated manner.
It is important to note more processing power is required as system functionality becomes more complex. This is especially true if multiple capabilities are integrated into a singular system. In conjunction with processing capability, software algorithms are largely responsible for system performance. Many analysts believe future developments in artificial intelligence and deep learning will accelerate the development of fully autonomous vehicles. A detailed discussion relating to data processing and software design considerations are outside the scope of this work.
A general overview of sensors for vehicle systems has been provided in various AAA research reports. For more information, refer to Section 2.1 of the Automatic Emergency Braking with Pedestrian Detection report which can be found on the AAA NewsRoom.
3 Vehicle Selection Methodology
AAA researchers consulted with manufacturers to ensure tested vehicles were equipped with SAE defined level 2 autonomous driving technology. In order to be considered a level 2 autonomous vehicle system by SAE standard J3016, an autonomous driving system must provide sustained lateral and longitudinal vehicle motion control within its ODD.
Additionally, the following criteria were utilized for vehicle selection:
Ability for system to function at speeds up to 70 mph
Inclusion of domestic and import OEMs
Variety of manufacturers (only one vehicle per manufacturer will be tested)
Vehicle was not previously evaluated in 2018
Based on the preceding requirements, the following vehicles were selected for testing:
2019 BMW X7 with “Active Driving Assistant Professional”
o Software Version: 07/2019.55
2019 Cadillac CT6 with “Super Cruise™”
o Build Number: gminfo3:6.0.1/V509-774-P/116:user/release-keys/18.46.61
o Update History: 84679516 v594968308:594968308
2019 Ford Edge with “Ford Co-Pilot360™”
o Software Version: SYNC 3, 3.3
o Build: 19052_PRODUCT
11 © 2020 American Automobile Association, Inc.
Active Driving Assistance
2020 Kia Telluride with “Highway Driving Assist”
o Software Version: ON.USA.SSW_M.V003.002.190813
o Firmware Version: ON.USA.292.190613.MICOM.D
2020 Subaru Outback with “EyeSight®”
o Software Version: F11GHM020-501
The 2019 Cadillac CT6 and the 2019 Ford Edge were evaluated only within naturalistic environments. Specifically, the Super Cruise™ system within the Cadillac CT6 can only be activated on limited-access roadways previously mapped with LIDAR mapping. The Ford Co-Pilot360™ system within the Ford Edge failed to activate on closed-course testing roadways.
4 Test Equipment and Resources
Equipment specifications are referenced in Figures 3-7.
4.1 Vehicle Dynamics Equipment
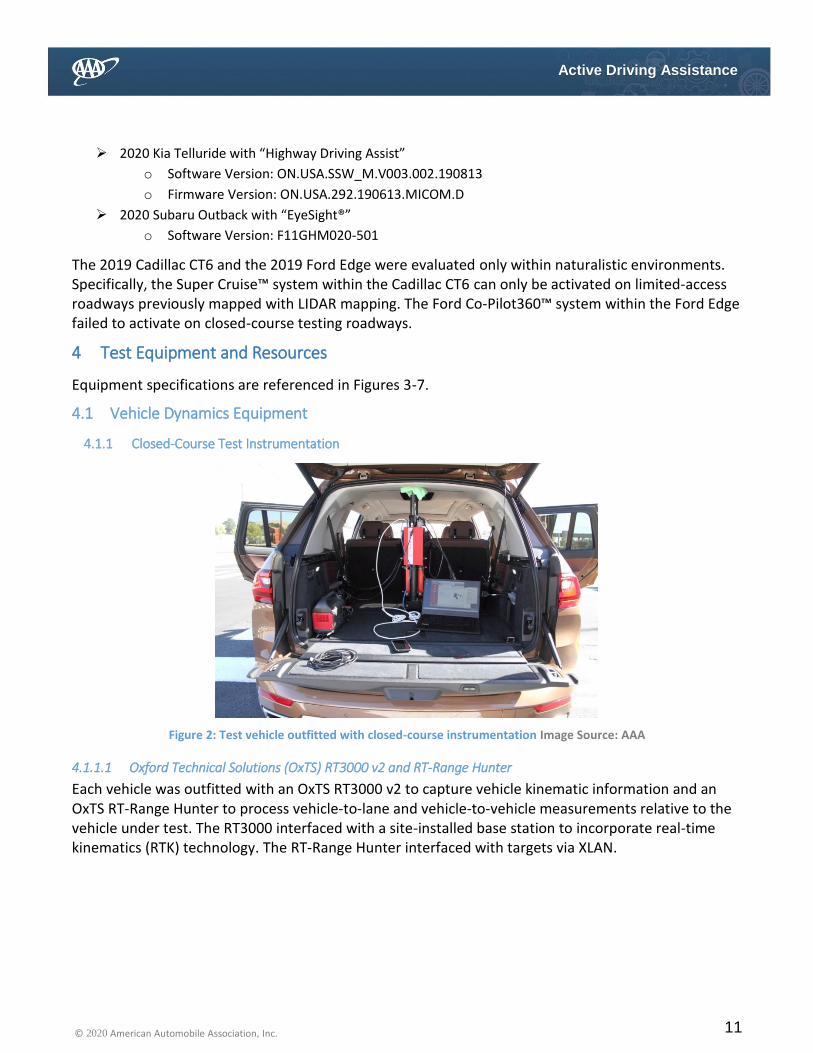
4.1.1 Closed-Course Test Instrumentation
Figure 2: Test vehicle outfitted with closed-course instrumentation Image Source: AAA
4.1.1.1 Oxford Technical Solutions (OxTS) RT3000 v2 and RT-Range Hunter
Each vehicle was outfitted with an OxTS RT3000 v2 to capture vehicle kinematic information and an OxTS RT-Range Hunter to process vehicle-to-lane and vehicle-to-vehicle measurements relative to the vehicle under test. The RT3000 interfaced with a site-installed base station to incorporate real-time kinematics (RTK) technology. The RT-Range Hunter interfaced with targets via XLAN.

12 © 2020 American Automobile Association, Inc.
Active Driving Assistance
Figure 3: OxTS RT3000 v2 specifications Image Source: AAA
Figure 4: OxTS RT-Range Hunter specifications Image Source: AAA
4.1.1.2 Futek LAU220 Pedal Force Sensor
Each vehicle was equipped with a brake pedal force sensor to verify no braking intervention was applied during closed-course testing.
Figure 5: Futek LAU220 specifications Image Source: AAA
4.1.1.3 DEWESoft CAM-120 Cameras with CAM-BOX2 Distribution Box
Each vehicle was equipped with one camera facing the instrument cluster to monitor the activation state of the ADA system. Additionally, one camera was mounted to each side of the vehicle to monitor positioning relative to lane markers. Video from all cameras was captured at a rate of 45 Hz.
Figure 6: DEWESoft CAM-120 specifications Image Source: AAA
Position Accuracy 0.01 m
Velocity Accuracy 0.01 m/s
Roll & Pitch Accuracy 0.03°
Heading Accuracy 0.1°
Slip Angle Accuracy 0.15°
Output Data Rate 100 Hz
Forward Range 0.03 m RMS
Lateral Range 0.03 m RMS
Resultant Range 0.03 m RMS
Forward Velocity 0.02 m/s RMS
Lateral Velocity 0.02 m/s RMS
Resultant Velocity 0.02 m/s RMS
Resultant Yaw Angle 0.1° RMS
Lateral Distance to Lane 0.02 m RMS
Rated Output (RO) 2mV/V
Nonlinearity ± 0.25% of RO
Hysteresis ± 0.25% of RO
Nonrepeatability ± 0.10% of RO
Off Center Loading ± 1% or better @
Image Sensor Sony ICX618
Sensor Type CCD
FPS 120 FPS @ 640x480
Dynamic Range 32 dB autogain function
Shutter Time 58 ns-60 s (autoshutter function)

13 © 2020 American Automobile Association, Inc.
Active Driving Assistance
4.1.1.4 DEWESoft CAN-2 Interface
Test vehicles were equipped with a CAN interface to capture data from OxTS instrumentation. Vehicle kinematics and range data were captured at a rate of 100 Hz and time-synced with pedal force measurements and video.
4.1.1.5 Data Logging Equipment
Test vehicles were either equipped with a DEWESoft DEWE-43 or SIRIUS® slice data logger to log pedal force measurements at a rate of 2000 Hz. Each data logger was equipped with anti-aliasing filters to attenuate frequencies above the Nyquist frequency.
4.1.1.6 DRI Low Profile Robotic Vehicle (LPRV) with DRI Soft Car 360®
The robotic vehicle is a hardened, satellite guided, self-propelled low profile vehicle which serves as a dynamic platform for the DRI Soft Car. The LPRV has a top speed of 50 mph and a maximum deceleration rate of 0.8 G. The positions of the vehicle under test and LPRV are measured continually using differential GPS with RTK correction. Kinematic data relating to the vehicle under test is broadcast to the LPRV via wireless LAN. This information in conjunction with pre-loaded time-space trajectories (one each for the vehicle under test and LPRV) allow the LPRV to arrive at predefined locations relative to the vehicle under test in a repeatable manner.
Additionally, data from the LPRV was processed by the OxTS RT-Range Hunter to calculate LRPV kinematics relative to the vehicle under test (vehicle under test acts as a non-Newtonian reference frame).
Figure 7: DRI Low Profile Robotic Vehicle specifications Image Source: AAA
Longitudinal Acceleration +0.11 G, -0.8 G
Lateral Acceleration ± 0.8 G
Path Following Accuracy 0.05 m
Position Measurement Accuracy 0.02 m

14 © 2020 American Automobile Association, Inc.
Active Driving Assistance
Figure 8: DRI Low Profile Robotic Vehicle Image Source: AAA
The Soft Car 360® is calibrated to be representative of a small passenger vehicle relevant to automotive sensors including radar and cameras. The hatchback model was utilized for testing; its length, width and height are 158 in, 67 in and 56 in, respectively.
4.1.2 Naturalistic Test Instrumentation
Figure 9: Test vehicles outfitted with naturalistic instrumentation Image Source: AAA

15 © 2020 American Automobile Association, Inc.
Active Driving Assistance
4.1.2.1 Racelogic VBOX Video HD2 with Micro Input Module
Dual cameras are capable of recording video at 1080p with a corresponding frame rate of 60 FPS. One camera was mounted on the roof of the vehicle to capture an “overhead” forward perspective. The remaining camera was mounted on the steering column to capture the status of the ADA system.
A Racelogic Micro Input Module was interfaced with the VBOX unit to capture input from a custom fabricated box with four single-pole-single-throw (SPST) buttons. Each button served as an event marker to tag noteworthy events within the data file. The four buttons corresponded to the following events:
1. Lane Departure
2. Erratic Lane Positioning
3. Failure to Slow/Stop
4. Other
Each test vehicle was simultaneously equipped with a VBOX unit during naturalistic evaluations. Vehicle kinematic data was captured at a rate of 10 Hz.
4.2 Test Facility
All closed-course testing was conducted on surface streets at the AAA Northern California, Nevada and Utah operated GoMentum Station proving ground in Concord, California. GoMentum Station is utilized by automated vehicle developers and suppliers for testing, validation, and safety research.
All testing was conducted on a dry asphalt surface free of visible moisture. The surface was straight and flat, free of potholes and other irregularities that could cause significant variations in the trajectory of the test vehicle. The testing area was approximately 0.4 miles long and consisted of a two-lane roadway divided down the middle by a dashed white line. The width of each dashed white line segment was 7 inches with a uniform spacing of 17 feet 2 inches between segments.
Figure 10: Illustration of testing surface Image Source: AAA
Each individual lane was marked by a solid white line on the lateral side and the previously described dashed white line on the medial side with a nominal lane width of 10 feet. This lane width is representative of typical roadways (excluding interstates and limited-access expressways with a nominal width of 12 feet) in both urban and rural areas within the United States.

16 © 2020 American Automobile Association, Inc.
Active Driving Assistance
Before testing, all test lanes were mapped using OxTS Lane Survey and Map Creation software.
Naturalistic evaluations were conducted on Highway 101 from the greater Los Angeles area to the greater San Francisco area. I-5 was utilized for the return trip back to the Los Angeles area. Detailed route information is provided in Section 7.2.
5 Vehicle Preparation
All vehicles were procured directly from manufacturers or specialty rental fleets. Any vehicles procured from a specialty rental company were sourced directly from the inventory of a new vehicle dealership. Vehicles provided by the manufacturer were verified by the OEM to be suitable for ADA system testing. All test vehicles were evaluated in the “as received” condition from the manufacturer or specialty rental company. To ensure proper functioning of the ADA system, all test vehicles were serviced at area dealerships to include a four-wheel alignment and recalibration of the ADA system prior to commencing closed-course testing (upon arrival in Concord, CA). Documentation was provided by each dealership to ensure ADA systems were recalibrated according to manufacturer specification.
All test vehicles were verified to be equipped with an ADA system that was enabled, properly functioning, free of modifications and calibrated. The odometer reading of all test vehicles was between 1,000 and 7,000 miles at the start of testing.
Additionally, vehicles were inspected to verify testing suitability according to the following checklist:
No warning lights illuminated
All system components free of damage and unaffected by any technical service bulletins and/or recalls
Any stored diagnostic trouble codes resolved and cleared
All fluid reservoirs filled to at least the minimum indicated levels
For test vehicles with driver configurable settings for the timing of collision warning and/or brake application, the system was set to the middle setting for disabled vehicle and traffic jam assistance test scenarios. If an even number of settings were available, the next latest setting closest to the midpoint was utilized. For naturalistic evaluations, the test driver was given discretion in choosing his/her following distance.
Throughout this work, the term “test driver” refers to a AAA researcher operating a test vehicle on a closed-course or naturalistic roadway.
Before the start of each testing day, the areas surrounding the image and radar sensors on all test vehicles were cleaned to ensure proper system operation.
6 Inquiry 1: How do vehicles equipped with ADA systems perform during scenarios commonly encountered in highway driving situations?
6.1 Objective
Evaluate active driving assistance systems during scenarios commonly encountered in highway driving environments.
17 © 2020 American Automobile Association, Inc.
Active Driving Assistance
6.2 Methodology
6.2.1 Lane Placement
Sustained lane-keeping capability is one of two primary functionalities of an active driving assistance system. AAA researchers evaluated the lane placement capabilities of each test vehicle on a test lane typical of most well maintained roadways. This lane consisted of fresh pavement with newly painted lane markings and a nominal width of 10 feet. This test lane was previously described in Section 4.2.
The vehicle was evaluated in one direction within the same test lane such that the solid white line was on the right side, relative to the driver’s perspective. For each test run, the ADA system was set to 45 mph and steady-state speed was reached before the vehicle entered the mapped section of roadway. The lateral offset of the right edge of the test vehicle relative to the solid white line was continually measured as the vehicle traversed the roadway. The system was kept engaged throughout the testing lane; the driver kept hands on the steering wheel throughout the test but provided no steering input unless requested by the system. If input was requested, a minimum amount of input was applied in order to keep the system engaged. Five runs were conducted per test vehicle.
The raw data from each of the five runs consisted of the lateral offset of the test vehicle (right side of vehicle relative to the right lane marker) and the corresponding longitudinal vehicle position relative to the beginning of the mapped portion of the testing lane. Bessel spline interpolation was performed on the raw data from each run to calculate the lateral offset at 5 cm increments along the testing lane. The resulting five interpolations for each test vehicle were combined to determine the average lateral lane placement along the entirety of the testing lane. The standard error associated with the averaged interpolated data points was graphed as an upper and lower bound of the average measurement.
When graphing the lateral offset of the vehicle (y-axis) with respect to the longitudinal travel (x-axis), a horizontal line would represent a constant offset relative to the edge of the lane. While a constant offset cannot be realistically expected, a minimal degree of quasiperiodicity is generally preferred because this would indicate less “weaving” within the lane.
In the context of naturalistic roadways, this testing lane could be considered an idealized surface. The roadway entirely consists of fresh pavement and newly painted lane markers with no additional vehicles either alongside or in front of the test vehicle to influence the ADA system. Previous work noted that evaluated ADA systems were influenced in terms of lane placement by erratic lead vehicles. For detailed methodology and findings, refer to the research report on the AAA NewsRoom.

18 © 2020 American Automobile Association, Inc.
Active Driving Assistance
6.2.1.1 2019 BMW X7
Figure 11: Average lateral lane offset with good lane markings Image Source: AAA
Figure 11 illustrates the lateral placement of the vehicle throughout the entirety of the testing lane. When traversing the roadway, the average lateral offset from the right shoulder was maintained between roughly 0.35 ft to 1.35 ft throughout the entirely of the testing lane. This implies acquisition of lane markings by the system; however, some variation with respect to lateral placement within the test lane was noted. The standard error calculated from all test runs is largely insignificant; this signifies consistent lane positioning from run to run for the evaluated roadway.
The vehicle remained slightly offset towards the right side of the testing lane throughout the entirety of the test. This observation does not imply negative performance as the vehicle remained within the lane during the entirely of the test.
19 © 2020 American Automobile Association, Inc.
Active Driving Assistance
6.2.1.2 2020 Kia Telluride
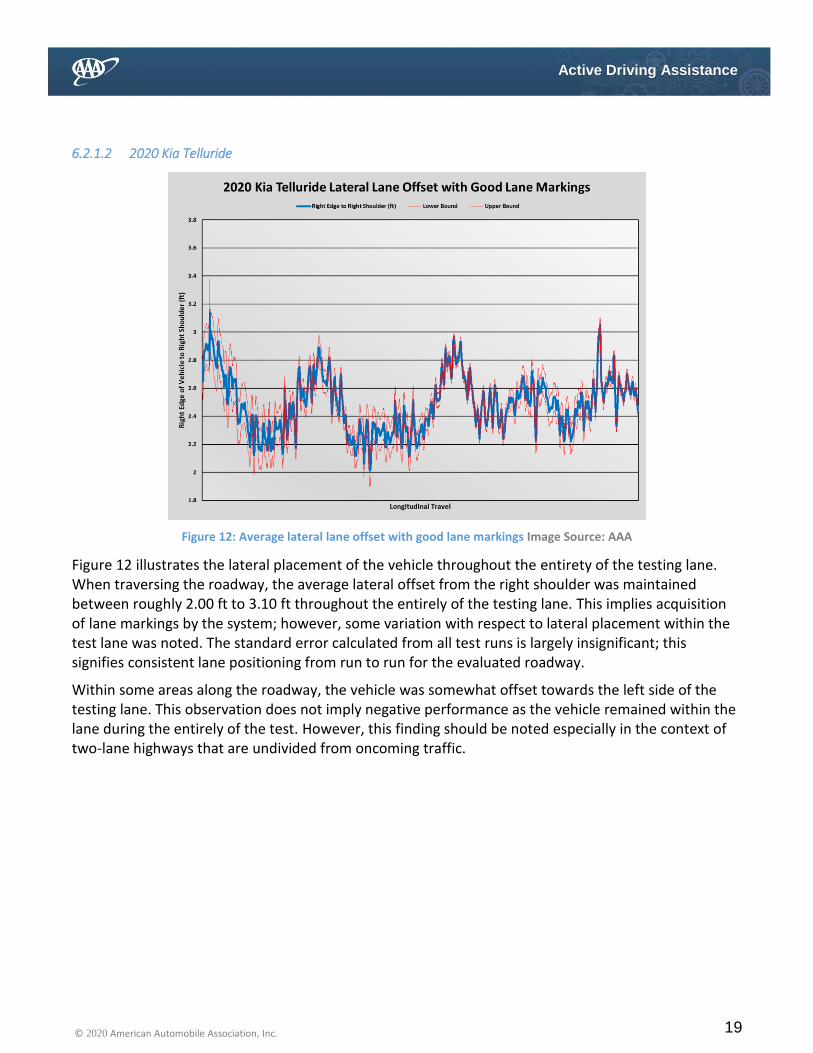
Figure 12: Average lateral lane offset with good lane markings Image Source: AAA
Figure 12 illustrates the lateral placement of the vehicle throughout the entirety of the testing lane. When traversing the roadway, the average lateral offset from the right shoulder was maintained between roughly 2.00 ft to 3.10 ft throughout the entirely of the testing lane. This implies acquisition of lane markings by the system; however, some variation with respect to lateral placement within the test lane was noted. The standard error calculated from all test runs is largely insignificant; this signifies consistent lane positioning from run to run for the evaluated roadway.
Within some areas along the roadway, the vehicle was somewhat offset towards the left side of the testing lane. This observation does not imply negative performance as the vehicle remained within the lane during the entirely of the test. However, this finding should be noted especially in the context of two-lane highways that are undivided from oncoming traffic.

20 © 2020 American Automobile Association, Inc.
Active Driving Assistance
6.2.1.3 2020 Subaru Outlook
Figure 13: Average lateral lane offset with good lane markings Image Source: AAA
Figure 13 illustrates the lateral placement of the vehicle throughout the entirety of the testing lane. When traversing the roadway, the average lateral offset from the right shoulder was maintained between roughly 2.50 ft to 3.80 ft throughout the entirely of the testing lane. This implies acquisition of lane markings by the system; however, some variation with respect to lateral placement within the test lane was noted. The standard error calculated from all test runs is largely insignificant; this signifies consistent lane positioning from run to run for the evaluated roadway.
Within some areas along the roadway, the vehicle was offset towards the left side of the testing lane. This observation does not imply negative performance as the vehicle remained within the lane during the entirely of the test. However, this finding should be noted especially in the context of two-lane highways that are undivided from oncoming traffic.
6.2.2 Approaching a Disabled Vehicle
In both urban and rural driving environments, it is fairly common to encounter disabled vehicles along the side of the roadway. As the leading roadside assistance provider and traffic safety advocate, AAA is committed to raising awareness of the dangers associated with working at the roadside and promoting solutions to reduce resulting fatalities and injuries. Part of this commitment involves researching the implications of ADAS on roadside safety. Of particular interest is the performance of ADA systems as disabled vehicle(s) alongside or within the roadway are approached.
It is important to note the owner’s manual for each test vehicle specifies the ADA system may not react when a lead vehicle is not completely within the travel lane.

21 © 2020 American Automobile Association, Inc.
Active Driving Assistance
The relevant excerpts are provided for reference:
2019 BMW X7 – pg 236: “A vehicle driving in front of you is not detected until it is completely within the same lane as your vehicle.”
2020 Kia Telluride – pg 5-66: “Limitations of the sensors. The sensor may be limited when… the vehicle is stopped vertically.”
2020 Subaru Outback – pg 46 of EyeSight® supplementary owner’s manual: “The stereo camera may have difficulty detecting the following objects or conditions. Operate the brake pedal and take other actions as necessary… Vehicles at significantly different speeds (vehicles driving slowly, stopped or oncoming vehicles, etc.)”
It is acknowledged that this test evaluates system performance that may be outside of stated design capabilities. However, as these systems are specifically designed for highway use, it is nonetheless important to consider situations that may be reasonably expected during their use.
To simulate this situation, the DRI Soft Car 360® (herein referred to as the “target vehicle”) was parked approximately halfway off the right side of the testing lane previously described in Section 4.2. In other words, the centerline of the vehicle was approximately located over the solid white line on the lateral side of the testing lane. The lateral placement of the target vehicle could be considered a best-case scenario in terms of detection opportunity with the exception of the target vehicle being placed directly in the center of the testing lane. In many cases when a disabled vehicle is partially within a roadway, it is common for only a small portion of the vehicle to obstruct the travel lane. A typical example would be a vehicle parked diagonally relative to the roadway with only the rear corner of the vehicle in the travel lane.
Figure 14: Lateral placement of DRI Soft Car 360® Image Source: AAA
The longitudinal placement was approximately halfway down the testing lane to allow sufficient space for steady-state speed to be reached a minimum of 1000 feet from the target vehicle. Three runs were performed for each test vehicle. For each run, the ADA system was engaged at 30 mph and allowed to reach steady-state speed as the test vehicle entered the testing lane. Hands were placed on the steering wheel and minimal steering input was provided if requested by the system. Since the driver
22 © 2020 American Automobile Association, Inc.
Active Driving Assistance
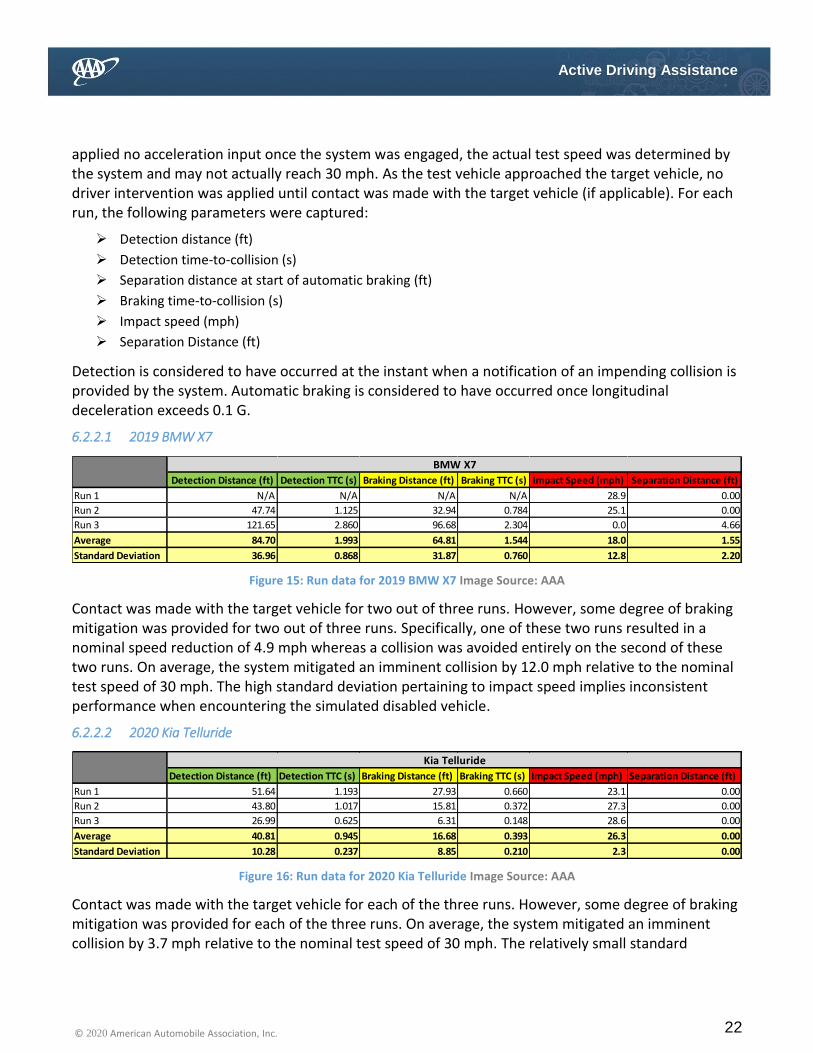
applied no acceleration input once the system was engaged, the actual test speed was determined by the system and may not actually reach 30 mph. As the test vehicle approached the target vehicle, no driver intervention was applied until contact was made with the target vehicle (if applicable). For each run, the following parameters were captured:
Detection distance (ft)
Detection time-to-collision (s)
Separation distance at start of automatic braking (ft)
Braking time-to-collision (s)
Impact speed (mph)
Separation Distance (ft)
Detection is considered to have occurred at the instant when a notification of an impending collision is provided by the system. Automatic braking is considered to have occurred once longitudinal deceleration exceeds 0.1 G.
6.2.2.1 2019 BMW X7
Figure 15: Run data for 2019 BMW X7 Image Source: AAA
Contact was made with the target vehicle for two out of three runs. However, some degree of braking mitigation was provided for two out of three runs. Specifically, one of these two runs resulted in a nominal speed reduction of 4.9 mph whereas a collision was avoided entirely on the second of these two runs. On average, the system mitigated an imminent collision by 12.0 mph relative to the nominal test speed of 30 mph. The high standard deviation pertaining to impact speed implies inconsistent performance when encountering the simulated disabled vehicle.
6.2.2.2 2020 Kia Telluride
Figure 16: Run data for 2020 Kia Telluride Image Source: AAA
Contact was made with the target vehicle for each of the three runs. However, some degree of braking mitigation was provided for each of the three runs. On average, the system mitigated an imminent collision by 3.7 mph relative to the nominal test speed of 30 mph. The relatively small standard
Detection Distance (ft) Detection TTC (s) Braking Distance (ft) Braking TTC (s) Impact Speed (mph) Separation Distance (ft)
Run 1 N/A N/A N/A N/A 28.9 0.00
Run 2 47.74 1.125 32.94 0.784 25.1 0.00
Run 3 121.65 2.860 96.68 2.304 0.0 4.66
Average 84.70 1.993 64.81 1.544 18.0 1.55
Standard Deviation 36.96 0.868 31.87 0.760 12.8 2.20
BMW X7
Detection Distance (ft) Detection TTC (s) Braking Distance (ft) Braking TTC (s) Impact Speed (mph) Separation Distance (ft)
Run 1 51.64 1.193 27.93 0.660 23.1 0.00
Run 2 43.80 1.017 15.81 0.372 27.3 0.00
Run 3 26.99 0.625 6.31 0.148 28.6 0.00
Average 40.81 0.945 16.68 0.393 26.3 0.00
Standard Deviation 10.28 0.237 8.85 0.210 2.3 0.00
Kia Telluride

23 © 2020 American Automobile Association, Inc.
Active Driving Assistance
deviation pertaining to impact speed indicates consistent performance in terms of not significantly reacting to the simulated disabled vehicle.
6.2.2.3 2020 Subaru Outlook
Figure 17: Run data for 2020 Subaru Outback Image Source: AAA
Contact was made with the target vehicle for one out of three runs. Braking mitigation was provided for each of the three runs. On average, the system mitigated an imminent collision by 25.2 mph relative to the nominal test speed of 30 mph. For the run where impact occurred, a nominal speed reduction of 15.6 mph was observed. While this is a significant mitigation, the final impact speed is not trivial.
6.2.2.4 Summary of Test Results
Figure 18: Average test vehicle detection distance and TTC Image Source: AAA
At 20 mph, each test vehicle provided notification of an imminent collision for a combined eight out of nine runs. Two out of three test vehicles completely avoided a collision with the target vehicle for at least one of three runs. However, for all nine test runs conducted in aggregate, a collision occurred 66 percent of the time.
Detection Distance (ft) Detection TTC (s) Braking Distance (ft) Braking TTC (s) Impact Speed (mph) Separation Distance (ft)
Run 1 97.30 2.244 85.65 1.999 0.0 2.64
Run 2 107.94 2.447 90.81 2.091 0.0 2.14
Run 3 58.28 1.322 45.11 1.034 14.4 0.00
Average 87.84 2.004 73.86 1.708 4.8 1.59
Standard Deviation 21.35 0.490 20.44 0.478 6.8 1.14
Subaru Outback

24 © 2020 American Automobile Association, Inc.
Active Driving Assistance
Figure 19: Average test vehicle braking distance and TTC Image Source: AAA
Figure 20: Average test vehicle impact speed and separation distance Image Source: AAA

25 © 2020 American Automobile Association, Inc.
Active Driving Assistance
In a majority of cases, notification did not necessarily translate to collision avoidance. Specifically, while collision notification was provided for eight out of nine test runs in aggregate, a collision was avoided for only three out of nine runs. For collisions that occurred, the average impact and mitigation speed was 24.6 mph and 5.4 mph, respectively. It is also important to note for each test vehicle, performance varied significantly between the three test runs. Specifically, each test vehicle demonstrated some degree of inconsistency in terms of both detection and braking distance from run to run. Most importantly, each test vehicle impacted the target vehicle at least once. This illustrates that tested ADA systems cannot be trusted to consistently react to stopped vehicles either within or alongside the roadway. As such, drivers must maintain awareness of their surroundings and control of the vehicle at all times.
6.2.3 Traffic Jam Assistance
Previous AAA research found evaluated ADA systems performed well during naturalistic stop-and-go traffic. To build upon this work, stop-and-go traffic was simulated in order to evaluate system performance for various deceleration rates of a lead vehicle. The low-profile robotic vehicle (LPRV) was utilized as a dynamic platform for the DRI Soft Car 360® which acted as a surrogate lead vehicle.
The testing lane previously described in Section 4.2 was utilized for testing. At the start of each test run, the test vehicle was maneuvered approximately ten feet behind the lead vehicle at which time the ADA system was enabled at a set speed of 30 mph. Approximately fifteen seconds after the ADA system was enabled, the lead vehicle began to accelerate with an average nominal acceleration of 0.11 G along the testing lane to a steady-state speed of 30 mph. The ADA system within each test vehicle was allowed to follow the lead vehicle with no driver applied acceleration. As a result, the final test vehicle speed may not be exactly 30 mph.
Hands were placed on the steering wheel and minimal steering input was applied if requested by the system. Five seconds after both vehicles reached steady-state speed, the lead vehicle initiated deceleration at the evaluated rates defined below. The average nominal deceleration was achieved within 0.5 seconds of initiation and was maintained until the lead vehicle came to a complete stop or test vehicle impact, whichever occurred first. Driver intervention was not provided at any point until the test vehicle came to a complete stop or the test vehicle made contact with the lead vehicle, whichever occurred first. For the test to be valid, the lead vehicle was required to remain within the test lane until coming to a complete stop.
Nominal deceleration rates of 0.30 G, 0.45 G and 0.60 G were evaluated in progressing order. Three runs for each deceleration rate were performed. Throughout each run, lead vehicle kinematics were recorded. Additionally, the following test vehicle parameters were calculated:
Following distance
Separation distance/time-to-collision at start of braking
Speed differential at start of braking
Average deceleration (averaged once longitudinal deceleration reached 0.1 G until the vehicle came to a
complete stop)
Maximum instantaneous deceleration

26 © 2020 American Automobile Association, Inc.
Active Driving Assistance
Final separation distance
Characteristic test vehicle deceleration profiles associated with each lead vehicle deceleration rate are provided in following sections for additional discussion.
6.2.3.1 2019 BMW X7
Figure 21: Run data for 2019 BMW X7 Image Source: AAA
No contact was made with the lead vehicle during any test run, regardless of lead vehicle deceleration rate.
Figure 22: 2019 BMW X7 characteristic deceleration profile (0.30 G lead vehicle deceleration) Image Source: AAA
Following Distance (ft) Braking Distance (ft) Speed Differential at Start of Braking (mph) Braking TTC (s) Average Deceleration (G) Max Deceleration (G) Final Separation Distance (ft)
Run 1 107.44 97.16 11.0 5.994 0.230 0.411 3.21
Run 2 92.78 82.61 15.0 5.510 0.282 0.455 2.51
Run 3 72.62 65.68 8.3 5.367 0.299 0.478 1.62
Average 90.95 81.82 11.4 5.624 0.270 0.448 2.45
Standard Deviation 14.27 12.86 2.8 0.268 0.029 0.028 0.65
Run 1 97.72 82.14 15.3 3.656 0.328 0.464 3.08
Run 2 94.53 78.84 14.2 3.761 0.337 0.497 3.47
Run 3 88.23 73.40 14.7 3.388 0.409 0.940 1.44
Average 93.49 78.13 14.7 3.602 0.358 0.634 2.66
Standard Deviation 3.94 3.60 0.4 0.157 0.036 0.217 0.88
Run 1 93.43 76.87 17.2 3.056 0.430 1.251 2.80
Run 2 92.42 73.41 18.1 2.748 0.485 1.317 4.82
Run 3 89.14 70.80 17.8 2.712 0.469 1.204 2.54
Average 91.66 73.69 17.7 2.839 0.461 1.257 3.39
Standard Deviation 1.83 2.49 0.4 0.154 0.023 0.046 1.02
0.30 G
0.45 G
0.60 G
BMW X7

27 © 2020 American Automobile Association, Inc.
Active Driving Assistance
Figure 23: 2019 BMW X7 characteristic deceleration profile (0.45 G lead vehicle deceleration) Image Source: AAA
Figure 24: 2019 BMW X7 characteristic deceleration profile (0.60 G lead vehicle deceleration) Image Source: AAA
Figures 22-24 illustrate the deceleration profiles associated with each lead vehicle deceleration rate. At 0.30 G, the system decelerated smoothly as shown by the mostly linear rate of deceleration with a

28 © 2020 American Automobile Association, Inc.
Active Driving Assistance
maximum of roughly 0.45 G. At lead vehicle deceleration rates of 0.45 G and 0.60 G, the system exhibits a stepwise deceleration profile where the rate shortly plateaus at roughly 0.35 G before increasing sharply to approximately 0.50 G and 1.20 G for lead vehicle deceleration rates of 0.45 G and 0.60 G, respectively. These significant deceleration rates were largely maintained until the vehicle came to stop. As a result, stops were noticeably abrupt and non-linear relative to the lead vehicle deceleration rate of 0.30 G.
6.2.3.2 2020 Kia Telluride
Figure 25: Run data for 2020 Kia Telluride Image Source: AAA
No contact was made with the lead vehicle during any test run, regardless of lead vehicle deceleration rate.
Following Distance (ft) Braking Distance (ft) Speed Differential at Start of Braking (mph) Braking TTC (s) Average Deceleration (G) Max Deceleration (G) Final Separation Distance (ft)
Run 1 117.92 99.96 14.9 4.548 0.126 0.392 16.65
Run 2 109.06 94.44 14.3 4.510 0.130 0.378 7.45
Run 3 124.02 100.17 17.2 3.960 0.150 0.417 6.29
Average 117.00 98.19 15.5 4.339 0.135 0.396 10.13
Standard Deviation 6.14 2.65 1.2 0.269 0.010 0.016 4.63
Run 1 99.92 86.96 14.2 4.185 0.146 0.533 11.82
Run 2 116.75 99.07 16.0 4.212 0.165 0.478 12.33
Run 3 117.80 102.56 18.1 3.855 0.206 0.508 13.51
Average 111.49 96.20 16.1 4.084 0.172 0.506 12.55
Standard Deviation 8.19 6.68 1.6 0.162 0.025 0.022 0.71
Run 1 119.84 78.43 29.3 1.825 0.309 0.538 6.29
Run 2 120.71 88.52 25.5 2.360 0.314 0.493 8.14
Run 3 119.88 102.36 18.5 3.774 0.256 0.515 9.19
Average 120.14 89.77 24.4 2.653 0.293 0.515 7.87
Standard Deviation 0.40 9.81 4.5 0.822 0.026 0.018 1.20
Kia Telluride
0.45 G
0.30 G
0.60 G
29 © 2020 American Automobile Association, Inc.
Active Driving Assistance
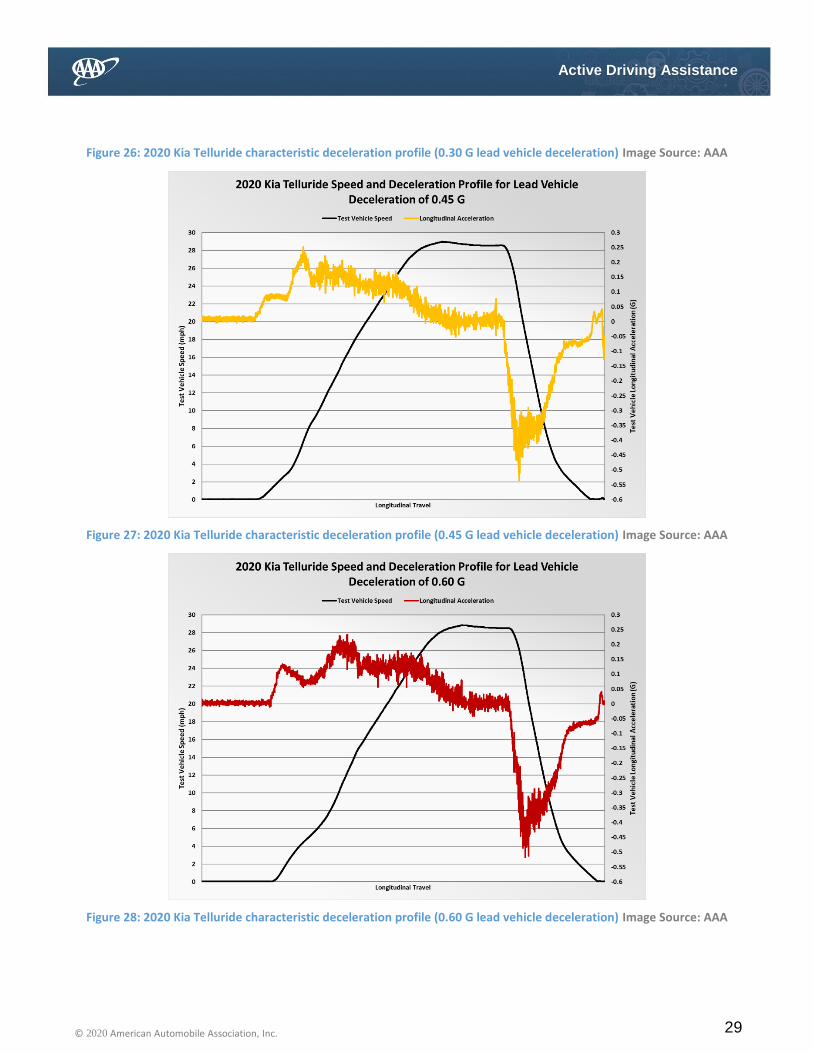
Figure 26: 2020 Kia Telluride characteristic deceleration profile (0.30 G lead vehicle deceleration) Image Source: AAA
Figure 27: 2020 Kia Telluride characteristic deceleration profile (0.45 G lead vehicle deceleration) Image Source: AAA
Figure 28: 2020 Kia Telluride characteristic deceleration profile (0.60 G lead vehicle deceleration) Image Source: AAA

30 © 2020 American Automobile Association, Inc.
Active Driving Assistance
Figures 26-28 illustrate characteristic deceleration profiles associated with each lead vehicle deceleration rate. All deceleration profiles exhibit similar characteristics including a linearly increasing deceleration rate to a plateau between 0.35 G to 0.40 G. After the rate plateaus, the deceleration rate gradually decreases as the vehicle comes to a stop. At 0.30 G, the vehicle creeped forward momentarily before coming to a complete stop. Regardless of lead vehicle deceleration rate, stops were noticeably smooth relative to other test vehicles.
6.2.3.3 2020 Subaru Outback
Figure 29: Run data for 2020 Subaru Outback Image Source: AAA
No contact was made with the lead vehicle during any test run, regardless of lead vehicle deceleration rate.
Following Distance (ft) Braking Distance (ft) Speed Differential at Start of Braking (mph) Braking TTC (s) Average Deceleration (G) Max Deceleration (G) Final Separation Distance (ft)
Run 1 78.53 71.73 7.7 6.373 0.204 0.425 9.50
Run 2 85.34 76.02 9.0 5.755 0.178 0.473 7.48
Run 3 87.13 79.16 8.6 6.296 0.171 0.422 8.96
Average 83.67 75.64 8.4 6.141 0.184 0.440 8.65
Standard Deviation 3.70 3.05 0.5 0.275 0.014 0.023 0.85
Run 1 89.95 78.80 12.3 4.344 0.231 0.479 6.13
Run 2 85.96 73.97 12.5 4.043 0.327 0.499 3.04
Run 3 87.03 75.38 12.4 4.128 0.323 0.508 7.72
Average 87.65 76.05 12.4 4.172 0.294 0.495 5.63
Standard Deviation 1.69 2.03 0.1 0.127 0.044 0.012 1.94
Run 1 87.41 70.91 17.0 2.852 0.482 1.010 2.62
Run 2 85.39 70.59 15.9 3.017 0.428 0.987 2.35
Run 3 83.99 68.12 16.4 2.824 0.440 1.056 2.09
Average 85.60 69.87 16.4 2.898 0.450 1.018 2.35
Standard Deviation 1.40 1.25 0.4 0.085 0.023 0.029 0.22
0.45 G
0.60 G
Subaru Outback
0.30 G

31 © 2020 American Automobile Association, Inc.
Active Driving Assistance
Figure 30: 2020 Subaru Outlook characteristic deceleration profile (0.30 G lead vehicle deceleration) Image Source: AAA
Figure 31: 2020 Subaru Outlook characteristic deceleration profile (0.45 G lead vehicle deceleration) Image Source: AAA
Figure 32: 2020 Subaru Outlook characteristic deceleration profile (0.60 G lead vehicle deceleration) Image Source: AAA

32 © 2020 American Automobile Association, Inc.
Active Driving Assistance
Figures 30-32 illustrate characteristic deceleration profiles associated with each lead vehicle deceleration rate. At 0.30 G and 0.45 G, the system decelerated with a linearly increasing rate and plateaued approximately between 0.40 G to 0.45 G before linearly decreasing until the vehicle was almost stopped. At this point, the vehicle creeped forward slightly before coming to a complete stop. At 0.60 G, the system exhibited a multi stepwise deceleration profile with brief plateaus at 0.40 G and 0.65 G before increasing to a maximum at approximately 1.00 G. This maximum rate was maintained until the vehicle came to a stop, resulting in a noticeably abrupt stop.
6.2.3.4 Summary of Test Results
Figure 33: Average test vehicle following distance Image Source: AAA
Figure 33 illustrates for each test vehicle, differences in following distance with respect to lead vehicle deceleration were not significant. This is an expected result; the only parameter that is anticipated to influence following distance is vehicle speed. For all runs, the test vehicle nominal speed was kept constant at 30 mph.

33 © 2020 American Automobile Association, Inc.
Active Driving Assistance
Figure 34: Average separation distance at start of braking Image Source: AAA
Figure 35: Average test vehicle TTC at start of braking Image Source: AAA
For two out of three test vehicles, the average separation distance at the start of braking slightly decreased as the lead vehicle deceleration rate increased. As a result of decreased separation distance

34 © 2020 American Automobile Association, Inc.
Active Driving Assistance
and increased lead vehicle deceleration, the time-to-collision consequently decreased as the lead vehicle deceleration rate increased.
Figure 36: Average test vehicle deceleration Image Source: AAA
Figure 37: Averaged maximum instantaneous test vehicle deceleration Image Source: AAA
35 © 2020 American Automobile Association, Inc.
Active Driving Assistance
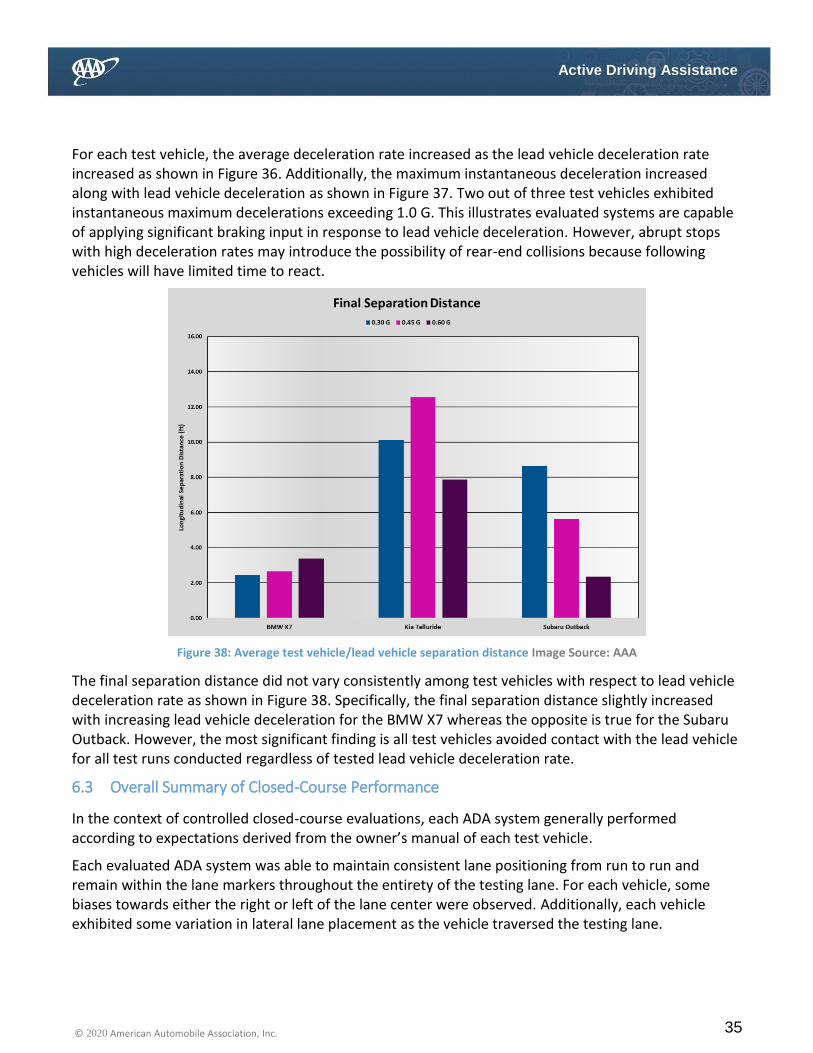
For each test vehicle, the average deceleration rate increased as the lead vehicle deceleration rate increased as shown in Figure 36. Additionally, the maximum instantaneous deceleration increased along with lead vehicle deceleration as shown in Figure 37. Two out of three test vehicles exhibited instantaneous maximum decelerations exceeding 1.0 G. This illustrates evaluated systems are capable of applying significant braking input in response to lead vehicle deceleration. However, abrupt stops with high deceleration rates may introduce the possibility of rear-end collisions because following vehicles will have limited time to react.
Figure 38: Average test vehicle/lead vehicle separation distance Image Source: AAA
The final separation distance did not vary consistently among test vehicles with respect to lead vehicle deceleration rate as shown in Figure 38. Specifically, the final separation distance slightly increased with increasing lead vehicle deceleration for the BMW X7 whereas the opposite is true for the Subaru Outback. However, the most significant finding is all test vehicles avoided contact with the lead vehicle for all test runs conducted regardless of tested lead vehicle deceleration rate.
6.3 Overall Summary of Closed-Course Performance
In the context of controlled closed-course evaluations, each ADA system generally performed according to expectations derived from the owner’s manual of each test vehicle.
Each evaluated ADA system was able to maintain consistent lane positioning from run to run and remain within the lane markers throughout the entirety of the testing lane. For each vehicle, some biases towards either the right or left of the lane center were observed. Additionally, each vehicle exhibited some variation in lateral lane placement as the vehicle traversed the testing lane.

36 © 2020 American Automobile Association, Inc.
Active Driving Assistance
When encountering a simulated disabled vehicle placed halfway within the testing lane in the lateral direction, all test vehicles made contact for at least one out of three test runs. In aggregate, a collision occurred 66 percent of the time. For collisions that occurred, the average impact and mitigation speed was 24.6 mph and 5.4 mph, respectively.
In a simulated stop-and-go scenario, each evaluated ADA system made no contact with the lead vehicle during any test run, for lead vehicle deceleration rates up to and including 0.60G. This indicates good longitudinal performance in the context of deceleration rates typically observed in the naturalistic environment.
While systems generally performed according to expectations, closed-course evaluation illustrated all systems are incapable of consistently reacting to a scenario of a disabled vehicle partially within the roadway. All available ADA systems are not capable of sustained operation without constant driver supervision. Drivers must be prepared to intervene anytime ADA systems are engaged.
7 Inquiry 2: How do vehicles equipped with ADA systems perform during naturalistic
highway driving?
7.1 Objective
Evaluate test vehicles in naturalistic highway environments to determine how ADA systems influence the driving experience.
7.2 Methodology
Each test vehicle was evaluated on U.S Highway 101 and Interstate 5 between the greater Los Angeles and San Francisco metropolitan areas. Specifically, U.S Highway 101 was traveled from Los Angeles to San Francisco and Interstate 5 was traveled from San Francisco to Los Angeles. Additionally, a section of Interstate 680 was traversed to arrive at the testing destination from Highway 101; this interstate along with Interstate 580 was also utilized to access Interstate 5 from the San Francisco area. These highways were utilized for evaluation because both routes are representative of the design domain for tested ADA systems. Generally, roadways were well maintained with well-defined lane markers and consistent lane width. However, utilized roadways also contained sections of road work resulting in lane closures, missing or inconsistent lane markers and/or uneven pavement. In particular, significant wear and faded lane markers were observed on sections of Interstate 5.
Throughout the route, U.S Highway 101 consisted of a four-lane divided highway with varying speed limits between 35 mph through populated areas up to 65 mph in rural areas. Additionally, some sections were significantly curved both along the coast and through hilly inland areas. Approximately 430 miles were traversed on this route.
Interstate 5 is a limited access expressway with a speed limit of 70 mph throughout a majority of the route. The majority of Interstate 5 utilized for evaluation consisted of long, straight sections with unrestricted sightlines outside urban areas. Approximately 370 miles were traversed on this route.
37 © 2020 American Automobile Association, Inc.
Active Driving Assistance
To ensure conditions were as consistent as possible for each test vehicle, all vehicles were instrumented and driven along the route simultaneously with ADA systems engaged. To prevent ADA systems from influencing each other, a separation distance of several miles was maintained between all test vehicles. A total of six test drivers were utilized for naturalistic evaluations; both routes were sectioned into approximately equal sections in which drivers would switch vehicles. Drivers spent an approximately equal time behind the wheel of each test vehicle to minimize driver variation between evaluated ADA systems. Immediately after the conclusion of each segment, drivers filled out a subjective feedback form recording their impressions of the ADA system. Specifically, questions relating to the following were included:
Forward Collison Warning timing
Lane Departure Warning timing
Comfort of Adaptive Cruise Control braking and acceleration
Lane keeping corrections
Awareness of system engagement/disengagement
Understanding of warnings
Tendency of lane placement
Ease and enjoyment of ADA system use
Overall trust of ADA system
Additional comments
Super Cruise™ within the 2019 Cadillac CT6 is technically considered a SAE J3016 Level 2 system. However, it is inherently distinct from other evaluated ADA systems due to its restriction to LIDAR mapped highways and interstates. Additionally, the system specifically allows hands free operation during engagement.
For every significant event related to system operation, a bookmark was placed within the data file to mark the event for post-processing. Examples of significant events include but are not limited to:
Lane departures
Erratic lane positioning
Inadequate braking
Unexpected speed fluctuations
Inappropriate following distance
Instances of unexpected system disengagement, failure to engage/re-engage and other unexpected and/or undesired behavior were also marked for post-processing. For each marked event, roadway, GPS location, event type, vehicle speed, longitudinal/lateral acceleration and event comments were recorded. For each vehicle, a table with this information is provided in the Appendix.
Despite best efforts to ensure consistent environmental conditions and driver profiles for each test vehicle, strict quantitative comparison of naturalistic performance between evaluated ADA systems is not possible within the scope of this work for two primary reasons. Driver risk tolerance and event sensitivity is a factor during naturalistic evaluations; specifically, each test driver varied in terms of how
38 © 2020 American Automobile Association, Inc.
Active Driving Assistance
much they would allow the system to perform poorly before intervening. For example, one driver may allow a vehicle an opportunity to correct erratic lane positioning whereas another driver might immediately intervene. Driver risk tolerance is also likely to vary for the same individual depending on the specific situation. In this context, erratic lane positioning describes weaving or “ping-ponging” within the travel lane or lateral lane positioning significantly off-center.
Additionally, drivers varied in terms of what he/she considered a noteworthy event. Regardless of drivers spending an approximately equal time in each test vehicle, differences in traffic, road condition, lighting, sun angle, etc. along the route will invariably present differing environmental conditions as each driver pilots each test vehicle.
7.3 Results and Observations
For each vehicle, subjective ratings are provided in the Appendix.
7.3.1 2019 BMW X7
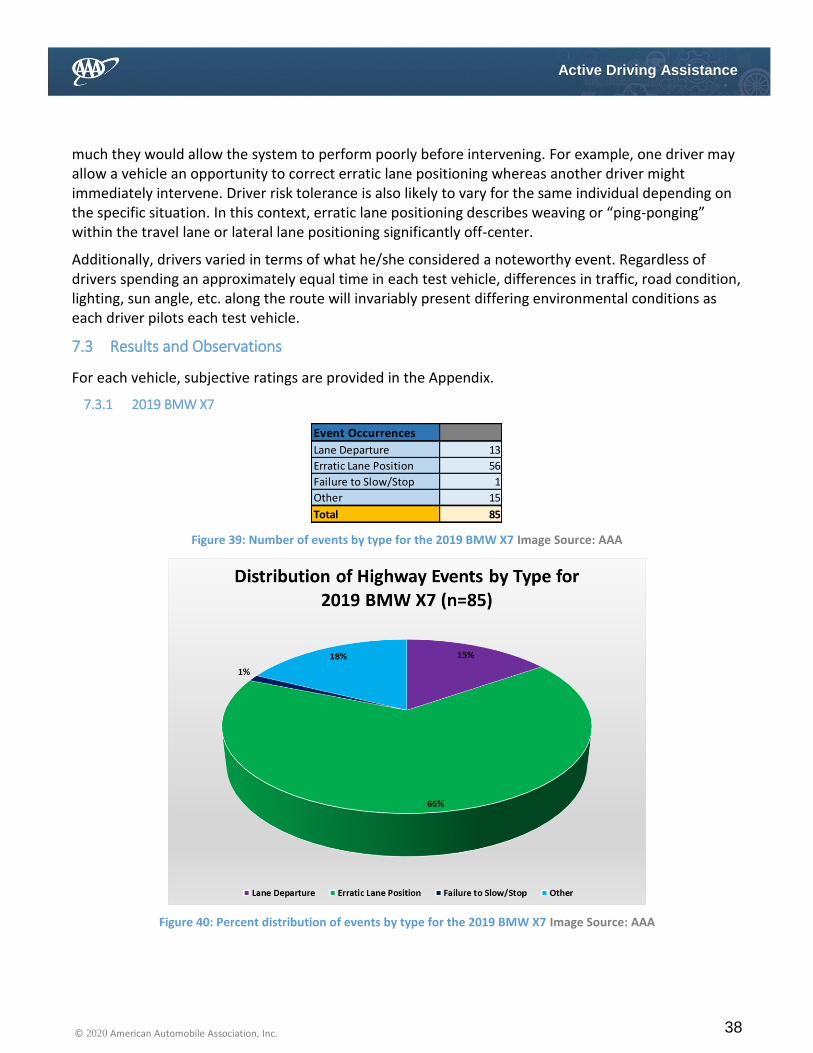
Figure 39: Number of events by type for the 2019 BMW X7 Image Source: AAA
Figure 40: Percent distribution of events by type for the 2019 BMW X7 Image Source: AAA
Event Occurrences
Lane Departure 13
Erratic Lane Position 56
Failure to Slow/Stop 1
Other 15
Total 85

39 © 2020 American Automobile Association, Inc.
Active Driving Assistance
Figures 39 and 40 illustrate the total number and distribution of each event type observed during naturalistic evaluation. In total, approximately 800 miles were traversed; this translates into roughly one event every 9 miles for the roadways traveled.
Sixty-six percent of events were classified as erratic lane positioning and an additional 15 percent of events were classified as lane departures. In total, 81 percent of noted events pertained to the lane keeping functionality of the BMW’s Active Driving Assistant Professional system. Despite this finding, some test drivers noted good general performance in slight and moderate curves. Most test drivers also felt the system performed well during periods of light highway traffic and stop-and-go traffic.
All test drivers commented the system would require frequent steering input; this characteristic is notable because of its potential to limit driver distraction. However, the system frequently requested hands to be placed on the steering wheel when the driver was already holding the wheel. To keep the system engaged, drivers were repeatedly required to provide unnecessary steering input. This occurred with enough frequency to significantly detract from the driving experience in some cases.
Figure 41 tabulates some general observations of the Active Driving Assistant Professional system as noted by test drivers. In aggregate, all test drivers noted relatively few complete lane departure events and good performance within curved sections of roadway. Additionally, the adaptive cruise component was noted to accelerate in a responsive manner within heavy traffic; this can be beneficial because of the tendency of other drivers to “cut off” vehicles that accelerate slowly relative to traffic flow.
Figure 41: Common observations for the 2019 BMW X7 Image Source: AAA
In addition to the sensitivity of the system in terms of requested steering input, some test drivers noted instances of unexpected system disengagement. These disengagements sometimes resulted in a lane departure with no auxiliary lane keeping assistance. Overall, test drivers were aware of system status with unambiguous colored icons.
System Observations
Few lane departure events
Lane centering component very good with curvy roads
System accelerates well especially in traffic with system on closest setting
Too sensitive with steering requests for hands to be on wheel
Sometimes system disengages for no reason, throwing vehicle out of lane, there was no lane keep assist from vehicle
ACC system is sensitive, not a natual feeling
System fought user with steering wheel, stiff steering due to lane centering causing resistance
Vehicle maintains center but with lots of hunting in the lane, turns off when turn signal goes on
System would repeatedly ask for hands on steering wheel when they already were, to the point where it would significantly detract from the experience
Overall, very good with lane centering with only a few exceptions on curved roadways.
Clear "head-up display" with clear system "ON" indicators
Head-up display was invisible most of drive (sun to left and polarized sunglasses)
40 © 2020 American Automobile Association, Inc.
Active Driving Assistance
7.3.2 2019 Cadillac CT6
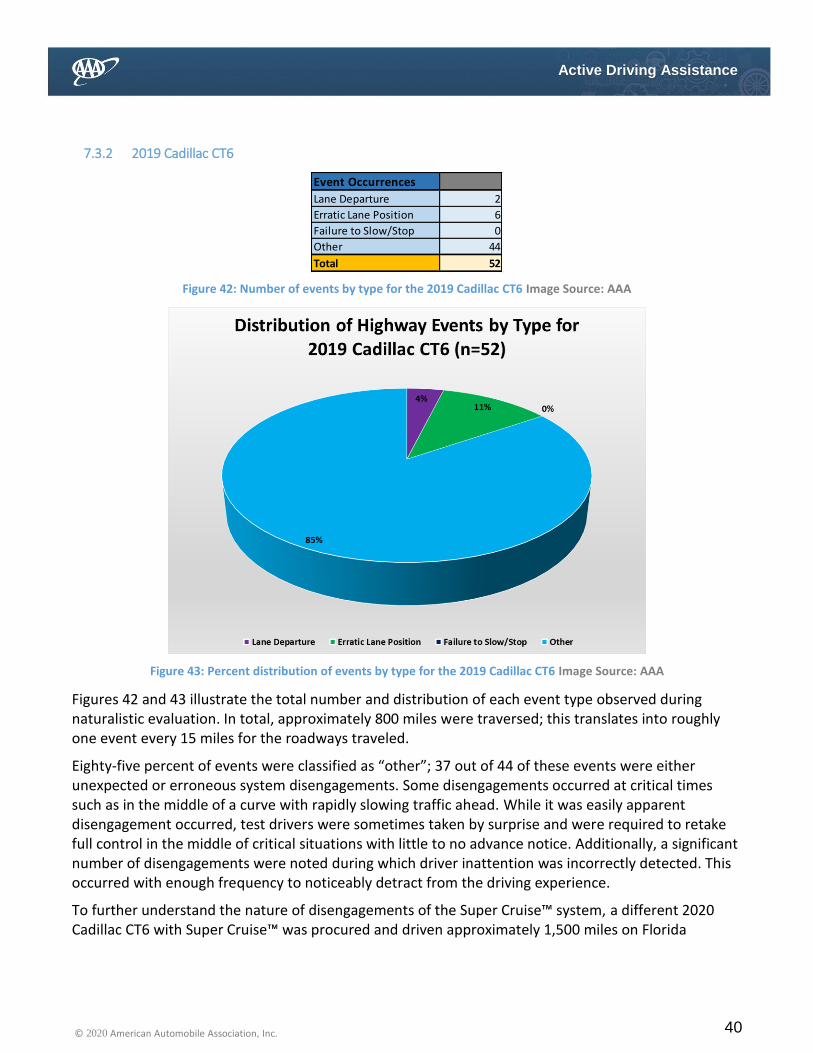
Figure 42: Number of events by type for the 2019 Cadillac CT6 Image Source: AAA
Figure 43: Percent distribution of events by type for the 2019 Cadillac CT6 Image Source: AAA
Figures 42 and 43 illustrate the total number and distribution of each event type observed during naturalistic evaluation. In total, approximately 800 miles were traversed; this translates into roughly one event every 15 miles for the roadways traveled.
Eighty-five percent of events were classified as “other”; 37 out of 44 of these events were either unexpected or erroneous system disengagements. Some disengagements occurred at critical times such as in the middle of a curve with rapidly slowing traffic ahead. While it was easily apparent disengagement occurred, test drivers were sometimes taken by surprise and were required to retake full control in the middle of critical situations with little to no advance notice. Additionally, a significant number of disengagements were noted during which driver inattention was incorrectly detected. This occurred with enough frequency to noticeably detract from the driving experience.
To further understand the nature of disengagements of the Super Cruise™ system, a different 2020 Cadillac CT6 with Super Cruise™ was procured and driven approximately 1,500 miles on Florida
Event Occurrences
Lane Departure 2
Erratic Lane Position 6
Failure to Slow/Stop 0
Other 44
Total 52
41 © 2020 American Automobile Association, Inc.
Active Driving Assistance
interstates with the system engaged. To maintain consistency in terms of event counting relative to other test vehicles, events noted during this evaluation were not included in Figures 42 and 43.
During this subsequent evaluation, it was noted that system disengagements upon approaching work zones or areas where no mapping information was available were characteristically abrupt. For this particular scenario, the system did not entirely disengage but quickly began slowing the vehicle down while simultaneously vibrating the driver’s seat and muting the audio system with verbal instructions to retake control.
This process of system disengagement would benefit by notifying the driver that the system is approaching an area where a complete handover of vehicle control is necessary. Based on current understanding of human reengagement time and variations due to cognitive load, degree of disengagement, age, driver condition (i.e. drowsiness, impairment, illness) and environmental factors, a minimum of twenty seconds between initial notification and required driver takeover is ideal [5]. An additional factor behind this recommendation relates to the unique characteristic of the Super Cruise™ system to allow hands-free driving.
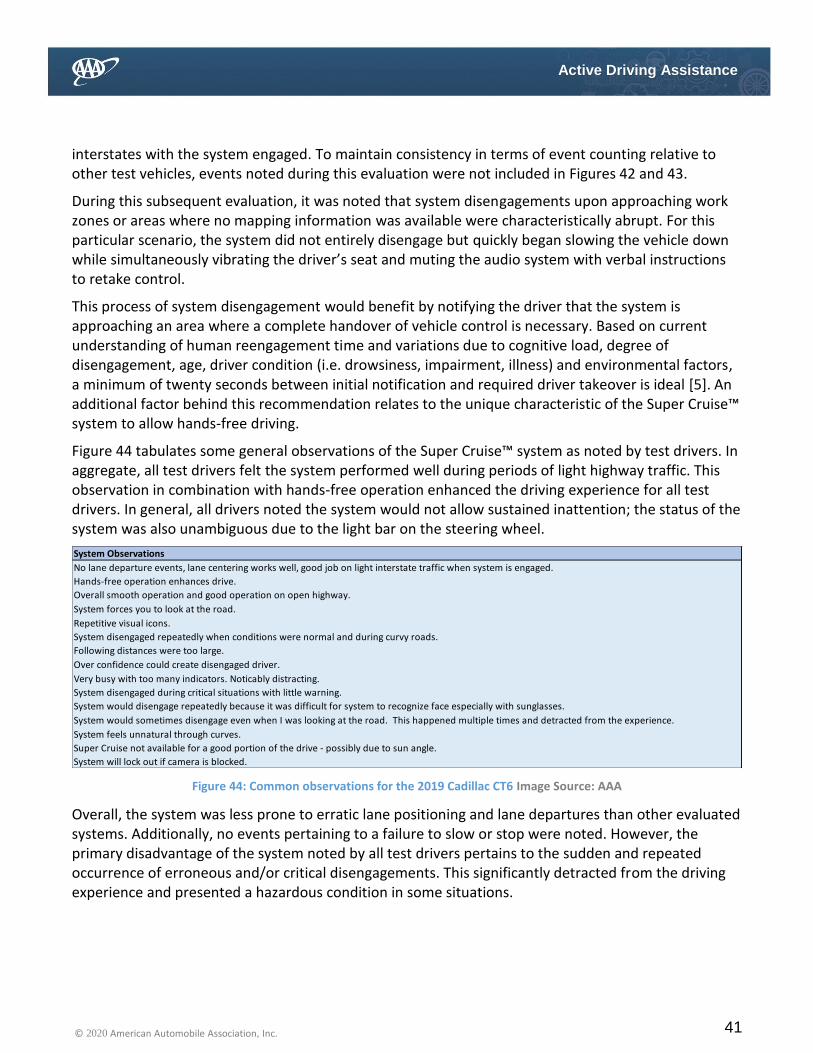
Figure 44 tabulates some general observations of the Super Cruise™ system as noted by test drivers. In aggregate, all test drivers felt the system performed well during periods of light highway traffic. This observation in combination with hands-free operation enhanced the driving experience for all test drivers. In general, all drivers noted the system would not allow sustained inattention; the status of the system was also unambiguous due to the light bar on the steering wheel.
Figure 44: Common observations for the 2019 Cadillac CT6 Image Source: AAA
Overall, the system was less prone to erratic lane positioning and lane departures than other evaluated systems. Additionally, no events pertaining to a failure to slow or stop were noted. However, the primary disadvantage of the system noted by all test drivers pertains to the sudden and repeated occurrence of erroneous and/or critical disengagements. This significantly detracted from the driving experience and presented a hazardous condition in some situations.
System Observations
No lane departure events, lane centering works well, good job on light interstate traffic when system is engaged.
Hands-free operation enhances drive.
Overall smooth operation and good operation on open highway.
System forces you to look at the road.
Repetitive visual icons.
System disengaged repeatedly when conditions were normal and during curvy roads.
Following distances were too large.
Over confidence could create disengaged driver.
Very busy with too many indicators. Noticably distracting.
System disengaged during critical situations with little warning.
System would disengage repeatedly because it was difficult for system to recognize face especially with sunglasses.
System would sometimes disengage even when I was looking at the road. This happened multiple times and detracted from the experience.
System feels unnatural through curves.
Super Cruise not available for a good portion of the drive - possibly due to sun angle.
System will lock out if camera is blocked.

42 © 2020 American Automobile Association, Inc.
Active Driving Assistance
7.3.3 2019 Ford Edge
Figure 45: Number of events by type for the 2019 Ford Edge Image Source: AAA
Figure 46: Percent distribution of events by type for the 2019 Ford Edge Image Source: AAA
Figures 45 and 46 illustrate the total number and distribution of each event type observed during naturalistic evaluation. In total, approximately 800 miles were traversed; this translates into roughly one event every 5 miles for the roadways traveled.
Fifty percent of events were classified as erratic lane positioning and an additional 38 percent of events were classified as lane departures. In total, 88 percent of noted events pertained to the lane keeping functionality of the Ford Co-Pilot 360™ system. Both the percent distribution of lane keeping related events and the frequency of occurrence relative to other test vehicles caused general distrust of the system by all test drivers. As a result, the majority of test drivers felt the lane keeping functionality did not enhance the driving experience in most environments; in some cases, test drivers felt the functionality was instead a detriment.
Figure 47 tabulates some general observations of the Ford Co-Pilot 360™ system as noted by test drivers. In aggregate, the system was observed to perform well in terms of longitudinal control (adaptive cruise functionality). However, it was noted the system frequently favored the left side of the
Event Occurrences
Lane Departure 65
Erratic Lane Position 86
Failure to Slow/Stop 1
Other 20
Total 172

43 © 2020 American Automobile Association, Inc.
Active Driving Assistance
lane and had trouble with certain lane marker types. Additionally, it was noted the system either would not engage or frequently disengage during periods of low vertical sun angle.
Figure 47: Common observations for the 2019 Ford Edge Image Source: AAA
In general, all test drivers noted good performance of the adaptive cruise functionality within the Ford Co-Pilot 360™ system. This performance was noted to enhance the driving experience within stop-and-go highway environments. Additionally, unexpected system disengagements did not occur with enough frequency to be problematic. However, the general lack of performance relative to lane keeping functionality significantly diminished the value of the system as a highway driving aid and sometimes added to the overall workload for the driver.
7.3.4 2020 Kia Telluride
Figure 48: Number of events by type for the 2020 Kia Telluride Image Source: AAA
System Observations
Adaptive cruise system performed well (acceleration and braking).
Unobstrusive and helpful.
System did not engage for significant part of the drive or would turn off.
Vehicle came too close to other vehicle and guardrails.
Poor system perfomance (e.g. would not hold lane or would keep vehicle towards left side of lane).
Over correction and late reaction by system in response to road conditions (e.g. late ACC deceleration).
User correction needed when vehicle departed lane.
System was significantly affected by sun angle.
Lane centering mostly kept vehicle towards left side of lane.
Mulitple issues with solid lane marker lines (both right and left), system would frequently cross over.
System did not instill trust within driver.
System would randomly steer.
Event Occurrences
Lane Departure 58
Erratic Lane Position 28
Failure to Slow/Stop 5
Other 18
Total 109

44 © 2020 American Automobile Association, Inc.
Active Driving Assistance
Figure 49: Percent distribution of events by type for the 2020 Kia Telluride Image Source: AAA
Figures 48 and 49 illustrate the total number and distribution of each event type observed during naturalistic evaluation. In total, approximately 800 miles were traversed; this translates into roughly one event every 7 miles for the roadways traveled.
Fifty-three percent of events were classified as lane departures with an additional 26 percent of events classified as erratic lane positioning. In total, 79 percent of noted events pertained to the lane keeping functionality of the Highway Driving Assist system. Additionally, all test drivers noted the system would allow a significant amount of time to elapse before requesting steering input. This represents a potentially hazardous combination; drivers may get lulled into a false sense of security during which a lane keeping event may occur unexpectedly.
Despite the distribution of lane keeping events, most test drivers felt the system complemented the driving experience during light freeway traffic and stop-and-go traffic.
Figure 50 tabulates some general observations of the Highway Driving Assist system as noted by test drivers. In aggregate, the system was observed to perform well in terms of both lateral and longitudinal control (adaptive cruise and lane-keeping functionality). However, it was noted the adaptive cruise functionality was prone to delayed acceleration and deceleration in response to the driving environment.

45 © 2020 American Automobile Association, Inc.
Active Driving Assistance
Figure 50: Common observations for the 2020 Kia Telluride Image Source: AAA
All test drivers shared a general consensus that changes in system status (i.e. disengagements) were sometimes easy to miss due to inconspicuous icons within the instrument cluster. When combined with the finding that the system would sometimes allow approximately two minutes to elapse without requesting steering input, it is possible drivers could be unaware of system disengagements for an extended period.
7.3.5 2020 Subaru Outback
Figure 51: Number of events by type for the 2020 Subaru Outback Image Source: AAA
System Observations
Good lane centering and adaptive cruise performance.
Audio/Visual alerts are clear and intuitive.
Dash symbols hard to read and understand.
System disengagement easy to miss.
Slow responses from adaptive cruise system (acceleration/deceleration).
System allows too much time (~2min) without hands on steering wheel.
False sense of security.
Event Occurrences
Lane Departure 35
Erratic Lane Position 30
Failure to Slow/Stop 0
Other 38
Total 103

46 © 2020 American Automobile Association, Inc.
Active Driving Assistance
Figure 52: Percent distribution of events by type for the 2020 Subaru Outback Image Source: AAA
Figures 51 and 52 illustrate the total number and distribution of each event type observed during naturalistic evaluation. In total, approximately 800 miles were traversed; this translates into roughly one event every 8 miles for the roadways traveled.
Thirty-four percent of noted events were classified as lane departures and an additional 29 percent of events related to erratic lane positioning. In total, 63 percent of events pertained to the lane-keeping functionality of the EyeSight® system. The remaining 37 percent of noted events were due to unanticipated system disengagement or a failure to engage.
All test drivers noted the inability of the system to consistently negotiate moderate curves; the system would either disengage upon approaching the curve or depart the lane before immediately disengaging. Interestingly, the system would frequently issue a lane departure warning while disengaging simultaneously. This implies while the system can recognize curved lane markers, the system is limited in terms of maximum steering input.
Figure 53 tabulates some general observations of the EyeSight® system as noted by test drivers. In aggregate, test drivers felt the EyeSight® system enhanced the driving experience in non-demanding environments such as straight roadways with light traffic. Additionally, strong performance of the adaptive cruise functionality was noted by all test drivers; no events pertaining to longitudinal control were noted during naturalistic evaluation. In particular, the system provided unambiguous confirmation that the lead vehicle was detected.
Primary disadvantages relate to the general inability of the system to negotiate moderate curves and frequent disengagement within this environment and within heavy traffic.
Figure 53: Common observations for the 2020 Subaru Outback Image Source: AAA
7.4 Overall Summary of Naturalistic Evaluation
In total, approximately 4,000 miles were traversed among five test vehicles. During naturalistic evaluation, 521 events were noted; this translates to approximately one event every 8 miles. In aggregate, 73 percent of noted events related to the lane-keeping functionality of the ADA system. The majority of events classified as “other” related to system disengagement or failure to engage. This finding is similar to earlier work in 2018 which observed 88 percent of events in the naturalistic setting
System Observations
Very seamless in non-challenging scenarios, worked relatively well in light traffic and gradual corners.
Easy to engage.
Adaptive Cruise worked well with good acceleration when re-engaging system.
Alerts clear.
Did not have to fight system for control.
Picks up vehicles entering/exiting lane very well.
System too sensitive in terms of asking/requesting hands on wheel when hands were already on wheel.
Incapable of handling curvy roadways.
Some beeps and lights were ambigious and too frequent.
System repeatedly disengaged in heavy traffic.
Noticable "ping-ponging" in curves.
Difficult to engage, hard to get to engage and stay engaged.
System was not capable in moderate curves and would either disengage or depart the lane.
Not very capable on curved roadways.
Long stretches where system did not engage
Lane departure visual is distracting in critical situations.
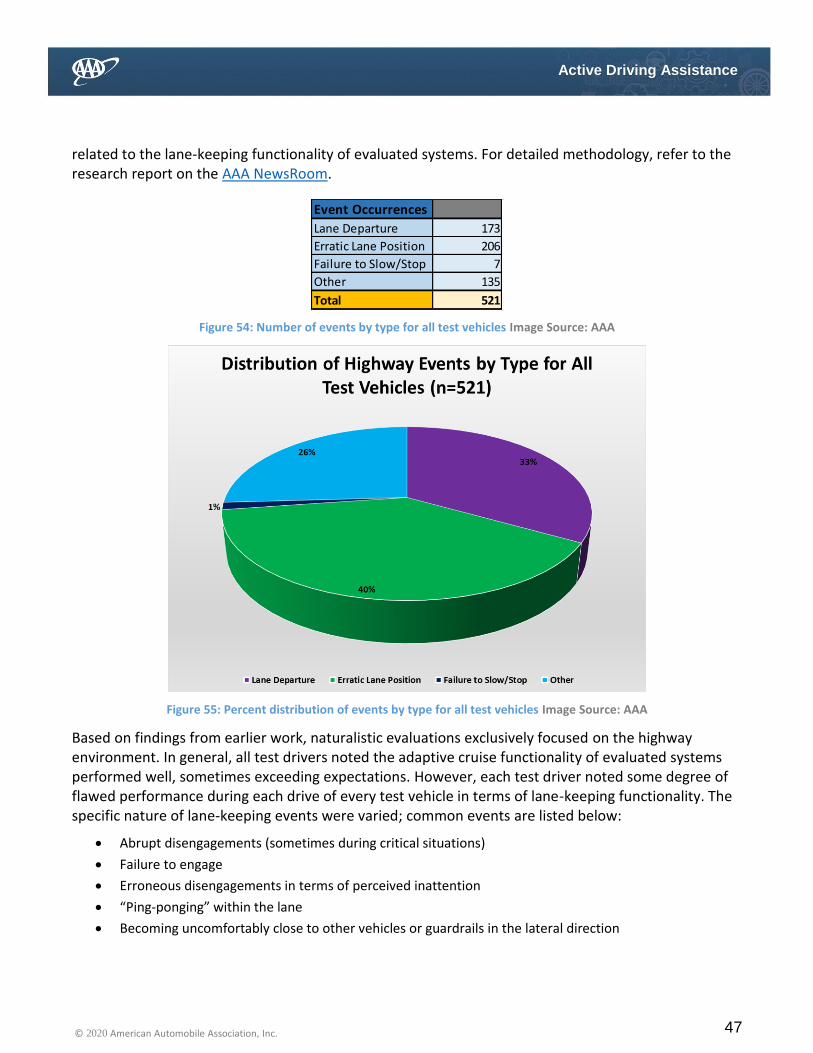
47 © 2020 American Automobile Association, Inc.
Active Driving Assistance
related to the lane-keeping functionality of evaluated systems. For detailed methodology, refer to the research report on the AAA NewsRoom.
Figure 54: Number of events by type for all test vehicles Image Source: AAA
Figure 55: Percent distribution of events by type for all test vehicles Image Source: AAA
Based on findings from earlier work, naturalistic evaluations exclusively focused on the highway environment. In general, all test drivers noted the adaptive cruise functionality of evaluated systems performed well, sometimes exceeding expectations. However, each test driver noted some degree of flawed performance during each drive of every test vehicle in terms of lane-keeping functionality. The specific nature of lane-keeping events were varied; common events are listed below:
Abrupt disengagements (sometimes during critical situations)
Failure to engage
Erroneous disengagements in terms of perceived inattention
“Ping-ponging” within the lane
Becoming uncomfortably close to other vehicles or guardrails in the lateral direction
Event Occurrences
Lane Departure 173
Erratic Lane Position 206
Failure to Slow/Stop 7
Other 135
Total 521
48 © 2020 American Automobile Association, Inc.
Active Driving Assistance
Complete lane departures within:
Curves
Pavement transitions
Upon encountering exit ramps/on-ramps
Based on the lane-keeping ability of each test vehicle, each driver felt all evaluated ADA systems enhanced the driving experience (to varying extents) only in the context of stop-and-go traffic or on simple, well-maintained highways with little traffic. However, due to the frequency and unpredictability of lane-keeping events, all test drivers expressed some level of distrust for each system. Additionally, all test drivers reached a general consensus that combining adaptive-cruise and lane-keeping functionalities in a single system did not consistently enhance the driving experience. In contrast, some test drivers reported evaluated ADA systems could sometimes increase perceived driver workload because constant monitoring and intervention in many cases was required.
8 Overall Conclusions
Research conducted by the AAA Foundation for Traffic Safety evaluated the potential impacts of Level 2 automation equipped vehicles on driving behavior [6]. A general conclusion of the work originated from a 12-month field evaluation of 50 participant-owned vehicles. Since “test” vehicles were owned and operated prior to the study, it can be assumed participants already had some degree of familiarity with the system. As a result, this data may be indicative of long-term adaptation and behavior effects. In general, this evaluation showed a greater impact on various driver behavioral measures when ADA systems were active compared to when these systems were not active but available. Eye-glance metrics indicated drivers had their eyes off-road and on non-driving-related tasks more frequently and for longer durations when ADA systems were active compared to any other system status.
This observation is troubling when combined with findings of this work in both closed-course and naturalistic environments. In both environments, clear examples of critical performance demerits that may result in a serious collision were observed.
In the closed-course environment, all test vehicles evaluated in this context impacted a simulated disabled vehicle at least once when evaluated at 30 mph. Among test vehicles, the highest average detection/notification TTC was approximately two seconds. In a real-world situation where a driver is disengaged from the driving task for a significant duration, he/she may be unaware of an upcoming critical situation. In this scenario, it is unlikely a notification provided two seconds prior to an impending collision will provide enough time for the driver to avoid impact if the system does not adequately intervene.
During naturalistic evaluations, an adverse event was observed on average, once every 8 miles. As highway speeds typically exceed 60 mph, an unexpected lane departure that occurs in combination with a disengaged driver is potentially hazardous for two main reasons. First, a driver simply may not have time to avoid a potential collision either with a vehicle alongside or a stationary object on the side of the roadway. Additionally, a driver may be taken by surprise when regaining situational awareness and consequently overcorrect, potentially resulting in loss of vehicle control.

49 © 2020 American Automobile Association, Inc.
Active Driving Assistance
Nothing contained within this report is intended to directly imply evaluated ADA systems are inherently unsafe. In totality, this work is intended to illustrate potential system inadequacies in the context of scenarios realistically encountered in a naturalistic environment. Additionally, all test drivers expressed some degree of distrust in each evaluated system and questioned the overall usefulness of integrating adaptive cruise and lane-keeping functionalities.
This work emphasizes the need for additional refinement of ADAS systems as a whole and for the automotive industry to collaboratively consider how current iterations of ADAS technology align with driver perception and behavior. Multiple facets relating to system programming, edge-case scenario design considerations, human/machine interactions and driver training should be considered in order to most effectively design and promote ADAS systems that provide the most benefit to the driving public.
9 Key Findings
1. In general, evaluated ADA systems performed according to expectations derived from the
owner’s manuals during closed-course evaluations.
a. On fresh pavement with well-defined lane markers, all systems consistently traversed
the testing lane with some lateral offsets relative to the lane center.
b. In aggregate, evaluated ADA systems made contact with a simulated disabled vehicle
66% of the time.
c. For a simulated stop-and-go scenario, none of the evaluated ADA systems made contact
with a lead vehicle for all tested deceleration rates.
2. Test drivers reached a consensus that over approximately 4,000 miles of total driving distance,
combining longitudinal and lateral control into a single system did not significantly enhance the
driving experience for the majority of encountered scenarios. On roadways utilized for
evaluation:
a. Lane-keeping events accounted for 73% of noted events.
i. The Super Cruise™ system exhibited significantly less lane-keeping events in
terms of distribution and frequency relative to other evaluated systems.
However, test drivers expressed concern about sudden system disengagements
with little warning.
b. A total of 521 events were noted among all evaluated ADA systems. On average, this
resulted in a noteworthy event approximately every eight miles.
10 Summary Recommendations
1. Currently available ADA systems are not capable of sustained vehicle operation without
constant driver supervision; it is imperative the driver maintain situational awareness at all
times.

50 © 2020 American Automobile Association, Inc.
Active Driving Assistance
2. The adaptive cruise component of all evaluated ADA systems performed well during naturalistic
driving as evidenced by the low frequency of events related to this functionality. Improved
tuning of the lane keeping component may bring a significant performance improvement to
ADA systems.
3. For all evaluated vehicles, test drivers sometimes found that ADA system status was unclear
and/or were taken by surprise with sudden/unexpected disengagements. Additional
consideration of the human/machine interface will bring improved driver confidence pertaining
to the use of ADA systems.

51 © 2020 American Automobile Association, Inc.
Active Driving Assistance
11 Appendix
11.1 2019 BMW X7
Figure 56: Data from all noted events during naturalistic evaluation of the 2019 BMW X7 Image Source: AAA
Location Latitude Longitude Event Type Speed (mph) Longitudinal Acc (G) Lateral Acc (G) Comments
Hwy 101 34°4.610568 N 118°16.781400 W Erratic Lane Positioning 40 -0.06 0.05 Riding on the right side of the lane
Hwy 101 34°9.148620 N 118°22.516530 W Erratic Lane Positioning 57 0.04 0.17 Steering is bouncing back and forth and ping ponging on S turn
Hwy 101 34°9.867738 N 118°28.382862 W Erratic Lane Positioning 47 0.00 0.18 Vehicle having a hard time centering itself on a curve
Hwy 101 34°14.516736 N 119°11.275098 W Other 68 0.04 0.03
Hwy 101 34°22.777446 N 119°28.874832 W Other 56 0.04 0.02
Hwy 101 34°22.823226 N 119°28.901556 W Erratic Lane Positioning 57 0.03 0.06 Lane marker disappeared due to exit, vehicle bounced back and forth a bit but regained the lane and recovered
Hwy 101 34°23.832132 N 119°30.699486 W Erratic Lane Positioning 51 0.15 0.10 Vehicle got too close to adjacent lane on a slight curve, system disengaged
Hwy 101 34°24.991110 N 119°33.796122 W Erratic Lane Positioning 70 -0.05 -0.05 Vehicle went outside of lane
Hwy 101 34°25.257144 N 119°37.431792 W Other 62 0.03 -0.08 System disengagement without obvious cause
Hwy 101 34°26.388012 N 119°56.303202 W Erratic Lane Positioning 68 0.00 -0.11
Hwy 101 34°27.642114 N 120°0.085536 W Erratic Lane Positioning 68 0.00 0.04
Hwy 101 34°27.679944 N 120°0.317604 W Erratic Lane Positioning 68 -0.07 -0.02
Hwy 101 34°27.821688 N 120°1.672410 W Erratic Lane Positioning 68 0.03 -0.02
Hwy 101 34°27.786510 N 120°3.639246 W Lane Departure 68 -0.02 -0.01 Right side
Hwy 101 34°27.831306 N 120°3.761190 W Lane Departure 68 -0.02 -0.16 Left side
Hwy 101 34°28.388604 N 120°7.750734 W Erratic Lane Positioning 69 0.02 0.00
Hwy 101 34°28.980174 N 120°13.820598 W Lane Departure 62 0.00 -0.31 Left side
Hwy 101 34°29.095566 N 120°13.762980 W Lane Departure 62 -0.05 -0.28
Hwy 101 34°29.127246 N 120°13.726812 W Erratic Lane Positioning 62 -0.01 -0.02
Hwy 101 34°29.366772 N 120°13.557408 W Failure to Slow/Stop 44 0.05 0.21 Truck with trailer crossed into lane
Hwy 101 34°35.430288 N 120°11.551818 W Erratic Lane Positioning 67 -0.11 -0.03
Hwy 101 34°35.572218 N 120°11.648142 W Erratic Lane Positioning 61 -0.04 -0.14
Hwy 101 34°44.317536 N 120°15.881916 W Erratic Lane Positioning 66 -0.06 -0.15
Hwy 101 34°53.400156 N 120°25.018092 W Lane Departure 70 -0.03 -0.12 Right side
Hwy 101 35°8.627430 N 120°38.467278 W Other 68 -0.05 -0.11 System disengagement
Hwy 101 35°17.506974 N 120°39.147234 W Erratic Lane Positioning 63 -0.06 -0.16 Vehicle hugging right lane marker
Hwy 101 35°18.976488 N 120°37.288914 W Lane Departure 69 -0.01 0.07 Lane Departure/System Disengagement
Hwy 101 35°32.930652 N 120°42.946362 W Erratic Lane Positioning 67 0.00 -0.22 Hugging right side of the road/Lane Departure
Hwy 101 35°38.031042 N 120°41.147106 W Erratic Lane Positioning 72 -0.01 -0.16 "Ping-ponging" within lane
Hwy 101 35°44.844918 N 120°42.020016 W Other 56 -0.04 -0.08 System disengagement, lane might be too wide
Hwy 101 35°45.623652 N 120°41.922768 W Other 63 -0.01 0.08 Right lane may be too wide for system to engage
Hwy 101 36°3.176220 N 120°58.151154 W Other 73 -0.07 0.04
Hwy 101 36°3.734796 N 120°58.815528 W Other 73 -0.04 -0.06
Hwy 101 36°12.046650 N 121°6.604884 W Erratic Lane Positioning 54 0.00 0.03
Hwy 101 36°19.695606 N 121°14.541420 W Other 67 0.08 -0.01
Hwy 101 36°30.658302 N 121°26.180406 W Lane Departure 65 0.06 -0.04
Hwy 101 36°54.234828 N 121°33.395556 W Other 76 0.08 -0.01 System disengagement
Hwy 101 37°11.779122 N 121°42.052890 W Erratic Lane Positioning 71 -0.02 -0.02 "Ping-ponging" within lane
Hwy 101 37°17.242194 N 121°48.563604 W Erratic Lane Positioning 68 -0.03 -0.02 "Ping-ponging" within lane
Hwy 101 37°20.248242 N 121°50.921694 W Lane Departure 66 -0.03 0.04 Lane departure right side
I-680 37°42.296796 N 121°55.481814 W Erratic Lane Positioning 64 -0.02 0.00 Hugging left side of lane in merge area
I-680 37°53.262930 N 122°3.412302 W Lane Departure 68 0.03 0.04
I-680 37°53.078208 N 122°3.256758 W Lane Departure 68 0.03 0.06
I-680 37°52.915062 N 122°3.075024 W Erratic Lane Positioning 68 -0.04 -0.04
I-680 37°49.211700 N 121°59.605392 W Erratic Lane Positioning 67 -0.02 0.01 "Ping-ponging" within lane during curve
I-680 37°42.364068 N 121°55.574550 W Other 67 0.01 -0.11 System disengagement
I-580 37°42.091482 N 121°55.029750 W Erratic Lane Positioning 67 0.25 -0.07
I-580 37°42.093456 N 121°54.806988 W Erratic Lane Positioning 67 0.05 -0.02 "Ping-ponging" within lane
I-580 37°42.077352 N 121°52.888956 W Erratic Lane Positioning 67 0.03 -0.06
I-580 37°42.065502 N 121°51.016464 W Erratic Lane Positioning 68 -0.08 -0.08 Too close to tractor trailer alongside
I-580 37°42.032724 N 121°47.653206 W Erratic Lane Positioning 67 -0.02 -0.20
I-580 37°41.982558 N 121°46.974648 W Erratic Lane Positioning 68 0.05 0.03
I-580 37°42.162372 N 121°45.382578 W Erratic Lane Positioning 64 -0.01 0.03
I-580 37°42.153828 N 121°44.393832 W Erratic Lane Positioning 68 0.02 0.05
I-580 37°42.236274 N 121°44.131866 W Other 60 0.08 -0.08
I-580 37°43.029804 N 121°42.185136 W Erratic Lane Positioning 67 -0.06 0.05 More ping ponging
I-580 37°43.074330 N 121°41.979090 W Other 62 -0.07 -0.03
I-580 37°43.081284 N 121°41.945604 W Lane Departure 59 -0.09 0.03 Lane departure left side
I-580 37°43.783452 N 121°37.990902 W Erratic Lane Positioning 61 0.03 0.06
I-580 37°43.973346 N 121°37.752048 W Erratic Lane Positioning 58 0.06 -0.07
I-580 37°44.500770 N 121°34.414218 W Erratic Lane Positioning 67 -0.04 0.02
I-5 37°34.496334 N 121°18.787446 W Erratic Lane Positioning 72 0.00 0.03 "Ping-ponging" within lane
I-5 37°28.863750 N 121°11.884014 W Erratic Lane Positioning 72 -0.04 0.01
I-5 37°24.300954 N 121°8.623842 W Erratic Lane Positioning 73 0.02 0.00
I-5 37°23.116068 N 121°7.807014 W Erratic Lane Positioning 73 -0.08 -0.05
I-5 37°18.227316 N 121°6.231714 W Erratic Lane Positioning 73 -0.05 0.03
I-5 37°14.949606 N 121°5.392860 W Erratic Lane Positioning 72 -0.07 -0.03
I-5 37°3.548988 N 120°58.345116 W Erratic Lane Positioning 73 0.01 0.03
I-5 37°3.418056 N 120°58.218198 W Erratic Lane Positioning 73 0.00 -0.07
I-5 37°2.769816 N 120°57.590754 W Erratic Lane Positioning 68 0.05 0.03
I-5 36°59.516646 N 120°54.498156 W Erratic Lane Positioning 73 -0.03 -0.02
I-5 36°55.506192 N 120°50.120124 W Erratic Lane Positioning 73 0.04 -0.02
I-5 36°46.825320 N 120°43.567476 W Erratic Lane Positioning 74 -0.04 -0.03
I-5 36°46.641186 N 120°43.441050 W Erratic Lane Positioning 74 0.02 -0.06
I-5 36°41.281044 N 120°39.615786 W Erratic Lane Positioning 74 0.03 -0.01
I-5 36°30.742878 N 120°27.981870 W Other 66 0.01 0.03 System disengagement
I-5 36°28.231104 N 120°25.602906 W Lane Departure 75 -0.01 -0.02 Lane departure left side
I-5 36°17.754198 N 120°16.224522 W Erratic Lane Positioning 75 0.09 -0.18 System wanted to follow the exit with disengagement
I-5 36°5.550318 N 120°7.067340 W Erratic Lane Positioning 75 -0.02 0.03 Started ping ponging in the lane and disengaged
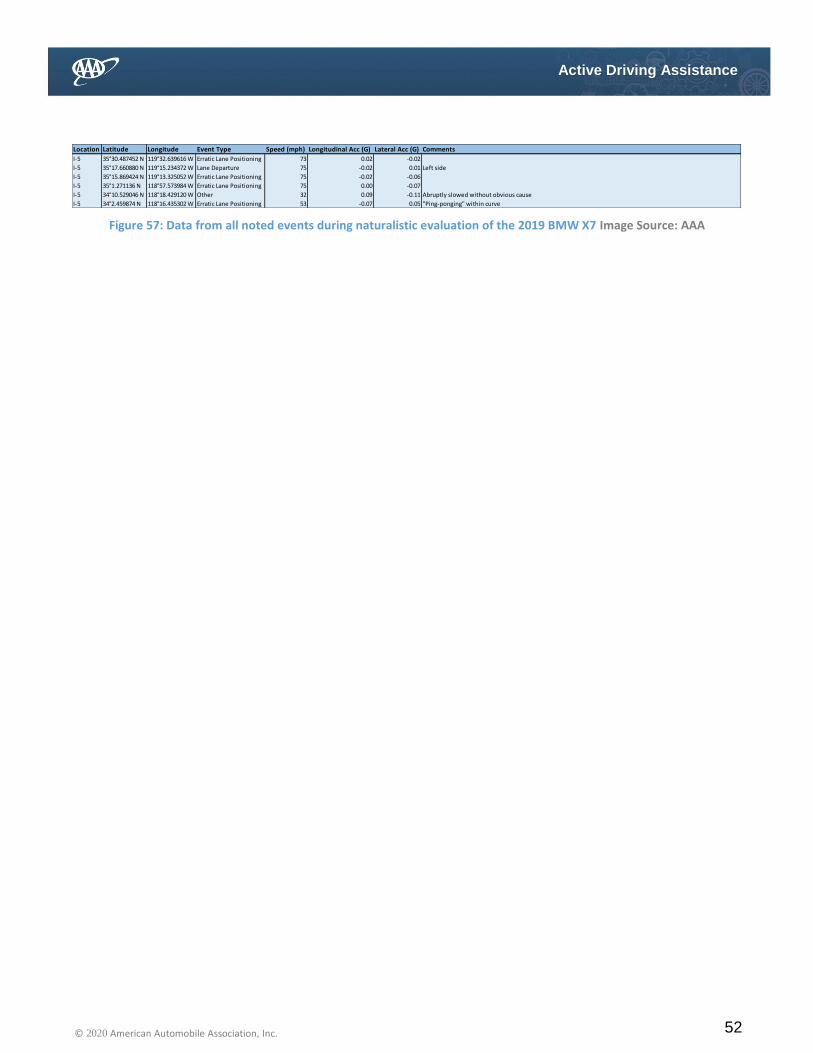
52 © 2020 American Automobile Association, Inc.
Active Driving Assistance
Figure 57: Data from all noted events during naturalistic evaluation of the 2019 BMW X7 Image Source: AAA
Location Latitude Longitude Event Type Speed (mph) Longitudinal Acc (G) Lateral Acc (G) Comments
I-5 35°30.487452 N 119°32.639616 W Erratic Lane Positioning 73 0.02 -0.02
I-5 35°17.660880 N 119°15.234372 W Lane Departure 75 -0.02 0.01 Left side
I-5 35°15.869424 N 119°13.325052 W Erratic Lane Positioning 75 -0.02 -0.06
I-5 35°1.271136 N 118°57.573984 W Erratic Lane Positioning 75 0.00 -0.07
I-5 34°10.529046 N 118°18.429120 W Other 32 0.09 -0.11 Abruptly slowed without obvious cause
I-5 34°2.459874 N 118°16.435302 W Erratic Lane Positioning 53 -0.07 0.05 "Ping-ponging" within curve
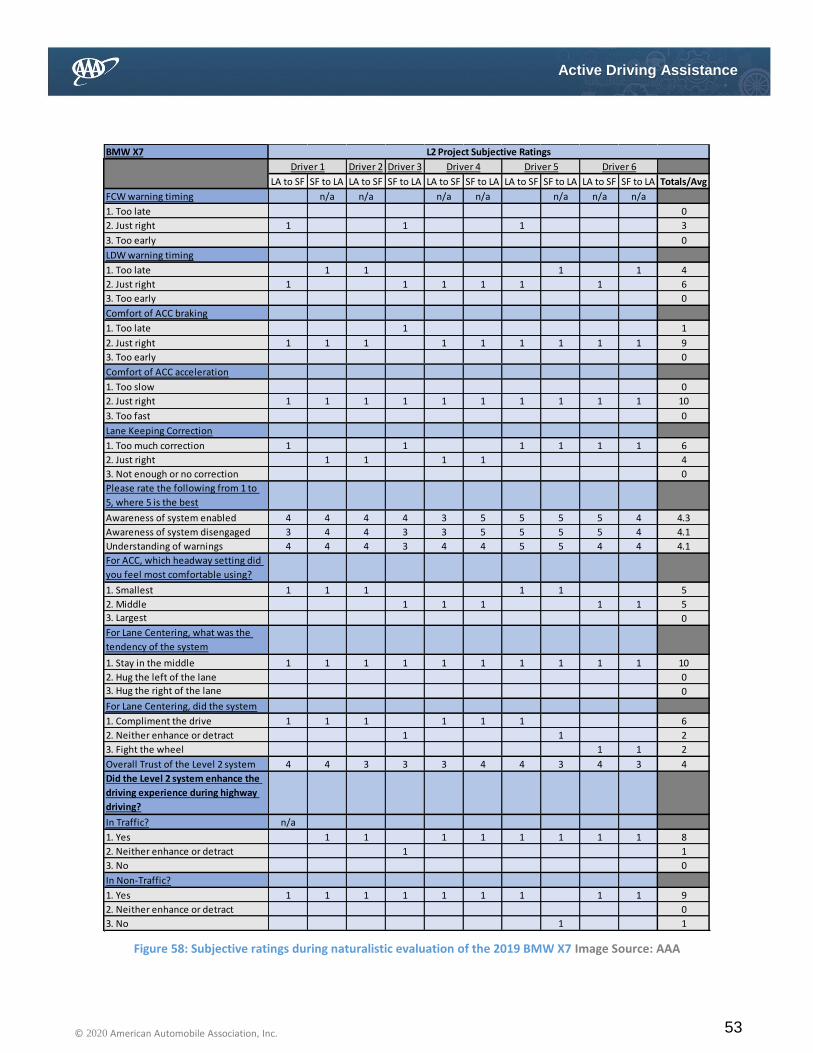
53 © 2020 American Automobile Association, Inc.
Active Driving Assistance
Figure 58: Subjective ratings during naturalistic evaluation of the 2019 BMW X7 Image Source: AAA
BMW X7
Driver 2 Driver 3
LA to SF SF to LA LA to SF SF to LA LA to SF SF to LA LA to SF SF to LA LA to SF SF to LA Totals/Avg
FCW warning timing n/a n/a n/a n/a n/a n/a n/a
1. Too late 0
2. Just right 1 1 1 3
3. Too early 0
LDW warning timing
1. Too late 1 1 1 1 4
2. Just right 1 1 1 1 1 1 6
3. Too early 0
Comfort of ACC braking
1. Too late 1 1
2. Just right 1 1 1 1 1 1 1 1 1 9
3. Too early 0
Comfort of ACC acceleration
1. Too slow 0
2. Just right 1 1 1 1 1 1 1 1 1 1 10
3. Too fast 0
Lane Keeping Correction
1. Too much correction 1 1 1 1 1 1 6
2. Just right 1 1 1 1 4
3. Not enough or no correction 0
Please rate the following from 1 to
5, where 5 is the best
Awareness of system enabled 4 4 4 4 3 5 5 5 5 4 4.3
Awareness of system disengaged 3 4 4 3 3 5 5 5 5 4 4.1
Understanding of warnings 4 4 4 3 4 4 5 5 4 4 4.1
For ACC, which headway setting did
you feel most comfortable using?
1. Smallest 1 1 1 1 1 5
2. Middle 1 1 1 1 1 5
3. Largest 0
For Lane Centering, what was the
tendency of the system
1. Stay in the middle 1 1 1 1 1 1 1 1 1 1 10
2. Hug the left of the lane 0
3. Hug the right of the lane 0
For Lane Centering, did the system
1. Compliment the drive 1 1 1 1 1 1 6
2. Neither enhance or detract 1 1 2
3. Fight the wheel 1 1 2
Overall Trust of the Level 2 system 4 4 3 3 3 4 4 3 4 3 4
Did the Level 2 system enhance the
driving experience during highway
driving?
In Traffic? n/a
1. Yes 1 1 1 1 1 1 1 1 8
2. Neither enhance or detract 1 1
3. No 0
In Non-Traffic?
1. Yes 1 1 1 1 1 1 1 1 1 9
2. Neither enhance or detract 0
3. No 1 1
L2 Project Subjective Ratings
Driver 1 Driver 4 Driver 5 Driver 6
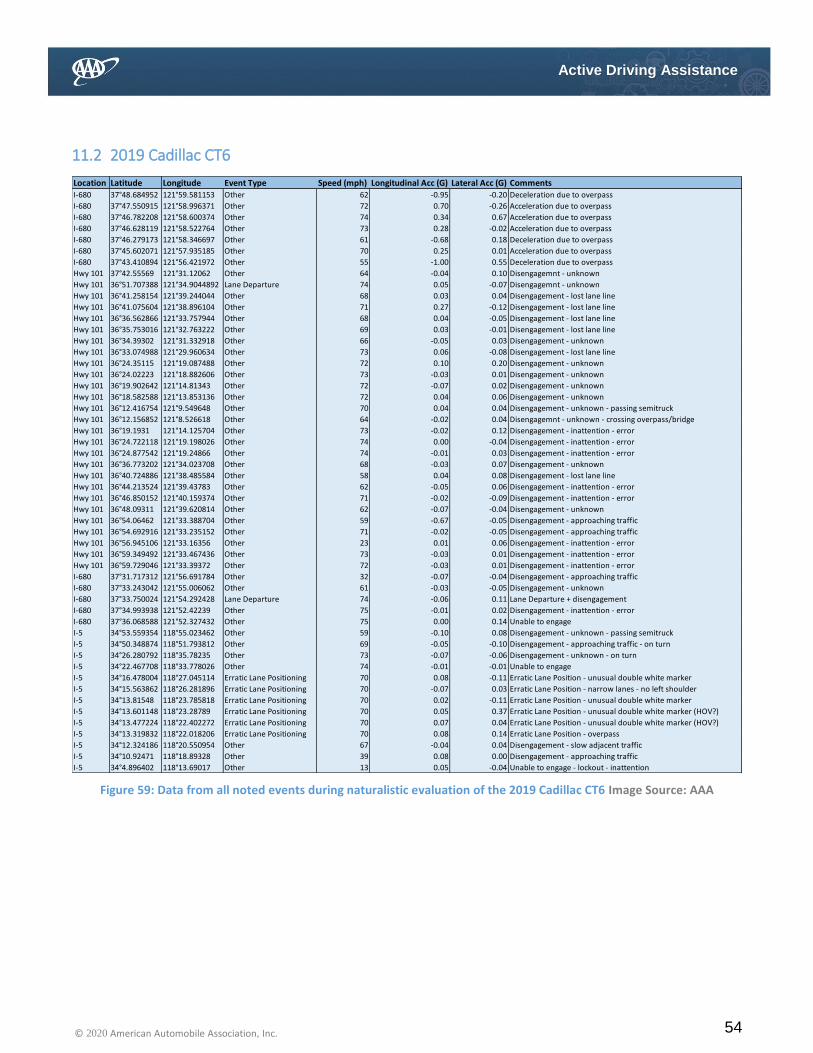
54 © 2020 American Automobile Association, Inc.
Active Driving Assistance
11.2 2019 Cadillac CT6
Figure 59: Data from all noted events during naturalistic evaluation of the 2019 Cadillac CT6 Image Source: AAA
Location Latitude Longitude Event Type Speed (mph) Longitudinal Acc (G) Lateral Acc (G) Comments
I-680 37°48.684952 121°59.581153 Other 62 -0.95 -0.20 Deceleration due to overpass
I-680 37°47.550915 121°58.996371 Other 72 0.70 -0.26 Acceleration due to overpass
I-680 37°46.782208 121°58.600374 Other 74 0.34 0.67 Acceleration due to overpass
I-680 37°46.628119 121°58.522764 Other 73 0.28 -0.02 Acceleration due to overpass
I-680 37°46.279173 121°58.346697 Other 61 -0.68 0.18 Deceleration due to overpass
I-680 37°45.602071 121°57.935185 Other 70 0.25 0.01 Acceleration due to overpass
I-680 37°43.410894 121°56.421972 Other 55 -1.00 0.55 Deceleration due to overpass
Hwy 101 37°42.55569 121°31.12062 Other 64 -0.04 0.10 Disengagemnt - unknown
Hwy 101 36°51.707388 121°34.9044892 Lane Departure 74 0.05 -0.07 Disengagemnt - unknown
Hwy 101 36°41.258154 121°39.244044 Other 68 0.03 0.04 Disengagement - lost lane line
Hwy 101 36°41.075604 121°38.896104 Other 71 0.27 -0.12 Disengagement - lost lane line
Hwy 101 36°36.562866 121°33.757944 Other 68 0.04 -0.05 Disengagement - lost lane line
Hwy 101 36°35.753016 121°32.763222 Other 69 0.03 -0.01 Disengagement - lost lane line
Hwy 101 36°34.39302 121°31.332918 Other 66 -0.05 0.03 Disengagement - unknown
Hwy 101 36°33.074988 121°29.960634 Other 73 0.06 -0.08 Disengagement - lost lane line
Hwy 101 36°24.35115 121°19.087488 Other 72 0.10 0.20 Disengagement - unknown
Hwy 101 36°24.02223 121°18.882606 Other 73 -0.03 0.01 Disengagement - unknown
Hwy 101 36°19.902642 121°14.81343 Other 72 -0.07 0.02 Disengagement - unknown
Hwy 101 36°18.582588 121°13.853136 Other 72 0.04 0.06 Disengagement - unknown
Hwy 101 36°12.416754 121°9.549648 Other 70 0.04 0.04 Disengagement - unknown - passing semitruck
Hwy 101 36°12.156852 121°8.526618 Other 64 -0.02 0.04 Disengagemnt - unknown - crossing overpass/bridge
Hwy 101 36°19.1931 121°14.125704 Other 73 -0.02 0.12 Disengagement - inattention - error
Hwy 101 36°24.722118 121°19.198026 Other 74 0.00 -0.04 Disengagement - inattention - error
Hwy 101 36°24.877542 121°19.24866 Other 74 -0.01 0.03 Disengagement - inattention - error
Hwy 101 36°36.773202 121°34.023708 Other 68 -0.03 0.07 Disengagement - unknown
Hwy 101 36°40.724886 121°38.485584 Other 58 0.04 0.08 Disengagement - lost lane line
Hwy 101 36°44.213524 121°39.43783 Other 62 -0.05 0.06 Disengagement - inattention - error
Hwy 101 36°46.850152 121°40.159374 Other 71 -0.02 -0.09 Disengagement - inattention - error
Hwy 101 36°48.09311 121°39.620814 Other 62 -0.07 -0.04 Disengagement - unknown
Hwy 101 36°54.06462 121°33.388704 Other 59 -0.67 -0.05 Disengagement - approaching traffic
Hwy 101 36°54.692916 121°33.235152 Other 71 -0.02 -0.05 Disengagement - approaching traffic
Hwy 101 36°56.945106 121°33.16356 Other 23 0.01 0.06 Disengagement - inattention - error
Hwy 101 36°59.349492 121°33.467436 Other 73 -0.03 0.01 Disengagement - inattention - error
Hwy 101 36°59.729046 121°33.39372 Other 72 -0.03 0.01 Disengagement - inattention - error
I-680 37°31.717312 121°56.691784 Other 32 -0.07 -0.04 Disengagement - approaching traffic
I-680 37°33.243042 121°55.006062 Other 61 -0.03 -0.05 Disengagement - unknown
I-680 37°33.750024 121°54.292428 Lane Departure 74 -0.06 0.11 Lane Departure + disengagement
I-680 37°34.993938 121°52.42239 Other 75 -0.01 0.02 Disengagement - inattention - error
I-680 37°36.068588 121°52.327432 Other 75 0.00 0.14 Unable to engage
I-5 34°53.559354 118°55.023462 Other 59 -0.10 0.08 Disengagement - unknown - passing semitruck
I-5 34°50.348874 118°51.793812 Other 69 -0.05 -0.10 Disengagement - approaching traffic - on turn
I-5 34°26.280792 118°35.78235 Other 73 -0.07 -0.06 Disengagement - unknown - on turn
I-5 34°22.467708 118°33.778026 Other 74 -0.01 -0.01 Unable to engage
I-5 34°16.478004 118°27.045114 Erratic Lane Positioning 70 0.08 -0.11 Erratic Lane Position - unusual double white marker
I-5 34°15.563862 118°26.281896 Erratic Lane Positioning 70 -0.07 0.03 Erratic Lane Position - narrow lanes - no left shoulder
I-5 34°13.81548 118°23.785818 Erratic Lane Positioning 70 0.02 -0.11 Erratic Lane Position - unusual double white marker
I-5 34°13.601148 118°23.28789 Erratic Lane Positioning 70 0.05 0.37 Erratic Lane Position - unusual double white marker (HOV?)
I-5 34°13.477224 118°22.402272 Erratic Lane Positioning 70 0.07 0.04 Erratic Lane Position - unusual double white marker (HOV?)
I-5 34°13.319832 118°22.018206 Erratic Lane Positioning 70 0.08 0.14 Erratic Lane Position - overpass
I-5 34°12.324186 118°20.550954 Other 67 -0.04 0.04 Disengagement - slow adjacent traffic
I-5 34°10.92471 118°18.89328 Other 39 0.08 0.00 Disengagement - approaching traffic
I-5 34°4.896402 118°13.69017 Other 13 0.05 -0.04 Unable to engage - lockout - inattention
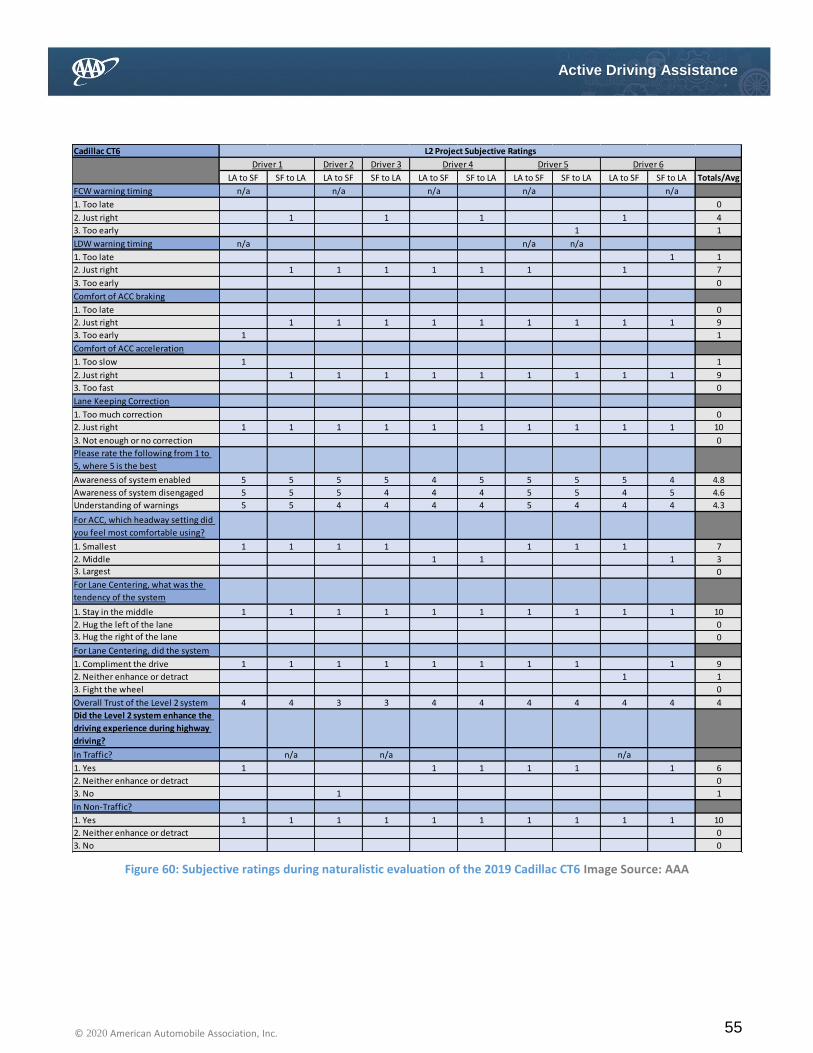
55 © 2020 American Automobile Association, Inc.
Active Driving Assistance
Figure 60: Subjective ratings during naturalistic evaluation of the 2019 Cadillac CT6 Image Source: AAA
Cadillac CT6
Driver 2 Driver 3
LA to SF SF to LA LA to SF SF to LA LA to SF SF to LA LA to SF SF to LA LA to SF SF to LA Totals/Avg
FCW warning timing n/a n/a n/a n/a n/a
1. Too late 0
2. Just right 1 1 1 1 4
3. Too early 1 1
LDW warning timing n/a n/a n/a
1. Too late 1 1
2. Just right 1 1 1 1 1 1 1 7
3. Too early 0
Comfort of ACC braking
1. Too late 0
2. Just right 1 1 1 1 1 1 1 1 1 9
3. Too early 1 1
Comfort of ACC acceleration
1. Too slow 1 1
2. Just right 1 1 1 1 1 1 1 1 1 9
3. Too fast 0
Lane Keeping Correction
1. Too much correction 0
2. Just right 1 1 1 1 1 1 1 1 1 1 10
3. Not enough or no correction 0
Please rate the following from 1 to
5, where 5 is the best
Awareness of system enabled 5 5 5 5 4 5 5 5 5 4 4.8
Awareness of system disengaged 5 5 5 4 4 4 5 5 4 5 4.6
Understanding of warnings 5 5 4 4 4 4 5 4 4 4 4.3
For ACC, which headway setting did
you feel most comfortable using?
1. Smallest 1 1 1 1 1 1 1 7
2. Middle 1 1 1 3
3. Largest 0
For Lane Centering, what was the
tendency of the system
1. Stay in the middle 1 1 1 1 1 1 1 1 1 1 10
2. Hug the left of the lane 0
3. Hug the right of the lane 0
For Lane Centering, did the system
1. Compliment the drive 1 1 1 1 1 1 1 1 1 9
2. Neither enhance or detract 1 1
3. Fight the wheel 0
Overall Trust of the Level 2 system 4 4 3 3 4 4 4 4 4 4 4
Did the Level 2 system enhance the
driving experience during highway
driving?
In Traffic? n/a n/a n/a
1. Yes 1 1 1 1 1 1 6
2. Neither enhance or detract 0
3. No 1 1
In Non-Traffic?
1. Yes 1 1 1 1 1 1 1 1 1 1 10
2. Neither enhance or detract 0
3. No 0
Driver 1 Driver 4 Driver 5 Driver 6
L2 Project Subjective Ratings

56 © 2020 American Automobile Association, Inc.
Active Driving Assistance
11.3 2019 Ford Edge
Figure 61: Subjective ratings during naturalistic evaluation of the 2019 Ford Edge Image Source: AAA
Location Latitude Longitude Event Type Speed (mph) Longitudinal Acc (G) Lateral Acc (G) CommentsHwy 101 34°12.536568 N 118°24.395706 W Erratic Lane Positioning 70 0.01 0.10
Hwy 101 34°14.053212 N 118°24.623868 W Lane Departure 74 -0.05 0.27
Hwy 101 34°24.183468 N 118°42.321060 W Lane Departure 69 0.06 0.01
Hwy 101 34°24.402348 N 118°44.334024 W Lane Departure 67 0.01 -0.05
Hwy 101 34°25.252866 N 119°36.451056 W Lane Departure 68 -0.05 -0.07
Hwy 101 34°25.377024 N 119°39.300372 W Lane Departure 67 0.28 0.16 Occurred during lane change with right turn signal
Hwy 101 34°26.475336 N 119°45.631764 W Erratic Lane Positioning 71 0.09 -0.22 Vehicle tracking right in lane
Hwy 101 34°25.947108 N 119°54.323016 W Lane Departure 71 -0.02 -0.10 Lane Departure turned off while approaching lane split
Hwy 101 34°26.346774 N 119°55.925736 W Erratic Lane Positioning 70 0.00 0.03
Hwy 101 34°27.840996 N 120°2.607564 W Erratic Lane Positioning 69 -0.05 -0.06
Hwy 101 34°28.304346 N 120°10.500090 W Lane Departure 71 0.05 -0.07 No lane departure warning, vehicle crossed right lane marker
Hwy 101 34°28.413432 N 120°11.981898 W Erratic Lane Positioning 71 -0.03 0.10
Hwy 101 34°29.148366 N 120°13.702614 W Other 65 -0.04 -0.13 System disengaged during turn, solid lines on both sides
Hwy 101 34°29.853762 N 120°13.852308 W Erratic Lane Positioning 55 0.08 -0.09 Approaching exit, vehicle wanted to continue exiting, driver had to intervene with system active
Hwy 101 34°31.636926 N 120°11.850750 W Lane Departure 66 0.00 0.02 Vehicle veered to left
Hwy 101 34°32.879772 N 120°11.536638 W Lane Departure 66 0.03 0.04 Lane departure with system still active
Hwy 101 34°34.299942 N 120°11.560050 W Erratic Lane Positioning 66 -0.04 -0.28
Hwy 101 34°34.965162 N 120°11.625492 W Erratic Lane Positioning 60 -0.05 -0.16 Vehicle hugging lane marker
Hwy 101 34°36.634584 N 120°11.416728 W Lane Departure 71 0.01 0.01 System disengagement with simultaneous lane departure
Hwy 101 34°37.422798 N 120°11.331612 W Erratic Lane Positioning 71 -0.01 -0.02
Hwy 101 34°44.589672 N 120°16.290984 W Erratic Lane Positioning 62 -0.01 -0.05
Hwy 101 34°52.618584 N 120°24.357438 W Lane Departure 74 0.00 -0.08
Hwy 101 35°15.510582 N 120°40.428594 W Erratic Lane Positioning 64 -0.10 0.09 There was an onramp right there and it tried to swing right
Hwy 101 35°17.502324 N 120°39.362736 W Lane Departure 67 0.02 -0.20 Through that turn, on the right line and reflectors
Hwy 101 35°18.930864 N 120°37.313346 W Lane Departure 65 -0.11 0.13 Current lane opened up to 2 lanes, it decided to go in the right lane
Hwy 101 35°20.945436 N 120°37.856910 W Lane Departure 70 -0.04 0.13 As we crested this hill, it pulled to the left and was actually on the line running over the reflectors
Hwy 101 35°21.587910 N 120°38.264280 W Lane Departure 64 -0.01 -0.04 Coming down the hill, kept pulling to the right there and crossed the line
Hwy 101 35°47.407758 N 120°43.834236 W Failure to Slow/Stop 44 -0.10 0.03 All of a sudden, it started accelerating and there was a car in front of me
Hwy 101 36°11.083584 N 121°4.130376 W Erratic Lane Positioning 57 0.02 0.04 A little close to the left for comfort and it wanted to take the exit back there.
Hwy 101 36°11.142102 N 121°4.190070 W Erratic Lane Positioning 57 -0.01 -0.08 Way too close to comfort. K-rail is right on left lane marking.
Hwy 101 36°11.244306 N 121°4.309020 W Erratic Lane Positioning 59 0.07 0.04 Way too close to comfort. K-rail is right on left lane marking.
Hwy 101 36°11.427306 N 121°4.655040 W Other 61 -0.01 0.04 System disengaged
Hwy 101 36°11.770998 N 121°5.738586 W Other 58 0.03 0.03 System will not engage on this road
Hwy 101 36°12.254670 N 121°8.097162 W Erratic Lane Positioning 61 -0.01 0.02 Vehicle darted to the exit
Hwy 101 36°22.713696 N 121°17.691756 W Erratic Lane Positioning 72 -0.04 0.01 Lane Departure on the left
Hwy 101 36°25.997910 N 121°20.279430 W Erratic Lane Positioning 72 0.04 0.22 Hugging lane on left
Hwy 101 36°27.460494 N 121°22.608204 W Erratic Lane Positioning 67 -0.02 -0.05 Hugging left side of lane with a vehicle passing
Hwy 101 36°31.449666 N 121°27.938808 W Lane Departure 71 -0.02 -0.03 Lane departure on the left
Hwy 101 36°31.935012 N 121°28.562880 W Other 72 -0.03 0.00 System disengaged, poor lane markers
Hwy 101 36°34.323714 N 121°31.239138 W Lane Departure 71 -0.09 0.06 Lane departure on the right
Hwy 101 36°35.277054 N 121°32.254668 W Erratic Lane Positioning 68 -0.05 -0.05 Too close to the right with a tractor trailer on the side
Hwy 101 36°36.176778 N 121°33.211254 W Other 71 0.05 -0.01 Car wanted to follow truck to the right lane
Hwy 101 36°40.948776 N 121°38.641746 W Other 60 0.04 0.03 System disengaged, no lane markers
Hwy 101 36°41.651898 N 121°39.748536 W Other 61 0.00 -0.12 System disengaged
Hwy 101 36°46.693146 N 121°40.173456 W Lane Departure 69 0.01 0.03 Lane departure left side
Hwy 101 36°48.861846 N 121°38.414358 W Lane Departure 74 0.02 -0.13 Lane departure right side
Hwy 101 36°48.991086 N 121°38.182596 W Erratic Lane Positioning 74 0.06 0.08 Hugging right side of road
Hwy 101 36°49.221858 N 121°37.840296 W Other 56 -0.04 0.18 Inappropriate heavy acceleration into corner
Hwy 101 36°50.218092 N 121°37.846074 W Erratic Lane Positioning 67 -0.02 0.00 Hugging left side
Hwy 101 36°50.333610 N 121°37.900842 W Erratic Lane Positioning 64 -0.03 0.02 Ping ponging within lane
Hwy 101 36°51.012396 N 121°38.158458 W Erratic Lane Positioning 64 0.06 -0.06 Hugging right side of road with gas truck alongside
Hwy 101 36°51.715176 N 121°37.117008 W Erratic Lane Positioning 72 -0.17 0.13 Hugging left side of road
Hwy 101 36°51.613080 N 121°36.514944 W Erratic Lane Positioning 62 0.32 1.54 Hugging left side
Hwy 101 36°51.609534 N 121°36.422520 W Erratic Lane Positioning 63 0.11 1.18 Steering towards guardrail
Hwy 101 36°51.576888 N 121°36.084576 W Erratic Lane Positioning 68 0.06 -0.02 Left side
Hwy 101 36°51.700380 N 121°34.791126 W Erratic Lane Positioning 63 0.08 0.15 Left side
Hwy 101 36°55.798572 N 121°32.895456 W Lane Departure 64 -0.05 0.02 Left side
Hwy 101 37°3.875982 N 121°35.201940 W Lane Departure 70 0.06 -0.01
Hwy 101 37°8.201178 N 121°38.199228 W Erratic Lane Positioning 63 -0.02 0.10
I-680 37°29.630316 N 121°55.269678 W Lane Departure 6 0.03 0.01
I-680 37°30.792306 N 121°56.327874 W Erratic Lane Positioning 9 -0.10 0.02
I-680 37°31.041732 N 121°56.469690 W Erratic Lane Positioning 8 0.01 0.00
I-680 37°42.188166 N 121°55.410234 W Erratic Lane Positioning 73 -0.02 0.12
I-680 37°53.601462 N 122°3.972486 W Lane Departure 67 -0.04 -0.01 Severe lane departure to the left
I-680 37°52.664142 N 122°2.886468 W Lane Departure 69 -0.02 -0.03 Left lane departure about 10 seconds ago
I-680 37°51.828594 N 122°2.181210 W Lane Departure 71 0.02 0.01 Lane departure with passing traffic
I-680 37°48.508458 N 121°59.507730 W Lane Departure 66 -0.08 -0.11 Lane departure with vehicles alongside
I-680 37°46.411704 N 121°58.413204 W Lane Departure 71 0.01 0.06 System disengagement
I-680 37°46.197684 N 121°58.307190 W Lane Departure 71 0.04 -0.03 System hugging right lane
I-680 37°46.015050 N 121°58.204296 W Other 71 0.08 -0.03 System disengagment. Sun angle likely a factor.
I-680 37°45.879528 N 121°58.115490 W Other 71 0.07 -0.04 System will not engage. Sun angle likely a factor.
I-680 37°45.224016 N 121°57.688326 W Other 70 0.05 0.04 System will not engage. Sun angle likely a factor.
I-680 37°43.829676 N 121°56.747508 W Erratic Lane Positioning 71 0.02 -0.01 System favoring right lane marker
I-680 37°43.581600 N 121°56.554470 W Other 70 0.01 -0.07 System disengagment. Sun angle likely a factor.
I-580 37°42.060090 N 121°50.429538 W Erratic Lane Positioning 71 0.02 0.12 Hugging left lane marker with semi alongside
I-580 37°42.048072 N 121°48.994944 W Lane Departure 70 -0.03 0.08 Lane departure left side unexpectedly with vehicle alongside
I-580 37°42.009078 N 121°47.531118 W Lane Departure 71 0.08 0.03 Lane departure right side in a corner
I-580 37°44.289552 N 121°33.396750 W Lane Departure 65 -0.03 -0.03 Lane departure right side. Sun angle likely a factor.
I-580 37°43.918302 N 121°32.966526 W Other 66 -0.01 -0.02 System will not engage. Sun angle likely a factor.

57 © 2020 American Automobile Association, Inc.
Active Driving Assistance
Figure 62: Subjective ratings during naturalistic evaluation of the 2019 Ford Edge Image Source: AAA
Location Latitude Longitude Event Type Speed (mph) Longitudinal Acc (G) Lateral Acc (G) Comments
I-580 37°42.230724 N 121°30.587646 W Other 78 -0.06 0.01 System will not engage. Sun angle likely a factor.
I-5 37°34.912026 N 121°19.328142 W Other 78 -0.02 -0.04 System will not engage. Sun angle likely a factor.
I-5 37°32.340396 N 121°15.995538 W Other 78 0.03 -0.04 System will not engage. Sun angle likely a factor.
I-5 37°24.131496 N 121°8.507748 W Erratic Lane Positioning 73 0.06 -0.02
I-5 37°23.921046 N 121°8.361372 W Erratic Lane Positioning 72 -0.06 -0.06
I-5 37°21.009258 N 121°7.094832 W Erratic Lane Positioning 73 0.03 -0.02 Vehicle swerved to the right
I-5 37°16.365186 N 121°5.753754 W Erratic Lane Positioning 73 -0.07 0.10
I-5 36°30.094284 N 120°27.328512 W Other 74 -0.01 0.02 Hugging left side of lane
I-5 36°28.421358 N 120°25.783758 W Erratic Lane Positioning 67 0.01 0.03
I-5 36°27.103842 N 120°24.525624 W Erratic Lane Positioning 74 -0.01 -0.03
I-5 36°21.104850 N 120°19.155132 W Lane Departure 76 -0.05 -0.12 Lane departure left side
I-5 36°18.069822 N 120°16.496868 W Erratic Lane Positioning 68 -0.01 -0.03
I-5 36°16.631100 N 120°15.514314 W Erratic Lane Positioning 80 0.04 0.03
I-5 36°15.451998 N 120°14.774142 W Lane Departure 74 -0.02 0.05 Lane departure right side
I-5 36°14.877840 N 120°14.410806 W Erratic Lane Positioning 70 -0.01 0.01
I-5 36°12.891660 N 120°13.161000 W Erratic Lane Positioning 78 0.04 0.05
I-5 36°11.351652 N 120°12.189882 W Erratic Lane Positioning 74 -0.02 -0.04
I-5 36°10.556712 N 120°11.641092 W Erratic Lane Positioning 74 0.01 0.02
I-5 36°8.453970 N 120°9.722640 W Lane Departure 74 -0.06 0.11 Lane departure right side upon approaching exit
I-5 36°8.077602 N 120°9.376572 W Lane Departure 74 0.00 -0.10
I-5 36°8.049852 N 120°9.352542 W Lane Departure 74 -0.03 -0.05
I-5 36°7.906770 N 120°9.221496 W Lane Departure 74 0.05 -0.02 Overcorrects, tries to correct itself, resulting in "ping-ponging". Left then right lane departure.
I-5 36°5.552826 N 120°7.072464 W Lane Departure 74 -0.02 0.01 Lane departure right side upon approaching exit
I-5 36°5.365356 N 120°6.900570 W Erratic Lane Positioning 74 -0.01 0.09
I-5 36°3.720654 N 120°4.668384 W Erratic Lane Positioning 78 -0.09 -0.01 Hugging right side of lane
I-5 35°54.742848 N 119°53.376366 W Lane Departure 78 0.02 0.00 Left side
I-5 35°53.362422 N 119°51.968244 W Lane Departure 75 0.07 -0.04 Left side
I-5 35°53.281998 N 119°51.888294 W Lane Departure 75 -0.05 -0.07 Left side
I-5 35°53.026002 N 119°51.644370 W Erratic Lane Positioning 75 -0.04 -0.07
I-5 35°52.789578 N 119°51.420468 W Lane Departure 75 -0.02 0.05
I-5 35°52.364682 N 119°51.017340 W Erratic Lane Positioning 75 0.02 -0.04
I-5 35°52.168542 N 119°50.831034 W Lane Departure 75 0.02 0.02 Left side
I-5 35°51.746874 N 119°50.432376 W Erratic Lane Positioning 75 -0.04 0.00
I-5 35°50.585514 N 119°49.393872 W Erratic Lane Positioning 75 0.08 -0.04
I-5 35°50.496780 N 119°49.321422 W Erratic Lane Positioning 75 0.01 0.00
I-5 35°50.145552 N 119°49.036218 W Erratic Lane Positioning 73 -0.02 0.09
I-5 35°49.643328 N 119°48.650418 W Lane Departure 72 0.01 -0.06 Right side
I-5 35°46.449666 N 119°46.267140 W Erratic Lane Positioning 77 -0.03 0.01
I-5 35°45.933312 N 119°45.881910 W Erratic Lane Positioning 77 0.00 0.01
I-5 35°41.885184 N 119°42.864870 W Erratic Lane Positioning 77 -0.06 0.04
I-5 35°40.837536 N 119°42.082446 W Erratic Lane Positioning 77 0.01 0.06
I-5 35°40.188642 N 119°41.599620 W Erratic Lane Positioning 77 -0.01 -0.07
I-5 35°39.943464 N 119°41.415888 W Erratic Lane Positioning 76 0.01 -0.22
I-5 35°39.358260 N 119°40.979700 W Erratic Lane Positioning 75 -0.01 -0.02
I-5 35°39.225480 N 119°40.880514 W Erratic Lane Positioning 75 -0.06 0.05
I-5 35°37.654506 N 119°39.717570 W Erratic Lane Positioning 77 -0.14 0.03
I-5 35°37.553202 N 119°39.641658 W Erratic Lane Positioning 76 0.02 0.02
I-5 35°37.415178 N 119°39.538920 W Erratic Lane Positioning 75 -0.02 -0.08
I-5 35°36.185724 N 119°38.588286 W Lane Departure 74 -0.02 0.01 Left side
I-5 35°35.067480 N 119°37.516326 W Lane Departure 74 0.01 -0.04 Left side
I-5 35°34.880862 N 119°37.336830 W Lane Departure 74 0.04 -0.08 Left side
I-5 35°34.779138 N 119°37.240584 W Other 74 0.01 -0.04 Having a hard time keeping/picking up the center line.
I-5 35°32.954676 N 119°35.324754 W Erratic Lane Positioning 74 0.02 0.00
I-5 35°31.796610 N 119°34.063764 W Lane Departure 74 0.00 0.03 Left side
I-5 35°31.624554 N 119°33.876498 W Lane Departure 74 0.04 -0.04 Left side
I-5 35°30.684618 N 119°32.854674 W Erratic Lane Positioning 74 0.00 0.03
I-5 35°30.611064 N 119°32.775456 W Erratic Lane Positioning 74 -0.02 0.05
I-5 35°30.303006 N 119°32.440716 W Erratic Lane Positioning 74 0.03 0.07
I-5 35°30.267330 N 119°32.401272 W Lane Departure 74 0.01 0.07 Right side
I-5 35°29.821734 N 119°31.917036 W Lane Departure 74 0.04 0.00 Right side
I-5 35°29.504406 N 119°31.513902 W Erratic Lane Positioning 74 0.01 -0.07
I-5 35°29.417982 N 119°31.394598 W Erratic Lane Positioning 74 -0.05 0.02
I-5 35°29.173470 N 119°31.061310 W Erratic Lane Positioning 74 0.04 -0.04
I-5 35°29.072778 N 119°30.922374 W Erratic Lane Positioning 74 -0.01 0.01
I-5 35°28.785852 N 119°30.527418 W Erratic Lane Positioning 74 0.01 0.01
I-5 35°28.770414 N 119°30.506202 W Lane Departure 74 0.09 -0.09 Lane departure left side from previous event.
I-5 35°28.018980 N 119°29.471250 W Erratic Lane Positioning 74 0.01 -0.05
I-5 35°27.576486 N 119°28.862904 W Lane Departure 74 0.01 0.01 Left side
I-5 35°26.783028 N 119°27.766908 W Erratic Lane Positioning 74 0.05 0.02
I-5 35°26.685708 N 119°27.633162 W Erratic Lane Positioning 74 -0.02 0.03
I-5 35°26.583804 N 119°27.492732 W Erratic Lane Positioning 74 0.04 0.06
I-5 35°26.418774 N 119°27.266184 W Lane Departure 74 -0.03 -0.01 Left side
I-5 35°22.326282 N 119°21.637320 W Lane Departure 74 0.02 -0.05 Right side
I-5 35°21.505002 N 119°20.476638 W Erratic Lane Positioning 68 0.03 -0.02
I-5 35°20.945196 N 119°19.684944 W Erratic Lane Positioning 74 0.03 0.03
I-5 35°19.629858 N 119°17.831316 W Lane Departure 74 0.02 -0.01
I-5 35°18.870432 N 119°16.760172 W Lane Departure 74 -0.01 -0.16 Left side
I-5 35°18.766014 N 119°16.616820 W Lane Departure 74 -0.05 0.03 Left side
I-5 35°14.213346 N 119°11.558700 W Lane Departure 74 -0.01 -0.05 Left side
I-5 35°11.493030 N 119°8.652174 W Lane Departure 74 0.00 -0.01 Right side
I-5 35°11.348166 N 119°8.490264 W Erratic Lane Positioning 74 0.01 -0.06

58 © 2020 American Automobile Association, Inc.
Active Driving Assistance
Figure 63: Subjective ratings during naturalistic evaluation of the 2019 Ford Edge Image Source: AAA
Location Latitude Longitude Event Type Speed (mph) Longitudinal Acc (G) Lateral Acc (G) Comments
I-5 35°10.478214 N 119°7.526802 W Erratic Lane Positioning 74 0.02 -0.05
I-5 35°9.778500 N 119°6.754164 W Lane Departure 74 0.00 0.10 Right side
I-5 35°7.940688 N 119°4.719192 W Lane Departure 74 -0.05 0.02 Left side
I-5 35°6.909594 N 119°3.580344 W Erratic Lane Positioning 74 0.01 0.03
I-5 35°6.189288 N 119°2.784618 W Erratic Lane Positioning 74 -0.07 0.05
I-5 35°5.395824 N 119°1.929018 W Erratic Lane Positioning 74 0.03 -0.11
I-5 35°5.235150 N 119°1.756764 W Lane Departure 74 -0.01 0.00
I-5 35°4.419282 N 119°0.883932 W Erratic Lane Positioning 74 -0.08 0.08
I-5 35°4.391598 N 119°0.853626 W Lane Departure 74 0.14 -0.11 Lane departure right side from previous event.
I-5 34°53.418864 N 118°54.811638 W Other 57 -0.04 0.00 Hugging left side of lane in turn
I-5 34°47.762460 N 118°51.664686 W Other 69 -0.04 -0.06
I-5 34°29.632452 N 118°37.352646 W Lane Departure 71 0.00 0.01 Left side

59 © 2020 American Automobile Association, Inc.
Active Driving Assistance
Figure 64: Subjective ratings during naturalistic evaluation of the 2019 Ford Edge Image Source: AAA
Ford Edge
Driver 2 Driver 3
LA to SF SF to LA LA to SF SF to LA LA to SF SF to LA LA to SF SF to LA LA to SF SF to LA Totals/Avg
FCW warning timing n/a n/a n/a n/a n/a n/a n/a n/a
1. Too late 1 1
2. Just right 1 1
3. Too early 0
LDW warning timing
1. Too late 1 1 1 1 1 1 1 1 8
2. Just right 1 1 2
3. Too early 0
Comfort of ACC braking
1. Too late 1 1 1 3
2. Just right 1 1 1 1 1 1 6
3. Too early 1 1
Comfort of ACC acceleration
1. Too slow 1 1 2
2. Just right 1 1 1 1 1 1 1 1 8
3. Too fast 0
Lane Keeping Correction
1. Too much correction 0
2. Just right 1 1
3. Not enough or no correction 1 1 1 1 1 1 1 1 1 9
Please rate the following from 1 to
5, where 5 is the best
Awareness of system enabled 3 4 2 3 4 3 3 3 3 3 3.1
Awareness of system disengaged 3 3 2 3 4 3 3 3 4 2 3
Understanding of warnings 4 3 2 3 4 4 5 5 3 3 3.6
For ACC, which headway setting
did you feel most comfortable
using?
1. Smallest 1 1 1 1 1 1 6
2. Middle 1 1 1 1 4
3. Largest 0
For Lane Centering, what was the
tendency of the system
1. Stay in the middle 0
2. Hug the left of the lane 1 1 1 1 1 1 1 7
3. Hug the right of the lane 1 1 1 3
For Lane Centering, did the system
1. Compliment the drive 1 1 2
2. Neither enhance or detract 1 1 1 3
3. Fight the wheel 1 1 1 1 1 5
Overall Trust of the Level 2 system 2 2 1 1 4 4 1 2 3 2 2
Did the Level 2 system enhance
the driving experience during
highway driving?
In Traffic? n/a n/a n/a n/a n/a
1. Yes 1 1 1 3
2. Neither enhance or detract 0
3. No 1 1 2
In Non-Traffic?
1. Yes 1 1 2
2. Neither enhance or detract 1 1 1 3
3. No 1 1 1 1 1 5
Driver 1 Driver 4 Driver 5 Driver 6
L2 Project Subjective Ratings

60 © 2020 American Automobile Association, Inc.
Active Driving Assistance
11.4 2020 Kia Telluride
Figure 65: Subjective ratings during naturalistic evaluation of the 2020 Kia Telluride Image Source: AAA
Location Latitude Longitude Event Type Speed (mph) Longitudinal Acc (G) Lateral Acc (G) Comments
Hwy 101 34°6.970950 N 118°20.210160 W Lane Departure 58 0.00 -0.05 Left side
Hwy 101 34°7.474608 N 118°20.591124 W Lane Departure 57 0.07 -0.04
Hwy 101 34°7.695414 N 118°20.778996 W Erratic Lane Positioning 58 -0.01 0.07
Hwy 101 34°9.011310 N 118°22.433346 W Erratic Lane Positioning 59 -0.05 -0.05
Hwy 101 34°9.272658 N 118°22.843776 W Erratic Lane Positioning 62 0.05 -0.03
Hwy 101 34°9.381840 N 118°24.154080 W Erratic Lane Positioning 6 -0.02 0.02
Hwy 101 34°9.932946 N 118°29.547732 W Erratic Lane Positioning 66 -0.03 -0.23
Hwy 101 34°9.999630 N 118°29.688912 W Lane Departure 65 -0.02 -0.04 Left side
Hwy 101 34°10.422702 N 118°33.587724 W Erratic Lane Positioning 39 0.09 0.04
Hwy 101 34°10.098774 N 118°34.953000 W Lane Departure 40 -0.12 0.00 Left side
Hwy 101 34°10.090428 N 118°35.009070 W Failure to Slow/Stop 37 0.02 0.03
Hwy 101 34°9.074334 N 118°41.509104 W Erratic Lane Positioning 67 -0.01 0.15
Hwy 101 34°8.380128 N 118°43.876230 W Lane Departure 68 -0.06 -0.04
Hwy 101 34°9.248340 N 118°49.178928 W Erratic Lane Positioning 68 0.03 -0.09
Hwy 101 34°11.067816 N 118°55.543080 W Lane Departure 71 -0.07 -0.16 Left side in a right curve
Hwy 101 34°12.042840 N 118°57.853704 W Lane Departure 70 -0.04 -0.04 Left side in a right curve
Hwy 101 34°12.330138 N 118°59.311458 W Lane Departure 70 -0.04 -0.27 Left side in a right curve
Hwy 101 34°14.709114 N 119°11.781648 W Lane Departure 70 0.01 0.06 Left side
Hwy 101 34°15.082074 N 119°12.533658 W Failure to Slow/Stop 56 0.03 -0.08
Hwy 101 34°22.557000 N 119°28.541112 W Lane Departure 70 -0.06 -0.17 Left side in a right curve
Hwy 101 34°22.637988 N 119°28.764348 W Erratic Lane Positioning 66 0.00 -0.16
Hwy 101 34°22.824540 N 119°28.905702 W Erratic Lane Positioning 68 0.00 -0.01
Hwy 101 34°23.794290 N 119°30.673446 W Lane Departure 53 -0.02 -0.05 Lane departure, right side
Hwy 101 34°23.891946 N 119°30.745152 W Lane Departure 57 0.00 -0.11 Lane departure, right side
Hwy 101 34°24.230772 N 119°31.731714 W Lane Departure 65 0.05 0.09 Right side, during left curve
Hwy 101 34°24.956550 N 119°33.587982 W Lane Departure 67 -0.01 0.23 Left side
Hwy 101 34°24.951714 N 119°34.718052 W Lane Departure 67 0.03 -0.06
Hwy 101 34°25.258068 N 119°37.324206 W Lane Departure 67 0.03 -0.09 Left side, after lane change
Hwy 101 34°25.257174 N 119°37.478874 W Lane Departure 68 0.03 -0.08
Hwy 101 34°25.202556 N 119°38.519802 W Lane Departure 68 0.05 -0.18 Left side, during right curve
Hwy 101 34°28.321824 N 120°11.385162 W Erratic Lane Positioning 61 -0.01 -0.06
Hwy 101 34°30.074442 N 120°13.701768 W Lane Departure 68 0.07 0.25 Right side
Hwy 101 34°30.438108 N 120°13.582188 W Lane Departure 69 -0.02 -0.27 Left side during right curve
Hwy 101 34°33.474924 N 120°11.527458 W Lane Departure 69 0.02 -0.14 Left side during right curve
Hwy 101 34°41.169108 N 120°9.411846 W Lane Departure 65 0.03 0.06 Right side during left curve, broken lane marking right side
Hwy 101 35°10.916394 N 120°42.060018 W Lane Departure 68 -0.01 -0.20 Left side
Hwy 101 35°11.063196 N 120°42.082386 W Lane Departure 68 0.03 -0.03 Left side
Hwy 101 35°11.636880 N 120°42.004236 W Lane Departure 69 -0.03 0.10 Left side, vehicle is having a hard time tracking during curves
Hwy 101 35°12.410688 N 120°41.797674 W Lane Departure 69 0.06 0.04 Right side
Hwy 101 35°14.553102 N 120°40.993818 W Lane Departure 64 0.01 -0.17 Left side during right curve
Hwy 101 35°17.506134 N 120°39.357498 W Lane Departure 69 -0.02 -0.25 Left side during right curve
Hwy 101 35°17.670090 N 120°38.447478 W Other 69 0.00 -0.16 System turned off on an S curve
Hwy 101 35°17.759868 N 120°37.869900 W Lane Departure 69 -0.05 0.04 Right side during left curve
Hwy 101 35°17.858760 N 120°37.679682 W Lane Departure 68 0.00 0.04 Right side
Hwy 101 35°17.994960 N 120°37.562880 W Lane Departure 66 -0.04 0.11 Left side
Hwy 101 35°19.287054 N 120°37.285764 W Lane Departure 64 0.04 -0.12 Right side during right curve
Hwy 101 35°19.334892 N 120°37.284360 W Lane Departure 64 0.01 -0.23 Left side
Hwy 101 35°21.859812 N 120°38.296200 W Lane Departure 68 0.07 0.20 Once again, lane departure, going off road. Right side during left curve
Hwy 101 35°22.060104 N 120°38.444946 W Lane Departure 69 0.09 -0.20 Left side during right curve
Hwy 101 35°39.112134 N 120°41.432748 W Lane Departure 69 0.07 0.17 Right side during left curve
Hwy 101 35°49.577292 N 120°45.572382 W Lane Departure 74 -0.06 -0.08 Left side during right curve
Hwy 101 35°50.337966 N 120°45.458904 W Lane Departure 74 0.00 0.13 Right side during left curve
Hwy 101 35°50.454396 N 120°45.482472 W Lane Departure 74 0.05 0.12 Right side during left curve
Hwy 101 35°53.191908 N 120°50.499696 W Lane Departure 74 -0.04 -0.05 Left side after right curve
Hwy 101 35°57.675480 N 120°53.100960 W Lane Departure 74 0.00 0.02 Right side
Hwy 101 35°57.885156 N 120°53.314854 W Lane Departure 74 0.00 0.22 Right side
Hwy 101 35°58.173804 N 120°53.697348 W Lane Departure 74 0.00 -0.17 Left side during right curve
Hwy 101 35°59.130846 N 120°54.188652 W Lane Departure 74 0.01 0.06 Right side
Hwy 101 36°31.087686 N 121°26.468460 W Lane Departure 66 -0.01 0.15 Road curved to the left and it just kept drifting to the right and crossed over the line
Hwy 101 36°49.256376 N 121°37.827150 W Lane Departure 69 -0.04 0.03 Through that last turn, it could not keep up, crossed the line. Right side during left curve.
Hwy 101 37°8.603436 N 121°38.579238 W Other 63 0.05 0.05 System disengaged without warning
Hwy 101 37°14.637648 N 121°46.323042 W Erratic Lane Positioning 72 0.00 -0.03 Hugging right side near tractor trailer
I-680 37°33.703230 N 121°54.349764 W Erratic Lane Positioning 18 -0.24 -0.04 Hugging left of the road
I-680 37°35.711232 N 121°52.337544 W Erratic Lane Positioning 68 -0.02 -0.04 Right side of the lane about 15 seconds ago
I-680 37°36.009480 N 121°52.358382 W Erratic Lane Positioning 72 0.04 -0.01 Left side of lane
I-680 37°36.214356 N 121°52.300290 W Erratic Lane Positioning 72 -0.03 0.28 Right side of lane
I-680 37°37.366224 N 121°52.793538 W Erratic Lane Positioning 74 0.09 -0.09 Left side of lane
I-680 37°54.776088 N 122°4.035534 W Lane Departure 63 0.07 0.08 There was a lane departure in that last turn
I-680 37°50.830374 N 122°1.645062 W Failure to Slow/Stop 53 -0.14 0.18 Late detection of lead vehicle

61 © 2020 American Automobile Association, Inc.
Active Driving Assistance
Figure 66: Subjective ratings during naturalistic evaluation of the 2020 Kia Telluride Image Source: AAA
Location Latitude Longitude Event Type Speed (mph) Longitudinal Acc (G) Lateral Acc (G) Comments
I-680 37°44.332638 N 121°57.116802 W Other 58 0.08 -0.02 Slow to accelerate after lane change with no lead vehicle
I-680 37°43.642812 N 121°56.602134 W Other 66 0.09 -0.06 Deceleration with no lead vehicle
I-580 37°42.058386 N 121°49.903560 W Other 65 -0.01 -0.05 Deceleration with no lead vehicle
I-580 37°42.045894 N 121°48.436464 W Other 62 0.00 -0.01 Deceleration with no lead vehicle
I-580 37°42.102342 N 121°46.056714 W Other 57 -0.05 0.01 Late detection of tractor trailer ahead
I-580 37°42.167088 N 121°45.530460 W Other 56 0.01 -0.03 Deceleration with no lead vehicle
I-580 37°42.148020 N 121°44.428560 W Other 61 0.05 -0.01 Inappropriate acceleration into a curve
I-580 37°42.398238 N 121°43.749102 W Other 64 0.01 0.02 Deceleration with no lead vehicle
I-580 37°42.787332 N 121°42.817836 W Failure to Slow/Stop 66 0.12 0.06 Accelerating with lead vehicle ahead
I-580 37°43.266516 N 121°32.242032 W Other 69 0.00 0.04 Tried to take exit lane
I-5 37°25.103280 N 121°9.117852 W Erratic Lane Positioning 70 0.01 0.01 Slight "ping-ponging"
I-5 37°22.016214 N 121°7.420770 W Erratic Lane Positioning 72 -0.02 -0.02
I-5 36°56.924754 N 120°51.794382 W Erratic Lane Positioning 71 0.03 -0.01
I-5 36°56.181030 N 120°50.885304 W Erratic Lane Positioning 71 0.03 -0.05
I-5 36°48.198222 N 120°44.510286 W Erratic Lane Positioning 73 -0.01 -0.03
I-5 36°46.146468 N 120°43.100646 W Erratic Lane Positioning 73 0.00 -0.05
I-5 35°36.763590 N 119°39.053286 W Other 78 0.05 -0.03 System Disengagement
I-5 35°31.995684 N 119°34.278186 W Other 78 -0.01 0.02 System Disengagement about 20 seconds ago, very subtle and hard to notice
I-5 35°31.579620 N 119°33.824592 W Other 78 -0.02 -0.01 System Disengagement about 20 seconds ago, very subtle and hard to notice
I-5 35°30.902046 N 119°33.087978 W Other 78 0.00 -0.03 System will not engage
I-5 35°24.102744 N 119°24.089478 W Erratic Lane Positioning 78 -0.06 -0.01 System wanted to abruptly take the exit and veered off the road
I-5 35°15.887130 N 119°13.342386 W Other 78 0.05 -0.02 System Disengagement, not obvious
I-5 34°55.666830 N 118°55.721706 W Lane Departure 71 0.08 -0.13
I-5 34°50.370816 N 118°51.800466 W Erratic Lane Positioning 70 0.07 -0.12
I-5 34°50.249082 N 118°51.786186 W Lane Departure 70 -0.02 -0.19 Left side during right curve
I-5 34°49.165182 N 118°52.815696 W Erratic Lane Positioning 64 -0.02 0.06
I-5 34°49.093002 N 118°52.890660 W Erratic Lane Positioning 63 0.01 0.05
I-5 34°49.083714 N 118°52.900002 W Lane Departure 62 -0.01 -0.02
I-5 34°38.058594 N 118°43.936242 W Lane Departure 69 -0.02 -0.04 Right side during right curve
I-5 34°37.416810 N 118°43.136862 W Lane Departure 69 0.00 -0.07 Right side during right curve
I-5 34°19.964904 N 118°30.459606 W Lane Departure 68 0.02 -0.12 Left side during right curve
I-5 34°16.904796 N 118°27.418068 W Erratic Lane Positioning 72 0.01 0.04
I-5 34°13.768692 N 118°23.659614 W Lane Departure 76 0.01 -0.01
I-5 34°13.623594 N 118°23.359914 W Lane Departure 73 -0.20 0.46 Right side
I-5 34°10.866336 N 118°18.843546 W Lane Departure 39 -0.64 0.15 Left side
I-5 34°9.204096 N 118°17.165088 W Lane Departure 56 0.03 0.03
I-5 34°9.125376 N 118°16.955184 W Lane Departure 60 0.59 -0.57 Right side during right curve
I-5 34°6.142836 N 118°15.000390 W Other 10 -0.01 0.03 The steering wheel icon is green but the lane keeping icon is white
I-5 34°4.675710 N 118°13.764996 W Failure to Slow/Stop 13 0.00 0.00 Car cut in front of vehicle, system slow to detect
I-5 34°4.569444 N 118°13.886982 W Other 0 -0.06 0.00 System disengagement, sun angle likely a factor. Adaptive cruise is still operational.

62 © 2020 American Automobile Association, Inc.
Active Driving Assistance
Figure 67: Subjective ratings during naturalistic evaluation of the 2020 Kia Telluride Image Source: AAA
KIA Telluride
Driver 2 Driver 3
LA to SF SF to LA LA to SF SF to LA LA to SF SF to LA LA to SF SF to LA LA to SF SF to LA Totals/Avg
FCW warning timing n/a n/a n/a n/a n/a n/a n/a n/a n/a
1. Too late 0
2. Just right 1 1
3. Too early 0
LDW warning timing
1. Too late 1 1 1 1 1 1 6
2. Just right 1 1 1 1 4
3. Too early 0
Comfort of ACC braking
1. Too late 1 1 2
2. Just right 1 1 1 1 1 1 1 7
3. Too early 1 1
Comfort of ACC acceleration
1. Too slow 1 1 1 1 1 5
2. Just right 1 1 1 1 1 5
3. Too fast 0
Lane Keeping Correction
1. Too much correction 0
2. Just right 1 1 1 1 1 1 6
3. Not enough or no correction 1 1 1 1 4
Please rate the following from 1 to
5, where 5 is the best
Awareness of system enabled 4 3 2 4 4 4 4 2 2 4 3.3
Awareness of system disengaged 2 3 2 3 1 4 3 2 3 2 2.5
Understanding of warnings 3 3 3 3 5 4 5 5 3 3 3.7
For ACC, which headway setting did
you feel most comfortable using?
1. Smallest 1 1 1 1 1 1 6
2. Middle 1 1 1 1 4
3. Largest 0
For Lane Centering, what was the
tendency of the system
1. Stay in the middle 1 1 1 1 1 1 1 1 8
2. Hug the left of the lane 1 1
3. Hug the right of the lane 1 1
For Lane Centering, did the system
1. Compliment the drive 1 1 1 1 1 1 1 7
2. Neither enhance or detract 1 1 1 3
3. Fight the wheel 0
Overall Trust of the Level 2 system 4 4 3 3 3 4 3 3 3 3 3
Did the Level 2 system enhance the
driving experience during highway
driving?
In Traffic? n/a n/a
1. Yes 1 1 1 1 1 5
2. Neither enhance or detract 1 1 2
3. No 1 1
In Non-Traffic? n/a n/a
1. Yes 1 1 1 1 1 1 1 7
2. Neither enhance or detract 1 1
3. No 0
L2 Project Subjective Ratings
Driver 1 Driver 4 Driver 5 Driver 6

63 © 2020 American Automobile Association, Inc.
Active Driving Assistance
11.5 2020 Subaru Outback
Figure 68: Subjective ratings during naturalistic evaluation of the 2020 Subaru Outback Image Source: AAA
Location Latitude Longitude Event Type Speed (mph) Longitudinal Acc (G) Lateral Acc (G) Comments
Hwy 101 34°25.007551 N 119°34.031796 W Erratic Lane Positioning 56 0.06 0.02 Hugging left lane marker
Hwy 101 34°38.969566 N 120°13.820970 W Lane Departure 65 0.01 -0.32 Lane departure left side
Hwy 101 34°29.293320 N 120°13.568118 W Lane Departure 65 0.02 -0.01 Lane departure left side upon entering tunnel
Hwy 101 34°29.515476 N 120°13.562508 W Lane Departure 66 0.01 0.28 Lane departure right side on new pavement
Hwy 101 34°29.682774 N 120°13.779870 W Lane Departure 66 -0.01 -0.62 Lane departure left side gradual curve
Hwy 101 34°29.963580 N 120°13.813554 W Lane Departure 67 0.05 -0.38 Lane departure left side gradual curve
Hwy 101 34°30.291350 N 120°13.580820 W Lane Departure 70 -0.07 0.40 Lane departure vehicle followed exit lane
Hwy 101 34°31.149546 N 120°12.929754 W Other 70 -0.03 -0.35 System disengagement without obvious cause
Hwy 101 34°31.41956 N 120°12.539322 W Other 70 0.05 -0.19 System disengagement without obvious cause
Hwy 101 34°31.916814 N 120°11.785836 W Erratic Lane Positioning 70 0.08 0.05 Hugging left lane marker
Hwy 101 34°34.168086 N 120°11.446650 W Lane Departure 70 0.05 0.09 Lane departure right side on very slight curve
Hwy 101 34°34.934214 N 120°11.631174 W Other 70 -0.07 -0.29 System disengagement upon entering slight right curve
Hwy 101 34°35.209806 N 120°11.476452 W Other 71 0.00 0.27 System disengagement in slight left curve
Hwy 101 34°35.526162 N 120°11.627340 W Other 71 -0.01 -0.26 System disengagement upon entering slight right curve
Hwy 101 34°37.293138 N 120°11.351592 W Other 71 0.04 -0.14 System disengagement upon encountering merge lane
Hwy 101 35°38.348197 N 120°41.041486 W Other 56 -0.07 0.08 System slowed for vehicle already in exit lane
Hwy 101 36°12.241458 N 121°8.014292 W Other 59 0.03 0.02 System disengagement upon encountering fork for exit lane
Hwy 101 36°12.177230 N 121°8.507047 W Erratic Lane Positioning 58 -0.04 0.15 Hugging right lane marker upon passing wide merge lane on right
Hwy 101 36°11.877459 N 121°9.045803 W Other 65 0.02 -0.23 System disengagement within slight right curve
Hwy 101 36°25.863863 N 121°20.217813 W Lane Departure 72 0.05 -0.26 Lane departure right side with simultaneous system disengagement
Hwy 101 36°26.093192 N 121°20.367557 W Lane Departure 69 0.03 0.21 Lane departure left side with simultaneous system disengagement with merge lane alongside
Hwy 101 36°31.397898 N 121°27.735822 W Lane Departure 71 -0.02 -0.03 Lane departure right side upon encountering exit lane
Hwy 101 36°33.141590 N 121°30.018346 W Lane Departure 71 0.00 -0.03 Lane departure left side without obvious cause
Hwy 101 36°48.095525 N 121°39.611161 W Lane Departure 66 0.01 -0.13 Lane departure right side upon passing wide merge lane on right
Hwy 101 36°49.529242 N 121°37.698798 W Erratic Lane Positioning 68 -0.01 0.18 Hugging left lane marker in slight left curve
Hwy 101 36°51.749850 N 121°37.057782 W Lane Departure 64 -0.05 -0.23 Lane departure left side with simultaneous system disengagement in slight right curve
Hwy 101 36°51.622698 N 121°36.547626 W Erratic Lane Positioning 65 0.04 -0.79 Hugging left lane marker in slight left curve
Hwy 101 36°51.686034 N 121°35.041320 W Lane Departure 67 -0.02 -0.23 Lane departure left side without obvious cause
Hwy 101 36°51.745230 N 121°34.692900 W Lane Departure 68 -0.11 0.33 Lane departure right side on slight left curve
Hwy 101 36°55.698420 N 121°32.826624 W Lane Departure 66 -0.10 0.17 Lane departure left side with guardrail alongside
Hwy 101 37°8.382618 N 121°38.363844 W Other 64 0.12 0.06 System having difficulty recognizing lane markers (there is also black striping) and will not engage
Hwy 101 37°17.891557 N 121°48.707339 W Erratic Lane Positioning 71 0.00 0.10 "Ping-ponging" within lane
Hwy 101 37°20.276149 N 121°50.945424 W Lane Departure 54 0.01 -0.02 Lane departure left side with barrier alongside
I-680 37°30.345552 N 121°56.054676 W Erratic Lane Positioning 0 0.03 0.00 System favoring right side of lane in traffic
I-680 37°35.403596 N 121°52.215109 W Erratic Lane Positioning 50 0.00 0.16 System hugging left side with barrier alongside
I-680 37°42.225979 N 121°55.430308 W Erratic Lane Positioning 65 0.03 0.04 System hugging left side without obvious cause
I-680 37°48.936855 N 121°59.592683 W Other 59 -0.01 0.03 System disengagement upon encountering faded lane markers
I-680 37°53.896984 N 122°4.281123 W Lane Departure 63 -0.10 0.19 System hugging left lane marker before crossing markers on bridge with simultaneous disengagement
I-680 37°53.129784 N 122°3.317876 W Lane Departure 70 -0.03 0.12 Lane departure left side upon encountering repaved roadway
I-680 37°52.829988 N 122°3.012798 W Other 71 0.08 -0.01 System disengagement while simultaneous left side lane departure upon encountering overpass
I-680 37°47.713623 N 121°59.079360 W Erratic Lane Positioning 61 0.00 -0.05 System hugging right lane marker with vehicle alongside
I-680 37°46.602108 N 121°58.509264 W Other 71 0.02 0.06 System will not engage. Sun angle likely a factor.
I-680 37°45.854916 N 121°58.100592 W Other 71 0.04 -0.02 System still will not engage. Sun angle likely a factor.
I-680 37°45.118192 N 121°57.619000 W Other 71 0.02 -0.01 System still will not engage. Sun angle likely a factor.
I-680 37°43.567818 N 121°56.547342 W Erratic Lane Positioning 66 -0.01 -0.03 System hugging right shoulder without obvious cause
I-580 37°42.818244 N 121°42.748980 W Lane Departure 64 0.04 -0.02 Lane departure right side without obvious cause
I-580 37°42.962632 N 121°42.413827 W Erratic Lane Positioning 65 0.00 -0.10 System hugging right lane marker without obvious cause
I-580 37°43.940346 N 121°37.817328 W Lane Departure 65 -0.05 -0.04 Lane departure left side upon passing underneath overpass
I-5 37°44.157088 N 121°33.235834 W Other 71 -0.01 -0.04 System will not engage. Sun angle likely a factor.
I-5 37°40.803494 N 121°28.228093 W Erratic Lane Positioning 64 0.08 0.01 System hugging right shoulder. Sun angle likely a factor.
I-5 37°40.712028 N 121°28.076562 W Erratic Lane Positioning 63 0.00 -0.02 System hugging right shoulder in a continuation of last event. Sun angle likely a factor.
I-5 37°40.670147 N 121°28.007460 W Erratic Lane Positioning 59 0.01 -0.04 System hugging right shoulder in a continuation of last event. Sun angle likely a factor.
I-5 37°40.542366 N 121°27.796621 W Erratic Lane Positioning 57 0.02 -0.04 System hugging right shoulder in a continuation of last event. Sun angle likely a factor.
I-5 37°40.452077 N 121°27.648197 W Other 58 0.01 0.08 System attempted to follow exit lane and disengaged
I-5 37°38.767008 N 121°24.868500 W Other 69 0.01 -0.02 System attempted to follow exit lane and disengaged
I-5 37°35.647938 N 121°20.281998 W Lane Departure 69 -0.04 -0.03 Lane departure left shoulder. Sun angle likely a factor.
I-5 37°35.647938 N 121°20.281998 W Erratic Lane Positioning 69 -0.04 0.02 System hugging right shoulder. Sun angle likely a factor.
I-5 37°34.087650 N 121°18.260472 W Other 68 -0.01 -0.06 System disengaged. Sun angle likely a factor.
I-5 37°32.537937 N 121°16.246935 W Other 69 0.02 -0.04 System will not engage. Sun angle likely a factor.
I-5 37°31.748897 N 121°15.258966 W Other 69 -0.06 -0.05 System still will not engage. Sun angle likely a factor.
I-5 37°14.805670 N 121°5.353996 W Erratic Lane Positioning 75 -0.04 -0.02 System hugging right lane marker while passing under overpass. Sun angle likely a factor.
I-5 37°3.544692 N 120°58.340694 W Lane Departure 76 -0.02 -0.08 Lane departure right side. Changing position of lane marker and/or sun angle likely factors.
I-5 36°57.853770 N 120°52.926283 W Erratic Lane Positioning 76 -0.01 -0.01 System hugging left lane shoulder. Sun angle likely a factor.
I-5 36°44.042040 N 120°41.654070 W Lane Departure 75 0.02 0.03 Lane departure right side. Sun angle likely a factor.
I-5 35°53.314446 N 119°51.919266 W Erratic Lane Positioning 76 0.08 -0.01 System hugging left lane marker with vehicle alongside
I-5 35°34.633314 N 119°37.099206 W Other 76 -0.10 -0.02 System will not engage.
I-5 35°33.453393 N 119°35.862499 W Erratic Lane Positioning 76 -0.03 0.01 System hugging right lane marker with tractor trailer alongside
I-5 35°32.416579 N 119°34.732901 W Erratic Lane Positioning 76 0.03 0.01 System "ping-ponging" within lane
I-5 35°31.154797 N 119°33.362881 W Erratic Lane Positioning 76 -0.06 -0.05 System hugging right shoulder

64 © 2020 American Automobile Association, Inc.
Active Driving Assistance
Figure 69: Subjective ratings during naturalistic evaluation of the 2020 Subaru Outback Image Source: AAA
Location Latitude Longitude Event Type Speed (mph) Longitudinal Acc (G) Lateral Acc (G) Comments
I-5 35°31.102896 N 119°33.307122 W Lane Departure 74 0.04 0.10 Lane departure left side resulting from "ping-ponging" in continuation from last event
I-5 35°30.972882 N 119°33.165210 W Erratic Lane Positioning 70 -0.01 0.01 System hugging left lane marker with vehicle passing alongside
I-5 35°30.727398 N 119°32.898252 W Erratic Lane Positioning 68 0.03 0.09 System hugging left lane marker with vehicle passing alongside
I-5 35°30.580398 N 119°32.737644 W Lane Departure 68 -0.04 -0.03 Lane departure right shoulder. Pavement darker than adjacent lane.
I-5 35°30.458508 N 119°32.604888 W Lane Departure 68 -0.02 -0.02 Lane departure right shoulder. Pavement darker than adjacent lane.
I-5 35°26.529558 N 119°27.411090 W Erratic Lane Positioning 76 0.07 -0.15 System hugging right lane marker with tractor trailer alongside
I-5 35°24.936282 N 119°25.228212 W Lane Departure 76 0.03 0.07 Lane departure left lane marker with vehicle passing alongside. Pavement darker than adjacent lane.
I-5 35°19.792639 N 119°18.058679 W Lane Departure 76 0.00 0.03 Lane departure left lane marker. Dark strips down lane.
I-5 35°19.733027 N 119°17.973439 W Lane Departure 76 0.02 -0.09 Lane departure right side resulting from "ping-ponging" in continuation from last event
I-5 35°14.803582 N 119°12.189099 W Other 76 0.02 -0.01 System will not engage. Dark strips down lane.
I-5 35°9.542437 N 119°6.488746 W Erratic Lane Positioning 77 -0.04 -0.02 System hugging right lane marker with tractor trailer alongside
I-5 35°1.158750 N 118°57.491184 W Other 77 -0.03 -0.06 System disengaged upon encountering faded lane markers and older pavement
I-5 34°59.689890 N 118°56.892198 W Other 76 -0.03 -0.01 System will not engage. Worn lane markers and older pavement
I-5 34°55.951782 N 118°55.854582 W Other 71 0.00 0.31 System disengagement without obvious cause
I-5 34°55.566468 N 118°55.725186 W Lane Departure 71 -0.02 0.18 Lane departure right side and simultaneous system disengagement without obvious cause
I-5 34°55.392582 N 118°55.611192 W Lane Departure 70 -0.02 0.01 Lane departure left side and simultaneous system disengagement without obvious cause
I-5 34°55.034561 N 118°55.510277 W Lane Departure 71 -0.01 0.05 Lane departure right side and simultaneous system disengagement without obvious cause
I-5 34°54.607046 N 118°55.444166 W Lane Departure 63 0.06 0.02 Lane departure right side and simultaneous system disengagement with patched pavement alongside
I-5 34°50.173158 N 118°51.804312 W Other 75 0.01 -0.14 System disengagement while passing under overpass
I-5 34°49.179977 N 118°52.799453 W Other 75 0.02 0.02 System will not engage. Sun angle likely a factor.
I-5 34°19.997087 N 118°30.481111 W Lane Departure 76 0.07 -0.31 Lane departure left side with simultaneous system disengagement
I-5 34°16.783230 N 118°27.346830 W Other 72 -0.03 0.07 System disengagement. Faded lane markers possible cause.
I-5 34°16.274364 N 118°26.890686 W Other 64 -0.06 0.04 System disengagement. Faded lane markers possible cause.
I-5 34°14.797464 N 118°25.471188 W Other 69 0.03 0.03 System disengagement. Faded lane markers possible cause.
I-5 34°13.354770 N 118°22.221636 W Erratic Lane Positioning 70 0.04 0.14 System hugging left lane marker without obvious cause.
I-5 34°13.311387 N 118°21.905656 W Other 68 -0.01 0.07 System disengagement without obvious cause
I-5 34°12.693829 N 118°20.881029 W Erratic Lane Positioning 74 0.03 -0.05 System hugging right lane marker. Shadow casted over roadway possible cause.
I-5 34°12.353972 N 118°20.573202 W Other 56 -0.04 -0.04 System disengagement without obvious cause
I-5 34°11.590593 N 118°19.771899 W Other 32 0.02 -0.05 System will not stay engaged in traffic
I-5 34°10.923942 N 118°18.892326 W Other 41 0.03 0.01 System disengagement in moderate traffic.
I-5 34°10.680725 N 118°18.593874 W Other 42 -0.02 0.01 System disengagement in moderate traffic.
I-5 34°9.891480 N 118°17.821326 W Other 48 -0.12 -0.02 System disengagement in moderate traffic.
I-5 34°9.335062 N 118°17.374926 W Other 61 -0.02 0.10 System disengagement without obvious cause
I-5 34°9.125607 N 118°16.965045 W Erratic Lane Positioning 65 0.12 0.16 System hugging left lane marker while passing under overpass

65 © 2020 American Automobile Association, Inc.
Active Driving Assistance
Figure 70: Subjective ratings during naturalistic evaluation of the 2020 Subaru Outback Image Source: AAA
Subaru Outback
Driver 2 Driver 3
LA to SF SF to LA LA to SF SF to LA LA to SF SF to LA LA to SF SF to LA LA to SF SF to LA Totals/Avg
FCW warning timing n/a n/a n/a n/a n/a n/a
1. Too late 0
2. Just right 1 1 1 3
3. Too early 1 1
LDW warning timing
1. Too late 1 1 2
2. Just right 1 1 1 1 1 1 1 1 8
3. Too early 0
Comfort of ACC braking
1. Too late 1 1
2. Just right 1 1 1 1 1 1 1 1 1 9
3. Too early 0
Comfort of ACC acceleration
1. Too slow 1 1
2. Just right 1 1 1 1 1 1 1 1 1 9
3. Too fast 0
Lane Keeping Correction
1. Too much correction 1 1 2
2. Just right 1 1 1 1 4
3. Not enough or no correction 1 1 1 1 4
Please rate the following from 1 to
5, where 5 is the best
Awareness of system enabled 4 4 3 3 3 5 5 5 5 5 4.2
Awareness of system disengaged 4 3 4 3 2 4 5 5 5 5 4
Understanding of warnings 3 3 3 3 2 4 5 5 4 4 3.6
For ACC, which headway setting did
you feel most comfortable using?
1. Smallest 1 1 1 1 1 1 6
2. Middle 1 1 1 3
3. Largest 1 1
For Lane Centering, what was the
tendency of the system
1. Stay in the middle 1 1 1 1 1 0.5 1 1 1 8.5
2. Hug the left of the lane 0.5 0.5 1
3. Hug the right of the lane 0.5 0.5
For Lane Centering, did the system
1. Compliment the drive 1 1 1 1 0.5 1 5.5
2. Neither enhance or detract 1 1 1 3
3. Fight the wheel 1 0.5 1.5
Overall Trust of the Level 2 system 4 4 2 3 3 4 4 4 4 4
Did the Level 2 system enhance the
driving experience during highway
driving?
In Traffic? n/a
1. Yes 1 1 1 1 1 1 6
2. Neither enhance or detract 1 1 2
3. No 1 1
In Non-Traffic?
1. Yes 1 1 1 1 1 1 1 7
2. Neither enhance or detract 1 1 2
3. No 1 1
L2 Project Subjective Ratings
Driver 1 Driver 4 Driver 5 Driver 6

66 © 2020 American Automobile Association, Inc.
Active Driving Assistance
12 Bibliography
[1] SAE International, "Taxonomy and Definitions for Terms Related to Driving Automation Systems for On-
Road Motor Vehicles," 2018-06.
[2] National Highway Traffic Safety Administration, "Traffic Safety Facts Annual Report Tables," 23 April 2019.
[Online]. Available: https://cdan.nhtsa.gov/tsftables/tsfar.htm#. [Accessed 19 November 2019].
[3] A. Benson, B. Tefft, A. M. Svancara and W. Horrey, "Potential Reduction in Crashes, Injuries, and Deaths
from Large-Scale Deployment of Advanced Driver Assistance Systems," AAA Foundation for Traffic Safety,
2018.
[4] Insurance Institute of Highway Safety, "Advanced Driver Assistance," May 2019. [Online]. Available:
https://www.iihs.org/topics/advanced-driver-assistance. [Accessed 20 November 2019].
[5] H. Clark, A. C. McLaughlin and J. Feng, "Situational Awareness and TIme to Takeover: Exploring an
Alternative Method to Measure Engagement with High-Level Automation," in Procedings of the Human
Factors and Ergonomics Society, 2017.
[6] N. Dunn, T. Dingus and S. Soccolich, "Understanding the Impact of Technology: Do Advanced Driver
Assistance and Semi-Automated Vehicle Systems Lead to Improper Driving Behavior?," AAA Foundation for
Traffic Safety, 2019.