evaluation of an explicit one-dimensional time dependent...
TRANSCRIPT

Journal of the Meteorological Society of Japan, Vol. 88, No. 2, pp. 95--121, 2010. 95
DOI:10.2151/jmsj.2010-201
Evaluation of an Explicit One-Dimensional Time Dependent Tilting Cloud Model:
Sensitivity to Relative Humidity
Shu-Hua CHEN
Department of Land, Air, and Water Resources, University of California, Davis, California, USA
Department of Atmospheric Sciences, National Central University, Chung-Li, Taiwan
and
Yang-Cheng SIAO
Department of Atmospheric Sciences, National Central University, Chung-Li, Taiwan
(Manuscript received 19 January 2009, in final form 4 November 2009)
Abstract
The primary goal of this study is to evaluate the performance of the Explicit One-dimensional (1D) Time-dependent Tilting Cloud Model (ETTM), which will be potentially used in a cumulus parameterization scheme.The Weather Research and Forecasting (WRF) model was used in a cloud-resolving mode to study 3D cloudcharacteristics under two sheared environments, one from the Rain in Cumulus over the Ocean (RICO) field ex-periment and the other from the International H2O Project (IHOP). Then, WRF 3D simulation results were usedto evaluate ETTM performance. WRF simulations were performed with di¤erent radii from 1 km to 10 km ofthermal bubbles for initiation. The three-dimensional cloud features were quite di¤erent between RICO andIHOP due to their environments, which were sub-tropical maritime sounding and mid-latitude continental sound-ing, respectively. ETTM 1D cloud simulations, corresponding to each of the WRF simulations, were conducted.The simulated 1D clouds were too weak when the original thermal bubbles were similar to those used in the 3Dcloud simulations (i.e., no additional moisture within the thermal bubbles). The sensitivity of model results to rel-ative humidity was tested by imposing a lower bound of 88% (ER88) and 95% (ER95) humidity to the thermalbubble in ETTM simulations. When compared with the original simulations, 1D results from ER88 and ER95showed clear improvements, but they were still underestimated relative to 3D clouds, and the results from IHOPwere slightly worse than those from RICO. Sensitivity tests with a zero-degree cloud tilting angle and with adi¤erent radius of the downdraft were also examined. Results show that the downdraft due to the tilting of thecloud slightly improved ETTM’s performance in terms of the heat and moisture fluxes, while the influence ofusing di¤erent downdraft sizes on 1D simulation results is not clear.
1. Introduction
The purposes of cumulus parameterization are toestimate unresolved subgrid-scale precipitation; toaccount for subgrid scale latent heat release; and
to vertically redistribute heat, moisture, and mo-mentum (Kain and Fritsch 1993). Even though ad-vances in computational resources and techniquesmake it possible to run global cloud-resolving mod-els, they are mostly available at a few nationalcenters such as the Earth Simulator at the JapanAgency for Marine-Earth Science and Technology(JAMSTEC). Therefore, cumulus parameterizationin numerical models is and will still be needed, par-ticularly for long-term global climate integrations,
Corresponding author: Shu-Hua Chen, Department ofLand, Air, and Water Resources, University of Cali-fornia, Davis, California 95616-8627, USA.E-mail: [email protected] 2010, Meteorological Society of Japan

for most research institutes. The importance of thecumulus representation cannot be over-emphasizedas errors in moist physics schemes overwhelm thosein dynamics.
In general, cumulus parameterization consists ofthree components: triggering functions, which man-age the timing and location of subgrid-scale con-vection; the vertical redistribution of mass, momen-tum, heat, and moisture variables, which controlthe modification of the grid-scale environment; andclosure assumptions, which regulate the strength ofthe convection. Arakawa (2004) provided a verycomprehensive review of the history of cumulusparameterization. Di¤erent cumulus parameteriza-tions, in particular, the moist-convective adjust-ment scheme (Manabe et al. 1965), the Kuo scheme(Kuo 1974), and the Arakawa scheme (Arakawa1969), were reviewed. The controversies, currenttrends, and outstanding problems of cumulus pa-rameterization were also discussed.
Following the improvement of computational re-sources, a 2D cloud model was used in each modelgrid column to directly resolve subgrid-scale cloudsto provide the vertical distribution of mass andother cloud-related properties (i.e., eliminating thetriggering function and the closure assumption)(Grabowski 2001), known as the super parameter-ization scheme. Results from the super parameter-ization scheme were very promising, and its appli-cation has been expanded (Khairoutdinov et al.2005; Khairoutdinov et al. 2008; Tao et al. 2008).However, it is not without weaknesses. For exam-ple, this scheme modeled extensive rainfall in thewestern Pacific during the Northern Hemispheresummer (Khairoutdinov et al. 2005). Additionally,the super parameterization scheme requires abouttwo orders of magnitude more computational timethan the conventional cumulus parameterizationapproach, as a 2D cloud model is calculated ineach model grid box during the entire model inte-gration (Khairoutdinov et al. 2005). Therefore,there are obstacles to the widespread adoption ofthe super parameterization scheme, particularlyfor those with limited computer resources, in whichcase cumulus parameterization by a 1D cloudmodel might be more practical.
Most of the 1D cloud models that are used in cu-mulus parameterization are either simple plumes orbulk 1D cloud models (e.g., Anthes 1977; Fritschand Chappell 1980; Frank and Cohen 1985; Grell1993; Hu 1997), which might not perform prop-erly due to their simplifications (Liu et al. 2001).
A slightly more sophisticated 1D entrainment/detrainment plume model was then proposed byKain and Fritsch (1990, 1993) and a more realistic1D model was developed by Haines and Sun (1994)for cumulus parameterization. All these 1D modelsare time independent and some of them ignoredowndraft e¤ects. The importance of the downdraftto cumulus parameterization has been suggested bymany researchers (Brown 1979; Molinari and Cor-setti 1985; Cheng 1989; Grell et al. 1991; Moncrie¤1992; Gray 2000; Liu et al. 2001). Downdrafts,which are often observed beside tilted updrafts,have non-negligible e¤ects on the mass, moisture,and heat fluxes at low levels (Moncrie¤ 1981,1992). As pointed out in Grell et al. (1991), a morerealistic 1D model such as the one that is time-dependent and physically based might be neededin order to obtain a better estimate of the subgrid-scale thermodynamic properties of clouds in cumu-lus parameterization. Ferrier and Houze (1989)developed a time-dependent 1D model, which in-cluded relatively complete physical processes. Intheir model, the precipitation separating fromthe updraft due to its tilting e¤ect was also con-sidered; however, the downdraft initiated by theevaporative/sublimation/melting cooling and thedrag force was ignored.
Chen and Sun (2004) developed an Explicit One-dimensional Time-dependent Tilting Cloud Model(ETTM) for potential use in cumulus parameteriza-tion. A brief introduction to the model is given inSection 2.2. Before applying ETTM to a cumulusparameterization scheme, it is important to evalu-ate the model performance under realistic environ-ments. Cloud resolving models (CRMs) have beenused to study three-dimensional (3D) or two-dimensional (2D) cloud properties (Lin 1999; Mu-rata and Ueno 2005; Gao and Li 2008; Luo et al.2008) and applied to validate the performance ofcumulus parameterization schemes (Liu et al.2001). In this study, the weather research and fore-casting (WRF) model was used in a cloud-resolvingmode to study 3D cloud properties under di¤erentshear and convective available potential energy(CAPE) environments. The results from WRFwere then used to evaluate and improve ETTM’sperformance.
This paper is organized as follows. Both models,3D WRF and 1D ETTM, and the initial soundingsare introduced in Section 2. WRF model experi-ment designs and simulation results are given inSection 3, while those of ETTM simulations and
96 Journal of the Meteorological Society of Japan Vol. 88, No. 2

comparisons between the two model results are pre-sented in Section 4. Brief concluding remarks aregiven in Section 5.
2. Brief description of models and initial soundings
2.1 The weather research and forecasting (WRF)
model
WRF is a community model recently developedby several organizations. There are two dynamicalcores available for the public: the Advanced Re-search WRF (ARW) and the Nonhydrostatic Meso-scale Model (NMM). The ARW version 2.2 (Ska-marock et al. 2005) was adopted for this study.ARW is a fully compressible, nonhydrostaticmodel, and the governing equations are writtenin flux form to conserve mass, dry entropy, and sca-lars. The Runge-Kutta third-order time scheme wasemployed and the fifth- and third-order advectionschemes were chosen for the horizontal and verticaldirections, respectively. An open lateral boundarycondition was used, and the surface fluxes were de-activated. WRF was designed to help researchersdevelop and study advanced physics and data as-similation systems, and it can be used for bothidealized and real case studies. In this study WRFwas adopted as a cloud-resolving model (CRM)for semi-idealized 3D cloud simulations, whichused real soundings with an idealized model setting(e.g., horizontally homogeneous initial conditions).
2.2 Explicit one-dimensional time-dependent tilting
cloud model (ETTM)
ETTM was developed by Chen and Sun (2004)for potential use in cumulus parameterization.
ETTM includes several important features: thecloud can tilt; an updraft and a downdraft cancoexist; a sophisticated cloud microphysics is used;and the model is anelastic, non-hydrostatic, andtime-dependent. The cloud microphysics scheme ofETTM (Chen and Sun 2002) is one of the micro-physics schemes available in the WRF model (e.g.,the Purdue Lin microphysics scheme). Therefore,WRF is one of the most suitable models for com-paring ETTM results with 3D cloud simulations.
The ETTM model includes three 1D columns incalculation: the updraft, downdraft, and environ-ment. The first two columns are time dependent,while the third (i.e., environment) is assumed to betime-independent. All three columns are initializedwith the same sounding. The updraft is activatedby a (moist) thermal bubble, while the downdraftis triggered by evaporative/sublimation cooling ofdetrained hydrometeors and by the drag force aswell as the melting e¤ect (i.e., snow and graupel)of separated precipitation from the updraft (Fig.1). Note that in ETTM all downdrafts are consid-ered as a single entity the ones due to separatedprecipitation and the ones due to detrained hydro-meteors in. As in WRF simulations, no surfaceflux was assumed.
In ETTM, two parameters were introduced, thecloud radius ðRÞ and the tilting angle ðaoÞ. The tilt-ing angle, which was assumed to be the same forboth updraft and downdraft, was defined as theangle from the vertical axis in erect cylindricalcoordinates to the tilting axis in tilting cylindricalcoordinates. The cloud radius of the downdraft
Fig. 1. A schematic diagram showing the initiation of the downdraft from a tilted updraft.
April 2010 S.-H. CHEN and Y.-C. SIAO 97

was assumed to be 40% of that for the updraft; thisassumption was based on the study by Lemone andZipser (1980). Although the cloud radius and tiltingangle are functions of time, they were assumed tobe constant in the ETTM model for simplicity.Both parameters were estimated from three dimen-sional clouds in this study and will be parameter-ized in the near future.
2.3 Soundings
Both WRF and ETTM were initialized with thesame vertical soundings. In WRF, it was assumedthat the initial fields were horizontally homoge-neous. Two real 1D environmental soundings (Fig.2 and Table 1) were used for this semi-idealized
study. One is from the Rain in Cumulus over theOcean (RICO) field experiment and the other isfrom the International H2O Project (IHOP). Thesounding from RICO was observed at 0000 UTCDecember 18, 2004 from San Juan, Puerto Rico, asub-tropical environment where the low levels weremoist (Fig. 2a). The horizontal winds changed fromeasterly-southeasterly near the surface to westerly-northwesterly as the height increased (Fig. 2c), giv-ing an approximately normal unidirectional shearwith height. Although the convective availablepotential energy (CAPE) was su‰ciently large(1400 J kg�1), only a few scattered clouds wereobserved around Puerto Rico during the day onDecember 18, 2004.
Fig. 2. The soundings used for (a) RICO and (b) IHOP simulations. The thick gray curve in (a) and(b) presents the dry and then moist adiabatic processes for an air parcel that was lifted upward from thesurface. EL stands for the equilibrium level; (c) and (d) are hodographs of (a) and (b), respectively, fromthe surface to 500 hPa.
98 Journal of the Meteorological Society of Japan Vol. 88, No. 2

The sounding from IHOP was collected at 2100UTC June 4, 2002, and it was a sounding from theGreat Plains of the US, in the continental middlelatitudes, where the low levels were relatively dry(Fig. 2b). For IHOP, in addition to a drier loweratmosphere, the CAPE was larger (2450 J kg�1)than that from RICO (1400 J kg�1) and the windshear direction changed with height, i.e., multi-directional shear (Fig. 2c vs. 2d). At 0000 UTCJune 4, 2002, there was a linear convective system(squall line) propagating from the northwestern di-rection toward the city of Norman, OK, where thesounding was measured. For both soundings, thetemperature profiles were close to dry adiabatic atlow levels and approached a moist adiabatic struc-ture in the middle levels. However, the dry adia-batic-like lower atmosphere was much deeper inIHOP than in RICO. As a result, the temperaturefor IHOP dropped by about 20 K from the surfaceto 700 hPa, which was more than the temperaturedrop observed for RICO (about 16 K).
3. WRF simulations
3.1 Experiment design
The idealized supercell case in the WRF modelwas adopted for semi-idealized 3D simulations. Asmentioned earlier, the initial fields were assumedhorizontally homogeneous and two case simula-tions, RICO and IHOP, were conducted usingthe soundings in Fig. 2. One domain with321� 321� 51 grid points in the east–west,north–south, and vertical directions, respectively,was configured for all the WRF simulations. Thehorizontal resolution was 250 m, which gave a hor-izontal domain size of 80 km� 80 km. The verticalgrids were stretched from a resolution of approxi-mately 200 m close to the surface to 1000 m closeto the model top at approximately 16-km height.A weakly-damped 5-km Rayleigh sponge layer was
placed at the top of the domain to absorb reflectedwaves. The damping e¤ect quickly decreased down-ward. Because of the high spatial resolution, asubgrid eddy di¤usion scheme, the Smagorinskyscheme (Smagorinsky 1963), was used in place ofboundary layer parameterization. The Purdue Linmicrophysics scheme (Chen and Sun 2002) waschosen, as mentioned earlier, and a free-slip bound-ary lower condition was used.
The 3D cloud simulation was initiated using athermal bubble. For both RICO and IHOP, simu-lations with di¤erent horizontal radii of bubbleswere conducted to examine cloud properties withdi¤erent cloud sizes. A maximum potential temper-ature perturbation ðy 0
maxÞ of 3 K was assigned atthe center of the bubble. The formula of the ther-mal bubble ðy 0Þ was:
y 0 ¼ y 0max � cos2ðpr=2Þ; ð1Þ
where r ¼ffiffiffiffiffiffiffiffiffiffiffiffiffiffiffiffiffiffiffiffiffiffiffiffiffiffiffiffiffiffiffiffiffiffiffiffiffiffiffiffiffiffiffiffiffiffiffiffiffix�xoR
� �2þ y�yoR
� �2þ z�zo1500
� �2q.
The center of the bubble, ðxo; yo; zoÞ, was locatedat a 1.5 km height over the center of the modeldomain. The bubble radius R varied from 2 km to10 km for RICO and 3 km to 10 km for IHOP,with an interval of 1 km. Simulations with smallerbubble radii (i.e., 1 km for RICO and 1–2 km forIHOP) were also examined but not included be-cause their simulated cloud diameters were lessthan five grid spacings (i.e., less than 1.25 km).The model was integrated for 1 h with a time stepof 1 s. Note that in order to keep the simulatedstorms close to the center of the domain, meanwinds of ðu; vÞ ¼ ð�5:9 m s�1, �2.5 m s�1Þ forRICO and ðu; vÞ ¼ ð�1:17 m s�1, 5.76 m s�1Þ forIHOP were deducted from the initial soundings.The mean wind was estimated from the storm’spropagation speed during the first 20-min integra-tion using the original wind sounding with the ex-periment employing of R 10 km for each case.
Table 1. Information for the two soundings that were used in this study.
Sounding 1 Sounding 2
Field Experiment RICO IHOP
Station SJU San Juan, Puerto Rico OUN Norman, Oklahoma, USA
Latitude/Longitude �66.0�/18.4� �97.40�/35.20�
Observed time 0000 UTC December 18, 2004 2100 UTC June 4, 2002
Convective Available Potential Energy @1400 J kg�1 @2450 J kg�1
Deducted mean wind U (m s�1), v (m s�1) �5.9, �2.5 �1.17, 5.76
April 2010 S.-H. CHEN and Y.-C. SIAO 99

3.2 WRF simulation results
Figure 3 shows the time variation of the maxi-mum vertical velocity from simulated 3D clouds.When a bigger thermal bubble was applied, a con-vective cloud took longer to develop and reach itsmaximum vertical velocity for both RICO and
IHOP. With the same size of the bubble, RICO,which was moister in the lower atmosphere, took aslightly shorter time to develop than did IHOP. Thesmall peak for each cloud, found before the 4-minintegration, was due to the imposed thermal bubbleand it weakened as the bubble became larger. It is
Fig. 3. Time evolution of the WRF simulated maximum vertical velocity with di¤erent initial thermalbubble radii for (a) RICO and (b) IHOP.
100 Journal of the Meteorological Society of Japan Vol. 88, No. 2

interesting to see that the peak value of the maxi-mum vertical velocity kept increasing for IHOP(Fig. 3b) but quickly flattened out for RICO (Fig.3a) as the bubble size increased. The maximumvertical velocity from RICO was stronger than thatfrom IHOP with a small thermal bubble, while thatfrom IHOP was stronger when the radius of thethermal bubble was larger than 5 km. This is prob-ably due to a larger CAPE for the IHOP sounding.Moreover, when a larger thermal bubble was used,the maximum vertical velocity remained at a highvalue after passing its peak value for RICO, whichwas due to the development of consecutive multi-cells. This is similar to the multicell clouds thatoccur in the middle latitudes. For all IHOP simula-tions, only one major cloud developed.
The simulated cloud bases were independent ofbubble size and were located at approximately thesame level (Fig. 4), the lifting condensation level(LCL), in both cases. The cloud base for IHOPwas slightly higher than that for RICO because adryer boundary layer was present in the formersounding (Fig. 2a vs. 2b). In contrast to the cloudbase, the simulated cloud top strongly dependedon the initial bubble and it reached a greater clouddepth when the bubble size increased. For a givensize of the thermal bubble, the cloud top for IHOP
was higher than that for RICO when the bubbleradius was greater than 5 km. Cloud depth is anessential output of cloud parameterization schemes.The simulated depth is important for the verticalredistribution of dynamic and thermodynamicproperties, which is critical to the adjustment ofthe atmospheric instability. It is important for a1D cloud model to at least approximately repro-duce 3D cloud depth when it is considered in acumulus parameterization scheme.
It is worth mentioning that the simulated cloudtops were lower than the equilibrium level (EL),where the temperature of the air parcel ascendingadiabatically from near the surface is equal to theenvironmental temperature, particularly for smallclouds. The height of the estimated EL was about13 km for the RICO sounding and about 15 kmfor the IHOP sounding (Figs. 2a, b). The turbu-lence di¤usion within the cloud and through thelateral boundary has a negative impact on thecloud development. Moreover, the dry air intrusioninto a cloud can cause evaporative cooling, whichtends to suppress the cloud development. Theseprocesses are ignored when a parcel ascends adia-batically. Therefore, the use of the EL as the topof the subgrid-scale vertical adjustment will overes-timate the depth of the adjustment.
Fig. 4. Height of the WRF simulated maximum cloud top (solid lines) and minimum cloud base (dashedlines) with respect to di¤erent thermal bubbles during 1-h model integrations for RICO (black lines) andIHOP (gray lines). The cloud base was defined using the cloud field during the early stage of the clouddevelopment, before precipitation penetrated the cloud base toward the surface.
April 2010 S.-H. CHEN and Y.-C. SIAO 101

On the other hand, for any given environmentsounding with positive CAPE between the level offree convection (LFC) and the EL, such as the twosoundings in this study, clouds with higher tops willconsume more of the environment’s energy (i.e.,CAPE). As a result, in theory, a stronger maxi-mum vertical velocity, which is proportional to thesquare root of the consumed CAPE, will also occurwhen the cloud top reaches higher (i.e., larger
clouds here). This was shown for the IHOP casebut not for RICO (Figs. 3, 4), and the reason be-hind the behavior of the RICO case deserves fur-ther study.
Figures 5a, b show the horizontal cross sectionsof the vertical velocity at three di¤erent levels witha bubble radius of 10 km after a 23-min integra-tion, at the time when the downward motion devel-oped due to detrainment, for RICO and IHOP,
Fig. 5. The horizontal cross sections of vertical velocity (cm s�1) and wind vectors at 1.8 km (shading),2.7 km (gray lines), and 3.5 km (black lines) after (a) 23 min and (c) 27 min WRF simulations for RICOfor the experiment with a bubble radius of 10 km; (b) and (d) are the same information as (a) and (c),respectively, for IHOP at 1.8 km (shading), 3.0 km (gray lines), and 4.2 km (black lines). For each case,negative values at the first plotted level (i.e., 1.8 km) were not plotted, while they were plotted as dashedlines at the other two levels (i.e., 2.7 km and 3.5 km for RICO and 3.0 km and 4.2 km for IHOP).
102 Journal of the Meteorological Society of Japan Vol. 88, No. 2
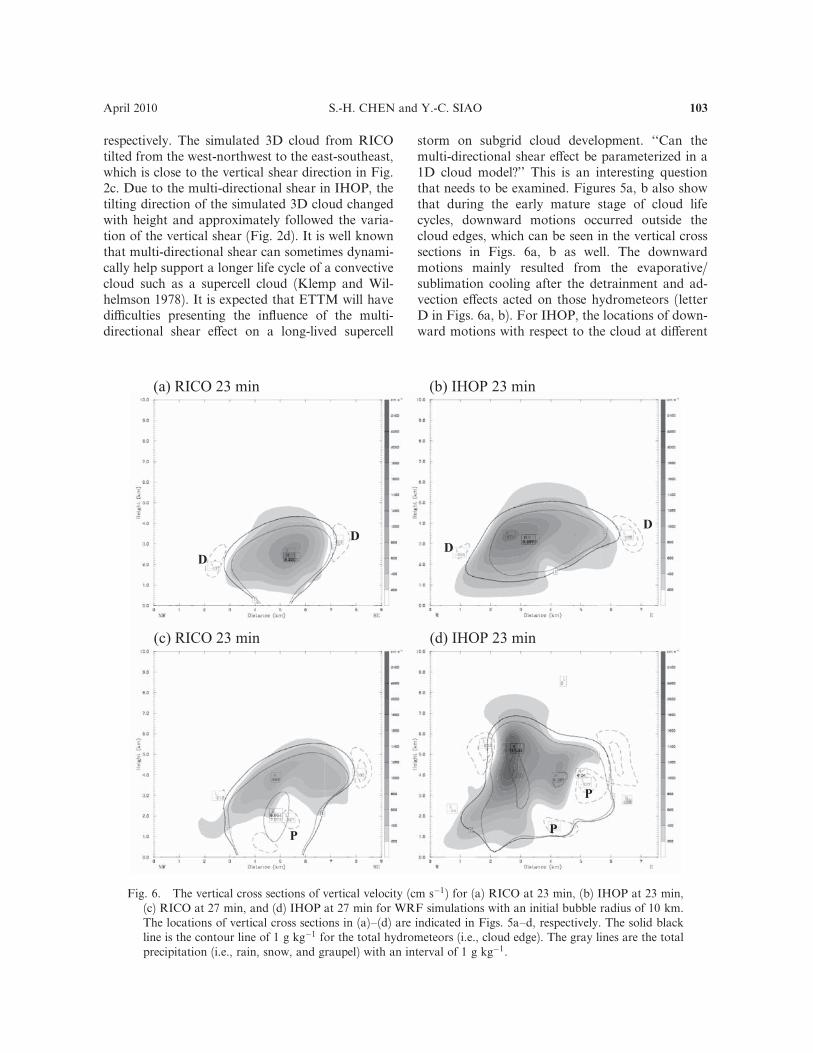
respectively. The simulated 3D cloud from RICOtilted from the west-northwest to the east-southeast,which is close to the vertical shear direction in Fig.2c. Due to the multi-directional shear in IHOP, thetilting direction of the simulated 3D cloud changedwith height and approximately followed the varia-tion of the vertical shear (Fig. 2d). It is well knownthat multi-directional shear can sometimes dynami-cally help support a longer life cycle of a convectivecloud such as a supercell cloud (Klemp and Wil-helmson 1978). It is expected that ETTM will havedi‰culties presenting the influence of the multi-directional shear e¤ect on a long-lived supercell
storm on subgrid cloud development. ‘‘Can themulti-directional shear e¤ect be parameterized in a1D cloud model?’’ This is an interesting questionthat needs to be examined. Figures 5a, b also showthat during the early mature stage of cloud lifecycles, downward motions occurred outside thecloud edges, which can be seen in the vertical crosssections in Figs. 6a, b as well. The downwardmotions mainly resulted from the evaporative/sublimation cooling after the detrainment and ad-vection e¤ects acted on those hydrometeors (letterD in Figs. 6a, b). For IHOP, the locations of down-ward motions with respect to the cloud at di¤erent
Fig. 6. The vertical cross sections of vertical velocity (cm s�1) for (a) RICO at 23 min, (b) IHOP at 23 min,(c) RICO at 27 min, and (d) IHOP at 27 min for WRF simulations with an initial bubble radius of 10 km.The locations of vertical cross sections in (a)–(d) are indicated in Figs. 5a–d, respectively. The solid blackline is the contour line of 1 g kg�1 for the total hydrometeors (i.e., cloud edge). The gray lines are the totalprecipitation (i.e., rain, snow, and graupel) with an interval of 1 g kg�1.
April 2010 S.-H. CHEN and Y.-C. SIAO 103

104 Journal of the Meteorological Society of Japan Vol. 88, No. 2

levels reflected the change in the wind directionwith height. Four minutes later (i.e., after a 27-minintegration), the downward motions developedwithin and underneath the clouds, located towardthe tilting side of the updrafts, and became moreevident for both cases (letter P in Figs. 5c, d and6c, d). These downdrafts were triggered by precipi-tation that separated from upper-level updrafts, asthey were found below the region with the maxi-mum upward vertical velocity (i.e., below the de-trainment layers). After the downward motion wasinitiated, the drag force of precipitation and thecooling e¤ect from the melting of snow and graupelenhanced the downdrafts, in particular for IHOP inthe middle latitudes (Tao et al. 1995). With a largerCAPE and a stronger maximum vertical velocityin IHOP for R 10 km, the overshooting above thecloud top was more pronounced (i.e., the top ofthe updraft was higher than that of the cloud field).
Figure 7 shows the vertical soundings passing themaximum vertical velocity of the convective cloudsat di¤erent times for the cases with a 10-km bubbleradius. During the earlier stages of cloud develop-ment, the storm presented a moist adiabatic thermo-dynamic structure after the convective adjustmentoccurred for both cases (Figs. 7a, b). A few minuteslater, the intrusion of the surrounding dry air intothe cloud, which was induced by dynamical mecha-nisms, resulted in evaporative cooling and causedthe inner cloud to deviate from moist adiabaticstructures (i.e., 700 hPa to 850 hPa for RICO inFig. 7c and 480 hPa to 550 hPa for IHOP in Fig.7d). In the later stage of the cloud life cycle, furthermixing with the environment and the breaking ofthe cloud structure destroyed the moist adiabaticproperties of the clouds (Figs. 7e, f ), which becameunsaturated later during the dissipation stage (fig-ure not shown) when downward motion becamedominant. The intrusion of dry air into a cloudcan suppress the development of the cloud. It isalso expected that ETTM will have di‰culties rep-resenting this e¤ect. However, the entrainment ofthe dry air from upper levels of clouds during thedissipation stage is included in ETTM (the latter isthrough the mass continuity equation).
Usually, the cloud radius and the tilting anglevary with time and height. Since 1D ETTM simula-
tions need inputs for the tilting angle and cloudradius, their approximations from 3D clouds wereroughly estimated in this study. At each level, anequivalent cloud radius ðReÞ was defined assum-ing that pR2
e was equal to the sum of updraft areaswhere the upward motion was greater than 2 m s�1.The estimated equivalent cloud radius was a func-tion of height and time. Overall, the maximumequivalent cloud radius increased when the initialthermal bubble size increased (Fig. 8a), where themaximum equivalent cloud radius is defined as themaximum value of the equivalent cloud radius dur-ing the time after the cloud develops until it reachesits maximum vertical velocity. It is worth notingthat the maximum equivalent cloud radius wassmaller than the radius of the initial thermal bub-ble, particularly for larger clouds. With the sameinitial perturbation (i.e., the same size of the ther-mal bubble), the maximum equivalent cloud radiusfrom RICO was comparable or slightly bigger thanthat from IHOP. Figure 9 shows the time evolutionof the vertical profiles of the equivalent cloud ra-dius for the bubble radii of 5 and 10 km from theinitial time to the time when the maximum equiva-lent cloud radius was reached. Results are notplotted for times following the achievement of themaximum equivalent cloud radius because of thedevelopment of downward motion, which maylead to an underestimation of the equivalent cloudradius. A small updraft developed before the pri-mary one in Figs. 9a, 9c, and 9d; this was becauseof the imposed thermal bubble. Note that no suchsmall updraft occurred in the 10-km radius bubbleexperiment from RICO (i.e., Fig. 9b) as the upwardmotion due to the thermal bubble did not reach theminimum requirement of 2 m s�1 (see Fig. 3a). Themaximum equivalent cloud radius was located atthe middle to upper levels of the cloud and wasshifted upward as the cloud developed. This di¤ersfrom the assumption of a constant cloud radiusmade in ETTM. Further study is needed to deter-mine the importance of variations in the 1D cloudmodel radius.
Instead of estimating the variation in the tiltingangle of the cloud with respect to time and height,an averaged angle from the updraft was estimatedat the time when the maximum vertical velocity
g—————————————————————————————————————————————————————————
Fig. 7. The vertical sounding within the 3D cloud passing the maximum vertical velocity after (a) 20-min(c) 24-min, and (e) 33-min simulations for RICO with an initial bubble radius of 10 km; (b), (d), and(f ) present the same information but for IHOP after 23-min, 27-min, and 37-min, respectively.
April 2010 S.-H. CHEN and Y.-C. SIAO 105

was reached and this was used for ETTM simula-tions. To estimate the angle, the equivalent centersat two selected levels within the updraft were firstidentified. The upper level was at about 1/4 of thecloud depth from the cloud top, and the lower level
was at about the same depth from the cloud base.The equivalent center point, ðx; yÞ at each level,was the average of the locations for grid pointswith vertical velocity greater than 2 m s�1, whichis similar to the criteria used for the equivalentcloud radius. The ratio of the horizontal displace-ment ðdsÞ to the vertical displacement ðdzÞ betweenthese two points was used to estimate the cloud tilt-ing angle ðaoÞ using the formula, ao ¼ tan�1ðds=dzÞ.
Figure 8b shows that the tilting angle was almostconstant (about 10�) with respect to di¤erentbubble sizes for the RICO case. However, for theIHOP case, the averaged tilting angle decreasedwhen the bubble size increased and values rangedfrom about 20� to 40�. In general, one expects thata cloud will tilt to a greater extent when the envi-ronment shear is stronger. Figure 8c shows thevertical shear profiles that were estimated from theinitial soundings for both cases. The figure has beensmoothed by taking the average of every 3, 5, 7 9,and then 11 grid points (i.e., smoothed a total offive times by averaging over di¤erent numbers ofgrids each time) since the original soundings werevery noisy. Note that only the values below 11 km,the maximum cloud height in this study, areplotted. Although the shear was highly variable inthe vertical direction, the averaged shear for IHOPin the plotted domain is stronger than that forRICO, as expected since IHOP is a sounding fromthe middle latitudes. The figure also shows thatoverall, the shear increased with height for RICO,while it stayed more or less constant with heightfor IHOP. Therefore, for RICO, a cloud would bea¤ected by a stronger averaged shear environmentwhen the cloud developed deeper (i.e., a largercloud), which in turn would have made the cloudtilt to a greater extent. On the other hand, under aconstant shear profile, a larger cloud can poten-tially tilt to a lesser extent because of its larger iner-tial e¤ect. The combination of these two e¤ects,i.e., shear and the size of the cloud, caused the sim-ulated tilting angle to stay close to a constant withrespect to di¤erent cloud sizes for RICO, while theangle decreased when a cloud became larger forIHOP.
4. ETTM simulation results and comparison with
WRF simulations
4.1 Experiment design
The same initial soundings as in the WRF simu-lations (Fig. 2) were used in ETTM, except thathorizontal winds were set to zero. The stretched res-
Fig. 8. Estimated (a) maximum equivalentcloud radius (R; km) and (b) tilting angle(�) for RICO (black lines) and IHOP (graylines) from WRF simulations at the time ofoccurrence of the maximum vertical veloc-ity; (c) the smoothed vertical shear frommodel initial conditions for both cases.
106 Journal of the Meteorological Society of Japan Vol. 88, No. 2

olution and grid size in the vertical were the sameas those in WRF simulations. ETTM experimentswith various cloud radii and tilting angles were con-ducted to mirror each WRF simulation (i.e., ninebubble size experiments for RICO and eight forIHOP). For convenience, ETTM experiments werenamed following the convention Exxkm, where Eindicates the ETTM model and ‘‘xx’’ indicates theradius of the thermal bubble in the WRF simula-tion. As mentioned earlier, the tilting angle and thecloud radius in ETTM were assumed constant dur-
ing the model integration, and they were specifiedat the initial stage. Before parameterizing the tiltingangle and cloud radius using environment or grid-scale soundings, we assessed how ETTM performswhen the best of both parameters are provided. Inthe ETTM simulations conducted here, both pa-rameters were directly estimated from simulated3D clouds from WRF, and the estimated maximumequivalent cloud radius and the tilting angle shownin Fig. 8 were used. Results from ETTM were thencompared with those from 3D cloud simulations to
Fig. 9. Time evolution of the vertical profiles of the equivalent cloud radius (km) from initial time to theapproximate time when the maximum equivalent cloud radius was reached for the WRF experiments withbubble radii of (a) 5 km and (b) 10 km from RICO; (c) and (d) are the same as (a) and (b), respectively,except from IHOP.
April 2010 S.-H. CHEN and Y.-C. SIAO 107

evaluate ETTM’s performance. For each experi-ment, the thermal bubbles used in ETTM simula-tions were also estimated from horizontally aver-aged potential temperature perturbations in WRFsimulations (within the area of the estimated 3Dupdraft).
4.2 ETTM simulation results and comparison with
WRF results
Figures 10 and 11 show the updrafts and down-drafts from E10km runs for RICO and IHOP,respectively. The simulated updrafts from ETTM(i.e., Figs. 10a, 11a) developed right after the modelintegration (i.e., no time lag), while it took about 10to 15 min for a 3D cloud to develop (see Figs. 9b,d). This implies that a time delay might be neededfor subgrid cloud development if ETTM is used ina time-dependent cumulus parameterization schemeand that the delay will depend on the size of theconvective cloud. Downdrafts quickly developedbefore updrafts reached their mature stage (Figs.10b, 11b). For RICO, the maximum downdraft de-veloped at the same levels as that of the upper-halfportion of the updraft during the early stage andshifted toward the surface in the dissipation stage.The 1D cloud life cycle was shorter and both theupdraft and downdraft were weaker for the IHOPcase when compared to those for the RICO case,which shows the opposite features of the 3D cloudresults.
The maximum vertical velocity from ETTM andWRF with respect to di¤erent maximum equivalentcloud radii Re (i.e., di¤erent sizes of bubbles) areplotted in Fig. 12. For both cases, the maximumvertical velocities from 1D clouds (i.e., ETTM inFig. 12) were much weaker than those from 3Dclouds (WRF-wmax; i.e., the maximum point valueduring a 3D cloud life cycle), as expected; however,most of them were also weaker than the maximumof the horizontally averaged vertical velocity withinthe 3D updraft during the cloud life cycle (WRF-avg). The WRF horizontally averaged vertical ve-locity was calculated as the average of verticalvelocities using grid points in which values weregreater than 2 m s�1 at the same height. For theIHOP case, the maximum averaged value fromWRF increased when the maximum equivalentcloud radius (i.e., bubble size) increased, while thatfrom ETTM remained almost constant or slightlydecreased when the cloud radius increased.
The simulated cloud tops and bases from ETTMwere also examined since they are important to the
vertical adjustment of the mass, momentum, heat,and moisture variables in cumulus parameteriza-tion. Note that no cloud developed for the E02kmrun from IHOP, and therefore, no results areplotted for this experiment. The simulated 3Dcloud bases, which were close to the lifting conden-sation levels, were well reproduced by ETTM withdi¤erent equivalent cloud radii for both RICO andIHOP (Fig. 13). However, the 1D cloud tops weresignificantly underestimated; in particular, thosefrom IHOP were capped at about a 3–4 km height.Moreover, the cloud life cycle became shorter forIHOP ETTM simulations when the cloud radiusbecame bigger, which is the opposite of its counter-part from the 3D cloud (figure not shown), indicat-ing that ETTM results got worse when the cloudradius increased for the IHOP case. Overall, thesimulated 1D cloud results for IHOP were worsethan those for RICO. The underestimation of thecloud strength from ETTM was expected since the1D cloud presents the average of a 3D cloud, andtherefore, the penetration e¤ect of the 3D updraftcore was under-represented. Moreover, some mech-anisms in a 3D cloud, such as the multi-directionalshear e¤ect, cannot be explicitly included, and somesimplifications were made in the 1D cloud represen-tation. The possibility for the improvement of thesesimplified, simulated 1D clouds are examined byconducting some sensitivity tests in the next section.
4.3 ETTM sensitivity tests
a. Moisture
During the time taken for a 3D cloud to developwith a thermal bubble (Fig. 3), the atmosphericboundary layer in the updraft region was moisteneddue to low-level convergence before the cloud de-veloped. This is consistent with the di¤erence intime delay for 3D cloud development betweenRICO and IHOP. A shorter lag time was requiredfor RICO since its lower atmosphere was moremoist. In ETTM, the convergence/divergence e¤ectwas taken into account (i.e., through the continuityequation). However, the 1D cloud developed rightafter the model integration (Figs. 10, 11). There-fore, no moistening in the lower atmosphere oc-curred before the 1D cloud developed. To accountfor this process, for each ETTM simulation, twosensitivity runs with di¤erent moistening assump-tions within the thermal bubble of the updraft wereconducted (i.e., use of a moistened thermal bubble).The Relative Humidity (RH) within the thermalbubble was specified as follows:
108 Journal of the Meteorological Society of Japan Vol. 88, No. 2

Fig. 10. Time evolution of vertical velocity (m s�1) from the (a) updraft and (b) downdraft from E10km forthe RICO case; (c) and (d) are the same as (a) and (b), respectively, except from the ER88 experiment and(e) and (f ) from the ER95 experiment.
April 2010 S.-H. CHEN and Y.-C. SIAO 109

Fig. 11. Figure legends are the same as those in Fig. 10, except for the IHOP case.
110 Journal of the Meteorological Society of Japan Vol. 88, No. 2

RH ¼ maxðRHo;RHcÞ; z < 3 km
RHo; zb 3 km
�;
where RHo is the original RH in the initial sound-ing, and RHc is the lower bound of the relativehumidity within the bubble. Two di¤erent RHc
Fig. 12. The WRF-simulated maximum vertical velocity (WRF-wmax), the WRF maximum horizontallyaveraged vertical velocity, and the ETTM maximum vertical velocity with the original thermal bubble(ETTM) and with di¤erent relative humidities within the thermal bubble (i.e., ER88 for the 88% humidityrun and ER95 for the 95% humidity run) with respect to di¤erent ETTM cloud radii (or 3D bubble radii)for (a) RICO and (b) IHOP.
April 2010 S.-H. CHEN and Y.-C. SIAO 111

values, 88% and 95%, were examined and sensitiv-ity trials were named ER88 and ER95, respectively.The value of 88% was chosen since it was the valueused by Schlesinger (1978) and Chen and Sun(2002, 2004).
With a fixed cloud radius, the intensity of thesimulated 1D cloud was clearly improved when the
low-level moisture was increased. The cloud devel-oped deeper and the maximum vertical velocitiesbecame stronger for both updraft and downdraft(Figs. 10–13). In particular, for IHOP, increasedmoisture allowed clouds in larger bubble simula-tions to penetrate the cap at a 3–4 km height thatoccurred in the original bubble simulations dis-
Fig. 13. The simulated cloud top and base with respect to di¤erent cloud radii (or 3D bubble radii)from WRF and ETTM with sensitivity tests of di¤erent low-level relative humidities from (a) RICO and(b) IHOP. Note that the base lines overlap from di¤erent runs and are therefore not apparent. No clouddeveloped in the ETTM simulation for the cloud radius of 0.73 km with the original thermal bubble forthe IHOP sounding.
112 Journal of the Meteorological Society of Japan Vol. 88, No. 2

cussed in Section 4.1. More moisture was able tofurther enhance simulated 1D cloud intensity (i.e.,ER88 vs. ER95) for both cases. Di¤erent valuesof relative humidity ðRHcÞ might be needed for dif-ferent sizes of 1D cloud simulations, and this re-quires further study. The maximum vertical veloc-ity from ER88 was close to the maximum averagevalue from WRF for RICO. For IHOP, with eitherER88 or ER95, the maximum vertical velocity wasstronger than the maximum averaged value fromWRF simulations and again, remained close toconstant; however, it increased slightly when thecloud radius increased (Fig. 12). Although the sim-ulated cloud depths were improved in both cases,they were still underestimated when compared with3D clouds (Fig. 13).
Horizontally integrated vertical mass ðFmÞ, heatðFhÞ, and moisture ðFqÞ fluxes from 3D WRF (i.e.,horizontal integration) and 1D ER95 (i.e., summa-tion of updraft and downdraft) simulations werecalculated using the following formulae:
Fm ¼ðrwdA; ð1Þ
Fm ¼ðCprwðy� yoÞ dA; ð2Þ
Fm ¼ðrwðq� qoÞ dA; ð3Þ
where r is the density; w, the vertical velocity; Cp
the specific heat of air at constant pressure; q, themixing ratio; and A, the horizontal coverage areaof the cloud. The subscript 0 indicates the initialconditions. Time variation results for the bubbleradii of 5 km and 10 km for RICO (Fig. 14) andIHOP (Fig. 15), respectively, are presented. A min-imum magnitude of 2 m s�1 of the vertical velocity(i.e., both upward and downward motion) was re-quired for the calculation of the fluxes since onlyupdrafts and downdrafts were considered. Sincethe simulated cloud depth is important to the verti-cal adjustment of variables and that from ER95reproduced the 3D cloud depth better than thosefrom ER88 and the original bubble simulations,only results from ER95 are presented.
The depth of the vertical distribution of fluxeswas shallower from ER95, as expected, since the1D cloud top did not reach as high as that of the3D cloud. For the RICO case, ETTM erroneouslyproduced negative mass flux near the surface,which was caused by the downdraft at the dissipa-
tion stage. For IHOP, the negative flux in ER95was located at a very low altitude, and this wasalso caused by the downdraft. The elimination ofthe problem of negative flux will require improve-ments in the ETTM downdraft. Moreover, theWRF vertical fluxes for IHOP were sustained overa longer time than those from the 1D cloud becausethe 1D cloud life cycle was very short.
Although there were discrepancies between WRFand ER95 simulations, the flux patterns from bothmodels showed some similarities such as in shape.For RICO, WRF produced negative mass flux(Fig. 14a) at the upper half cloud height and thiswas reproduced by ER95 (Fig. 14b); moreover, thenegative heat fluxes due to overshoot cooling abovethe cloud top and at the middle- to upper-levelheight of the cloud during the later stage of thecloud life cycle were presented by both models.These positive results show that ETTM has the po-tential for use in cumulus parameterization, givenfurther improvements in performance, in particular,for downdraft and cloud depth.
It was noticed that the magnitudes of fluxes fromthe 1D cloud were larger than those from the 3Dcloud after adding moisture into the thermal bubble(Figs. 14, 15). This might be due to a larger maxi-mum vertical velocity when compared with themaximum averaged value from the 3D cloud (Fig.12), and it may be overcome using a partial cloudapproach (i.e., less than one full cloud e¤ect) incumulus parameterization.
b. Tilting angle and the downdraft radius
Using the ER95 configuration, sensitivity testswith a zero-degree cloud tilting angle (namedER95A0) or with the ratio of the downdraft radiusto the updraft radius equal to 1 (named ER95R1)were conducted. Only RICO with a bubble size of5 km and IHOP with a bubble size of 10 km arepresented.
The di¤erences of simulated mass, heat, andmoisture fluxes of ER95A0 from ER95 are shownin Fig. 16. The patterns of the di¤erences fromRICO and IHOP with bubble sizes of 5 km and10 km, respectively, are quite similar. However,the values are larger and the patterns are deeperfor IHOP due to the use of a larger thermal bubble.When compared with ER95, the erect cloud inER95A0 produced more upward mass flux (Figs.16a, b), indicating that the inclusion of downdraftcan reduce the upward mass flux. The total reduc-tion for the time-integrated mass flux during the
April 2010 S.-H. CHEN and Y.-C. SIAO 113

Fig. 14. The simulated (a) mass (�108 kg s�1), (c) heat (�1012 J s�1), and (e) moisture (�106 kg s�1) fluxesfrom WRF simulations for the RICO case when the bubble size is 5 km; (b), (d), and (f ) are the same as(a), (c), (e), respectively, except from the corresponding 1D cloud simulation from ER95.
114 Journal of the Meteorological Society of Japan Vol. 88, No. 2

Fig. 15. Figure legends are the same as those in Fig. 14, except for the IHOP ER95 run with the bubble sizeof 10 km.
April 2010 S.-H. CHEN and Y.-C. SIAO 115

Fig. 16. The di¤erences of simulated (a) mass (�108 kg s�1), (c) heat (�1012 J s�1), and (e) moisture(�106 kg s�1) fluxes between ER95A0 and ER95 (i.e., ER95A0–ER95) for the RICO case with the 5-kmbubble size; (b), (d), and (f ) are the same as (a), (c), (e), respectively, except for the IHOP case with the10-km bubble size. Note that di¤erent color scales are used in di¤erent figures.
116 Journal of the Meteorological Society of Japan Vol. 88, No. 2

cloud life cycle reached up to 20% at some levelsfor IHOP (figure not shown). On the other hand,the erect cloud leads to an underestimation of theupward heat and moisture fluxes (Figs. 16c–f ).The underestimation of upward heat and moisturefluxes is a problem for the simulated 1D cloud afterthe deep convection starts dissipating (Figs. 14, 15),except for the heat flux from RICO ER95, which isoverestimated at low levels (Figs. 14c, d). However,it is worth mentioning that the magnitude of theheat flux di¤erences between ER95 and ER95A0for RICO is much smaller than that for IHOP(Figs. 16) because of a smaller tilting angle inRICO (Figs. 16c, d). Overall, the downdraft due tothe tilting of the cloud is able to slightly improvelow-level upward heat and moisture fluxes for thesetwo case studies.
The di¤erences in simulated mass, heat, andmoisture fluxes between ER95R1 and ER95 areshown in Fig. 17. The patterns of the di¤erencesfrom RICO and IHOP are also quite similar, ex-cept for those in the low atmosphere. The di¤er-ences are more pronounced with the use of a largerbubble size (i.e., IHOP), similar to the previous sen-sitivity test. Compared with ER95, in which thedowndraft radius was 40% of the updraft radius,the maximum downward motion was weaker inER95R1 (figures not shown). This is because thesame amount of hydrometeors was distributedover a larger horizontal area when a larger down-draft size was applied. In addition, the maximumdownward motion was also shifted upward andoccurred later in time. When compared withER95, although the maximum downward motionwas weaker in ER95R1, a larger size of the down-draft made the reduction of the total upward massflux more prominent, except for the lower levels inRICO’s ER95R1. However, the weaker downwardmotion in the downdraft of ER95R1 made the po-tential temperature anomalies much more unorga-nized. In turn, the upward heat flux became weaker(i.e., negative di¤erences in Figs. 17c, d), which wasunanticipated. Results indicate that when com-pared with the simulated 3D clouds, the use of alarger downdraft size in ETTM improved the heatflux for IHOP but slightly degraded the heat fluxfor RICO. For moisture flux di¤erences in Figs.17e, f, negative values occurred earlier in time andpositive values occurred later in time because themaximum downward motion took place at a latertime for ER95R1. The di¤erence in the time inte-grated total moisture flux during the cloud life cycle
between ER95R1 and ER95 was much smallerthan that between ER95A0 and ER95, except forthe lower levels. Upon combining the heat andmoisture flux comparisons, the influence of usingdi¤erent downdraft sizes on 1D cloud simulationresults is not clear from these two case studies.
5. Concluding remarks
The Weather Research and Forecasting (WRF)model, which was developed in a cloud-resolvingmode, and Explicit Time-dependent Tilting CloudModel (ETTM) were used to simulate three-dimensional (3D) and one-dimensional (1D) cloudproperties, respectively, under two di¤erent atmo-spheric environments. One is a sub-tropical mari-time sounding from the Rain in Cumulus over theOcean (RICO) experiment and the other is a mid-latitude continental sounding from the Interna-tional H2O Project (IHOP). For the IHOP case,the convective available potential energy (CAPE)was higher (2450 J kg�1 for IHOP and 1400 J kg�1
for RICO) and the lower atmosphere was drierwhen compared with the corresponding values forRICO. The vertical wind shear direction variedwith height for IHOP, while it was almost uni-formly directed for RICO.
The ETTM consists of an updraft and a down-draft and was developed for potential use in cumu-lus parameterization (Chen and Sun 2004). Theupdraft was initiated by a thermal bubble, whilethe downdraft was triggered by the drag forceand evaporative/sublimation/melting cooling of de-trained hydrometeors and departed precipitationfrom the updraft (Fig. 1). Both WRF and ETTMare non-hydrostatic models and the same micro-physics scheme was used in both models for thisstudy.
For both RICO and IHOP, 3D cloud simula-tions were conducted under a horizontally uniformrealized condition and initialized with di¤erentradii of thermal bubbles. There was a time lagbetween the model initial time and the 3D clouddevelopment time, and the delay increased as thebubble radius increased. Moreover, the delay canbe longer if the lower atmosphere is originally drier(i.e., the IHOP case). The tilting direction of the3D cloud strongly correlated to its environmentalshear, and the tilting angle from RICO was smallerthan that from IHOP, which is consistent withobserved clouds in the tropics versus the mid-latitudes. For RICO, WRF simulations producedmulti-cells, i.e., the successive formation of convec-
April 2010 S.-H. CHEN and Y.-C. SIAO 117

Fig. 17. The di¤erences of simulated (a) mass (�108 kg s�1), (c) heat (�1012 J s�1), and (e) moisture(�106 kg s�1) fluxes between ER95R1 and ER95 (i.e., ER95R1–ER95) for the RICO case with the 5-kmbubble size; (b), (d), and (f ) are the same as (a), (c), (e), respectively, except for the IHOP case with the10-km bubble size. Note that di¤erent color scales are used in di¤erent figures.
118 Journal of the Meteorological Society of Japan Vol. 88, No. 2

tive clouds, under larger bubble sizes and the maxi-mum vertical velocity was capped when the bubbleradius was larger than 3 km. For IHOP, each sim-ulation produced only one convective cloud and themaximum vertical velocity and the cloud life cycleincreased when the bubble size increased (Fig. 3b).The simulated 3D cloud base was almost indepen-dent of the bubble size, while the 3D cloud top de-veloped higher when a larger bubble was used forboth cases.
1D ETTM cloud simulations corresponding toeach of the WRF simulations were conducted. Thecloud radius and the tilting angle required inETTM were estimated from 3D WRF cloud simu-lations and will be parameterized using grid-scaleinformation in the future. Compared with the 3Dclouds, results from ETTM were too weak forthe original thermal bubbles for all cloud parame-ters: the vertical velocity was too weak; the clouddepth was too shallow, etc. While the 3D cloudstook time to develop, the 1D clouds developedright after ETTM integration. This is because amoistening process at the low levels before the3D clouds developed was missing in 1D clouddevelopment.
To compensate for the missing moistening pro-cess, two sensitivity experiments, which imposed alower bound of relative humidities of 88% (ER88)and 95% (ER95) in the thermal bubble of the up-draft, were carried out. After adding extra moistureinto the thermal bubble, the simulated 1D updraftdeveloped stronger (i.e., a larger vertical velocity)and deeper, though the depth was still underesti-mated. In particular for IHOP, larger clouds wereable to penetrate the inversion at a 3–4 km height(Fig. 2b), which capped the development of the 1Dcloud with the original thermal bubble (i.e., withoutextra moisture). For ER95, when compared with3D cloud results, the depth of the vertical mass,heat, and moisture flux distribution was too shal-low; the erroneous negative mass fluxes werecaused by ETTM downdraft; and the life expansionof the 1D cloud from IHOP was too short. Overall,the simulated 1D cloud results for IHOP wereslightly worse than those for RICO, and this mightbe because the environment sounding from IHOPwas more sophisticated than that from RICO.Note that, in addition to the moistening process,there are other important terms that are omittedin ETTM, such as the horizontal transport, windshear, density current, etc., which also tend to de-grade ETTM performance.
Sensitivity tests with a zero-degree tilting angle(i.e., ER95A0) or with the ratio of the downdraftradius to the updraft radius equal to 1 (i.e.,ER95R1) were carried out for ER95 simulations.Results show that for these two case studies, thedowndraft due to the tilting of the cloud was ableto slightly improve ETTM’s performance, includ-ing the increase in the heat and moisture fluxes inthe lower to middle atmosphere, except for theheat flux from RICO. For the test with a largerdowndraft size, the reduction in the upward massflux due to the downdraft became more pro-nounced, except for low levels when a smaller bub-ble size was used. However, after the use of a largerdowndraft size, the upward heat flux due to thedowndraft became weaker and the variation in thetotal moisture flux during the cloud life cycle wasmuch smaller than that due to the sensitivity testof the tilting angle mentioned above. Overall, theinfluence of using di¤erent downdraft sizes on sim-ulated 1D cloud results is not clear, and morestudies will be needed in the future.
It is very unlikely that 1D ETTM can fully repro-duce 3D cloud features. The addition of moistureto the thermal bubble, which is a reasonableapproach, clearly improved ETTM performance.Although there were discrepancies between ER95and the WRF simulation, the overall patterns ofmass, heat, and moisture fluxes from both modelswere somewhat similar. This is quite promisingand when ETTM is used in cumulus parameteriza-tion in the future, a relative humidity of 95% will beimposed into the thermal bubble for initial testing.It is understood that, besides the moisture, thereare other factors that can cause an underestima-tion of the cloud depth, and more improvementsare required in order to enhance ETTM perfor-mance. More importantly, a comparison withhigh-resolution observations, such as radar data,is required to further assess and improve ETTMperformance.
Acknowledgements
The authors would like to acknowledge theWRF model development teams for their e¤ortson model development. We would also like tothank Dr. Teruyuki Kato, the editor of this manu-script, and two anonymous reviewers for their valu-able scientific comments on the manuscript. Thiswork was supported by a National Science Councilgrant #95-2111-M-008-040 in Taiwan.
April 2010 S.-H. CHEN and Y.-C. SIAO 119

References
Anthes, R. A., 1977: A cumulus parameterization schemeutilizing a one-dimensional cloud model. Mon.
Wea. Rev., 105, 270–286.Arakawa, A., 1969: Parameterization of cumulus clouds.
Proc. Symp. on Numerical Weather Prediction, To-kyo, Japan, WMO/International Union of Geo-desy and Geophysics, 1–6.
Arakawa, A., 2004: The cumulus parameterization prob-lem: past, present, and future. J. Climate, 17,2493–2525.
Brown, J. M., 1979: Mesoscale unsaturated downdraftsdriven by rainfall evaporation: A numerical study.J. Atmos. Sci., 36, 313–338.
Chen, S.-H., and W.-Y. Sun, 2002: A one-dimensionaltime-dependent cloud model. J. Meteor. Soc.
Japan, 80, 99–118.Chen, S.-H., and W.-Y. Sun, 2004: An explicit one-
dimensional time-dependent tilting cloud model.J. Atmos. Sci., 61, 2797–2816.
Cheng, M.-D., 1989: E¤ects of downdrafts and mesoscaleconvective organization on the heat and moisturebudgets of tropical cloud clusters. Part II: Ef-fects of convective downdrafts. J. Atmos. Sci., 46,1540–1564.
Ferrier, B. S., and R. A. Houze, 1989: One-dimensionaltime-dependent modeling of GATE cumulonimbusconvection. J. Atmos. Sci., 46, 330–352.
Frank, W. M., and C. Cohen, 1985: Properties of tropicalcloud ensembles estimated using a cloud modeland an observed updraft population. J. Atmos.
Sci., 42, 1911–1928.Fritsch, J. M., and C. F. Chappell, 1980: Numerical pre-
diction of convectively driven mesoscale pressuresystems. Part I: Convective parameterization. J.
Atmos. Sci., 37, 1722–1733.Gao, S., and X. Li, 2008: Impacts of initial conditions on
cloud-resolving model simulations. Adv. Atmos.
Sci., 25, 737–747.Grabowski, W. W., 2001: Coupling cloud processes with
the large-scale dynamics using the cloud-resolvingconvection parameterization. J. Atmos. Sci., 58,978–997.
Gray, M. E. B., 2000: Characteristics of numericallysimulated mesoscale convective systems and theirapplication to parameterization. J. Atmos. Sci.,57, 3953–3970.
Grell, G. A., Y.-H. Kuo, and R. J. Pasch, 1991: Semi-prognostic tests of cumulus parameterizationschemes in the middle latitudes. Mon. Wea. Rev.,119, 5–31.
Grell, G. A., 1993: Prognostic evaluation of assumptionsused by cumulus parameterizations. Mon. Wea.
Rev., 121, 764–787.Haines, P. A., and W. Y. Sun, 1994: A convective cloud
model for use in a cumulus parameterization
scheme. Mon. Wea. Rev., 122, 165–182.Hu, Qi, 1997: A cumulus parameterization based on a
cloud model of intermittently rising thermals. J.
Atmos. Sci., 54, 2292–2307.Kain, J. S., and J. M. Fritsch, 1990: A one-dimensional
entraining/detaining plume model and its appli-cation in convective parameterization. J. Atmos.
Sci., 47, 2784–2802.Kain, J. S., and J. M. Fritsch, 1993: Convective parame-
terization for mesoscale models: The Kain-Fritsch
scheme. Meteor. Monogr., No. 46, Amer. Meteor.Soc., 165–170.
Khairoutdinov, M. F., D. A. Randall, and C. A. De-Mott, 2005: Simulations of the atmospheric gen-eral circulation using a cloud-resolving model as asuperparameterization of physical processes. J. At-mos. Sci., 62, 2136–2154.
Khairoutdinov, M. F., C. A. DeMott, and D. A. Ran-dall, 2008: Evaluation of the simulated interannualand subseasonal variability in an AMIP-style simu-lation using the CSU Multiscale Modeling Frame-work. J. Climate, 21, 413–431.
Klemp, J. B., and R. B. Wilhelmson, 1978: Simulationsof right- and left-moving storms produced throughstorm splitting. J. Atmos. Sci., 35, 1097–1110.
Kuo, H. L., 1974: Further studies of the parameterizationof the influence of cumulus convection on large-scale flow. J. Atmos. Sci., 31, 1232–1240.
Lemone, M. A., and E. J. Zipser, 1980: A quasi-one-dimensional cumulus cloud model and parameter-ization of cumulus heating and mixing e¤ects.Mon. Wea. Rev., 108, 991–1009.
Lin, C., 1999: Some bulk properties of cumulus ensem-bles simulated by a cloud-resolving model. Part I:Cloud root properties. J. Atmos. Sci., 21, 3724–3735.
Liu, C., M. W. Moncrie¤, and W. W. Grabowski, 2001:Explicit and parameterized realizations of convec-tive cloud systems in TOGA COARE. Mon. Wea.
Rev., 129, 1689–1703.Luo, Y., K.-M. Xu, H. Morrison, G. M. McFarquhar,
Z. Wang, and G. Zhang, 2008: Multi-layer arcticmixed-phase clouds simulated by a cloud-resolvingmodel: Comparison with ARM observationsand sensitivity experiments. J. Geophys. Res., 113,doi:10.1029/2007JD009563.
Manabe, S., J. Smagorinsky, and R. F. Strickler, 1965:Simulated climatology of a general circulationmodel with a hydrological cycle. Mon. Wea. Rev.,93, 769–798.
Molinari, J., and T. Corsetti, 1985: Incorporation ofcloud-scale and mesoscale downdrafts into a cumu-lus parameterization: Results of one- and three-dimensional integrations. Mon. Wea. Rev., 113,485–501.
Moncrie¤, M. W., 1981: A theory of organized steadyconvection and its transport properties. Quart. J.
120 Journal of the Meteorological Society of Japan Vol. 88, No. 2

Roy. Meteor. Soc., 107, 29–50.Moncrie¤, M. W., 1992: Organized convective systems:
Archetypal dynamical models, mass and momen-tum flux theory, and parameterization. Quart. J.
Roy. Meteor. Soc., 118, 819–850.Murata, A., and M. Ueno, 2005: The vertical profile of
entrainment rate simulated by a cloud-resolvingmodel and application to a cumulus parameteriza-tion. J. Meteor. Soc. Japan, 83, 745–770.
Schlesinger, R. E., 1978: A three-dimensional numericalmodel of an isolated thunderstorm: Part I. Com-parative experiments for variable ambient windshear. J. Atmos. Sci., 35, 690–713.
Skamarock, W., J. Klemp, J. Dudhia, D. Gill, D. Barker,W. Wang, and J. Powers, 2005: A description of the
Advanced Research WRF version 2. NCAR Techni-cal note. 100 pp.
Smagorinsky, J., 1963: General circulation experiments
with the primitive equations. I. The basic experi-ment. Mon. Wea. Rev., 91, 99–164.
Sun, W. Y., 1984: Numerical analysis for hydrostatic andnonhydrostatic equations of inertial-internal grav-ity waves. Mon. Wea. Rev., 112, 259–268.
Sun, W. Y., and P. A. Haines, 1996: Semi-prognostictests of a new mesoscale cumulus parameterizationscheme. Tellus, 48A, 272–289.
Tao, W.-K., J.-D. Chern, R. Atlas, D. Randall, M.Khairoutdinov, J.-L. Li, D. E. Waliser, A. Hou,X. Lin, C. Peters-Lidard, W. Lau, J. Jiang, andJ. Simpson, 2009: A multi-scale modeling system:Developments, applications and critical issues.Bull. Amer. Meteor. Soc., 90, 515–534.
Tao, W.-K., J. R. Scala, B. Ferrier, and J. Simpson,1995: The e¤ect of melting processes on the devel-opment of a tropical and a midlatitude squall line.J. Atmos. Sci., 11, 1934–1948.
April 2010 S.-H. CHEN and Y.-C. SIAO 121