evaluation of anthropomorphic test devices under...
TRANSCRIPT
Evaluation of Anthropomorphic Test Devices
under Seatbelt Pre-Pretensioner Loading Collecting volunteer subjects data for crash test dummies
characterization towards further development of active restraints
Master’s Thesis in the Programme of Automotive Engineering
JEAN-ADRIEN DEVELET
Department of Applied Mechanics
Division of Vehicle Safety
Injury Prevention
CHALMERS UNIVERSITY OF TECHNOLOGY
Göteborg, Sweden 2013
Master’s Thesis 2013:12


MASTER’S THESIS IN THE PROGRAMME OF AUTOMOTIVE ENGINEERING
Evaluation of Anthropomorphic Test Devices under Seatbelt
Pre-Pretensioner Loading
Collecting volunteer subjects data for crash test dummies characterization towards further
development of active restraints
JEAN-ADRIEN DEVELET
Department of Applied Mechanics
Division of Vehicle Safety
Injury Prevention
CHALMERS UNIVERSITY OF TECHNOLOGY
Göteborg, Sweden 2013


i
Evaluation of Anthropomorphic Test Devices under Seatbelt Pre-Pretensioner Loading
Collecting volunteer subjects data for crash test dummies characterization towards further
development of active restraints JEAN-ADRIEN DEVELET
© JEAN-ADRIEN DEVELET, 2013
Master’s Thesis 2013:12
ISSN 1652-8557
Department of Applied Mechanics
Division of Vehicle Safety
Injury Prevention
Chalmers University of Technology
SE-412 96 Göteborg
Sweden
Telephone +46 (0)31-772 1000

ii CHALMERS, Applied Mechanics, Master’s Thesis 2013:12
Chalmers Reproservice / Department of Applied Mechanics
Göteborg, Sweden, 2013
Evaluation of Anthropomorphic Test Devices under Seatbelt Pre-Pretensioner Loading
Collecting volunteer subjects data for crash test dummies characterization towards further
development of active restraints
Master’s Thesis in the Programme of Automotive Engineering
JEAN-ADRIEN DEVELET
Department of Applied Mechanics
Division of Vehicle Safety
Injury Prevention
Chalmers University of Technology
ABSTRACT
Pre-pretensioners are active and reversible devices that apply light tension to the seatbelt (less
than 300N) which pulls road vehicle occupants rearwards and reduce the backset (head-to-
head restraint horizontal distance). This action has been found to have the potential to reduce
the number of whiplash injuries in rear impacts. However, pre-pretensioners induced a new
load case on current Anthropomorphic Test Devices (ATDs) for which they have not been
validated. The purpose of this thesis was to evaluate the biofidelity of ATDs under pre-
pretensioner loading in a stationary environment. A literature review resulted in eleven testing
positions that either occur frequently (backset exceeding recommendations) or have high
injury potential (leaning far forward at the driver and front passenger seats). Experiments
were conducted with four groups of research subjects (N=2 AF05, N=9 AF50, N=8 AM50
and N=10 AM95). The first phase of the work was the evaluation of the biofidelity of two
AM50 ATDs (the BioRID-II and the THOR-NT). The second phase consisted of evaluating
the differences in response induced by the rear seat as compared to the front seat. The third
and last phase aimed at quantifying the effect of anthropometry on the response to PPT
loading and involved AM50 and AF05 volunteer subjects. Corridors for global kinematics and
seatbelt force were generated based on data from experimentations on volunteer subjects.
ATD responses were compared to the corridors in terms of amplitude, peak occurrence and
shape. For slight out-of-position cases (backset ~80mm), the THOR-NT was found to be close
to relaxed volunteers and the BioRID-II to tense volunteers; both were suitable for pre-
pretensioner testing. Although the BioRID-II results were closer to the corridors than the
THOR-NT results in the far forward leaning positions, neither showed sufficiently large
rearward motions and head rotations to fit the corridors. Furthermore, head rotations were
problematic for both ATDs in the three test positions. Therefore, construction changes to both
the spine, pelvis and occipital joints are suggested in order to improve the biofidelity of
BioRID-II and THOR-NT in far forward leaning positions. The rearward motion was found to
happen faster at the rear seat as compared to the front seat, based on AM50 corridors.
Repositioning AF05 subjects was found to be quicker than that of AM50 subjects. Part of the
present work was the object of a manuscript orally presented at the 9th
Injury Biomechanics
Symposium, organized by the Injury Biomechanics Research Laboratory of Ohio State
University, in May 2013.
Key words: out-of-position, repositioning, pre-pretensioners, active seatbelt, motorized
seatbelt, ATD, evaluation, biofidelity, volunteer testing, corridor.

CHALMERS, Applied Mechanics, Master’s Thesis 2013:12 iii
Acknowledgements
The author would like to thank Volvo Cars Corporation for providing testing
equipment, the University of Michigan for sharing CT scans data, Autoliv Research for their
involvement in the study and the supply of testing equipment, the Division of VEAS at
Chalmers for the laboratory, and the Division of Vehicle Safety at Chalmers and SAFER, for
constant support and scientific guidance throughout the study.

iv CHALMERS, Applied Mechanics, Master’s Thesis 2013:12
Contents
ACKNOWLEDGEMENTS ............................................................................................... III
1 INTRODUCTION ........................................................................................................ 1
1.1. Background ............................................................................................................ 1
Integrated safety ............................................................................................................ 1 The Out-Of-Position (OOP) issue. ................................................................................ 1 Measurement of backset under real-life driving conditions. ......................................... 1 Pre-crash active seatbelts or pre-pretensioners. ............................................................. 1 Potential of PPTs to reduce the number of whiplash injuries in rear impacts. .............. 2
1.2. Biomechanical perspectives ................................................................................... 2 Whiplash injury scenario in rear-end collisions ............................................................ 2 Strategies for preventing whiplash injuries, benefits and limitations of PPTs .............. 3
Acceleration and load levels .......................................................................................... 3 Different types of testing environment .......................................................................... 3 Seat system .................................................................................................................... 4 Selection of parameters for the evaluation the biofidelity ............................................. 4
1.3. Purpose ................................................................................................................... 6
Specific research questions in the study ........................................................................ 6
Scope ............................................................................................................................. 6
2 METHODS AND MATERIALS .................................................................................. 7
2.1. Research subjects ................................................................................................... 7
Selection of ATDs ......................................................................................................... 7 Volunteer subjects ......................................................................................................... 7
2.2. Testing environment ............................................................................................... 8
Instrumentation and data acquisition ............................................................................. 9
Calibration of measurement equipment ....................................................................... 10 Coordinate systems ...................................................................................................... 10
2.3. Test procedures .................................................................................................... 11 Instructions .................................................................................................................. 11
Preparation of the subjects ........................................................................................... 11 Experimental precautions ............................................................................................ 12 Evaluation of biofidelity of AM50 ATDs ................................................................... 12
Effect of habituation to PPT loading on the response ................................................. 12 Front and rear seat ....................................................................................................... 12
Effect of anthropometry on response to PPT loading .................................................. 12 Test matrix ................................................................................................................... 12
2.4. Data analysis ........................................................................................................ 13
Corridors ...................................................................................................................... 13 Data processing ............................................................................................................ 13
3 RESULTS ................................................................................................................... 15
3.1. Description of seatbelt force and T1 x-displacement ........................................... 15
3.2. Evaluation of ATDs ............................................................................................. 16 Seatbelt force characteristics ....................................................................................... 16 Backset, T1 x-displacement and velocity. ................................................................... 16 Head-neck complex motion. ........................................................................................ 18 T1 z-displacement ........................................................................................................ 18
3.3. Effect of habituation of PPT loading on the response .......................................... 22

CHALMERS, Applied Mechanics, Master’s Thesis 2013:12 v
3.4. AM50 differences between the front and rear seats ............................................. 26
Seatbelt force characteristics ....................................................................................... 26 Backset, T1 x-displacement and velocity .................................................................... 26 Motion of the head-neck complex ............................................................................... 26
T1 z-displacement. ....................................................................................................... 26 3.5. AM50 and AF05 differences in kinematics ......................................................... 28
Seatbelt force characteristics ....................................................................................... 28 Backset, T1 x-displacement and velocity .................................................................... 28 Head-neck complex motion. ........................................................................................ 28
T1-z displacement. ....................................................................................................... 28
4 DISCUSSIONS ........................................................................................................... 30
Definition of testing positions. .................................................................................... 34 Computation of the corridors. ...................................................................................... 34
Effect of individual behavior on volunteer responses. ................................................ 31 First exposure to PPT loading ..................................................................................... 31 Front seat vs rear seat .................................................................................................. 31
AM50 vs AF05 ............................................................................................................ 32 Effect of the support rod on the seated posture. .......................................................... 34 ATD seated position and OOP instability. .................................................................. 35 Minor issue with the power supply. ............................................................................. 34
THOR-NT, construction detail. ................................................................................... 35 BioRID-II and belt loading. ......................................................................................... 35 Regarding the strategy in the pre-crash phase – thoughts about the interaction between
PPT triggering and collision avoidance systems ............................................................... 35 PPT loading and at-risk populations. ........................................................................... 36
PPT loading and sideway/rearward facing. ................................................................. 36
Tentative improvement suggestions to the construction of the ATDs. ....................... 36
5 FUTURE WORK ........................................................................................................ 37
6 CONCLUSIONS ......................................................................................................... 38
7 APPENDICES – AM50 VOLUNTEER SUBJECT DATA ....................................... 39
7.1. Literature review – different OOP cases .............................................................. 39 Sitting upright .............................................................................................................. 39
Rotated head ................................................................................................................ 39 Leaning forward .......................................................................................................... 39
Leaning sideways ........................................................................................................ 40 Leaning forward and sideward .................................................................................... 40 Leaning rearwards ....................................................................................................... 40
Choice of OOP scenarios ............................................................................................. 40 7.2. Ethical considerations .......................................................................................... 41 7.3. IAR of the lower neck .......................................................................................... 42 7.4. Specificities of the rear seat ................................................................................. 42
7.5. Validation of the lense calibration ....................................................................... 42 7.6. Use of the morphomics database to locating the center of the body of T1 .......... 43 7.7. AM50, Position 1. Real life driving posture ........................................................ 45 7.8. AM50, Position 2. Attempting to increase visibility at intersections. .................. 46 7.9. AM50, Position 3. Searching the glove box. ........................................................ 47 7.10. AM50, Position 4. Talking to front row occupants. ......................................... 48 7.11. AF05, Position 4. Talking to front row occupants. ........................................... 49

vi CHALMERS, Applied Mechanics, Master’s Thesis 2013:12
Notations
AM ....................................................................................................................... Auditori Meatus
AM50 ............................................................................................................. 50th percentile male
ATDs ................................................................................................. Anthropometric Test Devices
C7 ............................................................................................................ Seventh cervical vertebra
EPN ....................................................................... Etikprövningsnämnderna, regional ethical board
HR ......................................................................................................................... Head Restraint
H-Point ............................................................... Pivot center of the torso and thigh (SAE 2009)
IAR ................................................................................................ Instantaneous Axis of Rotation
MY ............................................................................................................................ Model Year
OC ................................................................................................................ Occipital Condyles
OOP ....................................................................................................................... Out-of-position
PPT(s) ............................................................................................................... Pre-pretensioner(s)
T1 ................................................................................................................. First thoracic vertebra
CHALMERS, Applied Mechanics, Master’s Thesis 2013:12 1
1 Introduction
1.1. Background
Road traffic accidents have been reported to cause 1.2 million deaths and 50 million
injured people worldwide every year (Peden et al. 2004). In Europe, numbers such as 127,000
deaths and 2.4 million injured people per annum have been reported (Racioppi et al. 2004).
The yearly cost of road crash injuries was estimated to EUR180 billion (Peden et al. 2004),
(Peden et al. 2004), which was comparable to the entire Research and Development public
funding budget in the EU in 2008 (1% of the EU GDP according to the International
Monetary Fund) (EU 2008). These facts explain the need of road accident injury mitigation,
and stressed the need for improved road vehicles restraints effectiveness. The latter
effectiveness was reported to be significantly affected by belt slack (Müller et al. 1998).
Pretensioners were introduced with the aim of reducing the amount of belt slack in a very
early phase of the crash, the load peaking ~10-20ms after the impact (Siegmund et al. 2001,
Carlsson et al. 2012). This delay is due to the firing of the pyrotechnic actuator of
pretensioners, and could be removed by triggering the pretensioners before the collision.
Integrated safety was introduced in 2005, integrating both passive and active safety.
Among others, it opened the door to the development of active restraints (Bangash 2007).
Triggered by signals from active safety and especially hazard detection systems, active
devices could prepare the occupant compartment in order to improve the effectiveness of
passive restraints.
The Out-Of-Position (OOP) issue. The effectiveness of passive restraints was not
only reported to be affected by belt slack, but also by the position road vehicle occupants take
(Sander et al. 2009, Mages et al. 2011). OOP, commonly understood and applied as “any
sitting posture in which the research subject is not in the optimal posture” (Khadilkar et al.
1998, Viano et al. 2011), was found to lead to higher injury risk indexes through testing with
ATDs and computer simulations (Bose et al. 2010, Viano et al. 2011). An interpretation of
“optimal posture” would be sitting postures defined by authorities such as the EuroNCAP in
official testing protocols.
Measurement of backset under real-life driving conditions. The RCAR-IIWPG
recommends backsets below 7cm then head restraints are rated “good” (RCAR-IIWPG 2008).
Male subjects were observed during car driving (motorway, urban context) in two studies; the
first (35 males, average stature 181cm, SD 8cm) found an average backset of 77mm (Jonsson
et al. 2008) and the second (7 males, no stature recruitment criteria) of 85mm (Shugg et al.
2011). In other terms, in real-life driving conditions, the average backset exceeds the
recommendations, and drivers sit OOP. In terms of frequency, the posture of drivers observed
in 5,106 vehicles in different traffic contexts found backsets reported as “medium” – greater
than 50mm – in 78% of cases (Bingley et al. 2005). These results add to the potential benefit
of the implementation of Pre-Pretentioners (PPTs), which aim at repositioning the occupants
thus reducing the backset. This could reduce the risk of sustaining short term whiplash
injuries. A more detailed review of observational studies is presented under the section
Methods.
Pre-crash active seatbelts or pre-pretensioners. Among other restraints, the
potential of active seatbelts was investigated (Bangash 2007, Gkikas 2012). By making
seatbelt tensioning reversible and controllable, seatbelts were foreseen to have the potential
both for belt slack reduction (thus keeping the occupant further away from harmful surfaces

2 CHALMERS, Applied Mechanics, Master’s Thesis 2013:12
and avoiding shock when the belt gets suddenly tight) and occupant repositioning (thus
mitigating the OOP issue) in the pre-crash phase. PPTs, also known as motorized shoulder
belts or pre-crash active seatbelts, are a countermeasure to both these issues.
Potential of PPTs to reduce the number of whiplash injuries in rear impacts. By tensioning the seatbelt and thus pulling road vehicle occupants rearwards, PPTs have the
potential to reduce the backset (head-to-head restraint horizontal distance), which has been
commonly admitted to be a major cause for whiplash injuries (Siegmund et al. 2001, Stemper
et al. 2006, Jonsson et al. 2008, Carlsson et al. 2012). Indeed, it was concluded from testing it
had a significant effect on the neck response (Svensson et al. 1996, Song et al. 1997). It was
found that above 10cm of backset, symptoms associated to whiplash have a duration
exceeding one year (Olsson et al. 1990). This was further investigated through a statistical
study on road accident data, which found that the risk of persistent (or severe) AIS1 neck
injuries (so called whiplash injuries) got below 0.1 or 10% if the backset was reduced to less
than 10cm (Jakobsson 2004). In addition, regardless the severity of the impact, the risk of
suffering AIS1 neck injuries was reported to be higher for a gap greater than 10cm; the
proportion of occupants who suffered from persistent neck injuries is more than twice bigger
above than below 10cm (Figure 1). A backset lower than 6cm was recommended by several
researchers - among others (Siegmund et al. 2001, Jakobsson 2004), based on whiplash injury
risk in rear-end impacts. In terms of official recommendations, NHTSA mentionned
5.5cm(NHTSA 2007), and the RCAR 7cm (RCAR-IIWPG 2008).
Figure 1: Rates of initial and persistent AIS1 neck injury with respect to estimated head to head restraint
distance at the time of impact; front seat occupants without prior neck problems (Jakobsson 2004).
1.2. Biomechanical perspectives
Whiplash injury scenario in rear-end collisions. During a road accident, the
accelerations induced by the collision(s) act on the whole vehicle. The head-neck complex,
which can be seen as an unrestrained weight, undergoes inertial phenomena. A lag between
the head and the torso is then observed (Svensson et al. 2000), which causes a retraction
motion, followed by an extension motion of the neck (Figure 2).
Figure 2: whiplash motion in rear-end collisions
a)initial position, b)retraction, c)extension. (Svensson et al. 2000)

CHALMERS, Applied Mechanics, Master’s Thesis 2013:12 3
Strategies for preventing whiplash injuries, benefits and limitations of PPTs
Different whiplash injury mechanisms were formulated in the past. Loads-based criteria (e.g.
Upper Neck Shear Force or Nkm) were derived from soft tissues and facet joints injuries
(Schmitt et al. 2010). Based on injuries findings in the nerve root region in the cervical spine,
observations of pressure gradients in the cerebro-spinal fluid were made on animals subjected
to a whiplash scenario (Svensson et al. 2000). Even though the whiplash injury mechanism
has not yet been established, recommendations for the design of restraints aiming at
mitigating whiplash injuries in rear impacts were formulated by three biomechanical
guidelines; 1) reducing the occupant’s acceleration level, 2) minimizing the changes in spinal
curvature and 3) reducing the level of interaction between occupant and seatbelt in the
forward rebound phase of a rear-end impact (Lundell et al. 1998). The WHIPS (WHIplash
Protection Study) (Lundell et al. 1998) and SAHR (SAAB Active Head Restraint) (Wiklund
et al. 1998) addressed or partly addressed these issues in the early phase of the crash.
The benefit of PPTs lied in an earlier action – in the pre-crash phase – thanks to the
interaction with active safety systems of hazards detection. The time to take an action was
then increased; in addition the actions taken to adjust the occupant’s environment would be
made easier as they would take place in a steady state or low-g environment. However, it
should be clear that PPTs alone could not address the three above requirements. First and
foremost, PPTs used seatbelt, and were independent from the seat itself. The latter seat should
be designed so that no local rigid structure would force relative movements of adjacent
vertebraes (homogeneous stiffness) and so that adequate energy absorption level would be
provided. Second, PPTs would not be expected to reduce the acceleration level on the
occupant, they might contribute to the two other requirements.
Minimization of changes in the spine curvature during the crash would be addressed by a
repositioning of the occupant in the pre-crash phase; the latter occupant would ideally already
be in full contact with the seat at the time of impact. The injury potential of the interaction
between the seatbelt and the occupant might be lowered by the complete removal of belt slack
in the pre-crash phase.
Acceleration and load levels Force levels lower than 0.3kN were reported to be
adequate for repositioning purpose in stationary conditions (Lorenz et al. 2001). Similar loads
(0.1-0.4kN) were used later in a study modelling the occupant’s mechanical reaction under
pre-pretensioning (Good et al. 2008). From pilot testing, this resulted in acceleration levels
below 1g at the center of gravity of the head and in the first and eighth thoracic vertebrae (T1
and T8, respectively) in the longitudinal direction. As a comparison, seatbelt load limiters
equipping passenger vehicles were designed for thresholds around 4kN (Foret-Bruno et al.
2001, NHTSA 2007). As a consequence, the tension in the belt induced by PPTs may be
described as a light load case. Therefore, lower extremities legs were not expected to have any
significant effect on the subjects’ responses and the H-Point was not expected to move much.
Different types of testing environment A full laboratory setup would consist of a jig
supporting seat, seatbelt and eventually steering wheel (Ono et al. 1999, Jonsson et al. 2008,
Carlsson 2012). The environment was open for enlightening and video acquisition
convenience (no obstruction hence large field of view); it would need a rather complex jig in
order to conduct tests with and without a steering wheel, and at both front and rear seats. A
body-in-white (chassis of a car equipped with a dashboard) presented the advantage of a
realistic test environment (pillars, dashboard in same the position than those of a car), while
maintaing convenience for video acquisition (absence of doors). The transportation of the
latter potential test environment was expected to require extensive logistics (truck, lift etc.).
The choice of a passenger vehicle, while adding constraints on the choice of the video
4 CHALMERS, Applied Mechanics, Master’s Thesis 2013:12
acquisition system (particularly the lens), would allow for some flexibility in terms of
transportation.
Seat system. In vehicle safety research, three types of seats have been used. A rigid seat,
made of two steel plates, presented the advantage of reproducibility and low-complexity for
modelling; it has been used to a rather large extent (Bertholon et al. 2000). However such a
seat had limitations in terms of applications as its mechanical properties were far from an
automotive seat. A flexible seat, closer to an automotive seat while keeping a simple
construction, was designed at Chalmers and tested (Davidsson et al. 2001). It should be noted
that oscillatory behaviors of different seat parts (back support and HR spring-mounted) have
been observed during testing, introducing disturbances on the interaction between the subject
and the seat. Production seats have been mainly developed around two aspects, comfort, and
safety (Happian-Smith 2001, Gkikas 2012), which resulted in an increased complexity as
compared to rigid or flexible seats. Comfort and safety influenced the shape of the seat
(paddings, angles), but also various stiffnesses (foam, recliner, head restraint among others)
and energy absorption properties (Schneider et al. 1983, Nilson et al. 1994, Benson et al.
1996, Svensson et al. 1996, Lundell et al. 1998, Watanabe et al. 2000). For instance, it was
found that varying the stiffness of the lower part of the recliner had effects on the relative
movements between the head and the torso during rear-end impact (Svensson et al. 1996,
Song et al. 1997, Watanabe et al. 2000). Foam has been used in production seats for padding
(comfort) and energy absorption purposes (Weissner et al. 1985, Minton et al. 1998). Ageing
of this material was found to alter its properties and improvements in durability have been
studied (Brasington et al. 1996). However, series of BioRID light rear-end impacts tests (11
km/h) showed that foam properties did not significantly affect the subjects’ kinematics – the
initial posture had greater influence on the kinematics of the subject (Szabo et al. 2002). The
stiffness of cushions in production seats was increased in the context of submarining
prevention (Fildes et al. 1991, Nilson 1995); consequently the cushion was not expected to
deform much under PPT loading. The cushion of rigid and flexible seats being a stiff plate,
the amplitude of the movement of pelvis of the subjects was not expected to be significant
whatever the choice of seat. Finally, the shape of the seat was observed to vary between car
models and manufacturers; rigid and flexible seats presented the advantage of a standard
shape. Specificities of the rear seat and their biomechanical consequences were reported
(Forman et al. 2009, Sahraei et al. 2010). To the author’s knowledge, neither rigid nor
flexible seats have been constructed for rear seat testing. The choice of those would thus
require their development.
Selection of parameters for the evaluation the biofidelity received particular
attention as it was expected to affect the results quite much. They should be measurable in a
repeatable and reproducible manner for both ATDs and volunteer subjects, while respecting
ethics – measurement techniques shall not expose volunteer subjects to pain or hazards.
A consequence of the latter statement made difficult the direct measurement of forces and
moments for the evaluation of load-based injury criteria such as the Upper Neck Shear or the
Nkm – combining moments and axial loads (Bangash 2007) – used in the rating of new cars
(EuroNCAP 2011). Another approach lied in the backtracking of the loads based on
kinematics measurements (distances, angles, angular and linear velocities, angular and linear
accelerations). This required the evaluation of inertia parameters such as the mass of the head.
While such a method might be rather accurate with ATDs (clear definitions of inertias, head
centre of gravity position, etc.), it might introduce significant uncertainties for volunteers –
whose head inertias could only be estimated, not measured. The preparation preceeding
volunteer subjects experimentations could gain in complexity. Load-related parameters,
because of the high ratio complexity/result, were therefore dismissed.

CHALMERS, Applied Mechanics, Master’s Thesis 2013:12 5
Basic kinematics parameters were another option. The idea was to choose these
parameters so they described the global motion of the subject (key point trajectories, change
in distance and change in angle). As the scope of the study was whiplash injury mitigation,
the head-neck complex received a particular attention. The neck-link model was introduced
to describe the head-neck complex motion based on a two-pivot linkage mechanism
(Wismans et al. 1987). Pivot axles were located at T1 and at the Auditori Meatus (AM), and
both the neck and the head constituted the linkages. By adding the measurement of the
rotation of T1 (indicating the upper body rotation around the y-axis) to the latter model, which
included neck and head rotations, the four configurations of the head-neck complex
(extension, flexion, retraction, protraction) might be described. An investigation about the
location of the instantaneous axes of rotation (IAR) of the lower pivot of neck-link model was
led with the aim of improving the accuracy of film analysis (Appendix 7.3). Knowing that
mainly mid-sagittal motions were foreseen for this study, the choice of locating the IAR of C7
(lower neck) in the center of the body of the vertebra T1 was made. It resulted in the
configuration presented in Figure 3. The change in distance between T1 and OC was proposed
as a metrics for the study of changes in while the cervical spine curvature (Davidsson 2000).
The z-displacement of T1 was expected to change with the curvature of the thoracic spine.
Under PPT thus light loads, the amplitude of the H-Point trajectory was expected be low.
However for verification purpose it shall be tracked. The x-displacement of T1 in the test
environment coordinate system would allow for tracking the upper body motion. Using the
backset – similar to the x-displacement of the head – would not only allow for characterizing
the lag between head and upper torso, but would also be interesting in whiplash injury
research context.
Figure 3: Definition of the head and T1 local coordinate systems and location of the Occipital Condyle (OC), the
Auditory Meatus (AM) and T1. *: estimated position by palpation (OC). Adapted from (Davidsson et al. 1999).
The interaction between the subjects and the seatbelt, comprising seatbelt force as well as
webbing retraction, were also considered. Seatbelt force is the cause of the motion and its
characteristics was expected to depend on the reaction of the subjects – their construction, for
ATDs, and their behavior, tense or relaxed, for volunteer subjects. Measuring the retraction of
the webbing would allow for measuring the initial belt slack and understanding its effects
under PPT loading. Finally, environment variables should be recorded for repeatability,
reproducibility and validation purpose. The cause of the kinematics of the subjects could be
recorded; starting at the power supply of the PPTs. Tension at the poles of the battery as well
as current consumption were recorded.
In terms of measurement techniques, the use of accelerometers – which signals could be
integrated - placed on the skin would be disturbed by gravity during rotation motions around
the y-axis and were therefore dismissed. This effect could be compensated by the use of a

6 CHALMERS, Applied Mechanics, Master’s Thesis 2013:12
gyro, which implementation was experienced to be tedious and expensive within the research
group of Injury Prevention. Film targets and video acquisition followed by processing was the
last option.
1.3. Purpose
Current Anthropomorphic Test Devices, or crash test dummies, were neither designed nor
validated for low forces generated by the seatbelt such as PPT loading. What was unknown
was their biofidelity under seatbelt pre-pretensioner loading. Therefore the present study
aimed at characterizing the ability of a set of state-of-the-art ATDs to reproduce human-like
biomechanical responses in this context. These ATDs were selected based on the closeness of
PPT loading to the load case they were designed for.
This knowledge can be used to improve the design of the test tools as well as further
develop seatbelt pre-pretensioner devices. The restraint systems would be expected to gain in
effectiveness. This study thereby contributed to the long-term goal of reducing road traffic
accidents injury outcomes and thus saving lives.
The evaluation was based on a comparison of biomechanical response (global kinematics)
of volunteer subjects and ATDs under seatbelt pre-pretensioner loading in stationary
conditions.
Specific research questions in the study
Quantify differences in global kinematics and belt-occupant interaction between AM50
ATDs and AM50 volunteer subjects,
Investigate differences in volunteer subject response between the very first exposure to
PPT loading and the second one (habituation effect),
Quantify differences in volunteer subject response to PPT loading between front and rear
seat,
Quantify differences in volunteer subject response to PPT loading between AM50 and
AF05.
Scope
The following was not implemented/studied in the present thesis:
Evaluation of the biofidelity of other ATD sizes than AM50,
Evaluation of load-based injury criteria (involving estimations of head inertia and
acceleration measurements),
Evaluation of detailed kinematics of the head neck complex (e.g. local extension and
flexion phenomena),
Evaluation of the effect of PPT loading on chest injuries (e.g. by measuring chest
deflection),
Evaluation of muscle tonus (e.g. via surfacic EMG measurements),
Evaluation of the repeatability of experimentations on both ATDs and volunteer subjects,
Evaluation of the effect of PPT loading on at-risk populations (e.g. children, elderly,
obese),
Potential of PPTs in other than mid-sagittal plane OOPs (e.g. rotated head, leaning
sideways).

CHALMERS, Applied Mechanics, Master’s Thesis 2013:12 7
2 Methods and Materials
Evaluating the biofidelity or “the quality of being lifelike in appearance or responses” -
here to be interpreted as biomechanical responses of the ATDs – was done by comparing
ATDs and volunteer subject responses. A series of identical tests was conducted for both
types of subjects. The latter initially sat OOP, and then the PPT pulled them backwards. The
experimentation environment was stationary. The test series were reviewed and approved by
the regional ethical board of Gothenburg, Sweden (Etikprövningsnämnderna).
2.1. Research subjects
The research subjects were chosen to represent four size groups; the 5th
percentile female
AF05, so called small-sized female, the 50th
percentile female AF50, so called average-sized
female, the 50th
percentile male AM50, so called average-sized male and the 95th
percentile
male AM95, so called large-sized male. It should be noted that the anthropometry of the
small-sized female population was reported to be close to that of a 12 years-old children
(Schneider et al. 1983). As explained in the introduction, a biofidelity evaluation of AM50
only was performed in the present study, but volunteer data were collected for the four sizes
presented above.
Selection of ATDs. The THOR-NT AM50 and the BioRID-II AM50 were chosen for
thuis study. They were selected for the closeness of the load case they were designed for to
PPT loading. The latter loading, in the present study, did not involve any acceleration field
acting on the test environment (stationnary). The ATDs were placed on a passenger vehicle
seat in a predefined posture representing a selecectd OOP scenario. Then the shoulder belt
was loaded with a light tension. As a consequence the chest of the subject got compressed,
which initiated a flexion motion of the head neck complex. A similar phenomenon was
observed in frontal impacts, and the interaction between the occupant and the seatbelt loading
under pre-pretensioning was assumed to be equivalent to that of a light frontal impact. The
present application of PPT loading being whiplash injury prevention, the head-neck complex
kinematics of the selected ATDs got a special attention.
The BioRID-II AM50 (HumaneticsATD), used for the assessment of seats in low-speed
rear-end impact tests in Europe, was designed for whiplash injuries and thus selected. The
RID-3D AM50 (HumaneticsATD) was also developed for the evaluation of whiplash injury
risk for frontal and rear crashes, but was not selected by assessment programs in place to date
– therefore it was not selected for the present study. The Hybrid-III AM50 (HumaneticsATD),
historical reference, was designed for violent frontal impacts. It was found to be stiff in the
spine, preventing a biofidelic replication of the head-neck complex in rear-end impacts
(Davidsson et al. 1999). As a consequence it was not selected. The THOR-NT (NHTSA
2001), actually under review and update, was an AM50 subject designed for frontal and
oblique crashes; it may have some potential for PPT loading as it was found above to be
equivalent to a light frontal impact. In addition the THOR was developped to replace the HIII,
and might take part in upcoming regulations.
Volunteer subjects. Volunteer subjects were selected to represent AM50 and AF05
populations, accepting a range of ±3% on the stature and ±13% on the weight (Table 1).
Selection criteria were based on volunteer’s gender, stature, weight, age and availability for
the study. Gender, stature and weight were based on the test tools anthropometry, derived
from international standards set by a large scale study (Schneider et al. 1983). These ranges
were expanded until one of the size criteria of AM50 overlapped with the anthoprometry of

8 CHALMERS, Applied Mechanics, Master’s Thesis 2013:12
the 95th
percentile male (Schneider et al. 1983). As age was found to influence the cross-
sectional area of skeletal muscles (reduction of ~40% between 20 and 40 years old) (Williams
et al. 2002), and to change muscle strength (Doherty 2001), it may influence the
biomechanical response of participants. A span of 20 to 40 years of age was thus targeted.
The number of volunteers was based on the experience within the research group. A total of
eight AM50 volunteers (Table 2) participated. As the recruitment of small-sized females was
particularly tough, only three subjects participated; one of them did not match the age
criterion but was included (AF05.01), and AF05.02 was excluded on grounds for medical
history (osteoporosis) (Table 1).
Table 1: AF05 research subjects anthropometry
Subject ID
Body weight
[kg]
Seated height*
[cm]
Stature
[cm]
Age
[year]
HIII-AF05 49 62 150 N/A
Recruitment criteria 47±6 N/A 151±4 25±5
AF05.01 47 62 147 61
AF05.03 54 66 151 30
Table 2: AM50 research subjects anthropometry
Subject ID
Body weight
[kg]
Seated height*
[cm]
Stature
[cm]
Age
[year]
BioRID-II 78 80 178 N/A
THOR-NT 78 79 180 N/A
Recruitment criteria 77±8 N/A 175±5 25±5
AM50.0 72 79 177 24
AM50.1 75 79 180 24
AM50.2 75 80 181 24
AM50.3 70 76 175 25
AM50.4 72 77 175 24
AM50.5 76 80 180 25
AM50.6 76 77 175 25
AM50.7 70 77 180 24
Average 73 78 178 24
Standard Deviation 3 2 3 1
*Distance between the trochanter major and the top of the head in a posture close to (EuroNCAP 2011)
protocols; measured on research subjects inside the test vehicle, precision ±2cm.
2.2. Testing environment
A recent and fully operational test vehicle was chosen (XC70 MY2009). OOP scenarios
were intuited to be influenced by the occupant’s environment; both outside (traffic context)
and inside (interior layout: location of dashboard, steering wheel, etc.) the road vehicle. The
latter interior was foreseen as especially influencing the posture taken by occupants, serving
as a basis for the definition of realistic testing positions. In addition the choice of a passenger
vehicle allowed for some flexibility in terms of transportation of the testing environment

CHALMERS, Applied Mechanics, Master’s Thesis 2013:12 9
between the different phases of the project (preparation and pilot testing at Autoliv Research,
ATD testing at Volvo Safety Center and volunteer testing at Chalmers). Besides, in the
present application the loads were expected to be low. This would result in a low loading of
the seat. While the properties of the seat were not expected to have major influence on the
results, the shape of the seat and HR was. Using a well-rated, and recently designed seat was
expected to ensure state-of-the-art shaping and reduce the differences in seat properties for
potential later studies.
The dynamic assessment of car seats for neck injury protection testing protocol
(EuroNCAP 2011) was chosen for the front seat, as the present restraint had applications in
whiplash injury mitigation; the steering wheel was set at mid-depth and mid-height and the D-
ring at the highest, the longitudinal adjustment at the middle position, and the cushion angle at
the lowest. The rear seat was not adjustable. An H-Point machine was used in order to adjust
the seat back angle. A Head Restraint Measurement Device was used to measure the geometry
of the HR in the center-line of both front and rear seats; this allowed to account for the shape
of the head restraint.
Figure 4: description of main environment variables at the driver’s seat.
Instrumentation and data acquisition. Voltage at the poles of the battery of the car
(12V, two batteries mounted in parallel, 70Ah, constantly under charge) and the current
consumption were measured with a voltage divider bridge (ratio of 4) and a magnetic 80i-
110s amp-meter (Fluke, USA), respectively. Tension in the seatbelt was acquired with a
taylor-made transducer 5BC (capacity of 2kN) (Messring, Germany). Belt movement was
measured with a 2098 optical sensor reading a sticker set on the seatbelt (IES, Germany).
Kinematics were filmed with a GigE UI-5220CP camera (IDS, Germany) equipped with a
LM5NCL lens with a focal length of 4.5mm (Kowa, UK). The pre-pretensioner and data
acquisition system were controlled with a NI-USB6251 DAQ running two LabVIEW
programs (National Instruments, USA); one for analog channels, sampling at 2kHz, and one
for the camera, sampling at 50Hz (Figure 5). PPT and data acquisition system were triggered
on the same analog signal. A prototype unit comprising three identical PPT devices, power
supply and controller was installed in the test vehicle.

10 CHALMERS, Applied Mechanics, Master’s Thesis 2013:12
Figure 5: Data acquisition system – standard power supplies not represented.
Calibration of measurement equipment. The force transducer was calibrated with a
one-point approach, under a load of 295N (30kg). Compensation for distortion from the lens
was applied; fine-tuning of position of the cameras with regards to the motion plane allowed
for reaching a tracking error estimated to ±2mm (<1%) in the area of the head and upper body
(Appendix 7.5).
Coordinate systems were chosen in accordance with SAE J211/ISO6487 – “For vehicle
and laboratory coordinate systems, positive z-axis will be directed downward, positive x-axis
will be directed forward relative to the vehicle and positive y-axis will be directed away from
the vehicle's left to its right” (SAE 2007, EuroNCAP 2011). The orientation of local
coordinate systems on the subjects (head and neck) were derived from the same standard
(Figure 6).
Figure 6: SAE J211/ISO 6487 sign convention

CHALMERS, Applied Mechanics, Master’s Thesis 2013:12 11
2.3. Test procedures
Instructions. As few instructions as possible were given to the subjects. Support rods in
light wood were used to position volunteer subjects. In order to avoid unrealistic
configurations of the head-neck complex, the subjects were asked to sit as if they were in a
given situation; then the test leader positioned the rod against the reference point. The subject
slightly adjusted his posture so that his/her nasion contacted the rod. Volunteer subjects were
instructed not to apply a force on the rod, but just to keep it in place; they were given time to
practice this exercise. For the first test, the test leader pretexted routine checks while the
volunteer subject was waiting in position, holding the support rod; a chat aiming at avoiding
overfocusing the subject on the experimentation took place. The PPT was triggered during the
chat, without prior notice towards the volunteer subject.
Preparation of the subjects Two skin landmarks were positioned on the subjects with
the aim of locating the center of the body of T1. Palpation allowed for locating the proximal
ends of the clavicles (Clavicle Target) and the spinous process of T1 (T1 Target, Figure 7).
The OC was palpated and a make-up dot was drawn on it; another target was stuck on the
AM, and the last head target in line with the AM, in the Frankfurt plane, as close as possible
to the infraorbitale.
Figure 7: location of skin landmarks and the center of the body of T1 on a volunteer subject. Adapted from a
screenshot from TEMA3.5-012. Cropped frame, color correction
Subject were asked to palpate and point their left and right greater trochanter, commonly
used landmark for locationg the H-Point.
Video cameras recorded the kinematics of research subjects from side views only; only
their profiles were recorded. Research subjects' gender, age, weight, height, seated height, and
tests videos were referenced with a unique reference number; by doing so data coherence and
anonymity were ensured. By wearing a disguise eye mask allowing participants for seeing
while hiding their nose, eye cavity, eyebrow and lower forehead, facial recognition is
hindered. Indeed, both funding theories and state-of-the-art techniques (Goldstein et al. 1971,
Li et al. 2005, Efraty et al. 2012) were based on facial features (mainly eyebrows, eyes, nose,
mouth) geometry layout. Consequently test videos constituted anonymous research material.

12 CHALMERS, Applied Mechanics, Master’s Thesis 2013:12
Experimental precautions. ATDs and volunteer subjects wore cotton T-shirts from the
same batch to ensure similar friction with the seatbelt. Before activating the pre-pretensioner,
the seatbelt was unbuckled and the webbing was pushed in and pulled out to avoid tightening
effects around the spool. The test leader perceived the behavior of the volunteer subjects to be
either “tense” or “relaxed”.
Evaluation of biofidelity of AM50 ATDs To date, no protocol aiming at assessing
the effectiveness of active restraints such as PPTs taking into account the OOP issue has been
published. The definition of the posture in which the research subject shall sit was expected to
have some influence on the results, thus the testing position(s) had to be representative of real
life conditions, as the development and optimization of the restraints would be focused on
those scenarios. A literature review aiming at defining testing positions derived from real life
observations was therefore conducted (Appendix 7.1). Two main techniques were
implemented in order to evaluate how car occupants sit, field observational tests – by the
means of video recording and processing – and questionnaires. The frequency of usage as
well as the injury risk of recurrent types of OOPs in the literature were investigated. It
resulted in three testing positions in the front row, two at the driver’s place (the most frequent
OOP scenarios) and one at the front passenger place (the most extreme). The test matrix can
be found below (Table 3).
Effect of habituation to PPT loading on the response The difference in response
between the very first and following (second) exposure to PPT loading was implemented for
AM50 volunteer subjetcs. The experimental setup (test environment settings, PPT unit) was
identical to the one implemented for the testing positions reported in the Test Matrix (Table
3), and identical for the two tests (very first and second one). The test leader asked the
volunteers to sit in the test vehicle on the driver’s seat, hands on the steering wheel, holding a
support rod. The PPT was triggered, data recorded. A random initial posture was selected
between an initial backset of ~120mm and ~260mm. Then the test was repeated in the same
conditions. The difference between the first and the second test were to be studied.
Front and rear seat As differences in seat geometry and properties between the front
and the rear row were expected to affect the response (Appendix 7.4), data were also to be
collected in the rear seat (Position 4, Table 3). AM50 volunteer subjects participated to tests
conducted in similar experimental conditions (same PPT controller unit, same model of PPT,
same test vehicle, similar initial posture, use of support rods) in a front (driver) and rear (left)
seats.
Effect of anthropometry on response to PPT loading AM50 and AF05 (close to a
12 year old child) volunteer subjects were selected for this comparison based on data
collected from rear seats tests.
Test matrix Four testing positions were selected in order to answer the research
questions (Table 3); motivations for these choices can be found under Table 3 and Appendix
7.1. Limitations in the range of motion of ATDs led to the selection of mid-sagittal OOP only.
Testing positions at the driver, front and rear passenger seats were specified (particularly the
backset) during pilot testing. The tests happened in stationary conditions.

CHALMERS, Applied Mechanics, Master’s Thesis 2013:12 13
Table 3: Test Matrix
Test
ID
Position
(Pos.) Description Purpose
Backset
[mm]
Nasion-
Ref*
[mm]
1 Real life
driving
posture.
Driver seat
Hands on the steering wheel
Normal position according to
“The dynamic assessment of car
seats for neck injury protection
testing protocol” (EuroNCAP
2011)
Light forward (FW) leaning,
backset representative to real life
driving conditions (Jonsson et al.
2008)
Biofidelity
evaluation of
AM50 ATDs
80 425
2 Attemp-
ting to
increase
visibility
at inter-
sections.
Driver seat
Hands on the steering wheel
Far FW leaning, head in a
position that replicates situations
in which the driver attempts to
increase visibility at an
intersection.
Biofidelity
evaluation of
AM50 ATDs
260 265
3 Searching
the glove
box.
Front passenger seat
Hands on the lap
Far FW leaning, head position
replicating a situation in which
the driver searches the glove box
or the floor.
Biofidelity
evaluation of
AM50 ATDs
400 265
4 Talking to
front row
occupants.
Rear passenger seat
Hands on the lap
Light FW leaning, head position
replicating a situation in which
the occupant slightly leans FW
to talk to front row occupants
Effect of
anthropometry
on results
(AM50 vs
AF05)
100 650
*The reference (Ref) was a target on the steering wheel for Position1 and Position2 (driver seat), a target on the
dashboard for Position3 (front passenger seat) and a target on the driver HR for Position4 (rear passenger seat)
2.4. Data analysis
Corridors. The responses of ATDs and volunteer subjects to pre-pretensioner loading
were compared in terms of amplitude, peak occurrence and shape using a response corridor
approach. The corridors were generated from the volunteer subjects average response ±1
standard deviation (SD) based on the sample (Davidsson et al. 2001, Siegmund et al. 2001,
Carlsson et al. 2012).
Data processing. Kinematics was tracked with TEMA3.5-012 (Image Systems,
Sweden). Computed Tomography (CT) scan data extracted from the University of Michigan
morphomics database (Penning et al. 1987), allowed for locating the center of the body of T1
based on the position of the skin landmarks both for the small females and the average male
subjects. More detailed information can be found in Appendix 7.6. Locating the H-Point was

14 CHALMERS, Applied Mechanics, Master’s Thesis 2013:12
done by measuring the distance separating the thigh targets to the H-Point during the test
session (Figure 8). Basic trigonometry allowed for calculating the position of the H-Point.
Figure 8: location of H-Point (H*) and thigh targets
Reference points from Table 3, as well as camera positions and angles were measured
with a FaroArm (FARO, USA). The signal from the seatbelt force transducer was filtered
with Channel Frequency Class (CFC) of 30. The offset was corrected calculating the median
over the 100 indices preceding the rising edge of the triggering signal. Analog data was
synchronized at the start of the current supply (t=0) and kinematic data were linear-
interpolated to match this event.

CHALMERS, Applied Mechanics, Master’s Thesis 2013:12 15
3 Results
In the x- and z-directions, and in all tests, thigh targets were observed to move less than
±5mm over the dataset. The assumption of high stability for the H-Point was therefore
validated.
3.1. Description of seatbelt force and T1 x-displacement
The motion of the research subjects might be described in three phases (Figure 9). In
the first phase, the seatbelt force continuously increased as the webbing was retracted and the
belt slack reduced (initial plateau), until the first peak was reached at ~0.25s (Table 4), time at
which the slope of T1 x-displacement stabilized. In the second phase, subjects started to move
rearwards at an almost constant T1 x-velocity relative to the seatback, resulting in a temporary
reduction of the seatbelt force. However, as the rearward motion was stopped by the seatback,
the seatbelt force increased again, reaching a second peak at ~0.5s (Table 5); in addition the
slope of T1 x-displacement slowed down, reflecting a velocity reduction. The third phase
started after the second peak. The power supply to the pre-pretensioner ended, resulting in a
drop in the force level. Then the pre-pretensioner maintained approximately the same force
level. In addition, for extreme positions (2 and 3), a third peak corresponding to a damped
oscillation in the seatbelt force at ~0.6s (Table 6) was observed as the subjects displayed a
minor rebound, as the T1 x-displacement showed.
Table 4: Occurrence and seatbelt force levels for the first peak
Subject
Peak occurrence [s] Force level [N] Gradient of slope [kN/s]
Pos.1 Pos.2 Pos.3 Pos.1 Pos.2 Pos.3 Pos.1 Pos.2 Pos.3
BioRID 0.20 0.25 0.20 265 265 140 1.8 0.9 0.9
THOR 0.20 0.25 0.20 210 210 175 1.4 0.6 1.2
Vol. subj. mean 0.30 0.20 0.20 245 245 110 1.0 0.9 0.7
Table 5: Occurrence and seatbelt force levels for the second peak
Subject
Peak occurrence [s] Force level [N]
Pos.1 Pos.2 Pos.3 Pos.1 Pos.2 Pos.3
BioRID-II 0.50 0.45* 0.50 250 160 130
THOR-NT 0.50 0.50 0.50 220 120 165
Vol. subj. mean 0.50 0.50 0.50 250 200 110
* Minor power supply issue
Table6: Occurrence and seatbelt force levels for the third peak (first rise)
Subject
Peak occurrence [s] Force level [N]
Pos.2 Pos.3 Pos.2 Pos.3
BioRID-II 0.60 0.75 110 150
THOR-NT 0.70 0.75 95 145
Vol. subj. mean 0.60 0.65* 180 100*
* In the area of large standard deviation for the corridor.

16 CHALMERS, Applied Mechanics, Master’s Thesis 2013:12
Figure 9: seatbelt force and T1 x-displacement phases vs. time (for the BioRID-II in Position 3).
3.2. Evaluation of ATDs
The plots described in this section can be found p19-21.
Seatbelt force characteristics. For Position 1 and Position 3, the THOR-NT and the
BioRID-II showed quicker seatbelt force responses than the volunteers as the initial slope was
steeper and the first peak occurred earlier (0.20s compared to 0.30s, Table 4).
For Position 1, the force peaks of the BioRID-II were close to the mean response of the
volunteer subjects, while for the THOR-NT they were close to the inferior boundary of the
corridor (Figure 10). Furthermore, the asymptote exceeded the mean force by 40N at t=1.5s
for the BioRID-II while for the THOR-NT the force almost reached the mean (10N less). The
force levels of both ATDs were thus comparable to those of the volunteer subjects for
Position 1.
In Position2 (Figure 11), the force response of the ATDs was delayed by ~0.05s compared
to the volunteer subjects mean (Table5). In terms of slope and force levels of the two first
peaks, the BioRID-II (respectively 0.9kN/s, 265N and 160N, Tables4-5) was closer to the
volunteer subjects mean (0.9kN/s, 245N, 200N) than the THOR-NT (0.6kN/s, 210N, 120N).
In Position 3, both ATDs were close to the upper boundary of the corridor (Figure 12).
The peaks occurred synchronously for the ATDs and the volunteers mean response, although
both ATDs showed greater first peaks than the volunteers (THOR-NT 175N, BioRID-II
140N, volunteer subjects mean 110N, Table4). Consequently, the ATDs had a greater
amplitude of rebound after t=0.5s (100N) than the volunteer subject mean (<30N). Overall,
the BioRID-II appeared to be closer to the force corridor than the THOR-NT for Position 3.
Backset, T1 x-displacement and velocity. In Position 1, the backset reduction of the
ATDs was quicker than the volunteer subjects mean (by 0.20s and 0.05s, respectively, Table
7, Figure 10). The timing of T1 x-velocity and displacement were however similar (0.20s for
volunteer subjects mean and BioRID-II, 0.25s for THOR-NT) (Tables 8-9, Figure 10). The

CHALMERS, Applied Mechanics, Master’s Thesis 2013:12 17
lag of the head with respect to the upper torso was thus greater for volunteer subjects than for
ATDs. The backset of the ATDs had greater amplitudes (BioRID-II 35mm, THOR-NT
53mm) than the volunteer subjects mean (28mm). However, neither the THOR-NT nor the
BioRID-II were in contact with the HR for Position1 (Table 12). Furthermore, for Position1,
the THOR-NT had a greater T1 x-displacement than the BioRID-II and was slightly closer to
the volunteer subjects mean than the BioRID.
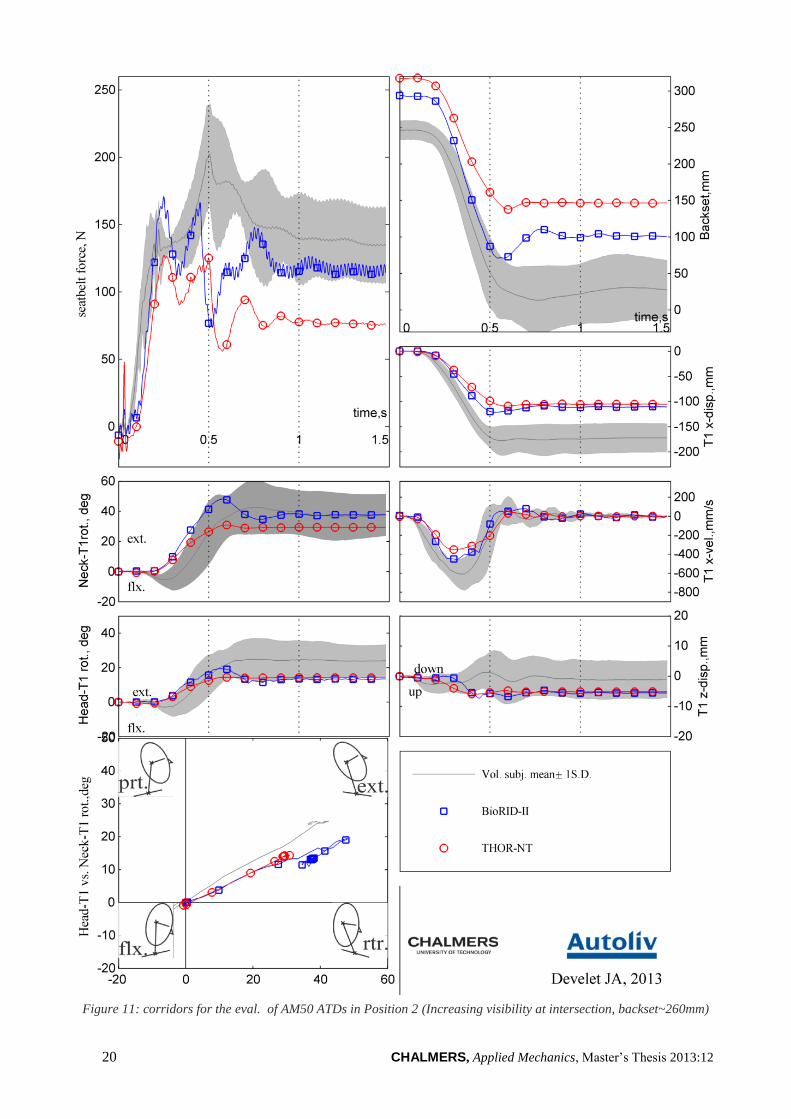
In Position2, even though the initial backsets of the BioRID-II (~40mm) and THOR-NT
(~70mm) were greater than the volunteer subjects mean (Table 12, Figure 11), the amplitude
and peak occurrence of backset were closer to the volunteer subjects for BioRID-II than for
THOR-NT. However, accounting for the difference in initial backset would lead to an
asymptote in backset of ~70mm for the BioRID-II and ~80mm for the THOR; these were
twice as large as the volunteer subject mean.
The amplitude of T1 x-velocity was greater for the BioRID-II and the THOR-NT
(170mm/s and 190mm/s, respectively) than for the volunteer subject mean response
(130mm/s, Table 9) for Position 1. It was the opposite for Position 2 and 3, for which the
amplitude of the response was greater for the volunteer subject mean (830mm/s and 760mm/s,
respectively) than for the ATDs (BioRID-II 530 and 710mm/s, THOR-NT 390 and 360mm/s).
Observing the plots on Figure 10 to 13 revealed that the BioRID-II overshot in the positive
domain for all three positions, while it was in the negative domain for the THOR-NT only for
Position 1. In addition the occurrence of the maximum peak – rebound – was delayed for the
BioRID-II (by 0.05s) as compared to the volunteer subjects mean (Table 9).
Besides, T1 x-displacement recorded for the BioRID-II (110mm) and the THOR-NT
(105mm) were quite different (smaller by more than 33%) from the volunteer subjects mean
(180mm) (Tables 7-8). In terms of shape, despite the larger overrun in backset and T1 x-
displacement at ~0.60s for the BioRID-II compared to the THOR, the BioRID-II was closer to
the volunteer subjects mean for the backset and T1 x-displacement. None of the ATDs had
contact with the HR (Table 12). Results for Position3 and Position2 were similar.
Table 7: Amplitude, peak occurrence and asymptote of the backset
Subject
Amplitude [mm] Peak occurrence [s] Asymptote [mm]
Pos.1 Pos.2 Pos.3 Pos.1 Pos.2 Pos.3 Pos.1 Pos.2 Pos.3
BioRID-II 35 222 316 0.40 0.55 0.70 52 101 179
THOR-NT 53 179 196 0.40 0.60 0.60 20 147 241
Vol. subj. mean 28 231 354* 0.60 0.55 0.60* 41 31 62
Table 8: Amplitude, peak occurrence and asymptote of T1 x-displacement
Subject
Amplitude [mm] Peak occurrence [s] Asymptote [mm]
Pos.1 Pos.2 Pos.3 Pos.1 Pos.2 Pos.3 Pos.1 Pos.2 Pos.3
BioRID-II 23 120 210 0.40 0.50 0.65 20 110 180
THOR-NT 36 110 130 0.40 0.60 0.6 36 105 120
Vol. subj. mean 31 180 250* 0.45 0.55 0.6* 28 180 260
* Large spread in volunteer response; for comparison purposes, the peak is interpreted around t=0.6s
(following the lower boundary of the corridor)

18 CHALMERS, Applied Mechanics, Master’s Thesis 2013:12
Table 9: Amplitude, peak occurrence and asymptote of T1 x-velocity
Subject
Amplitude [mm/s] Occurrence of min. [s] Occurrence of max. [s]
Pos.1 Pos.2 Pos.3 Pos.1 Pos.2 Pos.3 Pos.1 Pos.2 Pos.3
BioRID-II 170 530 710 0.20 0.30 0.30 0.4 0.60 0.70
THOR-NT 190 390 360 0.25 0.30 0.30 0.5 0.60 0.65
Vol. subj. mean 130 830 760 0.20 0.35 0.40 0.5 0.60 0.65
Head-neck complex motion. The amplitudes of the neck and head rotations relative to
the rotation of T1 (upper body) were equal or less for the THOR-NT than for the BioRID-II in
all three positions (Table 10). Furthermore, the peak head rotations of the ATDs were less
than those of the volunteer subjects mean in all positions. However, the peak neck rotation
was greater for the BioRID-II than for the volunteer subjects for Position 2 and Position 3. For
the ATDs only positive rotations were recorded, while the volunteer subjects posed an
additional negative peak in the initial phase. In fact, the ATDs only displayed extension
motions, while the volunteer subjects experienced a dual motion – the initial flexion of the
head-neck complex was followed by an extension.
Table 10: Amplitude (max - min) of head and neck rotations.
Subject
Head rotation [deg] Neck rotation [deg]
Pos.1 Pos.2 Pos.3 Pos.1 Pos.2 Pos.3
BioRID-II 2 6 7 5 35 48
THOR-NT <1 <1 2 5 17 21
Vol. subj. mean 5 10 15 7 30 38
T1 z-displacement did not bring significant information, neither for Position 1 nor for
Position 2; the amplitude was less than ~5mm (Table 11). For Position 3, greater changes
were observed; the amplitude of T1z-displacement of BioRID-II (32mm) was closer to that of
volunteer subjects on average (34mm), as compared to the THOR-NT (28mm) (Table 11). It
should be noted that the BioRID-II presented a light oscillatory phenomenon (Figure 12).
Table 11: Amplitude (max - min) of T1 z-displacement.
Subject
T1 z-displacement [mm]
Pos.1 Pos.2 Pos.3
BioRID-II <5 6 32
THOR-NT <5 6 18
Vol. subj. mean <5 <5 34

CHALMERS, Applied Mechanics, Master’s Thesis 2013:12 19
Figure 10: corridors for the evaluation of AM50 ATDs in Position 1 (Real life driving posture, backset~80mm)
20 CHALMERS, Applied Mechanics, Master’s Thesis 2013:12
Figure 11: corridors for the eval. of AM50 ATDs in Position 2 (Increasing visibility at intersection, backset~260mm)

CHALMERS, Applied Mechanics, Master’s Thesis 2013:12 21
Figure 12: corridors for the evaluation of AM50 ATDs in Position 3 (Searching the glove box, backset~400mm)
22 CHALMERS, Applied Mechanics, Master’s Thesis 2013:12
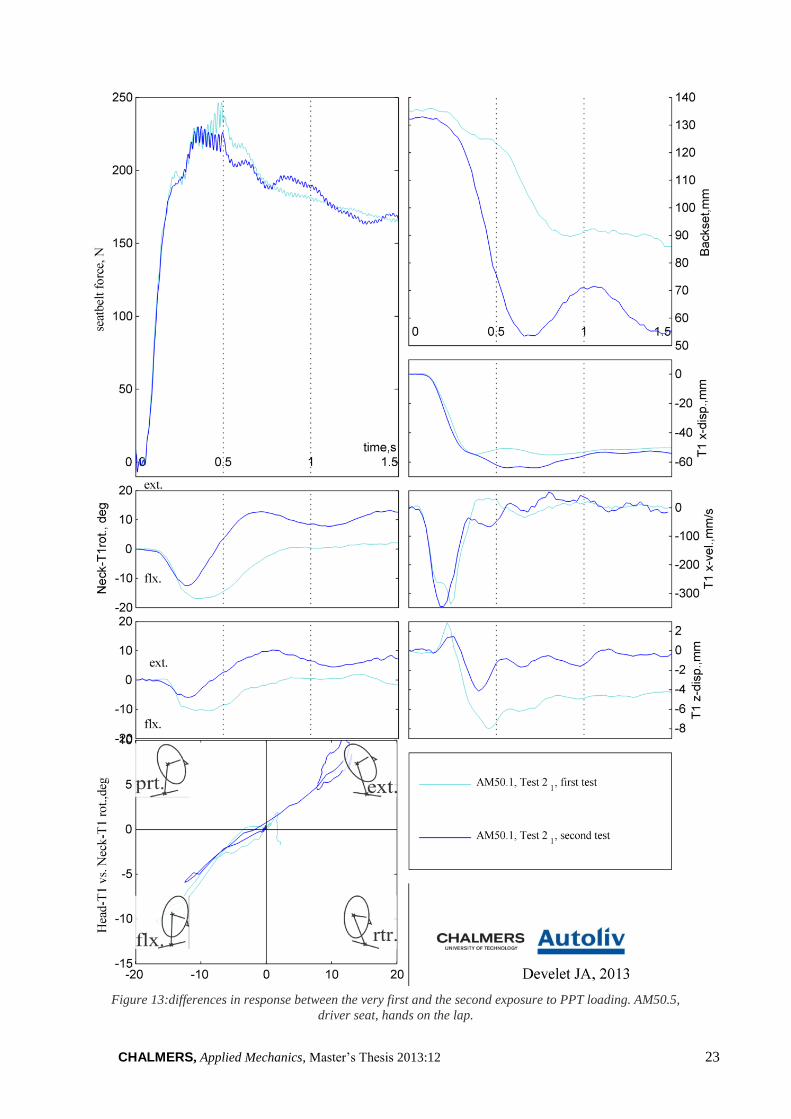
3.3. Effect of habituation of PPT loading on the response
The first test was plotted in light color and the second one in dark color. Only data for
three AM50 volunteer subjects were valid and thus presented.
For two test subjects, AM50.1 (Figure 13) and AM50.8 (Figure 15), the amplitude of the
kinematics increased between the first and second test. The rearward motion improved by
~140mm for the backset, ~90mm for T1 x-displacement for AM50.8, and respectively
~30mm and <10mm for AM50.1. Head-neck movement also became larger; AM50.8 actually
presented a more complex motion (flexion, protraction, extension) and AM50.1 observed
larger and longer extension; this may find pieces of explanations in the overall behavior of
AM50.8 – estimated to be Tensed – and AM50.1 – Relaxed (Table 12).
For one test subject, AM50.5 (Figure 14), no significant effect of first test was noticed; for
both tests the HR was contacted and the subject’s head indented it, resulting in a negative
backset. AM50.5 was estimated to be Relaxed, even potentially Helping during regular tests.
No clear change on the seatbelt force characteristics was observed between the very first
and the second exposure.
In conclusion, differences between first and second exposure might depend on the
behavior of the subjects. These results showed very low amplitude of motion, thereby very
little backset reduction, for a combination of surprise (very first exposure to PPT loading) and
tense behaviour (AM50.8, Figure 15 and AF05.1, first test, Figure 17).
CHALMERS, Applied Mechanics, Master’s Thesis 2013:12 23
Figure 13:differences in response between the very first and the second exposure to PPT loading. AM50.5,
driver seat, hands on the lap.

24 CHALMERS, Applied Mechanics, Master’s Thesis 2013:12
Figure 14:differences in response between the very first and the second exposure to PPT loading. AM50.5,
driver seat, hands on the lap.

CHALMERS, Applied Mechanics, Master’s Thesis 2013:12 25
Figure 15: differences in response between the very first and the second exposure to PPT loading. AM50.8,
driver seat, hands on the lap.

26 CHALMERS, Applied Mechanics, Master’s Thesis 2013:12
3.4. AM50 differences between the front and rear seats
The same power supply and controller units were used in the front and in the rear seat; the
same model of PPT was installed in the front and in the rear. The tests conducted in front
were not the very first exposure to PPT loading. Data from tests comprising AM50 volunteer
subjects in the front seat (N=6) in the rear seat (N=5) were processed and analysed (Figure
16).
Seatbelt force characteristics. Similar force levels were observed for the corridors of
AM50 volunteer subjects, at the front and at the rear seat. The initial peaks were comprised in
a region close to 250N, and the plateau around 200N as well. The width of the corridor was
thinner at the rear (~15N) than in the front (~30N) seats.
Backset, T1 x-displacement and velocity. The average initial backsets differed
between front (~80mm) and rear (~110mm) tests, resulting in a difference of ~30mm. The
backset reduction was however comparable (~35mm) for both tests. The rearward motion of
the head was initiated earlier in the rear seat (~0.20s) than in the front seat (~0.25s).
T1 x-displacements were slightly greater in the rear than they were in the front (by
~5mm), but it should be recalled that the initial backset was larger in the rear too. The timing
of T1 x-displacements were comparable; the rearward motion of the upper body was initiated
~0.20s for both front and rear seats.
T1 x-velocities reached greater peaks in the rear (~200mm/s) than in the front
(~120mm/s). In terms of timing of the average volunteer response, the occurrence of the peak
was earlier in the rear (~0.15s) than in the front (~0.20s).
Motion of the head-neck complex. The amplitude of the neck relative to T1 rotation
was similar in the rear and in the front (~8deg); however the initial flexion was larger in the
front (by~2deg) as compared to the rear.
The head relative to T1 rotation did not present the dual motion (negative then positive) in
the rear, as it was in the front seat; instead the head was only rotating rearwards.
The motion of the head-neck complex differed in the rear (protracting then extending) and
in the front (flexing, retracting and then extending).
T1 z-displacement. Both responses were similar in terms of shape, amplitude (less than
~5mm) and occurrence of peaks.

CHALMERS, Applied Mechanics, Master’s Thesis 2013:12 27
Figure 16: differences in AM50 volunteer subject responses between front (N=6) and rear (N=5) seats

28 CHALMERS, Applied Mechanics, Master’s Thesis 2013:12
3.5. AM50 and AF05 differences in kinematics
AM50 and AF05 differences in kinematics were based on data collected from tests
conducted in the rear seat. The same power supply, controller and PPT unit were used for all
the tests. Only two volunteer subjects matching the AF05 size were recruited. The tests in the
rear were conducted after a series of seven tests in the front; the subjects had already been
exposed to PPT loading. Two tests per AF05 volunteer subject (N=2) and one test per AM50
volunteer subject (N=5) were conducted in the rear; data from both AF05 tests were plotted as
curves, and AM50 data were represented with corridors (Figure 17). The first test of AF05.1
in the rear seat resulted in very low amplitude of motions; it was thus disregarded in the
results presented below.
Seatbelt force characteristics. Force levels for the second test of AF05 (dashed lines,
~230N and ~280N) were closer to AM50 average response (~245N) than the first tests
(~200N). Similar conclusions were drawn for the asymptote.
Backset, T1 x-displacement and velocity. Initial backsets differed between AF05.1
(~160mm), AF50.3 (~140mm) and the average AM50 volunteer response (~110mm). Apart
from AF05.1, first test, backset reduction was greater for AF05 (~70mm) than for AM50
(~35mm). The backset asymptote was similar for AF05 and AM50 (80mm±10mm). In terms
of timing, the reduction of backset as well as the start of T1 x-displacement and velocity
occurred at similar instants (~0.15s). The minimum T1 x-displacements and velocities
occurred ~0.05s later for AF05 than for the average AM50 response. T1 x-displacements
reached higher values for AF05 (60mm±10mm) than the average AM50 response (~35mm).
T1 x-velocities were also greater for AF05 (~300mm/s) than for AM50 (~200mm/s). This
resulted in steeper slope for AF05 (~25mm/s2 for AF05.3, second test) than for the average
AM50 response (~20mm/s2).
Head-neck complex motion. Kinematics of the head-neck complex showed similar
trends for AF05 and AM50. AF05 neck relative to T1 rotations presented an initial flexion
followed by an extension. The initial flexion had similar amplitudes (~-3deg) for AF05 and
AM50, but the final extensions were larger for AF05 (~15deg) than for the AM50 average
(~5deg). Global kinematics had the same order; light flexion followed by protraction and
extension.
T1-z displacement. The global shape of the responses of AF05 was similar to that of the
average AM50. Peak occurences and amplitudes signifiantly differed and did not allow for
comparison.

CHALMERS, Applied Mechanics, Master’s Thesis 2013:12 29
Figure 17: difference in AM50 (N=5) and AF05 (N=2, 2 tests each) volunteer subject responses

30 CHALMERS, Applied Mechanics, Master’s Thesis 2013:12
(left blank intentionally)

CHALMERS, Applied Mechanics, Master’s Thesis 2013:12 31
4 Discussions
Effect of individual behavior on volunteer responses. While tense subjects mainly
showed flexion of the head, relaxed subjects displayed both flexion and extension kinematics
(Appendices 7.7-7.9, Table 12). Tense subjects may have contracted different muscle groups
along the upper body and head-neck complex, which limited their range of motion; AM50.2
and AM50.3 depicted this phenomenon in Position1, presenting lower amplitudes than
relaxed subjects (AM50.0, AM50.5). Besides, individual behavior altered the head-neck
motion, see AM50.3 who protracted while others flexed. In fact, his head went moved
forward (+15mm), producing the opposite effect of what was expected (which was getting the
subject closer to the seat). Relaxed subjects may have aided and emphasized the response of
the pre-pretensioner as seen in AM50.0 whose peak seatbelt force oscillated in the beginning
(peaks at 0.12s and 0.24s, Appendix 7.7), as if he was waiting for the trigger and reacting
accordingly. This would provide grounds for the delay of 0.2s in his kinematics, as compared
to AM50.5 who was also relaxed. Besides, in Position2, AM50.2 appeared to activate certain
neck muscles on return; the amplitude of his head and neck rotations were 40deg (mean curve
11deg) and 55deg (30deg), respectively (Appendix 7.8).
In the literature, muscle activation was reported to 1) reduce global head-neck motions,
and 2) make head-neck complex responses faster (van der Horst et al. 1997). Muscles
contraction was found to stiffen up the neck, which would acknowledge both phenomena,
global motion reduction and faster response (Watts et al. 1999, Ono et al. 2006).
First exposure to PPT loading. Not only did it not reduce the backset and could not
reduce the risk of whiplash injury, but it also got the subject tensed – which might be more
injurious. It should also be added that PPT loading may surprise a driver in a pre-crash
context, which could have more severe consequences (loss of control). There could be
potential benefits from an “education” of vehicle occupants for the injury outcome; triggering
sufficiently often the PPTs would maintain the level of familiarity between occupant and PPT,
avoiding the surprise effect. Tests in the rear seat (conducted just after a series of seven tests
at the driver seat) depicted this need for familiarity between the occupant and PPT loading;
AF05.1 got surprised, and even though she had already been exposed quite intensively to PPT
loading, her kinematics had very low amplitudes (Figure 17). Further studies focusing on the
frequency of triggering of PPTs are thus recommended, as a repetitive and aggressive external
load from the seatbelt might be unconvenient and get irritating – and have a influence on the
adoption of the technology.
Front seat vs rear seat. The volunters as well as the ATDs experienced higher T1 x-
velocities in the rear seat compared to the front seats. In addition, the peak T1 x-velocity
occurred earlier in the rear than in the front (Figure 16). It should be noted that both the shape
of the seats and the shoulder belt upper anchorage point differ between the front and the rear
seat as depicted in Figure 18. Two parameters were found to differ; first the distance between
the back (at the scapula level) and the seatback, indicated by line inside the ellipse, and
second the belt angle indicated by the arcs of circles (Figure 18). The angle between the
shoulder belt and an horizontal line was smaller in the rear than in the front; as a consequence
the normal force acting on the shoulder/chest was larger in the rear than in the front. For the
same subject the mass was identical and it was found above that the force level was very
comparable; the acceleration on the subject was therefore larger in the rear than in the front.
This would provide grounds to the results found above. The gap between the seat and the back
was smaller in the rear than in the front; this would motivate an earlier contact between the

32 CHALMERS, Applied Mechanics, Master’s Thesis 2013:12
back of the subject and the seatback, and an earlier T1 x-velocity peak in the rear than in the
front. Another consequence of this gap difference may lie in the head neck complex
kinematics; would the upper body travel less, the head neck complex would not be expected
to move much. Besides, while the HR was hit by the head of volunteer subjects ~2 or 3 times
out of 6 in the tests conducted in front row seats, no head-to-HR contact was observed at the
rear seat (Table 12). It should be noted that the tests conducted in the rear seat were
performed after a series of seven tests in the front, at the driver seat. The absence of initial
head flexion may be due to an effect of habituation of the volunteer subjects to PPT loading.
Figure 18: contours of AM50.4 at the front (blue,
dashed line) and at the rear (red, solid line) seat
with the seat belt (thicker lines). The inboard contour
of the HR was drawn. The seatback was an
approximation between the bottom of the HR contour
and the H-Point.
Figure 19: contours of AF05.1
2 (blue, dashed line)
and AM50.4 (red, solid line) at the rear seat
with the seat belt (thicker lines). The inboard contour
of the HR was drawn. The seatback was an
approximation between the bottom of the HR contour
and the H-Point.
AM50 vs AF05. Test subject AF05.1 was perceived to be Tense in the first rear seat test
(Table12); it was noted in the results section that the amplitude of her motion was particularly
low (Figure 17). The second test (conducted just afterwards) presented higher amplitudes of
kinematics. It would appear that AF50.01 was surprised by the PPT loading. Phenomenon
close to those described above under “First exposure to PPT loading” were observed.
Different initial backsets were reported for AF05.1 (~164mm) and AF05.3 (~142mm)
(Table 12; this might be due to the difference in seated height between those volunteer
subjects (Table 1). Difference in initial backset between AF05 (~153mm) and AM50
(~110mm) partly explained the larger T1 x-displacement for AF05 than for AM50.
Furthermore this difference in backset left more room for building up velocity for AF05 than
for AM50 – which would partly explain the higher T1 x-velocities for AF05 tests – but
another difference with AM50 was the mass to move. For similar seatbelt force levels, the
upper body mass to move was lower for AF05 than for AM50; as a consequence the
acceleration were expected to be higher, resulting in higher velocities. This could be affected
by the difference in seatbelt angle relative to the shoulder, which could affect the
effectiveness of the PPT (via the normal force applied on the shoulder-chest); however the
contours of the initial position for AM50.4 and AF05.1(Figure 19) revealed that the shoulder
belt angle did not differ significantly between those subjects. The final backset was
comparable for AF05 and AM50 (~80mm); this might be due to the shape of the seat and HR.

CHALMERS, Applied Mechanics, Master’s Thesis 2013:12 33
Table 12: Spread in initial backset, contact with HR, overall behavior impression from the test leader
* THOR-NT without jacket on Position3;
1 first test;
2second test
Po
siti
on P
aram
eter
AM
50
.0 A
M5
0.1
A
M5
0.2
AM
50
.3 A
M5
0.4
AM
50
.5 A
M5
0.6
AM
50
.7 A
ver
age S
D B
ioR
ID-
II
TH
OR
-
NT
A
F0
5.1
AF
05
.3
1
Bac
kse
t 8
2
76
7
1
74
test
no
t
vali
d
76
7
0
test
no
t
vali
d
75
4
7
6
70
da
ta n
ot
pro
cess
ed
HR
co
nta
ct
1
0
0
0
1
0
0
0
Over
all
beh
avio
r
Rel
axed
.
Hel
pin
g?
Rel
axed
++
Ten
se
Ten
se
Rel
axed
.
Hel
pin
g?
Ten
se
2
Bac
kse
t 2
58
2
51
2
70
2
35
test
no
t
vali
d
23
5
23
1
test
no
t
vali
d
24
8
14
2
93
3
18
da
ta n
ot
pro
cess
ed
HR
co
nta
ct
1
1
1
0
1
0
0
0
Over
all
beh
avio
r
Rel
axed
.
Hel
pin
g?
Rel
axed
++
Ten
se S
elf-
mu
scle
acti
vat
ion?
Rel
axed
H
elp
ing?
Ten
se
3
Bac
kse
t
test
no
t
vali
d
39
2
49
3
93
3
79
3
91
test
no
t
vali
d
38
4
39
1
10
4
37
4
22
*
da
ta n
ot
pro
cess
ed
HR
co
nta
ct
0
1
0
1
1
0
0
0
Over
all
beh
avio
r
Rel
axed
R
elax
ed,
Sel
f-m
usc
le
acti
vat
ion?
Rel
axed
,
Fre
ezes
afte
r
conta
ct
wit
h s
eat
Rel
axed
R
elax
ed,
Fre
ezes
afte
r
conta
ct
wit
h s
eat
Rel
axed
,
Par
ticu
larl
y
slo
w
4
Bac
kse
t
test
no
t
vali
d
11
6
12
2
test
no
t
vali
d
11
1
test
no
t
vali
d
10
1
11
6
11
3
8
da
ta n
ot
pro
cess
ed
16
81
16
02
14
01
14
41
HR
co
nta
ct
0
0
0
0
0
01
02
01
02
Over
all
beh
avio
r
Rel
axed
,
Sti
ck d
oes
no
t fa
ll
Rel
axed
,
Sel
f-m
usc
le
acti
vat
ion?
Rel
axed
R
elax
ed
Rel
axed
T
ense
++
1
Rel
axed
2 R
elax
ed1
Rel
axed
2

34 CHALMERS, Applied Mechanics, Master’s Thesis 2013:12
Computation of the corridors. In the present study, standard deviations and means
were not strongly significant as the number of volunteer subjects per test position was only
six. The time to return occupants to the seat and the effect of individual behavior on the
response increased as the degree of forward leaning increased. It has been reported that the
rearward motion of the subject would be more restricted if lumbar spine was in contact with a
firm surface of the seatback early in the crash event (Hofinger et al. 1999). The upper body
was found to pivot around the top of the contact patch between the seatback and the
occupant’s back. The spine transfered the movement up to the head, affecting the head’s
trajectory and potentially the injury risk. This could be a piece of explanation for the
difference in width of the corridors for Position 1 – light OOP and lumbar spine likely to be in
contact with the seat back – and for Position 3 – extreme OOP and lumbar spine unlikely to
be in contact with the seat back – reaching approximately 140N, in comparison to the mean
(around 90N) (Appendix 7.9). The dataset comprised different potential reactions in real life,
against which PPT should work.
Definition of testing positions was based on an extensive literature review, focusing
on observational studies on how road vehicle occupants sit. In most observational studies,
cameras have been fixed at a key point of the traffic (for instance, bridge on the highway,
traffic light, round-about) in most observational studies so far. Thus, only a description of the
sitting posture at specific traffic spots have been collected, introducing bias as the position of
the occupants might depend on the traffic context. As a consequence, data regarding the
actual time distribution of different sitting postures – which would allow for studying OOP
frequencies – was missing. The second technique consisted of polls based on questionnaires,
also subject to biais.
A significant improvement in the knowledge of how road vehicle occupants sit under
different types of traffic context would lie in the embarkation of cameras inside the test
vehicle (Charlton et al. 2010). Equipped vehicles have been used by families in their everyday
need, which made possible the measurement of the duration of each unusual position of rear
occupants. However, this study focused on children sitting in the rear seat. To the author’s
knowledge, no similar study for adults in the rear or front seats or for drivers has been
published yet. Such studies would more accurately quantify how adult occupants do sit, and
would potentially change the testing positions used for the evaluation of the effectiveness of
active restraints. The choice of testing positions taken in the present would therefore be either
confirmed or dismissed; this was perceived as a potential limitation of the present thesis.
Minor issue with the power supply. Due to the state of the battery an early drop in
the seatbelt force was observed in Position2 with BioRID-II (Table 5). The amplitude of the
damped oscillation in Phase3 and the asymptote level at t=1.5s may have been affected.
However, this advance (0.05s) was rather insignificant and any impact on the kinematics
should be limited.
Effect of the support rod on the seated posture. Different combinations of head and
neck angles allowed for holding the support rod still. There might be effects on the
kinematics, as the initial posture affected the position of the head and thus the initial backset
(Figure 17). This would explain the SD in backset (Table 12). However, no major effect of the
initial posture on the volunteers’ response was observed.

CHALMERS, Applied Mechanics, Master’s Thesis 2013:12 35
Figure 20: Different initial seated postures for three volunteers in Position 3.
The contours of the head and HR were in the mid-sagittal plane. The straight line was the support rod, the
large dot the target at the Auditori Meatus, and the small dot the Occipital Condyle.
The color scheme followed the plots of the volunteer subjects (Appendix 7.9).
ATD seated position and OOP instability. Both ATDs had difficulties maintaining
the predefined posture in Position2 and Position3, and had a tendency to move towards the
seat. This effect was greater for Position2 than Position3. In order to avoid the retractor
pulling the ATDs and increasing the instability, some belt slack was set between the shoulder
and the D-ring. This was not the case for the volunteers who tensioned the seatbelt while
leaning forward. This may explain the time delay of 0.05s (Table 4) at the beginning of
Position2 in the ATDs seatbelt force and lower force level with regards to the corridor in
Position2 as compared to Position1 and Position3.
THOR-NT, construction detail. The instrumentation wires that of the ATD utilized
for the tests exited the body in the region of the lumbar spine; they may have potentially
interacted with the seat.
BioRID-II and belt loading. A feedback from the discussion after the oral presentation
at the 9th
Injury Biomechanics Symposium was about the absence of shoulder on the BioRID-
II, and its ability to behave in a biofidelic way under seatbelt loading. The results of this study
showed some potential in this ATD for PPT testing. Low-g frontal collision testing (whiplash
injuries in frontal impacts) involving the BioRID-II may provide elements to this debate.
Regarding the strategy in the pre-crash phase – thoughts about the interaction
between PPT triggering and collision avoidance systems Preparation to impact was
reported to depend on the awareness of the occupants to a safety critical situation. Based on
finite-element analysis simulations, it was found that evasive manoeuvres might be more
injurious than protective (Antona et al. 2010). Simulations were run with and without braking
maneuver in a frontal collision. The injury outcome was higher with braking maneuver. Even
though braking induced a dissipation of part of the kinetic energy, and decreasing the impact
violence, it also generated an acceleration field that took the occupant OOP (Kumpfbeck et al.
1999). Similar results than (Antona et al. 2010) were brought by (Pacaux-Lemoine et al.
2006), wherein volunteer subjects were confronted to an unavoidable frontal crash scenario in
a simulator. Drivers tended to change their sitting posture right before the impact while taking
evasive manoeuvre (in this study steering and braking). Emergency steering led to arms
crossing and spine rotation for the driver, right before a frontal crash. The forward motion of
drivers while braking in real life driving conditions was studied in passenger vehicles; mean
forward motions were 97mm (S.D. 47mm) for the head, and 55mm (S.D. 26mm) for the chest
(Carlsson et al. 2011). Under 0.8g of deceleration and relaxed muscle conditions, the head
was reported to move forward by ~60cm (Ejima et al. 2007). As a consequence the subjects
got closer to harmful surfaces (steering wheel, dashboard) and thus closer to the airbag in the
early crash. It has also been observed that lateral accelerations caused by emergency steering

36 CHALMERS, Applied Mechanics, Master’s Thesis 2013:12
may make the shoulder belt slip off the shoulder (Zuppichini et al. 1997). Last but not least,
all subjects were found to be OOP at the impact time (Pacaux-Lemoine et al. 2006). These
facts added to the potential benefit of for PPT systems, which provide the possibility to reduce
OOP from the very beginning of the crash. In terms of timing (Figure 21), it was found that a
passenger car starting decelerating (reached 5% of the maximum deceleration) ~200ms after
the trigger signal, and reached full deceleration ~700ms after the trigger signal (Östh et al.
2013). The PPT was found to need ~100ms to respond and remove the belt slack, and ~250ms
to reach its maximum (Figure 9). In addition, the kinematics of the occupant was stable at
~600ms for Position 1 (Figure 10), ~1s for Position 2 and 3 (Figure 11 and Figure 12).
Figure 21: timing of pre-pretensioner load in stationart conditions (bold) and of deceleration events (italic)
A first proposal is the following; 1) trigger the PPT, removing all belt slack and
repositionning the occupant and 2) take an emergency action (auto-braking maneuver for
instance). This tentative strategy proposes to take action in the interior of the vehicle first, and
then to the dynamics of the vehicle. The issue is the time required to reposition the occupant,
that was observed to reach ~1s (Figure 21). Sequencing PPT loading and braking would
therefore require ~1,7s – to which the time to brake shall be added. A time-to-collision
threshold greater that 2s would be required, which would trigger the PPT quite often in dense
traffic. Not only this would pose problems of acceptance of the system, this might also be
problematic for elderly in terms of thorax injuries (see following discussion item). A way of
reducing this timing would be fine-tuning of the brake system and PPT triggering time, so that
the correct deceleration level arises at the right timing. A too early trigger would require a
stronger PPT as the deceleration of the vehicle would push the occupant forward while the
PPT load pulls him/her rearward. A too late trigger would result in a loss of performance.
This requires in-depth investigations.
PPT loading and at-risk populations. One concern raised both during the
presentation of this study at the International Center of Automotive Medicine (University of
Michigan) and the discussion session at the 9th
Injury Biomechanics Symposium was the
tolerance of elderly to PPT loading, particularly in terms of chest injuries, and rib fractures.
Measuring chest compression under PPT loading would provide data on this topic. The effect
of subcutaneous fat on the response and the repositioning potential of PPTs would also be
worth a study, as obese population was found to be growing (WHO 2013). Last, but not least,
the benefit of PPTs on children occupants in the rear seat shall be investigated, as mechanical
properties hence tolerance to external loading were reported to differ from those of adults
(Poitout 2004).
PPT loading and sideway/rearward facing. Subject rotating the head were found to
be more at risk in terms of whiplash injury severity that subjects with a straight head
(Appendix 7.1). It should be noted that rearward facing, expected to involve the rotation of
the head and spine close to the limit of the range-of-motion, was found to seldom occur in
different traffic context. One might wonder what the injury outcome of pre-pretensioning
would be, should the occupant face rearwards.
Tentative improvement suggestions to the construction of the ATDs. Both
ATDs had difficulties reproducing the head rotation, which points towards a modification of
CHALMERS, Applied Mechanics, Master’s Thesis 2013:12 37
the upper spine and potentially the occipital joint. In addition, modifications to the neck may
help reproducing the initial flexion. The latter changes would get a high priority as they would
help improving the head motion with regards to the upper body – which affects neck loading
and geometry (local extension or flexion). Changes to the stiffness (section and material of
torsion bars in the neck and thoracic spine, pretension of muscle substitutes) and damping
(rotational damper, rubber blocks) properties are potential tracks of improvement. For far
forward leaning positions, both ATDs posed too low T1 x-displacement; by reducing the
friction in the pelvis joint this point might be improved. The pelvis could also be modified in
a pedestrian pelvis manner in order to gain in stability in extreme OOP cases.
5 Future work
The following bullet points listed both recommendations and ideas for future work raised
during the Master’s thesis work.
Recommendations regarding methods and material:
o H-Point outside the frame; take sufficient margin around the area of interest
o Use a normal lens whenever applicable
o Complete chess board behind the motion plane, not only chess stickers (bands).
More stable references for coordinate system while tracking films.
o Pilot studies; Practise data acquisition and data processing before testing
o Data processing routines ready and operational during testing; conducting a direct
analysis may provide the test leader with quick metrics evaluating the validity of
the experiments.
More detailed studies on how all road vehicle occupants (any sitting posture, any age, any
gender etc.) shall fund the sitting posture selection. It seems that it is a need to know how
all occupants do sit in road vehicles to improve restraints effectiveness.
A protocol to assess the effectiveness of active restraints, taking into account the OOP
issue.
In depth investigations for pre-crash strategy: when to prepare the interior, when to
modify the dynamics of the vehicle
Investigating the effect of PPT on population at risk (elderly, children, obesity)
Adapting PPT loading to anthropometry (gender, weight, seated height)
Discussing the benefit of PPT under unusual OOPs scenarios (e.g. rotated head or leaning
sideways resulting in head to HR misalignment ) and non longitudinal impact directions
(side impact)
Investigating the potential of using even lighter loads - type of haptic warning, so the
occupant repositioned on his/her own. Less risks and better acceptance?
PPT on 4-point belts, type criss-cross, for outboard leaning repositioning.

38 CHALMERS, Applied Mechanics, Master’s Thesis 2013:12
6 Conclusions
Over the three tests conducted at the front row (driver and front passenger seats),
BioRID-II was found to reproduce the volunteer subjects mean response more appropriately
than THOR-NT. Both ATDs showed limitations with regards to the reproduction of the full
head-neck complex global kinematics and upper torso x-displacement of the volunteers.
Construction changes to the spine, pelvis and occipital joints may lead to improvements in the
biofidelity of these ATDs under pre-pretensioner loading. The latter loading reduced the
degree of OOP towards more tolerable levels of backsets which shows the potential of this
type of active restraint in injury prevention for 50th
percentile male subjects, in the driver and
front passenger seat, in rear-end collisions. Furthermore, data for four sizes of volunteer
subjects (AF05, AF50, AM50 and AM95) were collected and partly analysed. Tests
conducted in the rear seat showed faster T1 x-displacement than in the front seats. Similar
tests conducted with AF05 and AM50 also presented faster rearward motion with lighter
volunteer subjects. These early results indicate the need for PPT loading levels adapted to the
anthropometry of the occupant. The analysis of remaining volunteer and ATD data would
contribute to the evaluation of the biofidelity of other size groups and gender, including tests
in the rear seat, would actively contribute to the development and implementation of pre-
pretensioners in road vehicles of tomorrow.

CHALMERS, Applied Mechanics, Master’s Thesis 2013:12 39
7 Appendices – AM50 volunteer subject data
7.1. Literature review – different OOP cases
Sitting upright An observational study, shooting road vehicles from a static point of the
traffic environment was ran in different traffic contexts and in three countries (smoothening
fleet state and culture habits effects) estimated that 78% of drivers had a backset qualified as
“medium” or “relatively normal in appearance” (Bingley et al. 2005), which could be
interpreted as if they sitted in a posture close to the nominal sitting posture. Two recent
(important because of potential seat and head restraints design improvements) studies
provided real-life measurements of backset during driving in different contexts, and
respectively reported average backsets of 77mm, 85mm for males (Jonsson et al. 2008, Shugg
et al. 2011). These figures exceeded recommendations (see §1.2 p.2).
While only one vehicle occupant (the driver) was reported in 78% of the observations, the
presence of a front passenger occurred in 20% of those observations (Bingley et al. 2005),
making investigations at this seat rather relevant. Adult front passengers participating to a
survey on which posture they take at the front passenger seat reported to sit in the “nominal
sitting posture” ~45% of the time (Zhang et al. 2004). It should be noted that this study did
not report backset indications, and that participants answered a questionnaire; therefore the
estimation of the “nominal sitting posture”was subjected to bias. Observations were led in
order to validate data drom the survey. By grouping all postures close to the latter “nominal
sitting posture”, participants reported a number of 60% - while observations found an usage
rate of ~80% (Zhang et al. 2004). The latter observations were consistent with the finding
from (Bingley et al. 2005), reporting 82% for front passengers.
Rotated head. A cohort study examining and interviewing N=100 subjects suffering
from whiplash injury found that rotated heads were associated with a higher risk of suffering
from severe symptoms than straight heads (Sturzenegger et al. 1994). More recently, car
occupants with a rotated head were reported to have higher initial AIS1 neck injury risk (0.4)
than straight heads (0.3) (Jakobsson 2004). In terms of occurrence, facing sideways accounted
for 3.4% of front passengers and 5% of rear passengers postures in (Bingley et al. 2005),
while a number of ~10% was reported in (Zhang et al. 2004, Bingley et al. 2005), and <=1%
of passengers faced rearwards (Bingley et al. 2005). No estimation of the head rotation angle
was reported, making the design of a testing position difficult. It was also observed that
drivers not only turn the head but also tend to lean towards the direction of the corner before
turning (Dinas et al. 2002). No combination between leaning sideways and rotating the head
was reported in (Zhang et al. 2004).
Leaning forward has been extensively studied (Benson et al. 1996, Lorenz et al. 2001,
Jakobsson 2004, Zhang et al. 2006, Good 2008, Charlton et al. 2010, Viano et al. 2011). Neck
loads were found to increase with the degree of forward leaning (Benson et al. 1996). In terms
of frequency, leaning half as well as full forward were found to be rare, with an usage rate
<2% for front passengers (Zhang et al. 2004). Large backset, somehow forward leaning,
represented 5% of all drivers observation (Bingley et al. 2005). In addition leaning forward
was the most frequent OOP event for young children, accounting for one third (Charlton et al.
2010).
From this discussion, half and full range of forward leaning are recommended for testing,
for front and rear passengers. Due to less motion freedom the driver may only test the half
forward position, under two conditions (relaxed, and bracing against the steering wheel).
Given that seats in front are identical on both sides, it would be redundant to test the half
40 CHALMERS, Applied Mechanics, Master’s Thesis 2013:12
forward position on the driver. The full forward position might be tested for the front
passenger only.
Leaning sideways. Lateral OOP of front row occupants was monitored in straight roads
in urban context; it was found that the mean position was very close to the in-position (-
8.6mm, S.D. 37mm), and that drivers tended to lean towards the direction of the upcoming
turn (Dinas et al. 2002). Front passengers were reported to lean sideway slightly below 10%
of the cases (estimated usage rate for each side) (Zhang et al. 2004). In terms of injury risk,
rigid body simulations of a braking maneuver reported three times higher exposition to head
injuries (based on the HIC) when the occupant leaned inboard, as compared to the normal
sitting position (Bose et al. 2010). Nor the neck (based on the Nij) neither the chest (based on
the chest deflection) were found to be affected by this OOP scenario; piece of explanation
might lie in the head restraint effectiveness. In the rear seat, lateral shifts represented ca. 30%
of all of the OOP events, knowing that children in a Child Restraint System sit OOP 70% of
the time during their journey (Charlton et al. 2010).
The effectiveness of PPT in the inboard and outboard cases would be expected to differ
because of the three point belt dissymmetry. The mitigation in the inboard case might be
easier as the direction of the seatbelt would be close to that of the repositioning trajectory;
friction between the seatbelt and the clothes on the chest would also be expected to help the
repositioning. In the outboard case, the occupant might be taken back, but not in the middle of
the seat. A four point seatbelt in a symmetrical layout such as the criss-cross may have some
potential.
Would the head be misaligned with the HR, PPT loading would not correct the alignement
as tensioning the seatbelt only reduces the gap between the occupant and the seat back.
Making the ATDs lean sideways was expected to be difficult for stability reasons.
Leaning forward and sideward is the most extreme OOP with regards to the amount
of webbing pulled out. No usage rate was found in literature. Leaning forward and inboard
would be observed when drivers search inside the glove box, or rear passengers talking to
front row occupants. Rear-end impact (21g, 48km/h) tests were conducted with the Hybrid-III
AM95, in-position and leaning forward and sideward; HIC and neck loads were at least twice
greater in the in- and outboard scenarios than in the normal sitting position (Viano et al.
2009). Depending on the side (inboard or outboard), the values differ since the three points
seatbelt is asymmetric. This side-dependant trend is confirmed by (Bose et al. 2010), who ran
rigid body simulations of 50th
percentile male (57km/h, 0.8g, frontal impact).
Leaning rearwards was observed when the seat back angle was bigger than the
standard position. Its evaluation in a standard observational study setup would be hindered by
door and B-pillar, which might explain why it has not reported in observational studies to the
author’s knowledge. Rigid body simulations reported higher neck injury risk (almost doubled
for the Nkm and Nij) for a frontal impact when the subject leaned rearwards compared to a
normal seating position (Jakobsson 2004).
Choice of OOP scenarios. ATD limitations in terms of range of motion, due to their
construction, did not allow for head or spine rotation. In addition, no sideway leaning was
implemented as it was expected to disturb the stability of ATDs, making them hard to
position. Indeed, this type of position was more complex to repeat and reproduce (need for
two support rods – one longitudinal and lateral). As a result, only OOP comprised in the mid-
sagittal plane were selected. Two types of OOP scenarios were implemented;1) occuring
frequently (driver’s backset slightly exceeding recommendation, and similar in the rear seat),
and 2) presenting a high injury risk high freq (far forward leaning, at driver seat – increasing
visibility at intersection – and at front passenger seat – searching the glovebox).
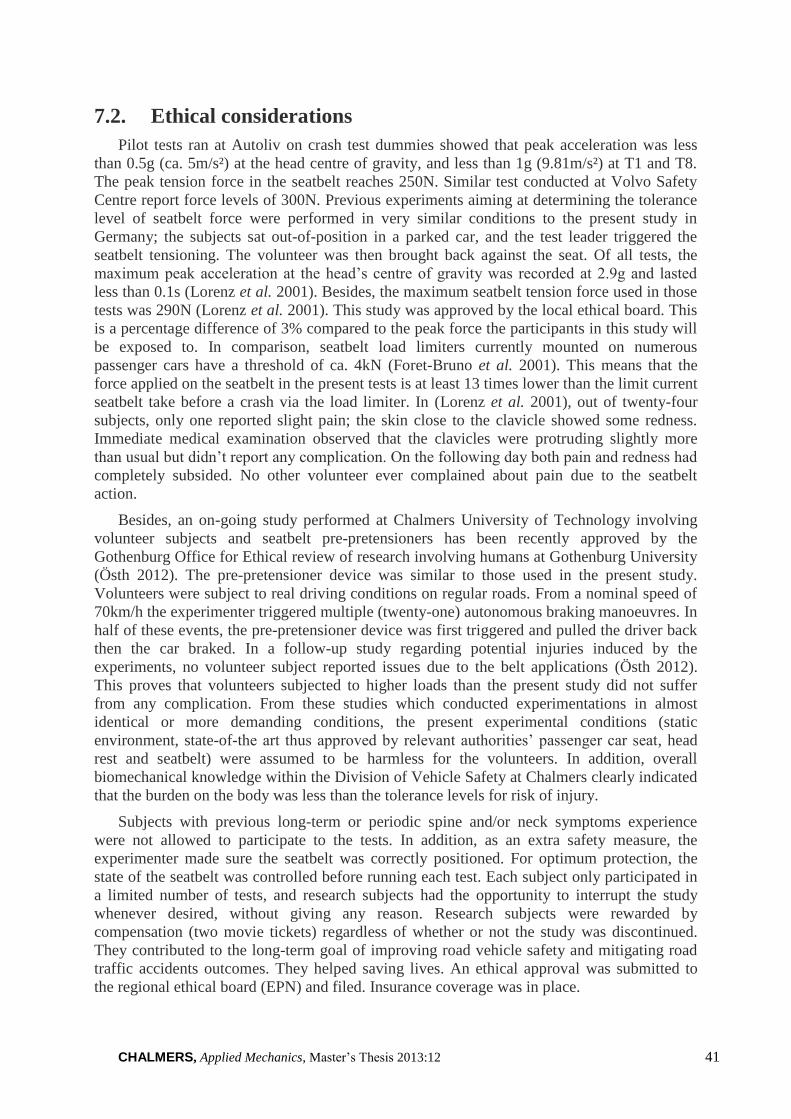
CHALMERS, Applied Mechanics, Master’s Thesis 2013:12 41
7.2. Ethical considerations
Pilot tests ran at Autoliv on crash test dummies showed that peak acceleration was less
than 0.5g (ca. 5m/s²) at the head centre of gravity, and less than 1g (9.81m/s²) at T1 and T8.
The peak tension force in the seatbelt reaches 250N. Similar test conducted at Volvo Safety
Centre report force levels of 300N. Previous experiments aiming at determining the tolerance
level of seatbelt force were performed in very similar conditions to the present study in
Germany; the subjects sat out-of-position in a parked car, and the test leader triggered the
seatbelt tensioning. The volunteer was then brought back against the seat. Of all tests, the
maximum peak acceleration at the head’s centre of gravity was recorded at 2.9g and lasted
less than 0.1s (Lorenz et al. 2001). Besides, the maximum seatbelt tension force used in those
tests was 290N (Lorenz et al. 2001). This study was approved by the local ethical board. This
is a percentage difference of 3% compared to the peak force the participants in this study will
be exposed to. In comparison, seatbelt load limiters currently mounted on numerous
passenger cars have a threshold of ca. 4kN (Foret-Bruno et al. 2001). This means that the
force applied on the seatbelt in the present tests is at least 13 times lower than the limit current
seatbelt take before a crash via the load limiter. In (Lorenz et al. 2001), out of twenty-four
subjects, only one reported slight pain; the skin close to the clavicle showed some redness.
Immediate medical examination observed that the clavicles were protruding slightly more
than usual but didn’t report any complication. On the following day both pain and redness had
completely subsided. No other volunteer ever complained about pain due to the seatbelt
action.
Besides, an on-going study performed at Chalmers University of Technology involving
volunteer subjects and seatbelt pre-pretensioners has been recently approved by the
Gothenburg Office for Ethical review of research involving humans at Gothenburg University
(Östh 2012). The pre-pretensioner device was similar to those used in the present study.
Volunteers were subject to real driving conditions on regular roads. From a nominal speed of
70km/h the experimenter triggered multiple (twenty-one) autonomous braking manoeuvres. In
half of these events, the pre-pretensioner device was first triggered and pulled the driver back
then the car braked. In a follow-up study regarding potential injuries induced by the
experiments, no volunteer subject reported issues due to the belt applications (Östh 2012).
This proves that volunteers subjected to higher loads than the present study did not suffer
from any complication. From these studies which conducted experimentations in almost
identical or more demanding conditions, the present experimental conditions (static
environment, state-of-the art thus approved by relevant authorities’ passenger car seat, head
rest and seatbelt) were assumed to be harmless for the volunteers. In addition, overall
biomechanical knowledge within the Division of Vehicle Safety at Chalmers clearly indicated
that the burden on the body was less than the tolerance levels for risk of injury.
Subjects with previous long-term or periodic spine and/or neck symptoms experience
were not allowed to participate to the tests. In addition, as an extra safety measure, the
experimenter made sure the seatbelt was correctly positioned. For optimum protection, the
state of the seatbelt was controlled before running each test. Each subject only participated in
a limited number of tests, and research subjects had the opportunity to interrupt the study
whenever desired, without giving any reason. Research subjects were rewarded by
compensation (two movie tickets) regardless of whether or not the study was discontinued.
They contributed to the long-term goal of improving road vehicle safety and mitigating road
traffic accidents outcomes. They helped saving lives. An ethical approval was submitted to
the regional ethical board (EPN) and filed. Insurance coverage was in place.
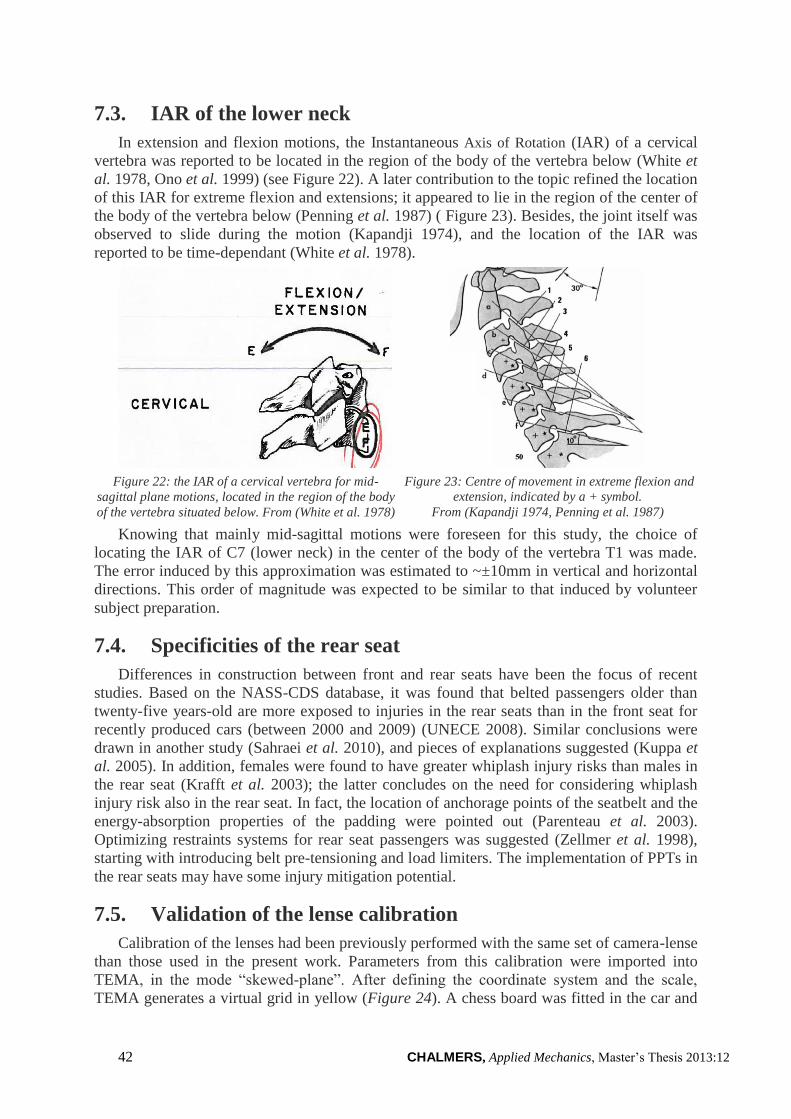
42 CHALMERS, Applied Mechanics, Master’s Thesis 2013:12
7.3. IAR of the lower neck
In extension and flexion motions, the Instantaneous Axis of Rotation (IAR) of a cervical
vertebra was reported to be located in the region of the body of the vertebra below (White et
al. 1978, Ono et al. 1999) (see Figure 22). A later contribution to the topic refined the location
of this IAR for extreme flexion and extensions; it appeared to lie in the region of the center of
the body of the vertebra below (Penning et al. 1987) ( Figure 23). Besides, the joint itself was
observed to slide during the motion (Kapandji 1974), and the location of the IAR was
reported to be time-dependant (White et al. 1978).
Figure 22: the IAR of a cervical vertebra for mid-
sagittal plane motions, located in the region of the body
of the vertebra situated below. From (White et al. 1978)
Figure 23: Centre of movement in extreme flexion and
extension, indicated by a + symbol.
From (Kapandji 1974, Penning et al. 1987)
Knowing that mainly mid-sagittal motions were foreseen for this study, the choice of
locating the IAR of C7 (lower neck) in the center of the body of the vertebra T1 was made.
The error induced by this approximation was estimated to ~±10mm in vertical and horizontal
directions. This order of magnitude was expected to be similar to that induced by volunteer
subject preparation.
7.4. Specificities of the rear seat
Differences in construction between front and rear seats have been the focus of recent
studies. Based on the NASS-CDS database, it was found that belted passengers older than
twenty-five years-old are more exposed to injuries in the rear seats than in the front seat for
recently produced cars (between 2000 and 2009) (UNECE 2008). Similar conclusions were
drawn in another study (Sahraei et al. 2010), and pieces of explanations suggested (Kuppa et
al. 2005). In addition, females were found to have greater whiplash injury risks than males in
the rear seat (Krafft et al. 2003); the latter concludes on the need for considering whiplash
injury risk also in the rear seat. In fact, the location of anchorage points of the seatbelt and the
energy-absorption properties of the padding were pointed out (Parenteau et al. 2003).
Optimizing restraints systems for rear seat passengers was suggested (Zellmer et al. 1998),
starting with introducing belt pre-tensioning and load limiters. The implementation of PPTs in
the rear seats may have some injury mitigation potential.
7.5. Validation of the lense calibration
Calibration of the lenses had been previously performed with the same set of camera-lense
than those used in the present work. Parameters from this calibration were imported into
TEMA, in the mode “skewed-plane”. After defining the coordinate system and the scale,
TEMA generates a virtual grid in yellow (Figure 24). A chess board was fitted in the car and

CHALMERS, Applied Mechanics, Master’s Thesis 2013:12 43
levelled during testing in order to provide physical reference points. Counting the number of
squares on the chess board provided coordinates; the latter constituted reference values. They
were compared to the coordinates of the Head and Neck points. Refining distance from
camera to motion plane, azimuth and elevation angles allowed for reducing the error in
position of these two points. As a result the fit of the virtual grid on the chess board was
improved and the error reduced to less than 2mm (<1%).
Figure 24: evaluation of the anti-distortion algorithm of TEMA. Cropped view from the
camera shooting at tests performed at the driver seat.
7.6. Use of the morphomics database to locating the center of
the body of T1
The morphomics database from the International Center for Automotive Medicine (Ann
Arbor, MI) resulted from image processing of CT Scans. A set of N=150 subjects was shared.
The latter subjects were grouped based on anthropometric criteria identical to those used for
volunteer subject recruitment (§2.1), resulting in N=3 AF05 subjects and N=10 AM50
subjects. The following assumptions were formulated as a result from real-life observations;
distance from the skin to the center of the film target=-15mm in x, distance from the skin to
the center of the film target=+50mm in x. It should be noted that while the target called “T1
target at spinous process” was used on volunteer subjects, the target called “T1 spinous
process was used on ATDs” (Figure 25) for experimental reasons.
Table 13: location of the center of the body of T1 with regards to anthropometric landmarks
Notation Distances [mm]
AF05 AM50
Average SD Average SD
l clavicle target to T1 skin target at spinous process 182 20 212 18
a clavicle target to the center of the body of T1 102 7 109 9
b T1 skin target at spinous process to the center of the
body of T1 82 13 104 12
c spinous process of T1 to the center of the body of T1 47 2 55 4
m spinous process of T1 to clavicle target 148 9 164 12

44 CHALMERS, Applied Mechanics, Master’s Thesis 2013:12
Figure 25: definition of landmarks and distances for Table 13.
This method was validated against skeleton projections for AM50 (Schneider et al. 1983);
hand measurements were conducted on full scale drawing, on which film targets were stuck
while taking into account the geometry of the target support (Figure 26).
Table 14: Validation of the method
N=10 Morphomics UMTRI
Schneider 1983
relative
difference
percentage
difference Distances [mm] Average SD
clavicle target to T1 skin
target at spinous process 240 17 220 -20 -9%
clavicle target to the center
of the body of T1 110 9 104 -6 -6%
T1 skin target at spinous
process to the center of the
body of T1
131 11 117 -14 -12%
Figure 26: validation with data from the UMTRI

CHALMERS, Applied Mechanics, Master’s Thesis 2013:12 45
7.7. AM50, Position 1. Real life driving posture

46 CHALMERS, Applied Mechanics, Master’s Thesis 2013:12
7.8. AM50, Position 2. Attempting to increase visibility at
intersections.

CHALMERS, Applied Mechanics, Master’s Thesis 2013:12 47
7.9. AM50, Position 3. Searching the glove box.

48 CHALMERS, Applied Mechanics, Master’s Thesis 2013:12
7.10. AM50, Position 4. Talking to front row occupants.

CHALMERS, Applied Mechanics, Master’s Thesis 2013:12 49
7.11. AF05, Position 4. Talking to front row occupants.

50 CHALMERS, Applied Mechanics, Master’s Thesis 2013:12
References
Antona, J., S. Ejima and Y. Zama (2010). Influence of Pre-Crash Driver Conditions on the Injury Outcome in
Front Impact Collisions, Society of Automotive Engineers of Japan.
Bangash, Y. H. (2007). Trauma-- an Engineering Analysis: With Medical Case Studies Investigation, Springer
London, Limited.
Benson, B., G. Smith, R. Kent and C. Monson (1996). Effect of Seat Stiffness in Out-of-Position Occupant
Response in Rear-End Collisions, SAE International.
Bertholon, N., S. Robin, J. Y. Le Coz, P. Potier, J. P. Lassau and W. Skalli (2000). "Human Head and Cervical
Spine Behaviour during Low-Speed Rear-End Impacts: PMHS Sled Tests with a Rigid Seat." Proceedings of the
International Research Council on the Biomechanics of Injury Conference 2000: 265-277.
Bingley, L., R. Morris and G. Cross (2005). Determination of real world occupants postures by photo studies to
aid smart restraints development. 16th International Technical Conference on the Enhanced Safety of Vehicles
(ESV). Windsor, Ontario, Canada.
Bose, D., J. R. Crandall, C. D. Untaroiu and E. H. Maslen (2010). "Influence of pre-collision occupant
parameters on injury outcome in a frontal collision." Accident Analysis & Prevention 42(4): 1398-1407.
Brasington, R., R. Kinkelaar and K. D. Cavender (1996). Progress in Polyurethane Foam Durability and Test
Methods, as Applied to Car Seat Padding, Societe des Ingenieurs de l'Automobile.
Carlsson, A. (2012). Addressing Female Whiplash Injury Protection - A Step Towards 50th Percentile Female
Rear Impact Occupant Models. PhD PhD, Chalmers University Of Technology.
Carlsson, A., F. Chang, P. Lemmen, A. Kullgren, K.-U. Schmitt, A. Linder and M. Y. Svensson (2012). EvaRID
‐ A 50th Percentile Female Rear Impact Finite Element Dummy Model. IRCOBI International Research Council
on the Biomechanics of Injury. Dublin, Ireland.
Carlsson, S. and J. Davidsson (2011). Volunteer occupant kinematics during driver initiated and autonomous
braking when driving in real traffic environment. 2011 International IRCOBI Conference on the Biomechanics
of Injury. Krakow, IRCOBI.
Charlton, J., S. Koppel, C. Kopinathan and D. Taranto (2010). How do children really behave in restraint
systems while travelling in cars? Annals of Advances in Automotive Medicine Association for the Advancement
of Automotive Medicine. 54: 1-11.
Davidsson, J. (2000). Development of a mechanical model for rear impacts - evaluation of volunteer responses
and validation of the model. PhD PhD, Chalmers University of Technology.
Davidsson, J., C. Deutscher, W. Hell, P. E. R. LÖVsund and M. Y. Svensson (2001). "Human Volunteer
Kinematics in Rear-End Sled Collisions." Journal of Crash Prevention and Injury Control 2(4): 319-333.
Davidsson, J., A. Flogård, P. Lövsund and M. Svensson (1999). BioRID P3 - Design and Performance
Compared to Hybrid III and Volunteers in Rear Impacts at ΔV=7 km/h. 43rd Stapp Car Crash Conference
Proceedings. S. T. P. Series. San Diego, California: 350.
Dinas, A. and B. N. Fildes (2002). "Observations of seating position of front seat occupants relative to the side of
the vehicle." Annu Proc Assoc Adv Automot Med 46: 27-43.
Doherty, T. (2001). "The influence of aging and sex on skeletal muscle mass and strength." Current Opinion in
Clinical Nutrition and Metabolic Care 4(6): pp 503-508.
Efraty, B., E. Bilgazyev, S. Shah and I. A. Kakadiaris (2012). "Profile-based 3D-aided face recognition." Pattern
Recognition 45(1): 43-53.
Ejima, S., K. Ono, S. Holcombe, K. Kaneoka and M. Fukushima (2007). A study on occupant kinematics
behaviour and muscle activities during pre-impact braking based on volunteer tests. International Research
Council on the Biomechanics of Impacts. Maastricht, the Netherlands, IRCOBI Secretariat-INRETS: 31.
EU. (2008). "Activities of the European Union - Research and innovation." 2013, from http://europa.eu/pol/rd/.
EuroNCAP (2011). EuroNCAP - Assessment protocol - Adult occupant Protection. EuroNCAP.
www.euroncap.com.
EuroNCAP (2011). EuroNCAP - The dynamic assessment of car seats for neck injury protection testing
protocol. EuroNCAP. www.euroncap.com.
Fildes, B. N., J. C. Lane, J. Lenard and A. P. Vulcan (1991). Passenger cars and occupants injury. M. U. A. R.
Centre: 9-20.
Foret-Bruno, J. Y., X. Trosseille, Y. Page, J. F. Huère, J. Y. Le Coz, F. Bendjellal, A. Diboine, T. Phalempin, D.
Villeforceix, P. Baudrit, H. Guillemot and J. C. Coltat (2001). Comparison of Thoracic Injury Risk in Frontal
Car Crashes for Occupant Restrained without Belt Load Limiters and Those Restrained with 6 kN and 4 kN Belt
Load Limiters, The Stapp Association.
Forman, J., F. Lopez-Valdes, D. Lessley, M. Kindig, R. Kent, S. Ridella and O. Bostrom (2009). Rear Seat
Occupant Safety: An Investigation of a Progressive Force-Limiting, Pretensioning 3-Point Belt System Using
Adult PMHS in Frontal Sled Tests, The Stapp Association, Ann Arbor, Michigan, USA.
Gkikas, N. (2012). Automotive Ergonomics: Driver-vehicle Interaction, CRC PressINC.
CHALMERS, Applied Mechanics, Master’s Thesis 2013:12 51
Goldstein, A. J., L. D. Harmon and A. B. Lesk (1971). "Identification of human faces." Proceedings of the IEEE
59(5): 748-760.
Good, C., D. Viano, J. McPhee, J. Ronsky and J. Pieper (2008). Motorized Shoulder Belt Tensioning: Modeling
and Performance for a Diverse Occupant Population, SAE International.
Good, C. V., DC; Ronsky, JL (2008). "Biomechanics of volunteers subject to loading by a motorized shoulder
belt tensioner." Spine 33: E225-E235.
Happian-Smith, J. (2001). An introduction to modern vehicle design, Butterworth-Heinemann.
Hofinger, M., E. Mayrhofer, B. C. Geigl, A. Moser and H. Steffan (1999). Reduction of neck injuries by
improving the occupant interaction with the seat back cushion. International Research Council on the Biokinetics
of Impacts. Madrid, Spain.
HumaneticsATD. "BioRID-II." Retrieved 2012-08-20, from http://www.humaneticsatd.com/crash-test-
dummies/rear-impact/biorid-ii.
HumaneticsATD. "Hybrid III 50th Male Dummy." Retrieved 2012-08-20, from
http://www.humaneticsatd.com/crash-test-dummies/frontal-impact/hybrid-iii-50th.
HumaneticsATD. "RID3D Rear Impact Dummy." Retrieved 2012-08-20, from
http://www.humaneticsatd.com/crash-test-dummies/rear-impact/rid3d.
Jakobsson, L. (2004). "Field Analysis of AIS1 Neck Injuries in Rear-End Car Impacts - Injury Reducing Effect
of the WHIPS Seat." Journal of Whiplash & Related Disorders 3(2): 37-53.
Jakobsson, L. L., Kristina ; Norin, Hans ; Svensson, Mats Y. (2004). "Evaluation criteria for AIS 1 neck injuries
in frontal impacts -a parameter study combining field data and Madymo modelling." Traffic Injury Prevention
5(4): 374-381.
Jonsson, B., H. Stenlund and U. Björnstig (2008). "Backset—Stationary and During Car Driving." Traffic Injury
Prevention 9(6): 568-573.
Jonsson, B., M. Svensson, A. Linder and U. Björnstig (2008). "BioRID II manikin and human seating position in
relation to car head restraint." International Journal of Crashworthiness 13(5): 479-485.
Kapandji, I. A. (1974). The physiology of the joints, Churchill Livingstone.
Khadilkar, A. V. and L. S. Pauls (1998). Assessment of Injury Protection Performance of Side Impact Airbags
for Out-Of-Position and other than 50th Percentile Adult Male Occupants. 16th Int. Tech. Conf. Enhanced Safety
of Vehicles,: 1858-1867.
Krafft, M., A. Kullgren, A. Lie and C. Tingvall (2003). "The Risk of Whiplash Injury in the Rear Seat Compared
to the Front Seat in Rear Impacts." Traffic Injury Prevention 4(2): 136-140.
Kumpfbeck, M., D. Oertel and K. Pilatus (1999). Occupant Kinematics During Emergency Braking: An
Investigation with regard to the Out of Position issue for Passengers. International IRCOBI Conference on the
Biomechanics of Impact, Sitges, Spain.
Kuppa, S., J. Saunders and O. Fessahaie (2005). Rear seat occupant protection in frontal crashes. The 19th
International Technical Conference on the Enhanced Safety of Vehicles (ESV). Washington D.C., U.S.A.
Li, S. Z. and A. K. Jain (2005). Handbook of Face Recognition - Chapter 3: Modeling Facial Shape and
Appearance.
Lorenz, B., D. Kallieris, P. Strohbeck-Kuehner, R. Mattern, U. Class and M. Lueders (2001). "Volunteer tests on
human tolerance levels of pretension for reversible seatbelt tensioners in the pre-crash-phase. Phase i results:
tests using a stationary vehicle." Proceedings of the International Research Council on the Biomechanics of
Injury Conference 2001: 311-322.
Lundell, B., L. Jakobsson, B. Alfredsson, M. Lindström and L. Simonsson (1998). The WHIPS seat - a car seat
for improved protection against neck injuries in rearr-end impacts. 16th International Technical Conference on
the Enhanced Safety of Vehicles (ESV). Windsor, Ontario, Canada,.
Mages, M., M. Seyffert and U. Class (2011). "Analysis of the pre-crash benefit of reversible belt pre-
pretensioning in different accident scenarios." Proceedings: International Technical Conference on the Enhanced
Safety of Vehicles 2011.
Minton, R., P. A. Murray, M. Pitcher and C. S. B. Galasko (1998). Lower back and neck strain injuries: the
relative roles of seat adjustment and vehicle/seat design. 16th International Technical Conference on the
Enhanced Safety of Vehicles (ESV). Windsor, Ontario, Canada,.
Müller, H. E. and B. Linn (1998). Seat Belt Pretensioners, SAE International.
NHTSA. (2001). "THOR Advanced Crash Test Dummy " Retrieved 2012-08-20, from
http://www.nhtsa.gov/Research/Biomechanics+&+Trauma/%3E%3ETHOR+Advanced+Crash+Test+Dummy.
NHTSA (2007). Federal Motor Vehicle Safety Standards; Head Restraints GPO. 49 CF R Parts 571 and 585.
Nilson, G. (1995). Effects of Seat and Seat-Belt Design on Car Occupant Response in Frontal and Rear Impacts
A Study Combining Mechanical and Mathematical Modelling. PhD, Chalmers University of Technology.
Nilson, G., M. Svensson, P. Lovsund and D. Viano (1994). Rear-end collisions — the effect of recliner stiffness
and energy absorption on occupant motion, Chalmers University of Technology.

52 CHALMERS, Applied Mechanics, Master’s Thesis 2013:12
Olsson, I., O. Bunketorp, G. Carlsson, C. Gustafsson, I. Planath, H. Norin and L. Ysander (1990). An In-depth
Study of Neck Injuries in Rear End Collisions. IRCOBI, Bron, France.
Ono, K., S. Ejima, Y. Suzuki, S. Ujihashi, K. Kaneoka and M. Fukushima (2006). Prediction of Neck Injury
Risk Based on the Analysis of Localized Cervical Vertebral Motion of Human Volunteers during Low-speed
Rear Impacts. International Research Council on the Biomechanics of Impacts. Madrid, Spain, IRCOBI: 103-
113.
Ono, K. and K. Kaneoka (1999). "Motion Analysis of Human Cervical Vertebrae During Low-Speed Rear
Impacts by the Simulated Sled." Journal of Crash Prevention and Injury Control 1(2): 87-99.
Pacaux-Lemoine, M. P., H. Morvan, F. Robache and P. Drazetic (2006). "Towards an attempt to understand car
driver behaviour just before a crash." IFAC 9(1).
Parenteau, C. and D. Viano (2003). Field Data Analysis of Rear Occupant Injuries Part I: Adults and Teenagers,
SAE International.
Peden, M., R. Scurfield, D. Sleet, D. Mohan, A. Hyder, E. Jarawan and C. Mathers (2004). World report on road
traffic injury prevention, World Health Organization.
Penning, L. and J. T. Wilmink (1987). "Rotation of the cervical spine. A CT study in normal subjects." Spine
(Phila Pa 1976) 12(8): 732-738.
Poitout, D. G. (2004). Biomechanics and Biomaterials in Orthopedics, Springer: 294-297.
Racioppi, F., L. Eriksson, C. Tingvall and A. Villaveces (2004). Preventing Road Traffic Injury: A Public Health
Perspective For Europe, World Health Organization.
RCAR-IIWPG (2008). Seat/Head Restraint Evaluation Protocol (Version3) Measurement and Rating of Static
Head Restraint Geometry – The Initial Evaluation http://www.iihs.org/.
SAE (2007). Instrumentation for Impact Test. S. T. I. S. Comm, SAE. J211.
SAE (2009). Motor Vehicle Dimensions, Human Accom And Design Devices Stds Comm. J1100.
Sahraei, E., K. Digges and D. Marzougui (2010). "Reduced Protection for Belted Occupants in Rear Seats
Relative to Front Seats of New Model Year Vehicles." Ann Adv Automot Med. 54: 149-158.
Sander, U., K. Mróz, O. Boström and R. Fredriksson (2009). "The Effect of Pre-Pretensioning in Multiple
Impact Crashes." Proceedings: International Technical Conference on the Enhanced Safety of Vehicles 2009: -.
Schmitt, K.-U., P. F. Niederer, M. H. Muser and F. Walz (2010). Spinal Injuries. Trauma Biomechanics,
Springer Berlin Heidelberg: 95-142.
Schneider, L. W., D. H. Robbins, M. A. Pflüg and R. G. Snyder (1983). Anthropometry of Motor Vehicle
Occupants University of Michigan Transportation Research Institute.
Schneider, L. W., D. H. Robbins, M. A. Pflüg and R. G. Snyder (1983). Development of Anthropometrically
Based Design Specifications for an Advanced Adult Anthropometric Dummy Family, Volume 1, University of
Michigan Transportation Research Institute.
Shugg, J. A. J., K. Vernest and J. P. Dickey (2011). "Head Restraint Backset During Routine Automobile
Driving: Drivers Usually Exceed the Recommended Guidelines." Traffic Injury Prevention 12(2): 180-186.
Siegmund, G. P., B. E. Heinrichs, J. M. Lawrence and M. M. G. M. Philippens (2001). Kinetic and Kinematic
Responses of the RID2a, Hybrid III and Human Volunteers in Low-Speed Rear-End Collisions, The Stapp
Association.
Song, D., J. Uriot, X. Trosseille, P. Mack, C. Tarriere, C. Got and A. Domont (1997). "Modelling and analysis of
interactions between occupant, seatback and headrest in rear impact." Proceedings of the International Research
Council on the Biomechanics of Injury Conference: 165-185.
Stemper, B. D., N. Yoganandan and F. A. Pintar (2006). "Effect of head restraint backset on head–neck
kinematics in whiplash." Accident Analysis & Prevention 38(2): 317-323.
Sturzenegger, M., G. DiStefano, B. Radanov and A. Schnidrig (1994). "Presenting symptoms and signs after
whiplash injury: the influence of accident mechanisms." Neurology 44(4): 688-693.
Svensson, M., P. Lövsund, Y. Håland and S. Larsson (1996). "The influence of seat-back and head-restraint
properties on the head-neck motion during rear-impact." Accident Analysis & Prevention 28(2): 221-227.
Svensson, M. Y., S. A., S. A., L. P., H. Y., H. H. A., D. J. and B. O. (2000). "Neck injuries in car collisions -- a
review covering a possible injury mechanism and the development of a new rear-impact dummy." Accident
Analysis and Prevention, Vol. 32, No. 2, Mar. 2000, p. 167-175.
Szabo, T. J., D. P. Voss and J. B. Welcher (2002). Influence of Seat Foam and Geometrical Properties on Biorid
P3 Kinematic Response to Rear Impacts, International Research Council on Biokinetics of Impact.
UNECE (2008). Uniform provisions concerning the approval of restraining devices for child occupants of
power-driven vehicles ("Child Restraint System"), UNECE. ECE R44 98-101.
van der Horst, M. J., J. G. M. Thunnissen, R. Happee, R. M. H. P. van Haaster and J. S. H. M. Wismans (1997).
The Influence of Muscle Activity on Head-Neck Response During Impact, SAE International.
Watanabe, Y., H. Ichikawa, O. Kayama, K. Ono, K. Kaneoka and S. Inami (2000). "Influence of seat
characteristics on occupant motion in low-speed rear impacts." Accident Analysis & Prevention 32(2): 243-250.

CHALMERS, Applied Mechanics, Master’s Thesis 2013:12 53
Watts, A. J., D. R. Atkinson and C. J. Henessy (1999). Low-Speed Automobile Accidents: Accident
Reconstruction and Occupant Kinematics, Dynamics, and Biomechanics
Weissner, R. and A. Ensslen (1985). The head-rest, a necessary safety-feature for modern passenger cars.
IRCOBI (International Research Council on the Biokinetics of Impacts), Bron, France.
White, A. A. and M. M. Panjabi (1978). Clinical biomechanics of the spine, Lippincott.
WHO. (2013, March 2013). "Obesity and overweight." Retrieved 2013-06-10, from
http://www.who.int/mediacentre/factsheets/fs311/en/index.html.
Viano, D., C. Parenteau and R. Burnett (2011). Rear Impact Tests of Starcraft-Type Seats with Out-of-Position
and In-Position Dummies, SAE International.
Viano, D., C. Parenteau, R. Burnett and M. James (2009). Influence of Seating Position on Dummy Responses
with ABTS Seats in Severe Rear Impacts, SAE International.
Wiklund, K. and H. Larsson (1998). Saab Active Head Restraint (SAHR) - Seat Design to Reduce the Risk of
Neck Injuries in Rear Impacts, SAE International.
Williams, G., M. Higgins and M. Lewek (2002). "Aging Skeletal Muscle: Physiologic Changes and the Effects
of Training." Physical Therapy 82(1): 62-68.
Wismans, J., M. Philippens, E. van Oorschot, D. Kallieris and R. Mattern (1987). Comparison of Human
Volunteer and Cadaver Head-Neck Response in Frontal Flexion, SAE International.
Zellmer, H., S. Lührs and K. Brüggermann (1998). Optimized restraint system for rear seat passengers. 16th
International Technical Conference on the Enhanced Safety of Vehicles (ESV). Windsor, Ontario, Canada.
Zhang, L., L. Chen, A. Vertiz and R. Balci (2004). Survey of Front Passenger Posture Usage in Passenger
Vehicles, SAE International.
Zhang, L., D. Fortune, J. Werbelow and L. Chen (2006). Comparison of Load Distributions between Human
Occupants and ATDs in Normal and Non-normal Occupant Positions and Postures, SAE International.
Zuppichini, F., D. Bigi, E. Bachi and A. DeAdamich (1997). "How drivers behave in pre-impact emergency
situations." Proceedings of the International Research Council on the Biomechanics of Injury Conference 1997:
433-441.
Östh, J. (2012). Personnal Communication about ongoing studies at SAFER.
Östh, J., J. Ólafsdóttir, J. Davidsson and K. Brolin (2013). Kinematic and Muscle Responses in Braking Events
with Standard and Reversible Pre-tensioned Restraints: Validation Data for Human Models. STAPP
(Submission).