evaluation of biochemical effects of oxidative stress in...
TRANSCRIPT
DEPARTMENT OF BIOLOGICAL AND ECOLOGICAL SCIENCES (DEB)
XXVII PhD COURSE IN GENETICS AND CELL BIOLOGY
BIO/11
Evaluation of biochemical effects of oxidative stress in
blood bank-stored red blood cells
PhD student
Cristiana Mirasole
Coordinator Tutor
Prof. Giorgio Prantera Prof.ssa AnnaMaria Timperio

A te, Nonno Renzo!

AIM OF THE STUDY
Blood banking underpins modern medical care, but blood storage, necessary for testing
and inventory management, reduces the safety and efficacy of individual units of red
blood cells (RBCs). Stored RBCs are damaged by the accumulation of their own waste
products, by enzymatic and oxidative injury. These chemical activities lead to a
complex RBC storage lesion that includes haemolysis, reduced in vivo recovery, energy
and membrane loss, altered oxygen release, reduced adenosine triphosphate and nitric
oxide secretion, and shedding of toxic products. The latter includes also free iron that
can potentiate susceptibility to oxidative stress, which in turn promotes oxidative-
lesions to proteins, lipids (peroxidation) and morphological changes (membrane
blebbing, vesiculation). In particular, reactive oxygen species seem to be the eligible
trigger for these lesions and the main contributor to the final quality loss (both at the
macroscopic and microscopic levels) of RBCs.
In order to ensure safety and quality of blood products, the study of in vitro (storage
conditions) ageing of red blood cells has recently taken advantage of the introduction of
mass spectrometry-based “omics” disciplines, such as proteomics, metabolomics and
lipidomics, which are characterized by the systematic determination and quantification
of broad classes of molecules, such as proteins, metabolites and lipids. Data from
multiple “omics” platforms can be then integrated through bioinformatic approaches
and mathematical modeling to obtain a system biology level of understanding, which
has been performed during our research.
During this work of thesis, we focused on the evaluation of irreparably protein oxidative
modifications, in particular those related to non-enzymatic glycosylation of hemoglobin
α and β-chains (HbA1c). The observation of apparently increased rates of HbA1c levels
over storage progression might be also exacerbated by the excessive glucose found in
anticoagulant and additive solutions. On the contrary, we followed how some of these
oxidation products can be repaired (e.g. oxidations of sulfur-containing amino acid
residues), representing an exceptional way to sense the redox state in cells. The
glycolytic enzyme glyceraldehyde-3-phosphate dehydrogenase (GAPDH) has been
found to regulate its activity in response to storage-induced oxidative stress through the
formation of an intramolecular disulfide bond involving catalytic cysteines. This
mechanism has been postulated to function as a metabolic switch to redirect

carbohydrate flux from glycolysis to the pentose phosphate shunt, allowing the red cell
to maintain oxidation-reduction balance and protect itself against oxidative insults.
Hereby, we describe alternative storage protocols which have been proposed in order to
overpass these hurdles, such as RBC anaerobic storage. We could confirm previous
evidences about long term anaerobiosis promoting glycolytic metabolism in RBCs and
prolonging the conservation of high energy phosphate reservoirs and purine
homeostasis. In parallel, we evidenced that, contrarily to aerobic storage, anaerobiosis
impairs erythrocyte capacity to cope with oxidative stress by blocking metabolic
divertion towards the pentose phosphate pathway, which negatively affects glutathione
homeostasis. Therefore, although oxidative stress was less sustained than in aerobically
stored counterparts, its markers still accumulate over anaerobic storage progression.
Finally, we presented an HPLC-microTOF-Q approach to investigate the RBC
lipidome. We could exploit this analytical workflow to consolidate existing knowledge
on the RBC lipid composition and individuate statistically significant fluctuations of
lipids throughout storage duration of RBC concentrates under blood bank conditions.
While this field of research still warrants future investigations, our analysis indicated
ceramides, glycerophospholipids and sterols as key targets of RBC storage lesions to the
lipidome, which will deserve further targeted investigations in the future.

INDEX Page
CHAPTER 1: Introduction 1
1.1 Alterations to Red Blood Cells (RBCs) during storage 2
(“the storage lesions”)
1.1.1 Why Red Blood Cells? 2
1.1.2 History of Blood storage: its meaning 2
for Transfusion
1.2 Parameters of the oxidation/reduction balance in in vivo 8
Red Blood Cells
1.2.1. Reactive species generation 8
1.2.2. Reactive oxygen species 9
1.3 Oxidative stress during the formation of storage lesions in blood 12
banking RBCs: chemical modification of proteins by reactive
oxygen species
1.3.1 Oxidation of Sulfur-containing Amino Acid Residues 14
1.3.2 Protein Carbonylation: Generation of Protein 15
Carbonyl Derivatives
1.3.3 Protein-Protein Cross-Linkage 17
1.3.4 Hemoglobin oxidation 19
1.3.5 Hemoglobin and the functions of nitric oxide (NO) 21
correlated with the Red Cell Storage Lesion
1.3.6 Lipid Peroxidation 25
1.3.7 The effects of phosphorylation on integrity membrane 26
structure of stored RBCs under blood banking conditions
References 28

Index
CHAPTER 2: Haemoglobin glycation (Hb1Ac) increases 44
during red blood cell storage: a MALDI-TOF
mass-spectrometry-based investigation
2.1 Aim of the study 45
2.2 Materials and Methods 45
2.2.1 Sample collection 45
2.2.2 Matrix and sample preparation for MALDI-TOF MS 46
2.2.3 Linear MALDI-TOF MS analysis and calculation 46
of glycated or glutathionylated hemoglobin
2.3 Results and discussion 47
2.4 Conclusion 50
References 51
CHAPTER 3: Red Blood Cell metabolism under prolonged 53
anaerobic storage
3.1 Aim of the study 54
3.2. Design and method 56
3.2.1 Sample collection 56
3.2.2. Materials 57
3.3 Untargeted metabolomics analyses 57
3.3.1 Metabolite extraction 57
3.3.2 Rapid resolution reversed-phase HPLC 58
3.3.3 Mass spectrometry: Q-TOF settings 58
3.3.4 Data elaboration and statistical analysis 59
3.4 Results and discussion 60
3.4.1 Glycolysis and energy metabolism are sustained 60
throughout anaerobic storage duration

Index
3.4.2 Purine salvage pathway is activated proportionally to 67
storage progression even under anaerobic conditions
3.4.3 Amino acid transport and lipid homeostasis are 68
affected to some extent under anaerobic storage
3.5 Conclusion 71
References 73
CHAPTER 4: Thiol-based regulation of glyceraldehyde- 85
3-phosphate dehydrogenase in blood bank–stored red blood cells:
a strategy to counteract oxidative stress
4.1 Aim of the study 86
4.2 Materials and Methods 88
4.2.1 Storage of RBCs and sample preparation 88
4.2.2 GAPDH assay 89
4.2.3 Western blotting analysis 89
4.2.4 Statistical analysis 89
4.2.5 In-gel digestion and peptide sequencing 90
by nano-LC-ESI Q-TOF MS/MS
4.3 Results 90
4.3.1 Effects of RBC storage on GAPDH activity 90
4.3.2 Storage-dependent displacement of RBC 92
GAPDH from membrane to cytosol
4.3.3 Identification of posttranslational oxidative modifications 92
responsible for GAPDH inactivation
4.4 Discussion and Conclusion 93
References 97

Index
CHAPTER 5: Red Blood Cell Lipidomics analysis through 100
HPLC-ESI-qTOF: application to red blood cell storage
5.1 Aim of the study 101
5.2. Materials and Method 103
5.2.1. Sample collection 103
5.2.2. Untargeted Metabolomics Analyses 104
5.2.2.1. Metabolite extraction 104
5.2.3. Rapid Resolution Reversed-Phase HPLC 104
5.2.4. Mass spectrometry analysis through microTOF-Q 105
5.2.5. Data elaboration and statistical analysis 105
5.3. Results and Discussion 106
5.3.1. Fatty acids 111
5.3.2. Glycerolipids and glycerophospholipds 112
5.3.3. Sphingolipids, sterols and prenol lipids 115
5.3.4. Red blood cell Lipidomics: application to the 117
storage of erythrocyte concentrates
5.4. Conclusion 120
References 121

1
CHAPTER 1: INTRODUCTION

Chapter 1
2
1.1 ALTERATIONS TO RBCS DURING STORAGE (“THE STORAGE
LESIONS”)
1.1.1 Why Red Blood Cells?
Derived from pluripotent stem cells in bone marrow through a maturation process called
erythropoiesis, mature Red Blood Cells (RBCs) are biconcave disks of approximately
7.2 µm in diameter, 1.5 to 2.5 µm thick, with a mean volume of 90 fL. Along the
developmental process, there is a reduction in cell volume, condensation of chromatin,
loss of nucleoli, decrease in the nucleus, RNA, mitochondria, and an increase in
hemoglobin synthesis, resulting in a mature RBC, which lacks a nucleus and organelles.
The primary function of RBCs is to transport oxygen from the lungs to the body tissues,
where the exchange for carbon dioxide is facilitated through synergistic effects of
hemoglobin, carbonic anhydrase, and band 3 protein, followed by carbon dioxide
delivery to the lungs for release. Successful oxygen transport is dependent on efficacy
of the three elements of RBC metabolism: the RBC membrane, hemoglobin, and
cellular energy. Continuous research of oxygen transport is crucial for development of
improved RBC storage and biopreservation technologies.
1.1.2 Hystory of Blood storage: its meaning for Transfusion
Whole blood storage was first demonstrated by Robertson in 1917. Acid-citrate-
dextrose (ACD) and Citrate-phosphate-dextrose solution (CPD) were subsequently
approved for 21-day storage of blood. CPD with adenine (CPDA-1) was later
introduced and used for extending the shelf-life of stored blood for up to 5 weeks. Red
blood cells stored in these solutions have shown steady deterioration after about 5 to 6
weeks as determined by the inability of such cells to survive in the circulation for 24
hours after reinfusion back into the human donor. It has been observed that during
continued refrigerated storage, glucose is consumed at a decreasing rate, as the
concentration of metabolic waste, i.e. lactic acid and hydrogen ions, increases. Such a
decrease in the rate of glucose metabolism leads to depletion of adenosine triphosphate
(ATP) which directly correlates to the recovery of RBCs when the cells are returned to
the circulation. The development of additive solutions for the preservation of red blood
cells after their separation from whole blood has allowed the design of formulations
which are specifically tailored to the needs of RBCs. Additive solutions such as Adsol®

Chapter 1
3
(AS-1), Nutricel® (AS-3), Optisol® (AS-5), and Erythro-Sol® were designed to extend
the storage of RBCs at 4°C.
In Italy, the “design” of the national blood system was changed through the "New
discipline for blood transfusion activities and national production of blood derivatives"
[Italian Parliament, October 21st, 2005]. In parallel, the 2002/98/EC directive of the
Council of Europe and the 2004/33/EC, 2005/61/EC and 2005/62/EC directives of the
European Commission have been transposed into national laws. Actually, new
regulatory standards have been introduced, contributing to improve the ability to store
RBCs and to rich the strategic goals of the Italian blood system.
At present, transfusion of RBCs is a common therapeutic intervention for which recent
developments suggest steps that might be taken to improve their quality, safety and their
benefits for the transfused recipient. Most RBC products are derived by collection of
450-500 (±10%) mL of whole blood into anticoagulant solutions (typically citrate-
dextrose-phosphate) from volunteer donors and removal of the plasma by centrifugation
(see Table 1) and, in some cases, also leukocytes. Although in healthy subjects, most
RBCs live for 110 to 120 days (with the standard deviation of their life span of about 6
days in normal subjects [Högman et al, 1999], after removal of the plasma, the resulting
product is red blood cells (referred to informally as “packed red blood cells”) with 42-
day blood bank shelf life, which are stored at 4 ± 2° C in a slightly hypertonic additive
sterilely solution, generally SAGM (sodium, adenine, glucose, mannitol, 376 mOsm/L).
Table 1- Special processing of RBC for transfusion
Process Indications Technical Considerations
Leucocytes reduction Decreased risk of recurrent
febrile, nonhemolytic
transfusion reactions
Decreased risk of
cytomegalovirus transmission
Decreased risk of HLA-
alloimunization
Most commonly achieved by
filtration, usually soon after
collection (pre-storage)
Washing (removes residual
plasma)
Decreased risk of anaphylaxis in
IgA-deficient patients with anti-
IgA antibodies
Decreased reactions in patients
with history of recurrent, severe
allergic or anaphylactoid
reactions to blood product
transfusion
Wash fluid is 0.9%
NaCl±dextrose
May lose 20% of red blood cells
in washing process

Chapter 1
4
The RBC is a highly specialized cell; because it lacks a nucleus and other cellular
machinery, it has to rely on its original contents of enzymes and other proteins for the
whole of its limited lifetime. In addition, because it lacks mitochondria, it cannot use
oxidative phosphorylation for adenosine triphosphate regeneration.
In term of prolonged storage, this means that RBCs undergo a dramatic molecular
changes, the so-called "red blood cell storage lesion"[Hess 2006, Hess 2007,Hess 2010].
The RBC storage lesions include:
i. Metabolic changes:
1. RBCs reduce concentrations of adenosine 5′-triphosphate (ATP) and 2,3-
diphosphoglycerate (2,3-DPG). Glycolysis is the only source of energy for
RBCs, through which they break down glucose to make ATP and produce lactic
acid and protons as a result. The protons produced in glycolysis make the
storage solution and the red cells increasingly acidotic. This acidosis in turn
slows further glycolysis because the protons inhibit hexose kinase and
phosphofructokinase, the first two activating enzymes in the main glycolytic
pathway, so that less ATP is made as storage progresses [Hess 2006, Hess 2007,
Hess 2010, Ian Chin-Yee et al., 1997].
2. The pH typically decreases from 7.0 to 6.5, while the rate of glucose
consumption fall down 50%, starting from RBCs collection from venous blood
at a pH of about 7.35, put into CPD at a pH of 5.5 to 5.8 [Hess 2006].
3. The fluxes of sodium ions (massive entry into the cell) and potassium ions (exit
from the cell) are involved in the storage lesion, because of loss of function
(usually transient) of cation pumps , since the Na+/K
+ pump is inactive at 4°C
[Bennett-Guerrero et al., 2007] and ATP-dependent. This leads to loss of
intracellular potassium and accumulation of sodium within the cytoplasm. The
concentration of extracellular potassium in the blood bag typically accumulates
at a rate of about 1 mEq/day, causing damages when the blood is used in cardiac
bypass machines [Hall et al., 1993].

Chapter 1
5
ii. Enzymatic changes:
Enzymatic damages are related to the presence of white blood cells (WBCs)
during storage period. Indeed, it has been demonstrated that WBCs break down
and release enzymes such as proteases, lipases and glycosidases in the storage
solution. These enzymes attach their target on the outer surface of erythrocytes
[Riedner et al., 1990]. Proteases can contribute to the loss of protein antigen
strength with storage and generally they are blocked by plasma antiproteases.
Lipases such as phospholipase can dealkylate trialkyl-glycerols to produce
lysophospholipids. An important example of this process is the production of
platelet activating factor (PAF), thought to be responsible for some cases of
transfusion-related acute lung injury (TRALI) [Gajic et al., 2007]. Glycosidases
remove sugars from glycolipids and glycoproteins, and the loss of these sugars
can expose underlying structures that increase the binding of stored red cells to
endothelial cells [Sparrow et al., 2007]. The removal of the WBCs by filtration,
the so called leukoreduction, can reduce enzymatic damage, thereby improving
recovery and decreasing the hemolysis of stored red cells [Heaton et al., 1994].
The discovery of TRALI was the first and still the most important example of
possible damages associated with stored blood. About glycosidases, Sparrow’s
group [Sparrow et al., 2007] has shown that stored red cells adhere to
endothelial cell monolayer proportionally with the loss of membrane sugars.
Such adherence is assumed to be responsible of endothelial inflammation if the
red cells subsequently break down and release iron and heme. For all these
reasons, leukoreduction increases red cell recovery by about 2% and reduces the
hemolysis by half at the end of the storage.
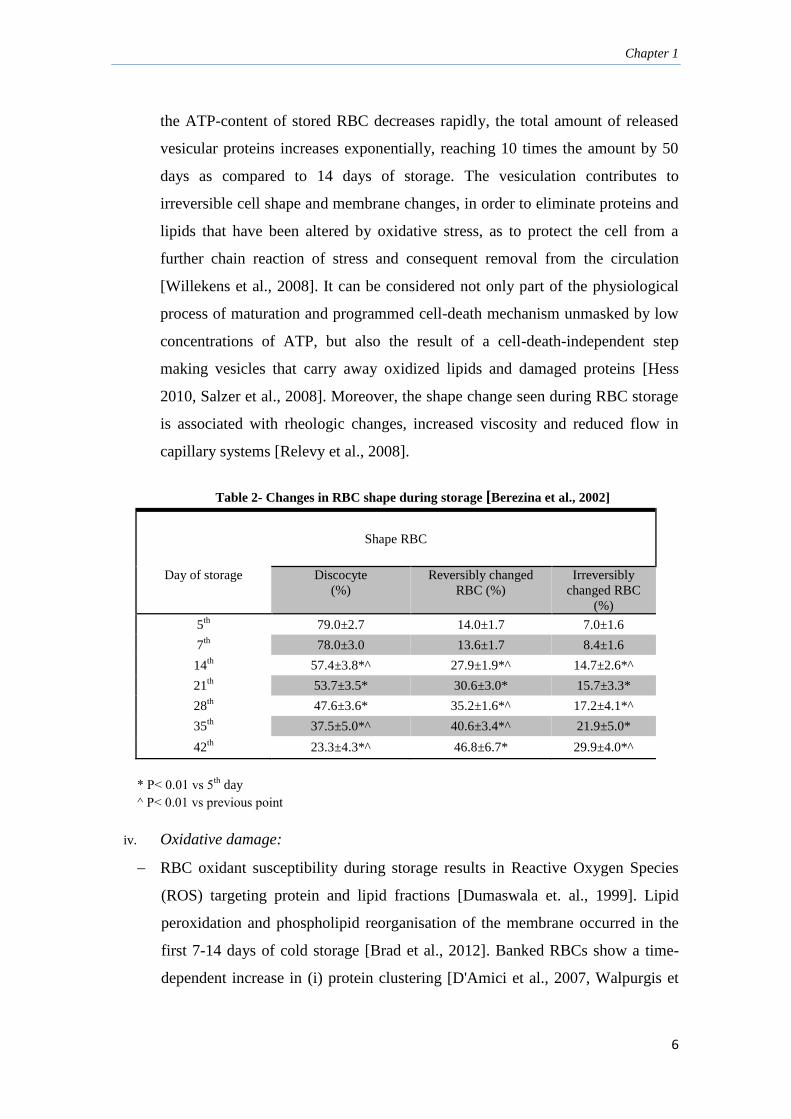
iii. Shape change and membrane vesiculation:
RBC storage, even for relatively short periods of time (between the 7th
and the
14th
day of storage [Tamara, Berezina et al, 2002]), affects RBC morphology and
function (Table 2). The echinocyte-spheroechinocyte red blood cell shape
transformation [Lockwood et al., 2003] is induced by loose of membrane
through the blebbing of vesicles from the spicules of cells that have undergone
echinocytic (in the early stage). After prolonged storage (beyond 21 days), when
Chapter 1
6
the ATP-content of stored RBC decreases rapidly, the total amount of released
vesicular proteins increases exponentially, reaching 10 times the amount by 50
days as compared to 14 days of storage. The vesiculation contributes to
irreversible cell shape and membrane changes, in order to eliminate proteins and
lipids that have been altered by oxidative stress, as to protect the cell from a
further chain reaction of stress and consequent removal from the circulation
[Willekens et al., 2008]. It can be considered not only part of the physiological
process of maturation and programmed cell-death mechanism unmasked by low
concentrations of ATP, but also the result of a cell-death-independent step
making vesicles that carry away oxidized lipids and damaged proteins [Hess
2010, Salzer et al., 2008]. Moreover, the shape change seen during RBC storage
is associated with rheologic changes, increased viscosity and reduced flow in
capillary systems [Relevy et al., 2008].
Table 2- Changes in RBC shape during storage [Berezina et al., 2002]
Shape RBC
Day of storage Discocyte
(%)
Reversibly changed
RBC (%)
Irreversibly
changed RBC
(%)
5th
79.0±2.7 14.0±1.7 7.0±1.6
7th
78.0±3.0 13.6±1.7 8.4±1.6
14th 57.4±3.8*^ 27.9±1.9*^ 14.7±2.6*^
21th 53.7±3.5* 30.6±3.0* 15.7±3.3*
28th 47.6±3.6* 35.2±1.6*^ 17.2±4.1*^
35th 37.5±5.0*^ 40.6±3.4*^ 21.9±5.0*
42th 23.3±4.3*^ 46.8±6.7* 29.9±4.0*^
* P˂ 0.01 vs 5th
day
^ P˂ 0.01 vs previous point
iv. Oxidative damage:
RBC oxidant susceptibility during storage results in Reactive Oxygen Species
(ROS) targeting protein and lipid fractions [Dumaswala et. al., 1999]. Lipid
peroxidation and phospholipid reorganisation of the membrane occurred in the
first 7-14 days of cold storage [Brad et al., 2012]. Banked RBCs show a time-
dependent increase in (i) protein clustering [D'Amici et al., 2007, Walpurgis et

Chapter 1
7
al., 2012], especially on band 3 (early, in the first 7 days of storage); (ii)
carbonyl modification of band 4.1 [D'Alessandro et al., 2012, Kriebardis et al.,
2007] and changes in spectrin-protein 4.1-actin interactions [Card 1988, Wolfe
et al., 1986]; (iii) malondialdehyde increase and (iv) a decline of erythrocyte
glutathione (GSH) levels and glutathione-peroxidase (GSH-PX) activity
[Umakant et al., 1999]. In contrast loss of acetylcholinesterase activity and
haemolysis of RBC occurred relatively late (14-21 days) during the storage
period [Brad et al., 2012]. Microvesicle generation from ATP-depleted RBC
also correlates with the breakdown of polyphosphoinositides to diacylglycerol
on the inner monolayer [Müller et al., 1981]. Membrane budding is dependent
on both the diffusible diacylglycerol partitions into the outer monolayer and
exoplasmic exposure of phosphatidylserine (PS), a negatively charged
phospholipid. Microvesicles (160 nm diameter) from RBC stored for more than
20 days [Kriebardis et al., 2008] contain band 3, are enriched in
acetylcholinesterase and in stomatin, but threefold depleted of flotillin 2 that
remains in the residual RBC membrane [Salzer et al.,2008]. Microvesicles from
long stored RBC contain heavily aggregated hemoglobin, band 3 aggregates and
increasing amounts of autologous IgG [Kriebardis et al., 2008], while the
residual RBCs reveal a decrease in band 3 content, but yet a substantial increase
in bound IgG [Kriebardis et al., 2007].
The band 3, in addition of being an anion exchanger protein, is the site of
macromolecular assembly for cytoskeleton anchorage, glycolytic enzymes (the
N-terminal cytosolic domain of band 3 is an inhibitory docking site for
glycolytic enzymes), and regulatory proteins. Indeed, band 3 is involved in the
modulation of oxygen transport by influencing the intracellular pH (and thus
oxygen off-loading) through its regulation of the chloride shift (exchange of Clˉ
/HCO3ˉ anions).
Under oxidative stress, haemoglobin (Hb) could be oxidized to met-Hb (a
protein unable to carry oxygen) which can be converted into low-spin ferric Hb
compounds named hemichromes, a variant of Hb in which cystein thiol groups
have been dangerously oxidized to form denatured Hb-aggregates precipitating
in inclusion bodies within RBCs, also known as “Heinz bodies”. Normally,

Chapter 1
8
reversible hemichromes can be reduced back to deoxyHb [Telen et al., 2004].
Significant distortions in the tertiary structure of the Hb can lead to the so-called
‘irreversible hemichromes’. The latter cannot be converted back to normal Hb
[Rachmilewitz et al., 1971] and are susceptible to further oxidative injury, during
prolonged storage, which may result in their fragmentation and formation of
aggregates.
Oxidation to proteins also results in the progressive accumulation of glycated
forms of haemoglobin (Hb1Ac, non-enzymatic addition of sugar moieties to the
proteins) during storage duration in the membrane and cytosol [Sparrow et al.,
2007]. Notably, altered membrane protein glycosylation patterns might
influence the rheological properties of RBCs [Berezina et al., 2002].
1.2 PARAMETERS OF THE OXIDATION/REDUCTION BALANCE IN in vivo
RED BLOOD CELLS
Red blood cells are responsible in vivo, for oxygen transport from lung to tissues. Their
function depends on reduced state of iron (Fe2+
) in hemoglobin (Hb). Both element
oxygen and iron are able to quickly shift their oxidative state in response to different
emerging stimuli. Literature shows that many approaches for evaluation of RBC redox
status have been established, including indirect approaches such as measurement of
protein oxidation, that reflects an accumulated damage [Lee, Britz-McKibbin, 2009].
The bigger the reactive species release is the higher normal deformability and flexibility
of erythrocytes is disturbed.
1.2.1. Reactive species generation
In erythrocyte, oxygen (O2), nitrogen oxide (NO•) and iron (Fe2+
) are found together.
All these elements act in normal conditions in established mechanisms but they may
generate alone or together reactive species, named radicals, that damage red blood cells
as well as vascular endothelium (Figure 1).
Chapter 1
9
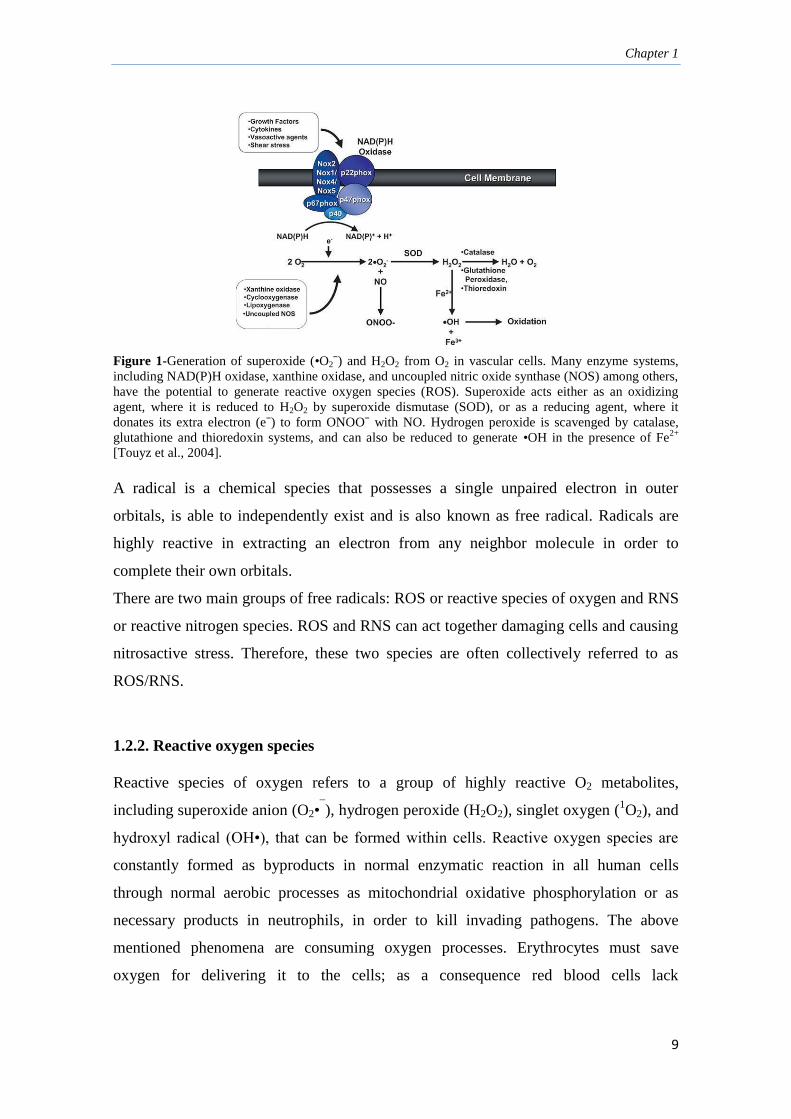
Figure 1-Generation of superoxide (•O2ˉ) and H2O2 from O2 in vascular cells. Many enzyme systems,
including NAD(P)H oxidase, xanthine oxidase, and uncoupled nitric oxide synthase (NOS) among others,
have the potential to generate reactive oxygen species (ROS). Superoxide acts either as an oxidizing
agent, where it is reduced to H2O2 by superoxide dismutase (SOD), or as a reducing agent, where it
donates its extra electron (eˉ) to form ONOOˉ with NO. Hydrogen peroxide is scavenged by catalase,
glutathione and thioredoxin systems, and can also be reduced to generate •OH in the presence of Fe2+
[Touyz et al., 2004].
A radical is a chemical species that possesses a single unpaired electron in outer
orbitals, is able to independently exist and is also known as free radical. Radicals are
highly reactive in extracting an electron from any neighbor molecule in order to
complete their own orbitals.
There are two main groups of free radicals: ROS or reactive species of oxygen and RNS
or reactive nitrogen species. ROS and RNS can act together damaging cells and causing
nitrosactive stress. Therefore, these two species are often collectively referred to as
ROS/RNS.
1.2.2. Reactive oxygen species
Reactive species of oxygen refers to a group of highly reactive O2 metabolites,
including superoxide anion (O2•¯), hydrogen peroxide (H2O2), singlet oxygen (
1O2), and
hydroxyl radical (OH•), that can be formed within cells. Reactive oxygen species are
constantly formed as byproducts in normal enzymatic reaction in all human cells
through normal aerobic processes as mitochondrial oxidative phosphorylation or as
necessary products in neutrophils, in order to kill invading pathogens. The above
mentioned phenomena are consuming oxygen processes. Erythrocytes must save
oxygen for delivering it to the cells; as a consequence red blood cells lack
Chapter 1
10
mitochondrion the main oxygen consumer within cell. In this particular condition the
source of ROS in erythrocyte may be the carried oxygen itself.
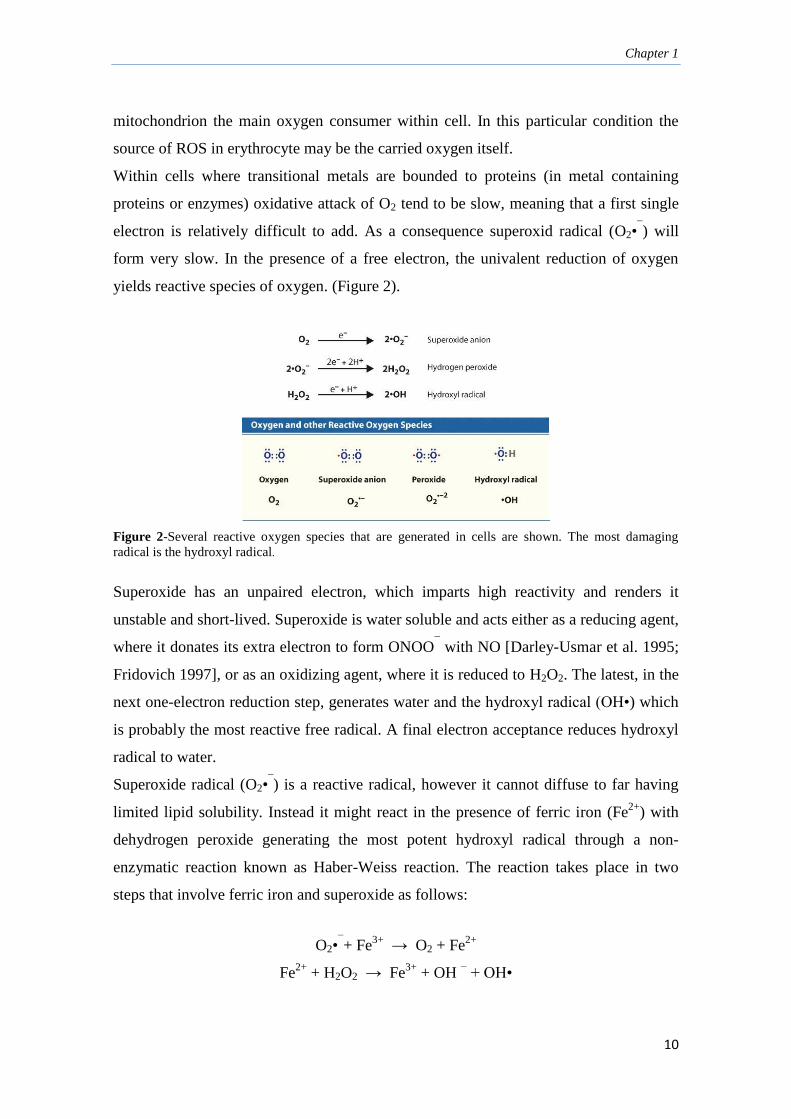
Within cells where transitional metals are bounded to proteins (in metal containing
proteins or enzymes) oxidative attack of O2 tend to be slow, meaning that a first single
electron is relatively difficult to add. As a consequence superoxid radical (O2•¯) will
form very slow. In the presence of a free electron, the univalent reduction of oxygen
yields reactive species of oxygen. (Figure 2).
Figure 2-Several reactive oxygen species that are generated in cells are shown. The most damaging
radical is the hydroxyl radical.
Superoxide has an unpaired electron, which imparts high reactivity and renders it
unstable and short-lived. Superoxide is water soluble and acts either as a reducing agent,
where it donates its extra electron to form ONOO¯ with NO [Darley-Usmar et al. 1995;
Fridovich 1997], or as an oxidizing agent, where it is reduced to H2O2. The latest, in the
next one-electron reduction step, generates water and the hydroxyl radical (OH•) which
is probably the most reactive free radical. A final electron acceptance reduces hydroxyl
radical to water.
Superoxide radical (O2•¯) is a reactive radical, however it cannot diffuse to far having
limited lipid solubility. Instead it might react in the presence of ferric iron (Fe2+
) with
dehydrogen peroxide generating the most potent hydroxyl radical through a non-
enzymatic reaction known as Haber-Weiss reaction. The reaction takes place in two
steps that involve ferric iron and superoxide as follows:
O2•¯+ Fe
3+ → O2 + Fe
2+
Fe2+
+ H2O2 → Fe3+
+ OH − + OH•

Chapter 1
11
The general non-enzymatic reaction occurring in living cells is:
O2•¯+ H2O2 → OH • + OH
− + O2
Hydrogen peroxide (H2O2) is not a free radical, but is produced mainly from
dismutation of O2•¯. H2O2 is lipid soluble and as a consequence it can diffuse through
lipid membranes.
Another reactive species (but not a radical) derived from molecular oxygen is singlet
oxygen, designated as 1O2. Singlet oxygen (
1O2), a highly excited state created when
molecular oxygen absorbs sufficient energy to shift an unpaired electron to a higher
orbital, can be formed from superoxide radical:
2O2•¯+ 2H
+ → H2O2 +
1O2
Singlet oxygen is even more reactive than the hydroxyl radical, although it is not a
radical. As a conclusion the most reactive radical is hydroxyl (OH•) which
indiscriminately extracts electrons from any other molecules around it, whereas
superoxide (O2•¯) and hydrogen peroxide (H2O2) are more selective in their reactions
with biological molecules.
All the above reactions and processes take place in all human cells including
erythrocytes. These pro-oxidants are tightly regulated by anti-oxidants such as
superoxide dismutase, catalase, thioredoxin, glutathione, anti-oxidant vitamins, and
other small molecules [Stralin et al., 1995; Halliwell 1999; Channon and Guzik, 2002;
Yamawaki et al., 2003].
Under normal conditions, the rate of ROS production is balanced by the rate of
elimination. However, a mismatch between ROS formation and the ability to defend
against them by antioxidants results in increased bioavailability of ROS leading to a
state of oxidative stress [Griendling et al., 2000; Landmesser and Harrison, 2001; Zalba
et al., 2001].

Chapter 1
12
1.3 OXIDATIVE STRESS DURING THE FORMATION OF STORAGE
LESIONS IN BLOOD BANKING RBCs: CHEMICAL MODIFICATION OF
PROTEINS BY REACTIVE OXYGEN SPECIES
Protein oxidation is the covalent modification of a protein induced either directly by
reactive oxygen species (ROS) or indirectly by reaction with secondary by-products of
oxidative stress [Shacter, 2000, Dean et al., 1997]. Circulating RBCs are equipped, in
vivo, with effective anti-oxidative systems that make them mobile free radical
scavengers, providing antioxidant protection not only to themselves but also to other
tissues and organs in the body [Siems, 2000, Arbos et al., 2008]. A condition of
oxidative stress develops when the critical balance between oxidants and antioxidants is
disrupted due to depletion of antioxidants and/or excess accumulation of ROS [Dalton
et al., 1999]. Indeed, the irreversible events occurring during the storage process,
exemplified by the haemolysis in the second half of the actual maximal blood bank
storage period, are mostly activated by radical species generated by prolonged,
continuous oxidative stress [Wolfe 1986, Racek et al., 2001].
Because there are so many mechanisms for induction of protein oxidation and because
all of the amino-acyl side chains can become oxidatively modified, there are numerous
different types of protein oxidative modifications (Table 3).
The demonstration that oxidatively modified forms of proteins accumulate during
storage and oxidative stress, has focused attention on physiological and non-
physiological mechanisms for the generation of ROS and on the modification of
biological molecules by various kinds of ROS.
Table 3-Oxidative Modifications of Proteins [Shacter 2000]
Modification Amino acids involved Oxidizing sourcea
Disulfides, glutathiolation Cys All ONOO¯
Methionine sulfoxide Met All, ONOOˉ
Carbonyls (aldehydes,
ketones) All (Lys, Arg, Pro, Thr) All
Oxo-histidine His -Ray, MCO, 1O2
Dityrosine Tyr -Ray, MCO, 1O2
Chlorotyrosine Tyr HOCl
Nitrotyrosine Tyr ONOOˉ

Chapter 1
13
Tryptophanyl modifications,
(N-formyl)kynurenine Trp
-Ray
Hydro(pero)xy derivatives Val, Leu, Tyr, Trp -Ray
Chloramines, deamination Lys HOCl
Lipid peroxidation adducts
(MDA, HNE, acrolein) Lys, Cys, His -Ray, MCO (not HOCl)
Amino acid oxidation adducts Lys, Cys, His HOCl
Glycoxidation adducts Lys Glucose
Cross-links, aggregates,
fragments Several All
a MCO-metal catalyzed oxidation; All = -ray, MCO, HOCl, ozone, 1O2.
The pioneering studies of Swallow, Garrison, and Scheussler and Schilling
demonstrated that reactions with OH• mainly initiated the modification of proteins;
however, the course of the oxidation process is determined by the availability of O2 and
O2ˉ• or its protonated form (HO2•). Collectively, the chemical effects of oxidative
changes on membrane proteins can lead to diverse functional consequences, such as
oxidation of amino acid residue side chains, formation of protein-protein cross-linkages,
and oxidation of the protein backbone resulting in protein fragmentation (Figure 3).
Current concepts of ROS signaling can be divided into two general mechanisms of
action: 1) alterations in the intracellular redox state, and 2) oxidative modifications of
proteins. The first is due to the alteration of the “redox-buffering” capacity of
intracellular thiols, primarily GSH and thioredoxin (TRX), maintained by the activity of
GSH reductase and TRX reductase, respectively.
Both of these thiol redox systems counteract intracellular oxidative stress by reducing
both H2O2 and lipid peroxides, reactions that are catalyzed by peroxidases (e.g., GSH
peroxidase catalyzes the reaction H2O2 + 2GSH → 2H2O + GSSG). The second is the
subject of discussion below.
[continued]

Chapter 1
14
Figure 3-Oxidative modification of proteins. A: the sulfhydryl (-SH) group of cysteine residues in
proteins may be modified by O2•ˉ (or H2O2) to form various oxidized derivatives. S-glutathionylation
appears to confer reversibility to such modifications by the action of thioltransferases . B: formation of
intramolecular disulfide bridges can alter protein activity by changes in conformation. C: intermolecular
disulfide linkages can mediate protein dimerization. D: H2O2- or peroxidase-catalyzed dityrosine
formation can induce protein cross-linking. E: transitional metal-containing proteins may be targets of
site-directed, metal-catalyzed oxidation by ROS produced by certain mixed-function oxidases (MFO),
which “target” them for ubiquitination and degradation by proteases. This is a potential mechanism for
ROS-mediated alterations in protein stability [Thannickal et al., 2000].
1.3.1 Oxidation of Sulfur-containing Amino Acid Residues
Although all amino acid residues of proteins are susceptible to oxidation, Cysteine
(Cys) [Shacter 2000; Radi et al., 1991] and methionine (Met) [Shacter 2000, Vogt 1995]
are those especially prone to oxidative attack, both of which contain susceptible sulfur
containing groups (thiols). Under even mild conditions, in the case of cysteine residues,
oxidation leads to the formation of sulfenic acid, inter- or intra-molecular disulfides,
protein mixed disulfides with low molecular weight thiols (e.g., GSH), and S-
nitrosothiols; methionine residues generate Met sulfoxide (MeSOX), the major product

Chapter 1
15
of conversion under biological conditions. Most biological systems contain disulfide
reductases and MeSOX reductases that can convert the oxidized forms of cysteine and
methionine residues back to their unmodified forms. These reversible modifications can
be part of regulatory processes of protein functions, in which cysteines can cycle
between the oxidized and reduced state [Ahmed 2007].
However, Cys residues can be irreversibly oxidized by strong oxidative agents to
sulfinic and sulfonic acids, which cause loss of protein function and cannot be reversed
by metabolic processes [Woo et al., 2003].In the case of prolonged storage, the
glycolytic enzyme glyceraldehyde-3-phosphate dehydrogenase (GAPDH) has been
found to undergoes temporary change of its catalytic center in response to storage-
induced oxidative stress through the formation of an intramolecular disulfide bond
involving catalytic cysteines [Rinalducci et al. 2011].
1.3.2 Protein Carbonylation: Generation of Protein Carbonyl Derivatives
Protein carbonylation is considered a major form of protein oxidation and aging, not
only because it is a sign of oxidative stress, but also of disease-derived protein
dysfunction. Formation of protein carbonyls can occur either by the α-amidation
pathway or by oxidation of glutamyl side chains which leads to formation of a peptide
in which the N-terminal amino acid is blocked by α-ketoacyl derivative. However,
direct oxidative attack on lysine, arginine, proline and threonine residues may also
generate carbonyl derivatives [Berlett et al. 1997].In addition, carbonyl groups may be
introduced into proteins by Michael addition reactions with α,β-unsatured aldehydes (4-
hydroxy-2-nonenal, malondialdehyde) produced during lipid peroxidation [Schuenstein
1979, Esterbauer 1991, Uchida 1993] or with reactive carbonyl derivatives (ketoamines,
ketoaldehydes, deoxyosones) generated as a consequence of glycation and
glycoxidation reactions, in which reducing sugars or their oxidation products react with
lysine residues of proteins [Monnier et al. 1995] (Figure 4).

Chapter 1
16
Figure 4-A general scheme for the different routes for protein carbonylation [Ashraf Madian, 2010]
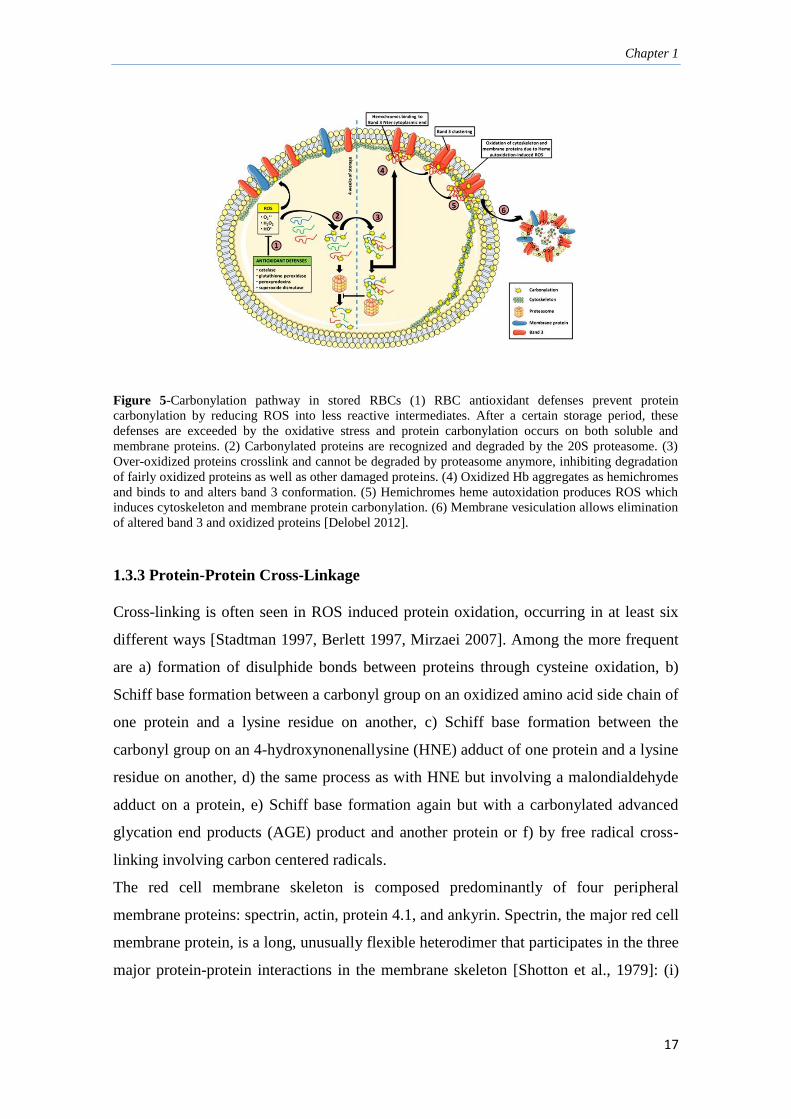
The higher levels of cytoskeletal protein carbonyl groups are observed after 35 days of
prolonged storage of RBCs, especially in non-leukodepleted CPDA units, and this
phenomenon is correlated with the extent of the oxidized Hb accumulation in the
membrane and the cytoskeleton systematically after 10 days of storage [Annis et al.,
2005; Kriebardis et al., 2007] (Figure 5). However, the observation of a decrease of
cytoskeleton-bound Hb and protein carbonylation levels by the end of the storage period
can be explained in part by the microvesiculation and the hemolysis of the most
severely damaged cells, or by the proteasome activity, two recognized self-protective/
age-dependent mechanisms [Kriebardis et al., 2006, Delobel et al., 2012]. Strictly
related to the protein carbonyl production is the progressive accumulation of advanced
glycation end-products, where glycated forms of haemoglobin (Hb1Ac) accumulate
proportionally to storage duration. Notably, alterations to Hb1Ac levels in units that
have been stored for longer periods might cause problems when treating/monitoring
certain categories of patients, such as those suffering from diabetes. In parallel, altered
membrane protein glycosylation patterns might influence the rheological properties of
RBC.
Chapter 1
17
Figure 5-Carbonylation pathway in stored RBCs (1) RBC antioxidant defenses prevent protein
carbonylation by reducing ROS into less reactive intermediates. After a certain storage period, these
defenses are exceeded by the oxidative stress and protein carbonylation occurs on both soluble and
membrane proteins. (2) Carbonylated proteins are recognized and degraded by the 20S proteasome. (3)
Over-oxidized proteins crosslink and cannot be degraded by proteasome anymore, inhibiting degradation
of fairly oxidized proteins as well as other damaged proteins. (4) Oxidized Hb aggregates as hemichromes
and binds to and alters band 3 conformation. (5) Hemichromes heme autoxidation produces ROS which
induces cytoskeleton and membrane protein carbonylation. (6) Membrane vesiculation allows elimination
of altered band 3 and oxidized proteins [Delobel 2012].
1.3.3 Protein-Protein Cross-Linkage
Cross-linking is often seen in ROS induced protein oxidation, occurring in at least six
different ways [Stadtman 1997, Berlett 1997, Mirzaei 2007]. Among the more frequent
are a) formation of disulphide bonds between proteins through cysteine oxidation, b)
Schiff base formation between a carbonyl group on an oxidized amino acid side chain of
one protein and a lysine residue on another, c) Schiff base formation between the
carbonyl group on an 4-hydroxynonenallysine (HNE) adduct of one protein and a lysine
residue on another, d) the same process as with HNE but involving a malondialdehyde
adduct on a protein, e) Schiff base formation again but with a carbonylated advanced
glycation end products (AGE) product and another protein or f) by free radical cross-
linking involving carbon centered radicals.
The red cell membrane skeleton is composed predominantly of four peripheral
membrane proteins: spectrin, actin, protein 4.1, and ankyrin. Spectrin, the major red cell
membrane protein, is a long, unusually flexible heterodimer that participates in the three
major protein-protein interactions in the membrane skeleton [Shotton et al., 1979]: (i)
Chapter 1
18
Spectrin associates with itself, head to head, to form tetramers [Shotton et al., 1979] and
perhaps higher order oligomers [Morrow et al., 1981]; (ii) The opposite end of the
molecule binds short filaments of actin, thus completing lateral connections within the
skeleton; finally, (iii) this spectrin-actin association is greatly enhanced by the
interaction of protein 4.1 with spectrin, near the spectrin-actin binding site. Several
studies [Ohanian et al., 1984, Cohen et al., 1984, Platt et al., 1984] have demonstrated a
spectrin injury (which interferes with spectrin-protein 4.1 interaction) remarkably
similar to the storage lesion in a patient with hemoglobin Nottingham, that results from
oxidation by breakdown products of stored red cells accumulated hemoglobin on the
membrane. Moreover, oxidation of membrane proteins, due to treatment with 2mM
periodate (known to oxidize vicinal hydroxyl groups in carbohydrates), results in a total
cross-linking of the spectrin polypeptides [Gahmberg et al., 1978]. Moreover, during
RBC storage, β-chain of hemoglobin becomes fused to the membrane fraction, mainly
with intracellular portion of the membrane band 3 [Zhang et al., 2000], partially in a
non-reducible, cross-linked form [Wolfe et al., 1986]. The formation of spectrin-Hb
crosslinking represents a kind of widespread oxidative damage in RBC membrane that
has been reported to normally occur in the more senescent cells in vivo [Snyder et al.,
1983].
Another example emerges from studies about oxidative stress-dependent oligomeric
status of erythrocyte peroxiredoxin II (PrxII) during storage under standard blood
banking conditions [Rinalducci et al. 2011]. Its major functions comprise cellular
protection against oxidative stress, modulation of intracellular signaling cascades that
apply hydrogen peroxide as a second messenger molecule, and regulation of cell
proliferation. In particular, human RBC PrxII, a 2-cys peroxiredoxin with a thiol-
dependent H2O2 scavenger activity [Wood 2003], exhibits four different oligomeric
states in cytosol, in which it exists as variable copies of its monomeric subunits, except
that with the highest molecular weight (440kDa), containing both reduced and oxidized
(disulphide-linked dimers) PrxII decamers. Although PrxII is a preferential cytosolic
protein, its association to RBC membrane has been previously reported [Moore et al.,
1991; Plishker et al., 1992; Moore et al., 1997; Murphy et al., 2004; Rocha et al., 2008;
2009; Antonelou et al., 2010]. In particular, the increase of intracellular reactive oxygen
species, such as during storage, leads to the PrxII accumulation as dimer in the

Chapter 1
19
membrane; oligomeric complex at 440 kDa is converted to a higher molecular weight
structure (480 kDa) due to the presence therein of cross-linked species of PrxII and
hemoglobin, with the presence of both disulphide-linked PrxII dimers and monomer
subunits, with a larger percentage of dimers.
Erythrocyte band 3 is a major multifunctional transmembrane glycoprotein divided into
two rather different domains of similar size, the hydrophobic 52 kDa C-terminal domain
and the water-soluble 43 kDa N-terminal domain (CDB3). The latter plays a crucial
structural role in linking the bilayer with the spectrin-based skeletal network.
Immunochemical data show immune recognition with the generation of aging-specific
anti-band 3 neoantigens in the oldest erythrocytes in concomitant with an apparent
aging associated increase in aggregation of band 3 [Kriebardis et al., 2007].
1.3.4 Hemoglobin oxidation
Hemoglobin, being the most abundant (98% of total protein content) protein in RBC, is
the main generator of reactive oxygen species, the main target of oxidative damage and
also a scavenger of free radicals.
In this way, the binding of oxygen to Hb, often denoted in the literature as oxygenated
Hb (oxyHb) or HbFe(II)O2, is accompanied by a migration of charge from the heme
iron to the oxygen, such that the structure of oxyHb is a ferric-superoxide anion
complex (Fe3+
O2ˉ) [Misra et al., 1972] (Figure 6). Oxy-Hb is a fairly stable molecule
but does slowly auto-oxidize to metHb. The autoxidation of oxyHb involves the
dissociation of the oxygen without electron transfer to yield superoxide (O2ˉ) and
metHb [HbFe(III)] [Misra et al., 1972].
HbFe(II)O2 ↔ HbFe(III) + O2ˉ
Hydrogen peroxide (H2O2) is produced during Hb autoxidation by the spontaneous and
enzyme driven dismutation of superoxide.
2O2·ˉ
+ 2H
+ ↔ H2O2 + O2

Chapter 1
20
Under normal unstressed conditions, the red cell reducing capacity is greater than 250
times its oxidizing potential: metHb is normally reduced back to deoxygenated Hb
(deoxyHb) by NADH–cytochrome b5–metHb reductase [Moore et al., 2004] and the
superoxide is dismutated without consequences. However, MetHb can react with
hydrogen peroxide to generate two oxidizing species: oxoferrylHb and a protein radical
centered on the globin chain [Winterbourn 1985, Sztiller et al., 2006]. This short-lived
ferryl radical reacts rapidly with oxygen to yield peroxyl radicals, which can degrade to
irreversibly green Hb derivatives including choleglobin and sulfhemoglobin
[Winterbourn 1985, Moxness et al., 1996]. Both derivatives are similar in having
covalently modified porphyrin rings and a hydrophobic affinity that enables them to
bind lipids. This feature has been linked to membrane damage through the extraction of
membrane components, such as phosphatidylserine, leading to shape change and
phospholipid redistribution [Moxness et al., 1996, Brunauer et al., 1994].
Figure 6-Different oxidative states of the heme iron. Each of the four globin chains of the hemoglobin
(Hb) molecule contains a heme group with an iron atom at its center. Hb oxidation can involve changes in
the iron’s oxidative state, and, consequently, modifications in ligand binding. The reduced ferrous state
(Fe2+
, red) allows oxygen binding to deoxygenated Hb (deoxyHb) at physiological conditions. The
resultant oxygenated Hb (oxyHb) can undergo oxidation to methemoglobin (metHb), in which the heme
iron is in the ferric state (Fe3+
, brown). MetHb can bind water, but not oxygen under physiological
conditions. The ferryl state (Fe4+
, green) can be obtained during Hb oxidative injury by hydrogen
peroxide. This state can lead to Hb denaturation [Misra et al., 1972].
Nevertheless, several erythrocyte abnormalities that circumvent or overwhelm the
erythrocyte oxidant defense system have been identified, such for example, those
related to hypothermic storage. In fact, although cooling below normal physiological
temperatures partially contrasts the accumulation of oxidative injuries, (I) the rate of
met-Hb reduction by cytochrome b5 reductase is slowered; (II) met-Hb may be more

Chapter 1
21
prone to denaturation as suggested by lower thermodynamic stability of met-myoglobin
at 4°C; and (III) the solubility of oxygen is doubled at 4°C. As a result, oxidative
damage can accumulate with refrigerated red cell liquid storage [Zolla and
D’Alessandro, 2011]. Moreover, the storage means (e.g. plastic bag and additive
solutions) contribute to exacerbate this phenomenon, by promoting an increased
concentrations of intracellular ROS during blood storage [Deepa Devi et al., 1998].
Under certain conditions, including heat stress, changes in pH, senescence [Sugawara et
al., 2003] and also increased Hb autoxidation, MetHb can be converted into low-spin
ferric Hb compounds named hemichromes (haemoglobin whose cysteine residues have
been oxidised, leading to the formation of aggregates). The release of the heme moiety
by denatured hemichromes has been shown to initiate oxidative damage to adjacent
membrane components [Atamna et al., 1995, Li et al., 2006]. Free heme has been
shown to inhibit a number of cytosolic enzymes [Scott et al., 1993], as well as to react
nonspecifically with membrane proteins leading to abnormal thiol oxidation and cross-
linking [Atamna et al., 1995] (especially at the level of the cytoplasmatic domain of
band 3), with consequent reduction of its deformability. Although free heme is degraded
in vivo through the heme oxygenase system [Kapitulnik 2004], during prolonged
storage, when the flux of glycolytic pathway decreases and NADH concentrations fall,
release of the heme iron has been shown to be catalyzed by intracellular GSH [Atamna
et al., 1995] or hydrogen peroxide [Nagababu et al.,1998]. As previously stated, free
iron is potentially toxic capable of acting as a Fenton reagent in the Haber–Weiss cycle,
which produces the deleterious hydroxyl radicals (OH•) and finally results in the
formation of Heinz bodies [Chiu et al., 1989] (Figure 7).
1.3.5 Hemoglobin and the functions of nitric oxide (NO) correlated with the Red
Cell Storage Lesion
Although hemoglobin can induce significant oxidative stress and inflammation, a
central mechanism for toxicity is likely the direct effect of free hemoglobin on nitric
oxide (NO) catabolism. Nitric oxide has a myriad of functions in human physiology
including neurotransmitter, host-defense molecule, inhibitor of platelet aggregation,
regulator of endothelial adhesion molecule expression, and antioxidant. It is perhaps
most widely recognized for its role in metHb formation. In fact, during this reaction,
Chapter 1
22
that is rate limited by diffusion to the heme group within Hb [Doyle et al., 1981, Eich et
al., 1996, Herold et al., 2001], oxygenated Hb reacts with NO to form metHb (FeIII)
and nitrate (NO3ˉ), and effectively destroys NO activity.
HbFe(II) O2 + NO → HbFe(III) + NO3ˉ
This rapid binding means a reduced NO bioavailability for vasodilation, although the
erythrocyte can be considered a potent NO sink [Kevil et al., 2010, Ferrari et al., 2009].
However, as noted above, cell-free Hb reacts with NO much faster (1000 times) than
RBC-encapsulated Hb. With increasing length of storage, the concentration of free
hemoglobin (in the form of ferrous oxyhemoglobin) in RBCs increases, with a direct,
proportional consumption of NO to the concentration of free heme. In addition, after a
dramatic increase in the number of microparticles in stored RBCs, cell-free Hb and Hb-
containing microparticles scavenge NO very fast. It is easy to see how disruption of the
RBC membrane, as in hemolysis (with a range of extracellular Hb levels reported in the
literature from 28 mmol/L - in heme - after 35 days of storage to 80 mmol/L after 50
days of storage [Bonaventura et al., 1997]), will effectively contribute to affect NO
bioavailability upon transfusion. Nevertheless, several mechanisms exist to prevent the
depletion of NO through interaction with hemoglobin. The first is that hemoglobin
located within the RBC membrane (RBC-encapsulated Hb) reacts with NO much more
slowly (1000 times) than does cell-free hemoglobin [Coin et al., 1979], primarily due to
the limitation of NO diffusion to erythrocyte through “an unstirred layer” [Azarov et al.,
2005]. A cell-free zone at the blood-endothelial interface is created by laminar blood
flow, which pushes RBCs to the center of the vessel and away from endothelial cell,
where NO is produced. In addition, the RBC membrane has a finite permeability to NO.
Indeed, any NO at greater distances from the external surface of the red cell membrane
has the rate limited by NO diffusion to the red cell. It is of great biological significance
that the Stamler laboratory has demonstrated another relevant reaction of NO with Hb:
S-nitrosylation of a cysteine residue, conserved in β-globins of all birds and mammals
(βCys93 of human Hb), which yields S-nitrosohemoglobin (SNO-Hb) [Jia et al., 1996,
Gow et al., 1998, Bonaventura et al., 1997].

Chapter 1
23
Figure 7-Summary of the major hemoglobin (Hb) oxidative pathways and their link to membrane
damage. (A) Autoxidation of oxygenated Hb [oxyHb, HbFe(II)O2] generates methemoglobin [metHb,
HbFe(III)] and superoxide anions (O2ˉ). Spontaneous or enzymatic dismutation of O2ˉ generates hydrogen
peroxide (H2O2).(B) Accumulation of H2O2 caused by the loss of vital antioxidants (catalase, glutathione)
may cause irreversible oxidative damage to Hb molecules. H2O2 can react with deoxygenated Hb
[HbFe(II)], oxyHb and metHb to generate metHb (C), ferrylHb [HbFe(IV)=O] (D) and oxoferrylHb
[·HbFe(IV)=O] (E), respectively. The reaction between H2O2 and metHb (E) also generates a protein
radical that can further react with oxygen to yield peroxyl radicals (F) and, eventually, decompose to
lipophilic green Hb derivatives, which bind to membrane lipids and induce oxidative damage. FerrylHb
(D) can react with oxyHb to generate two molecules of metHb (G), or with H2O2 (H) to generate metHb
and O2ˉ. The formation of O2ˉ within the heme pocket of the Hb has been shown to result in heme
degradation. Alternatively, a protonation of O2ˉ generates perhydroxyl radicals (•OOH) (I) that are known
to initiate membrane lipid peroxidation. Accumulation of intracellular metHb (J) may result in the
formation of hemichromes. Irreversible hemichromes undergo further denaturation leading to heme
degradation and release of the heme moiety and iron atoms. Both degradation products have been shown
to initiate membrane oxidative damage. The presence of O2ˉ and H2O2 may result in the formation of
hydroxyl radicals (•OH) (K) through the Haber–Weiss reaction. Heme degradation releases iron atoms,
which can catalyse this reaction. •OH is highly reactive and can cause oxidative damage to various cell
components. Note that all three major oxygen radicals (O2ˉ, H2O2 and •OH) can take place in the
oxidative denaturation of Hb and membrane damage. Remark: In order to simplify this model, reaction
products that do not participate in oxidative pathways (i.e. H2O, O2) are denoted by smaller fonts in
parentheses [Kanias et al., 2009].
Importantly, under hypoxic conditions, SNO-Hb retains endothelium-derived relaxing
factor (EDRF/NO) like bioactivity and is capable of transferring NO to low molecular
weight thiol-containing molecules (e.g. the membrane anion exchange protein,
glutathione). Notably, allosteric structural transitions of Hb, triggered by changes in
oxygen tension in vivo, contribute to the molecular gymnastics that dictate NO addition
and release from Hb-βCys93 [Jia et al., 1996, Gow et al., 1998, Bonaventura et al.,
1997].

Chapter 1
24
Although mechanistic details continue to be debated, recently it has been observed that
levels of SNO-Hb are altered in several disease states, characterized by disorders in
tissue oxygenation [Reynolds et al., 2007], like these affecting banked blood. The
storage-related deficiency of SNO-Hb, with associated impaired vasoregulation hinders
to improve oxygen delivery by RBCs in the microcirculation, predisposing excess
mortality and morbidity accompanying RBC transfusion. However, under conditions of
exacerbated Hb autoxidation (like ex-vivo storage of RBCs), when produced in excess, a
significant amount of O2ˉ• reacts with NO to produce peroxynitrite (ONOOˉ), a strong
oxidant formed intravascularly [Darley-Usmar et al., 1995], with a very short half-life
(g.e. milliseconds). Peroxynitrite can promote the nitration of aromatic compounds such
as protein tyrosine residues, a process that can profoundly alter protein structure and
function, and requires the intermediate formation of secondary nitrating species.
Generally, peroxynitrite can behave as either a one- or two-electron oxidant; in this
particular case, one-electron oxidants derived from peroxynitrite attack the phenolic
ring, leading to formation of a tyrosyl radical, followed by a coupling of the amino acid-
derived radical with •NO2 to yield 3-nitrotyrosine (3-NT) [Romero et al., 2003]. The
biological significance of tyrosine nitration supports the formation of 3-NT in vivo in
diverse pathologic conditions and the formation of 3-NT is thought to be both a
relatively specific marker of oxidative damage mediated by peroxynitrite and other
nitrogen free radical species [Radi 2013] and a post-translational modification with
important pathophysiological consequences, that disrupts NO signaling and skews
metabolism towards pro-oxidant processes. Concerning RBCs, recent studies have
shown that peroxynitrite induces morphological alterations, phosphatidylserine
externalization, activation of caspase cascades, increased amount of membrane-bound
Hb (presumably oxidized/denatured Hb), band 3 phosphorylation and a burst of both the
glycolytic pathway (with lactate accumulation) and the pentose phosphate shunt
[Matarrese et al. 2005, Metere et al., 2009]. Interestingly, all of these are also features of
storage lesions, thus the investigation of protein nitration in stored RBCs would be
beneficial and of great interest.

Chapter 1
25
1.3.6 Lipid Peroxidation
It is generally believed that membrane lipids are major targets for cellular damage
induced by free radicals. Red blood cells offer a number of advantages studies of effects
of oxidants on protein and lipid breakdown and oxidation respectively. As previously
stated, oxygen radicals are produced continually in red cells and may cause and damage
macromolcules and cellular structure of the organism, endothelium erythrocytes and
lipid peroxidation (the level of lipid peroxidation expressed as malondialdehyde). The
latter initiates when ROS remove a hydrogen atom from methylene carbons of fatty acid
side chains of Polyunsaturated fatty acids (PUFAs), resulting in lipid radical which
reacts with molecular oxygen to yield peroxyl radicals. Peroxyl radicals propagate the
oxidative process by removing hydrogen atoms from adjacent fatty acids, and
consequentially create various lipid hydroperoxides which further decompose to
secondary lipid peroxidation products such as malondialdehydes (MDAs) [Boaz et al.,
1999; Fiorillo et al., 1998]. MDAs have been widely used as lipid peroxidation
indicators. MDAs have been shown to have adverse effects on cell integrity as shown
by membrane damage and hemolysis in RBCs. The lipid peroxidation of
polyunsaturated fatty acids may be enzymatic and non-enzymatic. Enzymatic lipid
peroxidation is catalyzed by the lipoxygenases family, a family of lipid peroxidation
enzymes that oxygenates free and esterified PUFA generating as a consequence, peroxy
radicals. Researchers have focused their attention on lipid peroxidation by non-
enzymatic, non-radical mechanisms and formation of lipidperoxides, which is initiated
by the presence of molecular oxygen and is facilitated by Fe2+
ions [Repetto et al.,
2010]. Singlet oxygen and ozone are examples of molecules that induce such oxidation
The presence of cholesterol in cell surface membranes influences their susceptibility to
peroxidation, probably both by intercepting some of the radicals present and by
affecting the internal structure of the membrane by interaction of its large hydrophobic
ring structure with fatty acid-side-chains. As lipid peroxidation procedes in any
membrane and several of the products, including hydroperoxides, cleavage products
such as aldehydes, and polymeric materials produced, have a detergent-like activity, or
exert cytotoxic and genotoxic effects. This will contribute to increased membrane
disruption and further peroxidation.

Chapter 1
26
The onset of lipid peroxidation within biological membranes is associated with changes
in their physicochemical properties and with alteration of biological function of lipids
and proteins [Catala 2006].
1.3.7 The effects of phosphorylation on integrity membrane structure of stored
RBCs under blood banking conditions
It has been known for decades that phosphorylation plays an important role in cell
cycle, apoptosis, metabolism, receptor function and stress responses, through the
activation of signaling cascades [Dephoure et al., 2008, Macek et al., 2009, Beltran et
al., 2012]. The identification of the storage-associated alterations in the interaction
between the cytoskeleton and the lipid bilayer that determine membrane elasticity has
been widely documented [Berezina et al., 2002, Blasi et al., 2012, Cluitmans et al.,
2012]. Protein phosphorylation/dephosphorylation is one of the physiological processes
possibly controlling the membrane stability. In fact, recent data indicate that
phosphorylation is involved in molecular interactions at several levels and thereby
contributes to the integrity of the general membrane structure [Manno et al., 2005, De
Oliveira et al., 2008]. In particular, a central position on the functionally relevant
changes in the membrane composition of stored RBCs is occupied by alterations of
phosphorylation status of band 3. Cluitmans and collegues have postulated that altered
phosphorylation of band 3 on tyrosine residues, due to oxidative stress, may be
responsible for the metabolic changes, such as the described increase in glycolytic
intermediates within the first two weeks of storage [D'Alessandro et al., 2012, Gevi et
al., 2012] (in fact, the cytoplasmic domain of band 3 has a high affinity for key enzymes
of the glycolysis, and binding is regulated by phosphorylation). The oxidative stress-
dependent increase in band 3 tyr-phosphorylation is a trigger for activation of src
tyrosine kinases (Syk and Lyn) [Mallozzi et al., 2001] and down-regulation of tyrosine
phosphatases (PTP1B, SHP-1 and SHP-2) [Zipser et al., 2002]. The src kinases
phosphorylate tyrosines 8 and 21 of the cytosolic domain of the band 3 protein, thereby
facilitating formation of high-molecular-mass band 3 aggregates [Pantaleo et al., 2009].
Both srk kinases syk and lyn and the tyrosine phosphatase PTP1B are redox-sensitive,
indirectly the first, because their activity is controlled by the redox- and calcium-
sensitive phosphorylation steps mediated in particular by protein kinase C alpha. On the

Chapter 1
27
contrary, PTP1B possesses cysteine residues in the kinase domains, whose oxidation is
direct induced by oxidative stress [Bordin et al., 2005, Knock and Ward, 2011]. The
resulting cumulative tyrosine hyperphosphorylation, during last weeks of storage,
decreases the affinity of band 3 to ankyrin, causing destabilization of the band 3-
cytoskeleton interaction, increases the lateral mobility of band 3 within the membrane
and induces a progressive vesiculation [Ferru et al., 2011]. In addition, recent researches
have demonstrated the association between casein kinase II-catalyzed phosphorylation
of beta spectrin serine and protein kinase C- catalyzed phosphorylation of protein 4.1
and complement receptor- mediated increase in deformability [Glodek et al., 2010].
Phosphorylation of band 4.1 promotes dissociation of actin from the cytoskeleton, also
contributing to an increase in deformability [Manno et al., 2005, De Oliveira et al.,
2008].

References
28
References
Hess J. An update on solutions for red cell storage. Vox Sanguinis (2006) 91, 13–19.
Hess J. Red cell storage. Journal of Proteomics, Volume 73, Issue 3, 3 January 2010,
Pages 368–373.
Hess J. Red cell changes during storage. Transfusion and Apheresis Science 43 (2010)
51–59.
Högman et al. Storage parameters affecting red blood cell survival and function after
transfusion. Transfusion Medicine Reviews Volume 13, Issue 4, October 1999, Pages
275–296.
Ian Chin-Yee et al. The Red Cell Storage Lesion and its Implication for Transfusion.
Transfus. Sci. Vol. 18, No. 3, pp. 447±458, 1997.
Bennett-Guerrero E, Veldman TH, Doctor A, Telen MJ, Ortel TL, Reid TS, Mulherin
MA, Zhu H, Buck RD, Califf RM, McMahon TJ. Evolution of adverse changes in
stored RBCs. Proc Natl Acad Sci U S A. 2007 Oct 23; 104(43):17063-8.
Tamara L. Berezina et al. Influence of Storage on Red Blood Cell Rheological
Properties. Journal of Surgical Research 102, 6–12 (2002) doi:10.1006/jsre.2001.6306.
Lockwood WB, Hudgens RW, Szymanski IO, Teno RA, Gray AD. Effects of
rejuvenation and frozen storage on 42-day-old AS-3 RBCs. Transfusion 2003;43:1527–
32.
Salzer U, Zhu R, Luten M, Isobe H, Pastushenko V, Perkmann T. et al. Vesicles
generated during storage of red cells are rich in the lipid raft marker stomatin.
Transfusion 2008;48:451–62.

References
29
Dumaswala UJ, Zhuo L, Jacobsen DW. et al. Protein and lipid oxidation of banked
human erythrocytes: role of glutathione. Free Radic Biol Med 1999; 27: 1041-9.
Umakant j. Dumaswala, Limei Zhuo, Donald W. Jacobsen, Sushil K. Jain, Katherine A.
Sukalski Protein and lipid oxidation of banked human erythrocytes: Role of glutathione.
Free Radical Biology & Medicine, Vol. 27, Nos. 9/10, pp. 1041–1049, 1999.
D'Alessandro A, D'Amici GM, Vaglio S, Zolla L. Time-course investigation of SAGM-
stored leukocyte-filtered red bood cell concentrates: from metabolism to proteomics.
Haematologica 2012; 97: 107-15.
Kriebardis AG, Antonelou MH, Stamoulis KE, et al. Progressive oxidation of
cytoskeletal proteins and accumulation of denatured hemoglobin in stored red cells. J
Cell Mol Med 2007; 11: 148-55.
D'Amici GM, Rinalducci S, Zolla L. Proteomic analysis of RBC membrane protein
degradation during blood storage. J Proteome Res 2007; 6: 3242-55.
Walpurgis K, Kohler M, Thomas A, et al. Storage-induced changes of the cytosolic red
blood cell proteome analyzed by 2D DIGE and high-resolution/high-accuracy MS.
Proteomics 2012; 12: 3263-72.
Card R. Red cell membrane changes during storage. Transfus Med Rev 1988; 2: 40-7.
Wolfe L, Byrne A, Lux S., Molecular defect in the membrane skeleton of blood bank-
stored red cells. Abnormal spectrin-protein 4.1-actin complex formation. J Clin Invest
1986; 78: 1681-6.
Brad S. Karon, Camille M. van Buskirk, Elizabeth A. Jaben, James D. Hoyer, David D.
Thomas Temporal sequence of major biochemical events during Blood Bank storage of
packed red blood cells. Blood Transfus 2012; 10: 453-61.

References
30
Sparrow RL, Veale MF, Healey G, Payne KA. Red blood cell (RBC) age at collection
and storage influences RBC membrane-associated carbohydrates and lectin binding.
Transfusion 2007; 47: 966-8.
Berezina TL, Zaets SB, Morgan C, et al. Influence of storage on red blood cell
rheological properties. J Surg Res 2002; 102: 6-12.
Telen MJ, Kaufman RE (2004) Part II: normal hematologic system, the mature
erythrocyte. In Wintrobe’s Clinical Hematology (Greer JP, Foerster J, Lukens JN,
Rodgers GM, Paraskevas F & Glader B eds), pp. 217–248.
Rachmilewitz EA, Peisach J & Blumberg WE (1971) Studies on the stability of
oxyhemoglobin A and its constituent chains and their derivatives. J Biol Chem 246,
3356–3366.
Hall TL, Barnes A, Miller JR, Bethencourt DM, Nestor L. Neonatal mortality following
transfusion of red cells with high plasma potassium levels. Transfusion 1993;33:606–9.
Relevy H, Koshkaryev A, Manny N, Yedgar S, Barshtein G. Blood banking-induced
alteration of red blood cell flow properties. Transfusion 2008;48:136–46
Frans L. A. Willekens, Jan M. Werre, Yvonne A. M. Groenen-Do¨pp, Bregt
Roerdinkholder-Stoelwinder, Ben de Pauw and Giel J. C. G. M. Bosman Erythrocyte
vesiculation: a self-protective mechanism? British Journal of Haematology Volume
141, Issue 4, Article first published online: 16 APR 2008.
J. Racek, R. Herynková1, V. Holeček, J. Faltysová1 , I. Krejčová What is the Source of
Free Radicals Causing Hemolysis in Stored Blood? Physiol. Res. 50: 383-388, 2001.
Misra HP, Fridovich I (1972) The generation of superoxide radical during the
autoxidation of hemoglobin. J Biol Chem 247, 6960–6962.

References
31
Siems WG, Sommerburg O, Grune T. Erythrocyte free radical and energy metabolism.
Clin Nephrol 2000; 53:S9-S17.
Arbos KA, Claro LM, Borges L, Santos CA, Weffort-Santos AM. Human erythrocytes
as a system for evaluating the antioxidant capacity of vegetable extracts. Nutr Res
2008; 28:457-63.
Dalton TP, Shertzer HG, Puga A. Regulation of gene expression by reactive oxygen.
Ann Rev Pharmacol Toxicol 1999;39:67-101.
Moore TJ, Walsh CS, Cohen MR (2004) Reported adverse event cases of
methemoglobinemia associated with benzocaine products. Arch Intern Med 164, 1192–
1196.
Winterbourn CC (1985) Free-radical production and oxidative reactions of
hemoglobin. Environ Health Perspect 64, 321–330.
Sztiller M, Puchala M, Kowalczyk A & Bartosz G (2006) The influence of
ferrylhemoglobin and methemoglobin on the human erythrocyte membrane. Redox Rep
11, 263–271.
Moxness MS, Brunauer L, Huestis WH (1996) Hemoglobin oxidation products extract
phospholipids from the membrane of human erythrocytes. Biochemistry (Mosc) 35,
7181–7187.
Brunauer LS, Moxness MS & Huestis WH (1994) Hydrogen peroxide oxidation induces
the transfer of phospholipids from the membrane into the cytosol of human erythrocytes.
Biochemistry (Mosc) 33, 4527– 4532.
Sugawara Y, Kadono E, Suzuki A, Yukuta Y, Shibasaki Y, Nishimura N, Kameyama
Y, Hirota M, Ishida C, Higuchi N et al. (2003) Hemichrome formation observed in
human haemoglobin A under various buffer conditions. Acta Physiol Scand 179, 49–59.

References
32
Scott MD, van den Berg JJ, Repka TR, Ouyer-Fessard P, Hebbel R, Beuzard Y & Lubin
BH (1993) Effect of excess alpha-hemoglobin chains on cellular and membrane
oxidation in model beta-thalassemic erythrocytes. J Clin Invest 91, 1706–1712.
Atamna H, Ginsburg H (1995) Heme degradation in the presence of glutathione. J Biol
Chem 270, 24876–24883.
Li SD, Su YD, Li M & Zou CG (2006) Hemin-mediated hemolysis in erythrocytes:
effects of ascorbic acid and glutathione. Acta Biochim Biophys Sin 38, 63–69.
Kapitulnik J (2004) Bilirubin: an endogenous product of heme degradation with both
cytotoxic and cytoprotective properties. Mol Pharmacol 66, 773–779.
Nagababu E, Rifkind JM (1998) Formation of fluorescent heme degradation products
during the oxidation of hemoglobin by hydrogen peroxide. Biochem Biophys Res
Commun 247, 592–596.
Chiu DTY, Kuypers F & Lubin B (1989) Lipid peroxidation in human red cells. Semin
Hematol 26, 257–276.
Swallow, A. J. (1960) in Radiation Chemistry of Organic Compounds (Swallow, A. J.,
ed) pp. 211–224, Pergamon Press, New York.
Garrison W. M. (1987) Chem. Rev. 87, 381–398.
Garrison W. M., Jayko M. E., and Bennet W. (1962) Radiat. Res. 16, 487–502.
Schuessler H., and Schilling K. (1984) Int. J. Radiat. Biol. 45, 267–281.
Emily Shacter Quantification and significance of protein oxidation in biological
samples. Drug metabolism reviews, 32(3&4), 307–326 (2000).

References
33
Roger T. Dean, Shanlin Fu, Roland Stocker, Michael J. Davies J. Biochemistry and
pathology of radical-mediated protein oxidation Biochem. (1997) 324, 1-18.
Freeman R Radi, J S Beckman, K M Bush and B A Peroxynitrite oxidation of
sulfhydryls: the cytotoxic potential of superoxide and nitric oxide. J. Biol. Chem. 1991,
266:4244-4250.
Walther Vog Oxidation of methionyl residues in proteins: Tools, targets, and reversal.
Free Radical Biology and Medicine Volume 18, Issue 1, January 1995, Pages 93–105.
Rifkind JM, Nagababu E, Ramasamy LB. Redox Rep. Review hemoglobin redox
reactions and oxidative stress. 2003, (8): 234-7.
Victor Darley-Usmar, Helen Wiseman, Barry Halliwell Nitric oxide and oxygen
radicals: a question of balance. FEBS Letters 369 (1995)1 131 135.
Irwin Fridovich, Superoxide Anion Radical (O2•¯), Superoxide Dismutases, and Related
Matters. The Journal of Biological Chemistry vol. 272, no. 30, issue of july 25, pp.
18515–18517, 1997.
Stralin, P., Karlsson, K., Johansson, B.O. and Marklund, S.L. (1995) The Interstitium of
the Human Arterial Wall Contains very Large Amounts of Extracellular Superoxide
Dismutase. Arteriosclerosis, Thrombosis, and Vascular Biology, 15, 2032-2036.
Barry Halliwell Reactive Species and Antioxidants. Redox Biology Is a Fundamental
Theme of Aerobic Life. Plant Physiol. Jun 2006; 141(2): 312–322.
Channon KM1, Guzik TJ. Mechanisms of superoxide production in human blood
vessels: relationship to endothelial dysfunction, clinical and genetic risk factors. J
Physiol Pharmacol. 2002 Dec;53(4 Pt 1):515-24.

References
34
Hideyuki Yamawaki, Judith Haendeler, Bradford C. Berk Thioredoxin A Key Regulator
of Cardiovascular Homeostasis. Circ Res. 2003; 93:1029-1033.
Griendling KK1, Sorescu D, Ushio-Fukai M NAD(P)H oxidase: role in cardiovascular
biology and disease. Circ Res. 2000 Mar 17; 86(5):494-501.
Landmesser, U. and Harrison, D.G. (2001) Oxidative Stress and Vascular Damage in
Hypertension. Coronary Artery Disease, 12, 455-461.
Guillermo Zalba, et al. Oxidative Stress in Arterial Hypertension: Role of NAD(P)H
Oxidase. Hypertension 2001; 38;1395-1399.
Mohamed Salah El-Din Ahmed Detection of In Vitro and In Vivo Oxidative
Modifications of Ferritin and Transferrin by Mass Spectrometry: Hereditary
Hemochromatosis as a model. MASTER OF SCIENCE.
Hyun Ae Woo, Sang Won Kang, Hyung Ki Kim, Kap-Seok Yang, Ho Zoon Chae and
Sue Goo Rhee J. Cysteine-containing sequence specific for the hyperoxidized detection
with antibodies sulfinic acid: immunoblot cysteine of peroxiredoxins to cysteine
reversible oxidation of the active site. Biol. Chem. 2003, 278:47361-47364.
Berlett BS, Stadtman E R. Protein oxidation in aging, disease and oxidative stress. J
Biol Chem 1997; 272:20313-6.
Monnier, V., Gerhardinger, C., Marion, M. S., and Taneda, S. (1995) in Oxidative
Stress and Aging (Cutler, R. G., Packer, L., Bertram, J., and Mori, A., eds) pp. 141–149,
Birkhauser Verlag, Basel, Switzerland.
A Kriebardis, M Antonelou, K Stamoulis, E Economou-Petersen, L Margaritis, I
Papassideri (2008) RBC-derived vesicles during storage: ultrastructure, protein
composition, oxidation, and signaling components. Transfusion 48: 9. 1943-1953 Sep.

References
35
Anastasios G. Kriebardis, Marianna H. Antonelou, Konstantinos E. Stamoulis, Effrosini
Economou-Petersen, Lukas H. Margaritis, Issidora S. Papassideri Membrane protein
carbonylation in non-leukodepleted CPDA-preserved red blood cells. Blood Cells
Molecules, and Diseases, Volume 36, Issue 2, March–April 2006, Pages 279-282.
Julien Delobel, Michel Prudent, Olivier Rubin, David Crettaz, Jean-Daniel Tissot, Niels
Lion Subcellular fractionation of stored red blood cells reveals a compartment-based
protein carbonylation evolution. Journal of Proteomics, Volume 76, 5 December 2012,
Pages 181-193.
Schuenstein, E., and Esterbauer, H. (1979) CIBA Found. Symp. 67, 225–244.
Esterbauer, H., Schaur, R. J., and Zolner, H. (1991) Free Radical Biol. Med. 11, 81–
128.
Uchida, K., and Stadtman, E. R. (1993) J. Biol. Chem. 268, 6388–6393.
Lee R, Britz-McKibbin P. Differential Rates of Glutathione Oxidation for Assessment of
Cellular Redox Status and Antioxidant Capacity by Capillary Electrophoresis-Mass
Spectrometry: An Elusive Biomarker of Oxidative Stress. Anal Chem.
2009;81(16):7047-7056.
Annis, A.M.& Glenister, K.M.& Killian, J.J.& Sparrow, R.L., Proteomic analysis of
supernatants of stored red blood cell products. Transfusion, vol. 45, 2005, p.1426-1433.
Shotton, D., B. Burke, and D. Branton. 1979. The molecular structure of human
erythrocyte spectrin: biophysical and electron microscopic studies. J. Mol. Biol.
131:303-329.
Morrow, J., and V. Marchesi. 1981. Self-assembly of spectrin oligomers in vitro: a basis
for a dynamic cytoskeleton. J. Cell Biol. 88: 463-468.

References
36
Ohanian, V., L. C. Wolfe, K. M. John, J. C. Pinder, S. E. Lux, and W. B. Gratzer. 1984.
Analysis of the ternary interaction of the red cell membrane skeletal proteins, spectrin,
actin, and 4.1. Biochemistry. 23:4416-4420.
Cohen, C. M., and S. F. Foley. 1984. Biochemical characterition of complex formation
by human erythrocyte spectrin, protein 4.1, and actin. Biochemistry. 23:6091-6098.
Platt, O., J. Falcone, and S. Lux. 1984. Membrane skeleton lesions in unstable
Hemoglobin Nottingham. Blood. 64(Suppl. 1):30a.
Carl G. Gahmberg, Ismo Virtanent , Jorma Wartiovaarat Cross-Linking of Erythrocyte
Membrane Proteins by Periodate and Intramembrane Particle Distribution. Biochem.
J. (1978) 171, 683-686
Dachuan Zhang, Anatoly Kiyatkin, Jeffrey T. Bolin, and Philip S. Low Crystallographic
structure and functional interpretation of the cytoplasmic domain of erythrocyte
membrane band 3. November 1, 2000; Blood: 96 (9).
Ashraf G. Madian and Fred E. Regnier Proteomic identification of carbonylated
proteins and their oxidation sites. J Proteome Res. 2010 August 6; 9(8): 3766–3780.
Stadtman ER, Berlett BS. Reactive Oxygen-Mediated Protein Oxidation in Aging and
Disease. Chemical Research in Toxicology. 1997; 10(5):485–494.
Mirzaei H, Regnier F. Identification of yeast oxidized proteins. J. Chromatogr., A. 2007;
1141(1): 22–31.
Berlett BS, Stadtman ER. Protein oxidation in aging, disease, and oxidative stress.
Journal of Biological Chemistry 1997; 272(33):20313–20316.
L. M. Snyder, L. Leb, J. Piotrowski, N. Sauberman, S. C. Liu and N. L. Fortier
Irreversible spectrin-haemoglobin crosslinking in vivo: a marker for red cell
References
37
senescence. British Journal of Haematology Volume 53, Issue 3, pages 379–384, March
1983.
Sara Rinalducci, Gian Maria D’Amici, Barbara Blasi, Lello Zolla Oxidative stress-
dependent oligomeric status of erythrocyte peroxiredoxin II (PrxII) during storage
under standard blood banking conditions. Biochimie Volume 93, Issue 5, May 2011,
Pages 845–853.
Moore RB, Mankad MV, Shriver SK, Mankad VN, Plishker GA. Reconstitution of
Ca2+-dependent K+ transport in erythrocyte membrane vesicles requires a cytoplasmic
protein. J Biol Chem. (1991); 266:18964–8.
Moore RB, Shriver SK, Jenkins LD, Mankad VN, Shah AK, Plishker GA. Calpromotin,
A cytoplasmic protein, is associated with the formation of dense cells in sickle cell
anemia. Am J Hematol. (1997); 56:100-6.
Plishker GA, Chevalier D, Seinsoth L, Moore RB. Calcium-activated potassium
transport and high molecular weight forms of calpromotin. J Biol Chem. (1992);
267:21839–43.
Murphy SC, Samuel BU, Harrison T, Speicher KD, Speicher DW, Reid ME, Prohaska
R, Low PS, Tanner MJ, Mohandas N, Haldar K. Erythrocyte detergent-resistant
membrane proteins: their characterization and selective uptake during malarial
infection. Blood (2004); 103:1920-8.
Rocha S, Vitorino RM, Lemos-Amado FM, Castro EB, Rocha-Pereira P, Barbot J,
Cleto E, Ferreira F, Quintanilha A, Belo L, Santos-Silva A. Presence of cytosolic
peroxiredoxin 2 in the erythrocyte membrane of patients with hereditary spherocytosis.
Blood Cells Mol Dis. (2008); 41:5-9.

References
38
Antonelou MH, Kriebardis AG, Stamoulis KE, Economou- Petersen E, Margaritis LH,
Papassideri IS. Red blood cell aging markers during storage in citrate-
phosphatedextrose-saline adenine-glucosemannitol. Transfusion (2010); 50:376-89.
Bosman GJ, Lasonder E, Luten M, Roerdinkholder- Stoelwinder B, Novotný VM, Bos
H, De Grip WJ. The proteome of red cell membranes and vesicles during storage in
blood bank conditions. Transfusion (2008); 48:827-35.
Victor J. Thannickal and Barry L. Fanburg Reactive oxygen species in cell signaling.
Am J Physiol Lung Cell Mol Physiol 279: L1005–L1028, 2000.
R. M. Touyz, E. L. Schiffrin Reactive oxygen species in vascular biology: implications
in hypertension. Histochem Cell Biol (2004) 122:339–352.
Zolla L, D'alessandro A, Rinalducci S, D'amici GM, Pupella S, Vaglio S, Grazzini G.
Classic and alternative red blood cell storage strategies: seven years of "-omics"
investigations. Blood Transfus. 2014 Sep 12:1-11.
Deepa Devi KV, Manoj Kumar V, Arun P, Santhosh A, Padmakumaran Nair KG,
Lakshmi LR, Kurup PA. Increased lipid peroxidation of erythrocytes in blood stored in
polyvinyl chloride blood storage bags plasticized with di-[2-ethyl hexyl] phthalate and
effect of antioxidants. Vox Sang. 1998; 75(3):198-204.
Doyle MP, Hoekstra JW. Oxidation of nitrogen-oxides by bound dioxygen in
hemoproteins. J Inorg Biochem 1981; 14:351-8.
Eich RF, Li TS, Lemon DD, Doherty DH, Curry SR, Aitken JF, Mathews AJ, Johnson
KA, Smith RD, Phillips GN Jr, Olson JS. Mechanism of NO-induced oxidation of
myoglobin and hemoglobin. Biochemistry 1996; 35:6976-83.
Herold S, Exner M, Nauser T. Kinetic and mechanistic studies of the NO*-mediated
oxidation of oxymyoglobin and oxyhemoglobin. Biochemistry 2001; 40:3385-95.

References
39
Daniel B. Kim-Shapiro, Janet Lee and Mark T. Gladwin Storage lesion: role of red
blood cell breakdown. Transfusion Volume 51, Issue 4, pages 844–851, April 2011.
Coin JT, Olson JS. Rate of oxygen-uptake by human red blood-cells. J Biol Chem 1979;
254:1178-90.
Azarov I, Huang KT, Basu S, Gladwin MT, Hogg N, Kim- Shapiro DB. Nitric oxide
scavenging by red blood cells as a function of hematocrit and oxygenation. J Biol Chem
2005; 280:39024-32.
Jia, L., Bonaventura, C., Bonaventura, J. & Stamler, J. S. (1996) Nature (London) 380,
221–226.
Gow, A. J., Stamler, J. S. (1998) Nature (London) 391, 169–173. Stamler, J. S., Jia, L.,
Eu, J. P., McMahon, T. J., Demchenko, I. T.
Bonaventura, J., Gernert, K. & Piantadosi, C. A. (1997) Science 276, 2034–2037.
James D. Reynolds, Gregory S. Ahearn, Michael Angelo, Jian Zhang, Fred Cobb, and
Jonathan S. Stamler S-nitrosohemoglobin deficiency: A mechanism for loss of
physiological activity in banked blood. 17058–17062 PNAS October 23, 2007 vol. 104
no. 43.
Natalia Romero¶, Rafael Radi, Edlaine Linares, Ohara Augusto, Charles D. Detweiler,
Ronald P. Mason, and Ana Denicola Reaction of Human Hemoglobin with Peroxynitrite
Isomerization to nitrate and secondary formation of protein radicals. The Journal of
Biological Chemistry vol. 278, no. 45, issue of november 7, pp. 44049–44057, 2003.
Rafael Radi Protein Tyrosine Nitration: Biochemical Mechanisms and Structural Basis
of its Functional Effects. Acc Chem Res. 2013 Feb 19; 46(2):550-9.

References
40
Matarrese P, Straface E, Pietraforte D, Gambardella L, Vona R, Maccaglia A, Minetti
M, Malorni Peroxynitrite induces senescence and apoptosis of red blood cells through
the activation of aspartyl and cysteinyl proteases. W FASEB J. 2005 Mar;19(3):416-8.
Metere A, Iorio E, Pietraforte D, Podo F, Minetti M. Peroxynitrite signaling in human
erythrocytes: synergistic role of hemoglobin oxidation and band 3 tyrosine
phosphorylation. Arch Biochem Biophys. 2009 Apr 15;484(2):173-82.
Darley-Usmar V, Wiseman H, Halliwell B. Nitric oxide and oxygen radicals. a question
of balance. FEBS Lett. 1995;369:131–135.
Müller H., Schmidt U., Lutz H. U. (1981). On the mechanism of vesicle release from
ATP-depleted human red blood cells. Biochim. Biophys. Acta 649, 462–470
10.1016/0005 2736(81)90437-5.
Dephoure, N.; Zhou, C.; Villen, J.; Beausoleil, S.A.; Bakalarski, C.E.; Elledge,S.J.;
Gygi, S.P.A quantitative atlas of mitotic phosphorylation. Proc.Natl.Acad.Sci. USA
105:10762–10767; 2008.
Macek, B.; Mann,M.; Olsen, J.V. Global and site-specific quantitative
phosphoproteomics: principles and applications. Annu. Rev.Pharmacol.Tox- icol.
49:199–221; 2009.
Beltran, L.; Casado,P.; Rodriguez-Prados, J.C.; Cutillas, P.R. Global profiling of
protein kinase activities in cancer cells by mass spectrometry. J. Proteomics 77:492–
503; 2012.
Berezina TL, Zaets SB, Morgan C, et al. Influence of storage on red blood cell
rheological properties. J Surg Res. 2002; 102:6–12.
Blasi B, D’Alessandro A, Ramundo N, Zolla L. Red blood cell storage and cell
morphology. Transf Med. 2012; 22:90–6.

References
41
Judith C.A. Cluitmans, Max R. Hardeman, Sip Dinkla, Roland Brock, and Giel
J.C.G.M. Bosman, Red blood cell deformability during storage: towards functional
proteomics and metabolomics in the Blood Bank. Blood Transfus. May 2012; 10(Suppl
2): s12–s18.
Gevi F, D’Alessandro A, Rinalducci S, Zolla L. Alterations of red blood cell
metabolome during cold liquid storage of erythrocyte concentrates in CPD-SAGM. J
Proteomics. 2012 Mar 20.
Mallozzi C, Di Stasi MA, Minetti M. Peroxynitrite-dependent activation of src tyrosine
kinases lyn and hck in erythrocytes is under mechanistically different pathways of redox
control. Free Radic Biol Med. 2001 May 15;30(10):1108-17.
Yehudit Zipser, Adi Piade, Alexander Barbul, Rafi Korenstein and Nechama S.
Kosower, Ca2+
promotes erythrocyte band 3 tyrosine phosphorylation via dissociation
of phosphotyrosine phosphatase from band 3. Biochem. J. (2002) 368 (137–144).
Pantaleo, A., Ferru, E., Giribaldi, G., Mannu, F., Carta, F., Matte, A.,et al. (2009).
Oxidized and poorly glycosylated band 3 is selective lyphosphorylated by Syk kinase to
form large membrane clusters in normal and G6PD-deficient red blood cells.
Biochem.J. 418, 359–367.
Bordin, L., Ion-Popa, F., Brunati, A.M., Clari, G., and Low, P.S.(2005). Effector-
induced Syk-mediated phosphorylation in human erythrocytes. Biochim. Biophys. Acta
1745, 20–28.
Knock, G.A., and Ward, J.P. (2011). Redox regulation of protein kinases as a
modulator of vascular function. Antioxid. Redox Signal. 15, 1531–1547.
Ferru, E., Giger, K., Pantaleo, A., Campanella, E., Grey, J., Ritchie, K.,et al. (2011).
Regulation of membrane-cytoskeletal interactions by tyrosine phosphorylation of
erythrocyte band 3. Blood 117, 5998–6006.

References
42
Glodek AM, Mirchev R, Golan DE, et al. Ligation of complement receptor 1 increases
erythrocyte membrane deformability. Blood 2010; 116: 6063- 71.
Manno S, Takakuwa Y, Nagao K, Mohandas N. Modulation of erythrocyte membrane
mechanical function by protein 4.1 phosphorylation. J Biol Chem 2005; 280: 7581- 7.
De Oliveira S, Silva-Herdade AS, Saldanha C. Modulation of erythrocyte deformability
by PKC activity. Clin Hemorheol Microcirc 2008; 39: 363- 73.
Boaz Mona, Matas Zipora, Biro Alexander, Katzir Ze'ev, Green Manfred, Fainaru
Menahem and Smetana Shmuel Serum malondialdehyde and prevalent cardiovascular
disease in hemodialysis. Kidney International (1999) 56, 1078–1083.
Fiorillo Claudia, Oliviero Ciro, Rizzuti Giovanni, Nediani Chiara, Pacini Alessandra,
Nassi Paolo Oxidative Stress and Antioxidant Defenses in Renal Patients Receiving
Regular Haemodialysis. Clinical Chemistry and Laboratory Medicine. Volume 36,
Issue 3, Pages 149–153, ISSN (Print) 1434-6621.
Repetto Marisa G., Ferrarotti Nidia F., Boveris Alberto The involvement of transition
metal ions on iron-dependent lipid peroxidation. Arch Toxicol (2010) 84:255–262.
Catalá Angel An overview of lipid peroxidation with emphasis in outer segments of
photoreceptors and the chemiluminescence assay. The International Journal of
Biochemistry & Cell Biology Volume 38, Issue 9, 2006, Pages 1482–1495.
Dr. C. Riedner, M. U. Heim, W. Mempel andW. Wilmanns Possibility to Improve
Preservation of Whole Blood by Leukocyte-Depletion before Storage. Vox Sanguinis
Volume 59, Issue 2, pages 78–82, August 1990.
Rosemary L. Sparrow, Margaret F. Veale, Geraldine Healey andKatherine A. Payne
Red blood cell (RBC) age at collection and storage influences RBC membrane-
associated carbohydrates and lectin binding. Transfusion Volume 47, Issue 6, pages
966–968, June 2007.

References
43
Ognjen Gajic, Rimki Rana, Jeffrey L. Winters, Murat Yilmaz, Jose L. Mendez, Otis B.
Rickman, Megan M. O’Byrne, Laura K. Evenson, Michael Malinchoc, Steven R.
DeGoey, Bekele Afessa, Rolf D. Hubmayr, and S. Breanndan Moore Transfusion-
related Acute Lung Injury in the Critically Ill Prospective Nested Case-Control Study.
American Journal of Respiratory and Critical Care Medicine, Vol. 176, No. 9 (2007),
pp. 886-891.
W. A. L. Heaton, S. Holme1, K. Smith, M. E. Brecher, A. Pineda, J. P. AuBuchon
andE. Nelson Effects of 3-5 log10 pre-storage leucocyte depletion on red cell storage
and metabolism. British Journal of Haematology Volume 87, Issue 2, pages 363–368,
June 1994.
Kevil CG, Patel RP. S-Nitrosothiol biology and therapeutic potential in metabolic
disease. Curr Opin Investig Drugs 2010; 11:1127-34.
Ferrari CK, Franca EL, Honorio-Franca AC. Nitric oxide, health and disease. J Appl
Biomed 2009; 7:163-73.
Rother RP, Bell L, Hillmen P, Gladwin MT. The clinical sequelae of intravascular
hemolysis and extracellular plasma hemoglobin: a novel mechanism of human disease.
JAMA 2005; 293:1653-62.
44
CHAPTER 2:
HAEMOGLOBIN GLYCATION (Hb1AC) INCREASES DURING RED BLOOD
CELL STORAGE: A MALDI-TOF MASS-SPECTROMETRY-BASED
INVESTIGATION

Chapter 2
45
2.1 AIM OF THE STUDY
Haemoglobin A1c (HbA1c) represents a key biomarker in diabetes diagnosis and
management, since it allows clinicians to estimate mean blood glucose concentration in
the recent period preceding withdrawal [Stevens et al., 1977]. Indeed, glycation of
haemoglobin is a non-enzymatic irreversible process that is promoted by the prolonged
exposure of erythrocytes to high glucose concentrations [Stevens et al., 1977], a
condition that is known to occur under blood banking conditions, where additive
solutions (such as SAGM) expose red blood cells (RBCs) to higher than normal
glycemic levels [Szelényi et al., 1983]. However, controversial data indicate no clear
hint as to whether and to which extent HbA1c accumulates during red blood cell storage
[Szelényi et al., 1983, Weinblatt et al., 1986, Spencer et al., 2011]. Indeed, data from the
older literature support the hypothesis that high glucose concentrations in RBC storage
medium end up promoting glycation of Hb, thus resulting in the accumulation of
HbA1c over time [Szelényi et al., 1983, Weinblatt et al., 1986]. These results would
underpin the prediction about HbA1c increasing in transfused recipients, although no
statistically significant correlation between these two events has been observed by
Spencer and colleagues, who thus concluded that ‘glycation of haemoglobin in stored
RBC units is negligible despite the high glucose concentrations in stored RBC units’
[Spencer Det al., 2011]. Hereby, we propose the application of a validated [Biroccio et
al., 2005, Zurbriggen et al., 2005, Bursell et al., 2000] MALDI-TOF mass-spectrometry-
based method to this issue and report the observation about HbA1c levels apparently
increasing over storage progression.
2.2 MATERIALS AND METHODS
2.2.1 Sample collection
RBC units were drawn from healthy human volunteers according to the policy of the
Italian National Blood Centre guidelines (Blood Transfusion Service for donated blood)
and all the volunteers provided their informed consent in accordance with the
declaration of Helsinki. We studied RBC units collected from 10 healthy donor
volunteers [male = 5, female = 5, age 42.3 ± 10.5 (mean ± S.D.)]. In details, whole
blood (450 mL + 10%) was collected from healthy volunteer donors into CPD

Chapter 2
46
anticoagulant (63 mL) and leukodepleted (i.e. 4-log WBC depletion). After separation
of plasma by centrifugation, RBCs were suspended in 100 mL of SAGM (Saline,
Adenine, Glucose, Mannitol) additive solution. RBC units were stored for up to 42 days
under standard conditions (1–6°C), while samples were removed aseptically for the
analysis fortnightly (at 0, 14, 28 and 42 days of storage).
2.2.2 Matrix and sample preparation for MALDI-TOF MS
Protein calibration standard mix I (containing horse heart cytocrome c and myoglobin in
the HbA1c target molecular weight range) was obtained from Bruker Daltonics
(Bremen, Germany). Sinapinic acid (3,5-dimethoxy-4-hydroxy-cinnamic acid - SA),
solvents for sample preparation and trifluoroacetic acid (TFA) were purchased from
Fluka (Milan, Italy).
MALDI-TOF MS analysis of HbA was performed according to the method by Biroccio
et al. [Biroccio et al., 2005]. Samples were prepared with a sandwich layer method.
First, a matrix layer was prepared by applying a droplet (0.5 µL) of 30 mg/mL of
saturated solution of SA matrix dissolved in 100% ethanol to the surface of a smooth
stainless steel sample plate and allowing it to dry. A fine crystalline layer was formed
within a few seconds. A droplet (0.5 µL) of 30 mg/mL of saturated solution of sinapinic
acid matrix, dissolved in acetonitrile and 0.1% trifluoroacetic acid (1:1), and analyte
solution (1:100 dilution), mixed with equal volumes (5 µL), was placed on the surface
of the crystalline seed layer and dried in air at room temperature. The stainless steel
sample plate (MTP384 target plate ground steel – Bruker Daltonics - Bremen,
Germany) was then inserted into the MALDI instrument.
2.2.3 Linear MALDI-TOF MS analysis and calculation of glycated or
glutathionylated hemoglobin
All MALDI analyses were performed with an Autoflex III MALDI-TOF mass
spectrometer (Bruker Daltonics - Bremen, Germany). The system utilizes a Smartbeam
laser, emitting at 337 nm. Ion source and flight tube were kept at a pressure of about 4 x
10-7
mbar by turbo molecular pumps. All spectra were acquired in linear mode at 20,
18.5, and 6.80 kV for ion sources 1 and 2 and lens, respectively. Laser power was fixed
to 25% with a pulsing rate of 200 Hz to allow about 1000 ion counts for each single

Chapter 2
47
acquisition series (500 shots). Spectra analysis was performed with Bruker FlexAnalysis
3.3 (Bruker Daltonics – Bremen, Germany). Relative concentrations of HbA1c were
calculated as a percentage of the glycated forms (15.289 and 16.030 m/z) with respect to
the total of the free form of alpha and beta globin chains (Hb= 15.127 +15.868 m/z),
within the linearity range of the instrument [Stevens et al., 1977], according to the
following equation:
HbA1c % = HbA1c x 100
(α + HbA1c)
Figure 1-MALDI TOF intact mass spectrum of alpha and beta globin chains. Spectrum interpretation and
peak attribution has been performed on the basis of Biroccio et al. and Zurbriggen et al. A sample RBC
intact mass spectrum is reported in the range between 14500 and 17000 m/z. We could identify the main
alpha (15127 m/z) and beta globin (15868 m/z) chains, their main glycated variants showing a +162 Da
adduct (at 15�289 and 16�030 m/z, respectively), and the respective heme adducts (+615 Da, at 15�742
and 16�483 m/z, respectively) [Biroccio et al., 2005, Zurbriggen et al., 2005]. Also, +207 Da adducts
with the SA matrix were visible as well, in agreement with Biroccio et al.
3 RESULTS AND DISCUSSION
The analytical approach exploited in the present study holds several advantages over
routine methods for HbA1C, including the rapidity and robustness of the approach,
along with the higher sensitivity of MALDI-TOF–TOF last generation instruments in
comparison with triple quadrupoles mass spectrometers. Triple quadrupoles are more
diffused in the clinical setting [Gevi et al., 2012], despite their low tolerance for salts

Chapter 2
48
and sample impurities, instrumentation costs, length of the analysis and laborious
sample handling/preparation [Gevi et al., 2012]. In Figure 1, we report a sample
MALDI-TOF spectrum. In Figure 2, where spectra from the analysis of RBCs at 0, 14,
28 and 42 days of storage are graphed, storage progression corresponded to a visible
increase in the glycated forms of Hb chains. Results reported in Table 1 are
representative of the quantification of the relative percentages of HbA1c, according to
the formula indicated in Table 1. As it emerges from these results, relative quantities of
glycated Hb form A1c in relation to free Hb alpha chain increase over storage
progression, as to become statistically significant (P-value < 0�05 ANOVA) after the
14th day of storage, at 28 days. Therefore, our results are consistent with older direct
measurements of HbA1c in stored RBC units [Szelényi et al., 1983, Weinblatt et al.,
1986]. Although these results are in apparent contradiction with the report by Spencer
and colleagues [Spencer et al., 2011], it should be noted that indirect measurements of
HbA1c in the recipients upon transfusion are both affected by pretransfusion HbA1c
levels and dilution of the HbA1c levels of long-stored transfused unit (in a healthy
patient, this ratio is approximately 1:10 for a single RBC unit in a 5-l adult male healthy
individual blood sample). Also, the final HbA1c upon long-term storage might indeed
increase over initial values (of the donor), but still be lower than the one that could be
observed in the pre-transfusion recipient’s blood. Accumulation of HbA1c might be
dependent on the additive solution. Indeed, absolute and relative quantifications of
glucose levels in CPD-SAGM-stored erythrocyte concentrates indicate that, despite
ongoing glycolysis [Gevi et al., 2012, D’Alessandro et al., 2012], at the end of the
storage, glucose levels in the supernatants are approximately of 12 – 1 mM, which is
still higher than circulating glucose in diabetic patients (subjects with a consistent
glycaemia above 7 mM are generally held to have diabetes) [Burger et al., 2010]. If we
consider that HbA1c formation is a non-enzymatic phenomenon that is both dependent
on glucose concentrations and oxidative stress, one leading cause triggering RBC
storage lesions during prolonged storage [Gevi et al., 2012, D’Alessandro et al., 2012],
it is realistic enough to conclude that CPD-SAGM-stored RBCs should be more
susceptible to the formation of HbA1c than RBCs storage in presence of other, less
‘glucose loaded’, additive solutions. In this view, it is worthwhile to stress that
oxidative stress in CPD-SAGM-stored RBC units becomes significant upon 2 weeks of

Chapter 2
49
storage [Gevi et al., 2012, D’Alessandro et al., 2012], in line with the hereby reported
observations (Table 1).
Table 1 – Time course analysis of HbA1c during red
blood cell storage
Sample Mean Value
HbA1c% = HbA1c x 100
(Hb + HbA1c) 0-day 4,13 + 0.25
14-day 5,36 + 0.18
28-day 7,59 + 0.21*
42-day 10,90 + 0.25* Hb: ion counts at 15127 m/z + 15868; HbA1c: ion counts at 15289 + 16030
m/z
* = statistically significant at p < 0.05 ANOVA
Figure 2-Time course analysis of RBC extracts over storage duration under blood bank conditions.
Samples were assayed fortnightly at 0, 14, 28 and 42 days of storage. HbA1C glycated form of alpha
globin evidently increased in proportion to storage duration. A small peak was also visible (especially in
long stored RBC samples) at 16�173 m/z, corresponding to the +305 Da glutathionylated adduct of the
Hb beta chain, in agreement with [Bursell et al., 2000].
Chapter 2
50
4 CONCLUSION
Although recent evidences suggest that storage duration ends up influencing HbA1c
measurements in transfused recipients only to a negligible extent [Spencer et al., 2011],
we hereby con- firm old literature data [Szelényi et al., 1983, Weinblatt et al., 1986]
through alternative, yet validated, MALDI-TOF mass-spectrometry-based approaches
that the relative quantities of glycated HbA1c increase over storage duration.
51
References
Burger P, Korsten H, De Korte D, et al.: An improved red blood cell additive solution
maintains 2,3-diphosphoglycerate and adenosine triphosphate levels by an enhancing
effect on phosphofructokinase activity during cold storage. Transfusion 2010; 50:2386–
2392.
Biroccio A, Urbani A, Massoud R, et al.: A quantitative method for the analysis of
glycated and glutathiony- lated hemoglobin by matrix-assisted laser desorption
ionization-time of flight mass spectrometry. Anal Biochem 2005; 336:279–288.
Bursell SE, King GL: The potential use of glutathionyl hemoglobin as a clinical marker
of oxidative stress. Clin Chem 2000; 46:145–146.
D’Alessandro A, D’Amici GM, Vaglio S, et al.: Time-course investigation of SAGM-
stored leukocyte-filtered red blood cell concentrates: from metabolism to proteomics.
Haematologica 2012; 97:107–115.
Zurbriggen K, Schmugge M, Schmid M, et al.: Analysis of minor hemoglobins by
matrix-assisted laser desorption/ionization time-of-flight mass spectrometry. Clin Chem
2005; 51:989–996.
Gevi F, D’Alessandro A, Rinalducci S, et al.: Alterations of red blood cell metabolome
during cold liquid storage of erythrocyte concentrates in CPD-SAGM. J Proteomics
2012; 76:168–180.
Spencer DH, Grossman BJ, Scott MG: Red cell transfusion decreases hemoglobin A1c
in patients with diabetes. Clin Chem 2011; 57:344–346.
Stevens VJ, Vlassara H, Abati A, et al.: Non enzymatic glycosylation of hemoglobin. J
Biol Chem 1977; 252:2998– 3002.
References
52
Szelényi JG, Földi J, Hollan SR: Enhanced nonenzymatic glycosylation of blood
proteins in stored blood. Transfusion 1983; 23:11–14.
Weinblatt ME, Kochen JA, Scimeca PG: Chronically transfused patients with increased
hemoglobin Alc secondary to donor blood. Ann Clin Lab Sci 1986; 16:34–37.

53
CHAPTER 3:
RED BLOOD CELL METABOLISM UNDER PROLONGED
ANAEROBIC STORAGE

Chapter 3
54
3.1 AIM OF THE STUDY
The main biological function of red blood cells (RBCs) is to deliver molecular oxygen
(O2) to tissues, a task that they fulfill through the allosteric regulation of hemoglobin
(Hb) [Monod et al., 1965]. Allosteric regulation is based upon the transition from a T-
state to a relaxed R-state and vice versa, the former displaying lower oxygen affinity
that results in oxygen release at the tissue level. The T state of Hb (deoxygenated Hb) is
stabilized by several factors, including low pH, high CO2 and organic phosphates,
including 2,3-diphosphoglycerate (DPG) and ATP [Jensen et al., 2004]. Accelerated
glucose consumption, leading to lactate accumulation through the Embden–Meyerhof
glycolytic pathway, fuels the generation of DPG and ATP to stabilize the system under
hypoxic conditions, [Murphy et al., 1960, Hamasaki,et al., 1970] in a Pasteur effect-like
phenomenon [Marshall et al., 1977]. However, despite a 26% increase in the glycolytic
rate upon deoxygenation of RBCs, Rapoport et al. reported that adenine nucleotides and
DPG remained constant, as they become increasingly bound to deoxy-Hb [Rapoprot et
al., 1966].
The oxygenation state of Hb and metabolism are further intertwined, through the
indirect modulation of glycolytic enzyme activities via competitive binding to the
cytoplasmic domain of band 3 (CDB3) [Low et al., 1986, Chu et al., 2008]. Indeed,
deoxy-Hb displays a higher affinity for the CDB3 than does oxy-Hb [Walder et al.,
1984, Che´trite and Cassoly et al., 1985]. The CDB3 is a membrane docking site for
several enzymes of the glycolytic pathway, such as phosphofructokinase (PFK),
aldolase, glyceraldehyde- 3-phosphate dehydrogenase (GAPDH) and lactate
dehydrogenase (LDH) [Low et al., 1986, Chu et al., 2008]. When bound to the CDB3
these enzymes are inhibited, while their displacement from the membrane in
consequence to the binding of deoxy-Hb to the CDB3 results in their activities being
restored and thus, in metabolic modulation [Lewis et al., 2009]. Several models have
been proposed over the years, out of which the most widely accepted one is the one
described in detail by Low’s [Low et al., 1986, Chu et al., 2008, Lewis, et al., 2009] and
Giardina’s [Castagnola et al., 2010, Messana et al., 1996, Galtieri et al., 2002] groups,
both stressing the role of oxygenlinked modulation of erythrocyte metabolism. More
recently, a role for the phosphorylation state of the tyrosine residues of the band 3

Chapter 3
55
protein at positions 8 and 21 in modulating the binding of glycolytic enzymes and
deoxy-Hb to the CDB3 has been indicated [Lewis et al., 2009]. Phosphorylation to these
residues results in an increased (+45%) glycolytic flux and reduced shift towards the
pentose phosphate pathway (PPP) (-66%) than in oxygenated RBCs [Lewis et al.,
2009]. The underlying mechanism seems to involve the phosphorylation-dependent
increase in the number of negative charges at the N-terminal domain of band 3, which
greatly enhances Hb binding to band 3 and thus the displacement of glycolytic enzymes
[Lewis et al., 2009]. Notably, deoxygenation seems to promote phosphorylation of the
CDB3 [Siciliano et al., 2005]. Over the years, several groups have contributed
substantial efforts to the continuous improvement of existing mathematical and in silico
models of RBC metabolism [Moses et al., 1972, Wiback and Palsson, 2002, Jamshidi, et
al., 2001, Mulquiney, et al., 1999, Holzhutter, et al., 1985, Schauer, et al., 1981,
Ataullakhanov et al., 1981, Heinrich, et al., 1977, Werner and Heinrich, 1985,
Nakayama et al., 2005] towards the achievement of a Systems Biology understanding of
RBC metabolic complexity[Jamshidi and Palsson, 2006]. In this view, Kinoshita and
colleagues recently investigated the role of allostery in hypoxia-induced immediate
metabolic alterations (within a 3 minutes framework upon deoxygenation) in RBCs
through in silico prediction models (E-Cell 3 simulation environment) and experimental
testing by means of capillary electrophoresis coupled with mass spectrometry (MS)
[Kinoshita et al., 2007].
Over the last few decades, several groups have monitored RBC metabolic fluxes under
control (aerobic) conditions during a prolonged time span, while exploiting international
guidelines for optimized RBC concentrate storage conditions as a model [Messana et
al., 1999, Bennett-Guerrero et al., 2007, Messana et al., 2000, Gevi et al., 2012, Nishino
et al., 2009]. From these studies it emerged that, under control storage conditions
(storage in the presence of additive solutions such as SAGM [Gevi et al., 2012] and
PAGGM, [Nishino et al., 2009] under refrigeration at 1–6 °C for up to 42 days) RBCs
face a rapid fall of the glycolytic rate and undergo an accumulation of glycolysis end
products. A shift was observed towards the oxidative phase of PPP, [Gevi et al., 2012]
in response to an exacerbation of oxidative stress (altered glutathione homeostasis,
accumulation of ROS, protein carbonylations, malondialdehyde and
peroxidation/inflammatory products in the supernatants) [Gevi et al., 2012,

Chapter 3
56
D’Alessandro et al., 2012]. Indeed, it is now widely accepted that long stored RBCs
under blood bank conditions suffer from oxidative stress-triggered ‘‘storage lesions’’, a
series of either reversible or irreversible modifications to RBC morphology and
biochemistry (both at the proteomic and metabolic level) [D’Alessandro et al., 2012,
D’Amici et al., 2007]. Within this framework, in the transfusion milieu alternative
storage strategies for RBC concentrates have been pursued with the goal to improve
RBC quality and viability, and to extend the shelf life of erythrocyte concentrates up to
63 days, a goal that might be achieved through deoxygenation of RBC units [Dumont,
et al., 2009, Yoshida and Shevkoplyas, 2010, Yoshida et al., 2007]. While these
alternative storage strategies are currently under clinical testing [Yoshida and
Shevkoplyas, 2010], it is yet to be assessed whether the observed alterations of the
metabolic fluxes in RBCs upon deoxygenation are persistent throughout a 42 days
storage period. Indeed only preliminary, albeit significant, information has been
gathered by comparing a handful of metabolic parameters over a 42 days anaerobic
storage period, including glucose consumption, glyceraldehyde 3-phosphate
accumulation (via glycolysis or PPP) under high versus low oxygen saturated
hemoglobin conditions,14 ATP and 2,3-DPG [Scalbert et al., 2009], and lactate
[Galtieri et al., 2002, Scalbert et al., 2009]. Taking advantage of recent technical
improvements in the field of metabolomics [Scalbert et al., 2009], we hereby
investigated the RBC metabolome of deoxygenated RBC units by means of a novel high
performance liquid chromatography (HPLC)-micro-time of flight-quadrupole (micro-
TOF-Q) mass spectrometry (MS) approach, a workflow that recently contributed
precious insights into the understanding of RBC metabolism under control blood
banking conditions [Gevi et al., 2012], or in pathological RBCs (e.g. hereditary
stomatocytosis, sickle cell disease) [Darghouth et al., 2011, Darghouth et al., 2011,
Darghouth et al., 2011].
3.2. DESIGN AND METHOD
3.2.1 Sample collection
Red blood cell units were drawn from healthy donor volunteers according to the policy
of the Italian National Blood Centre guidelines (Blood Transfusion Service for donated
blood) and upon informed consent in accordance with the declaration of Helsinki. We

Chapter 3
57
studied RBC units collected from 10 healthy donor volunteers [male = 5, female = 5,
age 39.4 ± 7.5 (mean ± S.D.)]. RBC units were stored for up to 42 days under standard
conditions (CDP-SAGM, [D’Alessandro et al., 2011]), while samples were removed
aseptically for the analysis on a weekly basis (at 0, 7, 14, 21, 28, 35 and 42 days of
storage). Deoxygenation of erythrocyte concentrate units was achieved through 5
repeated gas exchange cycles consisting of bubbling high purity helium (Sol S.p.A. –
Pomezia, Italy) under gentle agitation every 10 minutes at room temperature for 50
minutes, while maintaining sterile conditions, as previously reported [D’Amici et al.,
2007]. Control counterparts were maintained under the same room temperature
conditions in order to exclude any other bias to RBC metabolism than deoxygenation
itself. Deoxygenated units were stored under a helium gas atmosphere under standard
conditions (4 °C). Deoxygenation was confirmed through spectrophotometric assays in
the range between 500 and 650 nm.
3.2.2 Materials
Acetonitrile, formic acid, and HPLC-grade water were purchased from Sigma Aldrich
(Milan, Italy). Standards (equal or greater than 98% chemical purity) ATP, L -lactic
acid, phosphogluconic acid, NADH, ᴅ-fructose 1,6-biphosphate, ᴅ-fructose 6-
phosphate, glyceraldehyde phosphate, phosphoenolpyruvic acid, L-malic acid, L-
glutamic acid, oxidized glutathione, and α-ketoglutarate were purchased from Sigma
Aldrich (Milan). Standards were stored either at -25°C, 4°C or room temperature,
following manufacturer’s instructions. Each standard compound was weighted and
dissolved in nanopure water. Starting at a concentration of 1 mg mL-1
of the original
standard solution, a dilution series of steps (in 18 MΩ, 5% formic acid) was performed
for each standard in order to reach the determined linearity range for relative
quantitation using peak areas.
3.3 UNTARGETED METABOLOMICS ANALYSES
3.3.1 Metabolite extraction
For each sample, 0.5 mL from the pooled erythrocyte stock was transferred into a
microcentrifuge tube (Eppendorfs, Germany). Erythrocyte samples were then
centrifuged at 1000g for 2 minutes at 4°C. Tubes were then placed on ice while

Chapter 3
58
supernatants were carefully aspirated, paying attention not to remove any erythrocyte at
the interface. Samples were extracted following the protocol by D’Alessandro et al.42
The erythrocytes were resuspended in 0.15 mL of ice cold ultra-pure water (18 MΩ) to
lyse cells, then the tubes were plunged into a water bath at 37°C for 0.5 min. Samples
were mixed with 0.6 mL of -20°C methanol and then with 0.45 mL chloroform.
Subsequently, 0.15 mL of ice cold ultra-pure water were added to each tube and they
were transferred to a -20 °C freezer for 2–8 h. An equivalent volume of acetonitrile was
added to the tube and transferred to a refrigerator (4°C) for 20 min. Samples with
precipitated proteins were thus centrifuged at 10 000 x g for 10 min at 4°C. Finally,
samples were dried in a rotational vacuum concentrator (RVC 2–18 – Christ Gmbh;
Osterode am Harz, Germany) and re-suspended in 200 µl of water, 5% formic acid and
transferred to glass auto-sampler vials for LC/MS analysis.
3.3.2 Rapid resolution reversed-phase HPLC
An Ultimate 3000 Rapid Resolution HPLC system (LC Packings, DIONEX, Sunnyvale,
USA) was used to perform metabolite separation. The system featured a binary pump
and a vacuum degasser, a well-plate autosampler with a six-port micro-switching valve,
a thermostated column compartment. Samples were loaded onto a Reprosil C18 column
(2.0 mm x 150 mm, 2.5 µm – Dr Maisch, Germany) for metabolite separation.
Chromatographic separations were achieved at a column temperature of 30°C; and a
flow rate of 0.2 mL min-1
. For downstream negative ion mode (-) MS analyses, a 0–
100% linear gradient of solvent A (10 mM tributylamine aqueous solution adjusted with
15 mM acetic acid, pH 4.95) to B (methanol mixed with 10 mM TBA and with 15 mM
acetic acid, pH 4.95) was employed over 30 min, returning to 100% A in 2 minutes and
a 6 min post-time solvent A hold. For downstream positive ion mode (+) MS analyses, a
0–100% linear gradient of solvent A (ddH2O, 0.1% formic acid) to B (acetonitrile, 0.1%
formic acid) was employed over 30 min, returning to 100% A in 2 minutes and a 6 min
post-time solvent A hold.
3.3.3 Mass spectrometry: Q-TOF settings
Due to the use of linear ion counting for direct comparisons against naturally expected
isotopic ratios, time-of-flight instruments are most often the best choice for molecular

Chapter 3
59
formula determination. Thus, mass spectrometry analysis was carried out on an
electrospray hybrid quadrupole time-of flight mass spectrometer MicroTOF-Q (Bruker-
Daltonik, Bremen, Germany) equipped with an ESI-Ion source. Mass spectra for
metabolite extracted samples were acquired both in positive and in negative ion mode.
ESI capillary voltage was set at 4500 V (+) (-) ion mode. The liquid nebulizer was set to
27 psi and the nitrogen drying gas was set to a flow rate of 6 L min-1
. The dry gas
temperature was maintained at 200 1C. Data were stored in centroid mode. Data were
acquired with a stored mass range of m/z 50–1200. Automatic isolation and
fragmentation (AutoMSn mode) was performed on the 4 most intense ions
simultaneously throughout the whole scanning period (30 min per run). Calibration of
the mass analyzer is essential in order to maintain a high level of mass accuracy.
Instrument calibration was performed externally every day with a sodium formate
solution consisting of 10 mM sodium hydroxide in 50% isopropanol : water, 0.1%
formic acid. Automated internal mass scale calibration was performed through direct
automated injection of the calibration solution at the beginning and at the end of each
run by a 6-port divert-valve.
3.3.4 Data elaboration and statistical analysis
In order to reduce the number of possible hits in molecular formula generation, we
exploited the SmartFormula3D TM software (Bruker Daltonics, Bremen, Germany),
which directly calculates molecular formulae based upon the MS spectrum (isotopic
patterns) and transition fingerprints (fragmentation patterns). This software generates a
confidence-based list of chemical formulae on the basis of the precursor ions and all
fragment ions, and the significance of their deviations to the predicted intact mass and
fragmentation pattern (within a predefined window range of 5 ppm). Triplicate runs for
each one of the 10 biological replicates over storage duration were exported as mzXML
files and processed through XCMS data analysis software (Scripps Centre for
Metabolomics)43 and MAVEN.44 Mass spectrometry chromatograms were elaborated
for peak alignment, matching and comparison of parent and fragment ions, and tentative
metabolite identification (within a 20 ppm mass-deviation range between observed and
expected results against the internal database – METLIN45). XCMS and MAVEN are
open-source software that could be freely downloaded from their websites

Chapter 3
60
(http://metlin.scripps.edu/down load/ and http://genomics
pubs.princeton.edu/mzroll/index. php?show=download). Metabolite assignment was
further elaborated in the light of the hydrophobicity/hydrophilicity of the compound and
its relative retention time in the RP-HPLC run. Relative quantitative variations of intact
mass peak areas for each metabolite assigned through MS/MS were determined against
day 0 controls and only statistically significant results were considered (ANOVA p-
values o 0.01). Data were further refined and plotted with GraphPad Prism 5.0
(GraphPad Software Inc.).
3.4 RESULTS AND DISCUSSION
HPLC-MS runs were performed in triplicate on samples extracted from each donated
unit at 0, 7, 14, 21, 28, 35, 42 days of storage.
In order to report the main results in a more readable layout, metabolites accounting for
the most relevant catabolic pathways in RBCs were grouped and plotted as follows:
metabolites involved in (i) glycolysis (Fig. 1), (ii) adenosine energy metabolism (Fig.
2), (iii) pentose phosphate pathway (PPP) and glutathione homeostasis (Fig. 3), (iv)
purine salvage pathway (PSP – Fig. 4), (v) aminoacid transport and fatty acid/lipid
metabolism (Fig. 5).
3.4.1 Glycolysis and energy metabolism are sustained throughout anaerobic
storage duration
Under control storage conditions, prolonged glycolysis and lactate accumulation result
in pH drop and, in turn, this triggers a negative feedback on the glycolysis rate itself.
Indeed, glycolytic enzymes (for example the rate limiting enzyme phosphofructokinase)
are inhibited by (i) low pH [Burger et al., 2010]; (ii) high concentrations of high energy
phosphate compounds, such as ATP and DPG; (iii) selective binding to the CDB3
[Weber et al., 2004]. All these events are known to occur within the framework of RBC
storage [D’Alessandro et al., 2010]. The rapid fall of glycolysis over storage duration
has recently been detailed by Nishino and collegues for PAGGM-stored RBCs and our
group (SAGM-stored RBCs) [Gevi et al., 2012, D’Alessandro et al., 2012]. In
deoxygenated RBC units, it is to be expected that these phenomena are mitigated to
some extent, owing to the following reasons: (i) Hb is forced in the T-state (deoxy-Hb);

Chapter 3
61
(ii) free H+ ions are bound to deoxy-Hb as a result of the Bohr effect [Jensen, 2004];
(iii) high energy phosphates (mainly 2,3- DPG) are sequestered by deoxy-Hb at a near
1:1 stoichiometric ratio [Jensen, 2004]; (iv) competitive binding of deoxy-Hbs to the
CDB3 dislocates and disinhibits glycolytic enzymes [Low et al., 1986, Gevi et al., 2012,
Lewis et al., 2009, Castagnola et al., 2010, Messana, et al., 1996, Galtieri, et al., 2002].
Consistent with these assumptions, in anaerobically-stored RBCs we could observe a
rapid increase in glucose consumption, that was paralleled by the accumulation of all
glycolytic intermediates, including: glucose/fructose 6-phosphate (these isobaric species
cannot be distinguished with MS, as previously reported [Gevi et al., 2012, Darghouth
et al., 2011]), fructose 1,6-diphosphate, dihydroxyacetone phosphate, glyceraldehyde 3-
phosphate, phosphoglycerate (though increasing significantly upon 35 days of anaerobic
storage), phosphoenolpyruvate and lactate (Fig. 1).
Figure 1-Time course metabolomic analyses of RBCs stored under anaerobiosis in SAGM additive
solution at 4 1C up to 42 days. Results are plotted on a weekly basis (storage day 0, 7, 14, 21, 28, 35, 42)
as in ref. 31, as fold-change variations upon normalization against day 0 controls. An overview of the
trends for glycolytic metabolites. Averages and standard deviations were calculated on 10 biological
replicates, each one assayed in triplicate runs at each storage day.

Chapter 3
62
At the end of the anaerobic storage lactate increased by 24.55 ± 3.17-fold in comparison
to day 0 controls, which is consistent with previous reports by Yoshida’s group
[Yoshida and Shevkoplyas, 2010, Yoshida et al., 2007] and it is higher in comparison to
our previous metabolomics investigation of RBCs stored under control (aerobic
conditions) at the end of the storage period (42 days lactate being 20.48 ± 0.31 [Gevi et
al., 2012]). Our results are in agreement with these observations (Fig. 1).
The glycolysis rate drops under control (aerobic) storage conditions, which results in
ATP concentrations reaching a climax at 10–20% above the starting level within the
first two to three weeks of storage, while they rapidly decline soon afterwards [Gevi et
al., 2012, Yoshida and Shevkoplyas, 2010, Yoshida et al., 2007]. This is biologically
relevant if we consider that the fall of ATP levels and of the total adenylate content
(ATP + ADP + AMP) is associated with poor in vivo survival [Hogman et al., 1985],
since the energy-less RBC is rapidly removed from the bloodstream. 50 While these
considerations hold true for aerobic RBC storage, under anaerobic conditions, Yoshida
and colleagues reported that ATP peaks at higher levels (50–70% above the initial
concentration), and this phase of ATP boost is sustained for a longer period (5–7 weeks)
(though their observations also depended on the additive solutions used as a medium for
RBC storage) [Dumont et al., 2009, Yoshida and Shevkoplyas, 2010, Yoshida et al.,
2007]. Our results (Fig. 2) are consistent with these observations. It should also be noted
that erythrocytes tend to release ATP as a vasodilator molecule in response to hypoxia
[Dietrich et al., 2000], and ADP negatively regulates this process by acting on P2Y13
receptors of human RBCs [Wang et al., 2005]. In the present study, we could observe
that ADP levels decreased over storage duration, while AMP levels suffered from
oscillations as they underwent both an early and late increase within the first and the last
two weeks of storage (Fig. 2). On the other hand, cAMP levels increased throughout
anaerobic storage duration, reaching an intermediate peak by day 21 and apexing by day
42 of anaerobic storage (Fig. 2). The increase in cAMP over storage duration is
consistent with an ATP decrease despite sustained glycolysis in the long term, since
cAMP accumulation under hypoxic conditions might trigger ATP release through
signalling cascades involving cAMP-dependent protein kinase (PKA) and downstream
activated pathways, such as the ones leading to mechanical deformation mediated by the
activity of the cystic fibrosis transmembrane conductance regulator (CFTR) [Sprague et

Chapter 3
63
al., 2001]. No significant shift towards the pentose phosphate pathway (PPP) despite
moderate oxidative stress PPP accounts only for approximately 8% of glucose
metabolism in RBCs under normal steady-state conditions, since 92% of glucose is
metabolized through glycolysis (Embden–Meyerhof).
Figure 2-An overview of the trends for adenosine energy metabolism and related metabolites in time
course analyses of RBC anaerobic storage on a weekly basis. Results are plotted as fold-change variations
upon normalization to day 0 controls.
When faced with oxidative stress, RBCs respond to diverting as much as 90% of
glucose metabolism toward the PPP [Messana et al., 1999, Misiti et al., 2002]. The
rationale behind this phenomenon is in part explained by Rogers and colleagues, who
envisage a role for the oxygen dependent modulation of glycolytic enzyme activity via
competitive binding to the CDB3 and their availability to compete for glucose
substrates with the PPP enzymes [Rogers et al., 2009]. Approximately 60% of the total
NADPH production in humans relies on the PPP, as obtained through reduction of
NADP+. This reaction is coupled to the formation of 6-phosphogluconolactone from
glucose 6-phosphate and ribulose 5-phosphate from 6-phosphogluconate. The utter end-
product of the oxidative phase is represented by ribulose 5-phosphate, that can further
react with non-oxidative phase intermediates (carbon chain molecules ranging from 3 to
7 carbon atoms) and re-enter glycolysis at the glyceraldehyde 3-phosphate level, and/or

Chapter 3
64
rather be recycled as fructose 6-phosphate, as an early glycolytic precursor. Since
NADPH is needed to reduce the disulfide form of glutathione (GSSG) to the sulfhydryl
form (GSH), an oxidative stress modulated increase in the PPP rate is to be considered a
natural self-defensive mechanism of erythrocytes to cope with oxidative injury, as also
deducible from widespread hereditary anomalies to rate limiting enzymes of this
pathways [Efferth et al., 2004, Fico et al., 2004]. In 1999, Dumaswala et al.
demonstrated that GSH and glutathione peroxidase provide the primary antioxidant
defense in stored RBCs, and their decline, concurrent with an increase in oxidative
modifications of membrane lipids and proteins, is tied to the destabilization of the
membrane skeleton and thus to a compromised RBC survival [Dumaswala et al., 1999].
Indeed, GSH is pertinent for maintaining the normal structure of RBCs and for keeping
haemoglobin in the ferrous state [Fe(II)]. Recently, we observed that storage of RBC
under control aerobic conditions resulted in a metabolic diversion towards the oxidative
phase of the PPP in the short term (after the second week of storage), while metabolic
end-products of the nonoxidative phase of the PPP appeared to serve as substrates for
PSP reactions, rather than for massively re-entering glycolysis [Gevi et al., 2012]. This
observation was consistent with an early increase in glyceraldehyde 3-phosphate
production via the PPP early upon exposure to high oxygen saturation conditions, while
differences with erythrocytes exposed to low oxygen saturation conditions were
attenuated in the long term [Messana et al., 1999]. In the present study, we observed no
evident increase in PPP oxidative phase intermediates, while isobaric species in the non-
oxidative phase of the PPP suffered from an early decline below control levels yet by
anaerobic storage day 7 (ribulose 5-phosphate, xylose 5-phosphate, ribose 5-phosphate,
ribose 1-phosphate – could not be distinguished through the current MS approaches, in
agreement with Kinoshita et al., 2007 and Gevi et al., 2012) (Fig. 3). The blockade of
the storage-dependent metabolic diversion towards the PPP is in line with the
observations by Rogers and colleagues about short term RBC exposure to hypoxia
[Rogers et al., 2009]. GSH is synthesized through a two step ATP-dependent process: in
the first and rate limiting step, the enzyme gammaglutamylcysteine synthetase exploits
the aminoacid substrates, glutamate and cysteine to generate gamma-glutamylcysteine;
in the second step, glycine is added by glutathione synthetase [Lu 2009]. The levels of

Chapter 3
65
glutamine (precursor to glutamate – oscillating trend) increased over anaerobic storage
(Fig. 3).
Figure 3-An overview of the trends for the pentose phosphate pathway and glutathione homeostasis
during time course analyses of RBC anaerobic storage on a weekly basis. Results are plotted as fold-
change variations upon normalization to day 0 controls.
Conversely, free cysteine decreased over anaerobic storage duration (Fig. 3). It is
interesting to note that HEK293 and Hep3B cells exposed to 1.5% O2 exhibit a time-
dependent decrease in cellular glutathione stores and concomitant inhibition of
glutathione biosynthesis, which correlates to impaired transport of the substrate cysteine
[Mansfield et al., 2004]. Also, anoxia impairs cysteine-dependent GSH biosynthesis
more than hypoxia in hepatocytes owing to lower ATP production via mitochondria
[Shan et al., 1989]. However, it is worthwhile to stress that, unlike hepatocytes, RBCs
do no longer have mitochondria. Therefore, oxygen removal appeared not to completely
eliminate oxidative stress, as suggested by the following observations: (i) the moderate
albeit constant decrease in GSH and (ii) increase in GSSG levels (Fig. 3); (iii) the
accumulation of inflammation/oxidative stress-related markers such as prostaglandin

Chapter 3
66
D2/E2 and thromboxane A2 [Ibe et al., 1987]; and (iv) the decrease in antioxidant
exogenous compounds such as catechins and epicatechins63 (data not shown). On the
other hand, the oxidative stress-marker prostaglandin F2a (8-isoprostane64) decreased
significantly over anaerobic storage duration (data not shown). First of all, it is to be
excluded that the observed phenomena are to be attributed to partial deoxygenation
(hypoxia instead of anoxia), since deoxy-Hb spectrophotometric spectra were assayed
and confirmed in the 500–650 nm range. Indeed, enhanced rates for the formation of
ROS and RNS occur under hypoxic conditions where an increased fraction of Hb is
bound to the RBC membrane [Rifkind and Nagababu, 2012]. Under normoxic RBC
storage conditions, Hb migration to the membrane fraction is accompanied by increased
membrane-bound levels of active peroxiredoxin 2 [Rinalducci et al., 2011], which binds
to the same membrane docking site (i.e. the CDB3 [Matte et al., 2012]) thereby
mitigating membrane targeting oxidative stress. However, peroxiredoxin 2 migration to
the membrane does not occur during storage under anaerobic conditions [Rinalducci et
al., 2011], which might imply that oxidative stress is not as much sustained as in
normoxic counter-parts as to activate certain anti-oxidant defensivemechanisms. It
should also be noted that, under hypoxic (not anaerobic) conditions, when Hb is
partially saturated with oxygen, the oxygen is constantly leaving one Hb molecule and
binding to another. Thus, intermediate oxygen pressures and hypoxic conditions in
RBCs favour the production of superoxide radicals from Hb-bound oxygen, owing to
enhanced heme pocket flexibility and higher interactions with distal histidine, which in
turn promotes the destabilization of the iron–oxygen bond and in the release of
superoxide radicals [Balagopalakrishna et al., 1996]. In this view, anaerobic storage
strategies failing to achieve complete Hb deoxygenation should take this phenomenon
into serious account. A rationale behind the incomplete elimination of oxidative stress
under anaerobic conditions might stem from considerations about the interplay of pro-
oxidant/anti-oxidant mechanisms in RBCs [Tsikas et al., 2012]. Tsikas and collegues
recently reported that GSH promoted the concomitant formation of the current oxidative
stress biomarkers malondialdehyde (MDA) and prostaglandins from arachidonic acid
via prostaglandin H synthases. On this ground, it emerges that uncommon interplay of
enzymatic and chemical reactions might yield species that are considered to be
exclusively produced by free-radical-catalysed reactions [Tsikas et al., 2012].

Chapter 3
67
3.4.2 Purine salvage pathway is activated proportionally to storage progression
even under anaerobic conditions
Since mature RBCs are incapable of de novo synthesizing 5-phosphoribosylamine, they
rely on salvage pathways to restore purine levels [Schuster and Kenanov, 2005].
Adenine and adenosine are transported through the erythrocyte membranes through the
facilitated diffusion [Hess, 2010]. They are the precursors of adenine nucleotides,
accounting for 70–80% of all free erythrocyte nucleotides [Schuster and Kenanov,
2005, Hess, 2010]. Anaerobic storage resulted in an increase in intracellular adenine
levels, while adenosine followed oscillating trends (despite being comparable to day 0
controls by 42 days of storage – Fig. 4). Hypoxanthine and inosine are two major
substrates for salvage reactions [Schuster and Kenanov, 2005, Zolla et al., 1972]. While
hypoxanthine levels oscillated throughout anaerobic storage, inosine levels increased
significantly, proportionally to anaerobic storage progression. Altered inosine levels in
particular might result from deamination of adenosine, which is known to occur under
control RBC storage conditions [Hess 2010]. Inosine formed in the adenosine
deaminase reaction or supplemented to RBC via storage solutions may enter the
erythrocyte and undergo phosphorolysis to form hypoxanthine and ribose 1-phosphate
(R1P) [Gabrio et al., 1956]. Through this reaction it is possible to introduce a
phosphorylated sugar (PPP non-oxidative phase intermediate) into the erythrocyte
without ATP consumption [Gabrio et al., 1956]. The use of inosine has received much
attention in the field of blood banking since it appears to be the only practical means to
obtain ATP production in the cell without first expending ATP to prepare an
unphosphorylated substrate for further metabolism [Gabrio et al., 1956]. Adenosine–
homocysteine, which serves as a substrate to produce adenosine and homocysteine,
accumulated in long anaerobically stored RBCs, while homocysteine decreased (Fig. 4).
Homocysteine is also a precursor to cysteine (also decreasing – Fig. 3) and thus has an
indirect role in GSH synthesis [Filip et al., 2012]. Anomalies to homocysteine fine-
tuning are known to be related to oxidative stress [Filip et al., 2012] and deficiency B-
group vitamins [Curtis et al., 1994]. However, no substantial alteration of vitamin intake
was observed (retinol – vitamin A, riboflavin – vitamin B2 – Data not shown).

Chapter 3
68
Figure 4-Purine salvage pathway main metabolites during RBC anaerobic storage on a weekly basis.
Results are plotted as fold-change variations upon normalization to day 0 controls.
3.4.3 Amino acid transport and lipid homeostasis are affected to some extent under
anaerobic storage
Though RBC metabolism has been hitherto supposed to be restricted to pathways
enlisted in the previous paragraphs (glycolysis, PPP, PSP, Rapoport–Luebering,
methemoglobin reduction pathway), recent advancements in the understanding of the
RBC proteome suggested that erythrocytes might also rely on yet undisclosed/uncha-
racterized pathways [D’Alessandro et al., 2010, Roux-Dalvai Gonzalez et al., 2008]. In
a recent report, Darghouth and collegues indicated that 30.4% of the RBC metabolome
(including 89 validated metabolites) was made up of free aminoacids. The capillary
distribution of RBCs through the cardiovascular system allows RBCs to intake
aminoacids from plasma, store and deliver them to those districts where they are needed

Chapter 3
69
the most. In this view, RBCs might represent active vessels in the inter-organ transport
[Elwyn et al., 1972].
Figure 5-A glance at amino acid transport and fatty acid metabolism in anaerobically stored RBCs.
Results are plotted as fold-change variations upon normalization to day 0 controls.
Owing to the lack of nuclei and ribosomes, RBCs are devoid of any protein synthesis
capacity. Nonetheless, numerous aminoacid transport systems have been found in
human RBCs in analogy to other cell types, and anomalies to these RBC aminoacid

Chapter 3
70
transport systems have been related to several diseases, including chronic renal failure
[Divino Filho et al., 1997, Canepa et al., 2002]. Free arginine levels increased over
anaerobic storage, while ornithine decreased (Fig. 5). While arginase-mediated
conversion of arginine to ornithine and urea mainly occurs in liver, arginase is also
present in RBCs [Kim et al., 2002]. In circulating RBCs, arginine could be imported
from plasma to RBCs through the y+ system [Tunnicliff, 1994], or might be produced
in RBCs from aspartate as demonstrated in analogy to other cell types [Kanehisa and
Goto, 2000]. Arginine might be produced from citrulline and argino-succinate, while
the metabolic pathway might shift back to citrulline via nitric oxide synthase (which is
present and functionally active in RBCs [Kleinbongard et al., 2006]), resulting in the
production of NO. This is particularly relevant in the frame of deoxygenated districts,
where deoxy-Hb binds to NO• thus functioning as a transporter and/or reduces nitrite to
generate NO• promoting vasodilation [Filip et al., 2012]. Consistently, while argino-
succinate decreased in a similar fashion to ornithine, anaerobic storage promoted the
accumulation of both arginine and citrulline (Fig. 5). These results might contribute to
justify the observation about oxidative stress in long stored deoxygenated RBC units.
Phosphoglycerate dehydrogenase, a key enzyme in serine metabolism [Locasale et al.,
2011], has been reported in the most recently updated report about the RBC proteome
[D’Alessandro et al., 2010]. L-Serine decreased yet upon 7 days of anaerobic storage,
while its concentrations remained apparently unaltered thereon (Fig. 5). Tryptophan
transport in RBCs has been investigated during the last three decades [Rosenberg et al.,
1980], owing to its implications in the pathogenesis of depressive disorders
[Jeanningros et al., 1996]. Tryptophan uptake increased in the time window range
between 21 and 35 days of storage, though at the end of the storage intracellular
tryptophan levels were comparable to those in day controls (Fig. 5). While mature
RBCs are incapable of synthesizing lipids anew [Percy et al., 1973], alterations to lipid
homeostasis are strictly tied to membrane blebbing leading to vesiculation and eryptosis
[Lang et al., 2012], a phenomenon that is known to be exacerbated by ceramides.
Ceramide may be produced from cell membrane sphingomyelin by a sphingomyelinase
[Dinkla et al., 2012]. At the end of the anaerobic storage we could find that, in
comparison to day 0 controls, day 42 RBCs displayed higher levels of sphingomyelins
and ceramides, other than sphingosines (SM(d18:1/0:0); CerP(d18:1/ 24:0); C-2

Chapter 3
71
ceramide; C-8 ceramide-1-phosphate; C-8; CerP(d18:1/ 12:0); ceramine; D-erythro-
sphingosine C-15; glucosylsphingosine; phytosphingosine; sphinganine – Data not
shown, analogously to day 42 (aerobically stored) control RBCs [Gevi et al., 2012].
Carnitine plays a buffer function in mediating the role of acyl-L-carnitine as a reservoir
of activated acyl groups in mature human erythrocytes [Arduini et al., 1992]. This might
relate to the increased concentrations of cholines in longer (anaerobically) stored RBCs
(such as glycerophosphocholine – PC(O-18:1(10E)/2:0); PC(O-18:1(11Z)/0:0); PC(P-
18:0/0:0); PC(O-16:0/6:0); PC(10:0/4:0) – ), analogously to RBCs stored under
normoxic blood banking conditions [Gevi et al., 2012]. Increased concentrations of
cholines (especially in the intermediate storage period within 14 and 28 days of
anaerobic storage – Fig. 5) have already been reported in sickle RBCs, where they have
been linked to recycling of phospholipids as to indirectly document the RBC membrane
fragility observed in sickle cell disease patients [Darghouth et al., 2011].
3.5 CONCLUSION
MS-based metabolomics is a promising research endeavor that is gradually
complementing decades of accurate biochemical observations with targeted approaches
and NMR [Nicholson and Lindon, 2008, D’Alessandro and Zolla, 2012, Wishart et al.,
2009]. In the present study, the application of novel MS-based metabolomics
approaches to the issue of RBC exposure to prolonged anaerobiosis has further shed
light on the oxygen-dependent metabolic modulation in RBCs. Long term exposure of
RBCs to anaerobic conditions resulted in the exacerbation of all those phenomena
observed in the short term [Kinoshita et al., 2007]. We hereby confirmed previous
evidence about long term anaerobiosis promoting glycolytic metabolism in RBCs and
prolonging the conservation of high energy phosphate reservoirs and purine
homeostasis [Dumont et al., 2009, Yoshida and Shevkoplyas, 2010, Yoshida et al.,
2007]. ATP decrease despite glycolysis being sustained throughout the whole anaerobic
storage duration (glycolytic intermediates and lactate accumulate constantly until
storage day 42) might not only reflect ATP and DPG sequestering by deoxy-Hb, which
should occur early upon deoxygenation, but it might rather reflect cAMP-mediated ATP
release by RBCs in response to deoxygenation, a phenomenon that occurs in vivo to
promote vasodilation in hypoxic districts [Dietrich et al., 2000]. In parallel, we

Chapter 3
72
evidenced that, in contrast to aerobic storage [Gevi et al., 2012], anaerobiosis impairs
RBC capacity to cope with oxidative stress by blocking metabolic diversion towards the
PPP, which negatively affects glutathione homeostasis. Therefore, although oxidative
stress is less sustained than in aerobically stored RBCs [Gevi et al., 2012], oxidative
stress markers still accumulate over anaerobic storage progression, though to a lesser
extent. In this view, it should be pointed out that, in the present study, anaerobiosis has
been reached in SAGM-stored RBCs (pH22°C 5.7), while higher pH additive solutions
should in part counteract the PPP blockade by increasing glucose 6-phosphate
dehydrogenase activity [Cohen and Rosemeyer, 1968]. Indeed, neutral or alkaline
storage solutions have already been proposed with encouraging results (higher DPG and
ATP levels at the end of the shelf-life, higher in vivo survival upon transfusion), both in
the frame of aerobic [Hess et al., 2002, Veale 2011 et al., 2011] and anaerobic storage
of RBCs [Dumont et al., 2009, Yoshida et al., 2008]. While metabolomics is one key
area of biological investigations, further clues about the effects of prolonged exposure
of RBCs to anaerobiosis will soon derive from the application of other omics
disciplines, above all proteomics, to this delicate topic.

73
References
Arduini A., Mancinelli G., Radatti G. L., S. Dottori S., Molajoni F. and Ramsay R. R.,
Role of carnitine and carnitine palmitoyltransferase as integral components of the
pathway for membrane phospholipid fatty acid turnover in intact human erythrocytes. J.
Biol. Chem., 1992, 267, 12673–12681.
Ataullakhanov F. I., Vitvitsky V. M., Zhabotinsky A. M., Pichugin A. V., Platonova O.
V., Kholodenko B. N. and Ehrlich L. I., The regulation of glycolysis in human
erythrocytes. The dependence of the glycolytic flux on the ATP concentration. Eur. J.
Biochem., 1981, 115, 359–365.
Balagopalakrishna C., Manoharan P. T., Abugo O. O. and Rifkind J. M., Production of
superoxide from hemoglobinbound oxygen under hypoxic conditions. Biochemistry,
1996, 35(20), 6393–6398.
Bennett-Guerrero E., Veldman T. H., Doctor A., Telen M. J., Ortel T. L. and Reid T. S.,
et al., Evolution of adverse changes in stored RBCs. Proc. Natl. Acad. Sci. U. S. A.,
2007, 104, 17063–17068.
Burger P., Korsten H., De Korte D., Rombout E., Van Bruggen R. and Verhoeven A. J.,
An improved red blood cell additive solution maintains 2,3-diphosphoglycerate and
adenosine triphosphate levels by an enhancing effect on phosphofructokinase activity
during cold storage. Transfusion, 2010, 50(11), 2386–2392.
Canepa A., Filho J. C., Gutierrez A., Carrea A., Forsberg A. M., Nilsson E., Verrina E.,
Perfumo F. and Bergström J., Free amino acids in plasma, red blood cells,
polymorphonuclear leukocytes, and muscle in normal and uraemic children. Nephrol.,
Dial., Transplant., 2002, 17, 413–421.
Castagnola M., Messana I., Sanna M. T. and Giardina B., Oxygen-linked modulation of
erythrocyte metabolism: state of the art. J. Blood Transfus., 2010, 8(suppl. 3), 53–58.

References
74
Che´trite G. and Cassoly R. Affinity of hemoglobin for the cytoplasmic fragment of
human erythrocyte membrane band 3. Equilibrium measurements at physiological pH
using matrix-bound proteins: the effects of ionic strength, deoxygenation and of 2,3-
diphosphoglycerate. J. Mol. Biol., 1985, 185, 639–644.
Chu H., Breite A., Ciraolo P. and Franco R. Low, Characterization of the
deoxyhemoglobin binding site on human erythrocyte band 3: implications for O2
regulation of erythrocyte properties. Blood, 2008, 111, 932–938.
Cohen P. and Rosemeyer M. A., Human glucose 6-phosphate dehydrogenase:
purification of the erythrocyte enzyme and the influence of ions in its activity. Eur. J.
Biochem., 1968, 8, 1–7.
Curtis D., Sparrow R., Brennan L. and Van der Weyden M. B., Elevated serum
homocysteine as a predictor for vitamin B12 or folate deficiency. Eur. J. Haematol.,
1994, 52, 227–232.
D’Alessandro A. and Zolla L., Metabolomics and cancer drug discovery: let the cells
do the talking. Drug Discovery Today, 2012, 7, 3–9.
D’Alessandro A. and Zolla L., We are what we eat: food safety and proteomics. J.
Proteome Res., 2012, 11(1), 26–36.
D’Alessandro A., D’Amici G. M., Vaglio S. and Zolla L., Time-course Investigation of
SAGM-Stored Erythrocyte Concentrates: from Metabolism to Proteomics.
Hematologica, 2012, 97, 107–115.
D’Alessandro A., Gevi F. and Zolla L., A robust high resolution reversed-phase HPLC
strategy to investigate various metabolic species in different biological models. Mol
BioSyst., 2011, 7, 1024–1032.

References
75
D’Alessandro A., Liumbruno G., Grazzini G. and Zolla L., Red blood cell storage: the
story so far. J. Blood Transfus., 2010, 8, 82–88.
D’Alessandro A., Righetti P. G. and Zolla L., The red blood cell proteome and
interactome: an update. J. Proteome Res., 2010, 9, 144–163.
D’Amici G. M., Rinalducci S. and Zolla L., Proteomic analysis of RBCmembrane
protein degradation during blood storage. J. Proteome Res., 2007, 6, 3242–3255.
Darghouth D., Koehl B., Heilier J. F., Madalinski G., Bovee P. and Bosman G.,
Alterations of red blood cell metabolome in overhydrated hereditary stomatocytosis.
Haematologica, 2011, 96, 1861–1865.
Darghouth D., Koehl B., Junot C. and Rome´o P. H., Metabolomic analysis of normal
and sickle cell erythrocytes. Transfus. Clin. Biol., 2010, 17, 148–150.
Darghouth D., Koehl B., Madalinski G., Heilier J. F., Bovee P. and Xu Y.,
Pathophysiology of sickle cell disease is mirrored by the red blood cell metabolome.
Blood, 2011, 117, 57–66.
Dietrich H. H., Ellsworth M. L., Sprague R. S. and Dacey R. G., Red blood cell
regulation of microvascular tone through adenosine triphosphate. Am. J. Physiol.:
Heart Circ. Physiol., 2000, 278, H1294–H1298.
Dinkla S., Wessels K., Verdurmen W. P., Tomelleri C., Cluitmans J. C., Fransen J.,
Fuchs B., Schiller J., Joosten I., Brock R. and Bosman G. J., Functional consequences
of sphingomyelinase-induced changes in erythrocyte membrane structure. Cell Death
Dis., 2012, 3, 410.
Divino Filho J. C., Barany P., Stehle P., Fu¨rst P. and Bergstro¨m J., Free amino-acid
levels simultaneously collected in plasma, muscle and erythrocytes of uraemic patients.
Nephrol., Dial., Transplant., 1997, 12, 2339–2348.

References
76
Dumaswala U. J., Zhuo L. and Jacobsen D. W., et al., Protein and lipid oxidation of
banked human erythrocytes: role of glutathione. Free Radical Biol. Med., 1999, 27,
1041–1049.
Dumont L. J., Yoshida T. and AuBuchon J. P., Anaerobic storage of red blood cells in a
novel additive solution improves in vivo recovery. Transfusion, 2009, 49, 458–464.
Efferth T., Bachli E. B., Schwarzl S. M., Goede J. S., West C., Smith J. C. and Beutler
E., Glucose-6-phosphate dehydrogenase (G6PD) deficiency-type Zurich: a splice site
mutation as an uncommon mechanism producing enzyme deficiency. Blood, 2004, 104,
2608.
Elwyn D. H., Launder W. J., Parikh H. C. and Wis E. M., Roles of plasma and
erythrocytes in interorgan transport of amino acids in dogs. Am. J. Physiol., 1972, 222,
1333–1342.
Fico A., Paglialunga F., Cigliano L., Abrescia P., Verde P., Martini G., Iaccarino I. and
Filosa S., Glucose-6-phosphate dehydrogenase plays a crucial role in protection from
redox-stress-induced apoptosis. Cell Death Differ., 2004, 11, 823–831.
Filip C., Zamosteanu N. and Albu E., Homocysteine in red blood cell metabolism –
pharmacological approaches, in Blood Cell – An overview of Studies in Hematology.
ed. Terry E. Moschandreou, 2012, ch. 3, ISBN 978-953-51-0753-8.
Gabrio B. W., Finch C. A. and Huennekens F. M., Erythrocyte preservation: a topic in
molecular biochemistry. Blood, 1956, 11, 103.
Galtieri A., Tellone E., Romano L., Misiti F., Bellocco E., Ficarra S., Russo A., Di Rosa
D., Castagnola M., Giardina B. and Messana I., Band-3 protein function in human
erythrocytes: effect of oxygenation-deoxygenation. Biochim. Biophys. Acta, 2002,
1564(1), 214–218.

References
77
Gevi F., D’Alessandro A., Rinalducci S. and Zolla L., Alterations of red blood cell
metabolome during cold liquid storage of erythrocyte concentrates in CPD-SAGM. J.
Proteomics, 2012, 76, 10–27.
Hamasaki N., Asakura T. and Minakami S., Effect of oxygen tension on glycolysis in
human erythrocytes. J. Biochem., 1970, 68(2), 157–161.
Heinrich R., Rapoport S. M. and Rapoport T. A., Metabolic regulation and
mathematical models. Prog. Biophys. Mol. Biol., 1977, 32, 1–82.
Hess J. R., Hill H. R., Oliver C. K., Lippert L. E. and Greenwalt T. J., Alkaline CPD
and the preservation of RBC 2,3-DPG. Transfusion, 2002, 42, 747–752.
Hess J. R., Red cell changes during storage. Transfus. Apher. Sci., 2010, 43, 51–59.
Hogman C. F., de Verdier C. H. and Ericson A., et al., Studies on the mechanism of
human red cell loss of viability during storage at +4 degrees C in vitro. I. Cell shape
and total adenylate concentration as determinant factors for post transfusion survival.
Vox Sang., 1985, 48, 257–268.
Holzhutter H. G., Jacobasch G. and Bisdorff A., Mathematical modelling of metabolic
pathways affected by an enzyme deficiency. A mathematical model of glycolysis in
normal and pyruvate-kinase-deficient red blood cells. Eur. J. Biochem., 1985, 149,
101–111.
Ibe B. O., Morris J., Kurantsin-Mills J. and Raj J. U., Sickle erythrocytes induce
prostacyclin and thromboxane synthesis by isolated perfused rat lungs. Am. J. Physiol.,
1997, 272, 597–602.
Jamshidi N. and Palsson B. Ø., Systems biology of the human red blood cell. Blood
Cells, Mol., Dis., 2006, 36, 239–247.
References
78
Jamshidi N., Edwards J. S., Fahland T., Church G. M. and Palsson B. O., Dynamic
simulation of the human red blood cell metabolic network. Bioinformatics, 2001, 17,
286–287.
Jeanningros R., Serres F., Dassa D., Azorin J. M. and Grignon S., Red blood cell L-
tryptophan uptake in depression: kinetic analysis in untreated depressed patients and
healthy volunteers. Psychiatry Res., 1996, 63(2–3), 151–159.
Jensen F. B., Red blood cell pH, the Bohr effect, and other oxygenation-linked
phenomena in blood O2 and CO2 transport. Acta Physiol. Scand., 2004, 182(3), 215–
227.
Kanehisa M. and Goto S., KEGG: kyoto encyclopedia of genes and genomes. Nucleic
Acids Res., 2000, 28(1), 27–30.
Karon B. S., Van Buskirk C. M., Jaben E. A., Hoyer J. D. and Thomas D. D., Temporal
sequence of major biochemical events during Blood Bank storage of packed red blood
cells. J. Blood Transfus., 2012, 28, 1–9.
Kim P. S., Iyer R. K. and Lu K. V., et al., Expression of the liver form of arginase in
erythrocytes. Mol. Genet. Metab., 2002, 76, 100–110.
Kinoshita A., Tsukada K. and T. Soga T., Roles of hemoglobin. Allostery in hypoxia-
induced metabolic alterations in erythrocytes: simulation and its verification by
metabolome analysis. J. Biol. Chem., 2007, 282, 10731–10741.
Kleinbongard P., Schulz R., Rassaf T., Lauer T., Dejam A., Jax T., Kumara I., Gharini
P., Kabanova S., Ozüyaman B., Schnürch H. G., Gödecke A., Weber A. A., Robenek
M., Robenek H., Bloch W., Rösen P. and Kelm M., Red blood cells express a functional
endothelial nitric oxide synthase. Blood, 2006, 107, 2943–2951.

References
79
Lang E., Qadri S. M. and Lang F., Killing me softly – suicidal erythrocyte death. Int. J.
Biochem. Cell Biol., 2012, 44(8), 1236–1243.
Lewis I. A., Campanella M. E., Markley J. L. and Low P. S., Role of band 3 in
regulating metabolic flux of red blood cells. Proc. Natl. Acad. Sci. U. S. A., 2009, 106,
18515–18520.
Locasale J. W., Grassian A. R., Melman T., Lyssiotis C. A., Mattaini K. R., Bass A. J.,
Heffron G., Metallo C. M. T., Muranen Sharfi H. and Sasaki A. T., et al.,
Phosphoglycerate dehydrogenase diverts glycolytic flux and contributes to oncogenesis.
Nat. Genet., 2011, 43, 869–874.
Low P. S., Structure and function of the cytoplasmic domain of band 3: center of
erythrocyte membrane-peripheral protein interactions. Biochim. Biophys. Acta, 1986,
864, 145–167.
Lu S. C., Regulation of glutathione synthesis, Mol. Aspects Med., 2009, 30, 42–59.
Mansfield K. D., Simon M. C and Keith B., Hypoxic reduction in cellular glutathione
levels requires mitochondrial reactive oxygen species. J. Appl. Physiol., 2004, 97,
1358–1366.
Marshall W. E., Goldinger J. M. and Omachi A., The influence of anaerobiosis on
human erythrocyte metabolism. Proc. Soc. Exp. Biol. Med., 1977, 154, 356–369.
Matte A., Bertoldi M., Mohandas N., An X., Bugatti A., Maria Brunati A., Rusnati M.,
Tibaldi E., Siciliano A., Turrini F., Perrotta S. and De Franceschi L., Membrane
association of peroxiredoxin-2 in red cells is mediated by n-terminal cytoplasmic
domain of band 3. Free Radical Biol. Med., 2012.
Melamud E., Vastag L. and Rabinowitz J. D., Metabolomic analysis and visualization
engine for LC-MS data. Anal. Chem., 2010, 82(23), 9818–9826.

References
80
Messana I., Ferroni L., Misiti F., Girelli G., Pupella S. and Castagnola M., et al., Blood
bank conditions and RBCs: the progressive loss of metabolic modulation. Transfusion,
2000, 40, 353–360.
Messana I., Misiti F., el-Sherbini S., Giardina B. and Castagnola M., Quantitative
determination of the main glucose metabolic fluxes in human erythrocytes by 13C- and
1H-MR spectroscopy. J. Biochem. Biophys. Methods, 1999, 39, 63–84.
Messana I., Orlando M., Cassiano L., Pennacchietti L., Zuppi C., Castagnola M. and
Giardina B., Human erythrocyte metabolism is modulated by the O2-linked transition of
hemoglobin. FEBS Lett., 1996, 390(1), 25–28.
Misiti F., Meucci E., Zuppi C., Vincenzoni F., Giardina B., Castagnola M. and Messana
I., O(2)-dependent stimulation of the pentose phosphate pathway by S-nitrosocysteine in
human erythrocytes. Biochem. Biophys. Res. Commun., 2002.
Monod J., Wymam J. and Changeux J. P., On the nature of allosteric transitions: a
plausible model. J. Mol. Biol., 1965, 12, 88–118.
Moses S. W., Bashan N. and Gutman A., Glycogen metabolism in the normal red blood
cell, Blood, 1972, 40, 836–843. 17 S. J. Wiback and B. O. Palsson, Extreme pathway
analysis of human red blood cell metabolism. Biophys. J., 2002, 83, 808–818.
Mulquiney P. J., Bubb W. A. and Kuchel P. W., Model of 2,3- bisphosphoglycerate
metabolism in the human erythrocyte based on detailed enzyme kinetic equations: in
vivo kinetic characterization of 2,3-bisphosphoglycerate synthase/phosphatase using
13C and 31P NMR. Biochem. J., 1999, 342, 567–580.
Murphy J. R., Erythrocyte metabolism. II. Glucose metabolism and pathways. J. Lab.
Clin. Med., 1960, 55, 286–302.

References
81
Nakayama Y., Kinoshita A. and Tomita M., Dynamic simulation of red blood cell
metabolism and its application to the analysis of a pathological condition. Theor. Biol.
Med. Modell., 2005, 2, 18.
Nicholson J. K. and Lindon J. C., Systems biology: Metabonomics. Nature, 2008, 455,
1054–1056.
Nishino T., Yachie-Kinoshita A., Hirayama A., Soga T., Suematsu M. and Tomita M.,
In silico modeling and metabolome analysis of long-stored erythrocytes to improve
blood storage methods. J. Biotechnol., 2009, 144, 212–223.
Percy A. K., Schmell E., Earles B. J. and Lennarz W. J., Phospholipid biosynthesis in
the membranes of immature and mature red blood cells. Biochemistry, 1973, 12, 2456–
2461.
Rapoprot I., Berger H., Rapoport S. M., Elsner R. and Gerber G., Response of the
glycolysis of human erythrocytes to the transition from the oxygenated to the
deoxygenated state at constant intracellular pH. Biochim. Biophys. Acta, 1976, 428(1),
193–204.
Rifkind J. M. and Nagababu E., Hemoglobin Redox Reactions and Red Blood Cell
Aging. Antioxid. Redox Signaling, 2012, DOI: 10.1089/ars.2012.4867.
Rinalducci S., D’Amici G. M., Blasi B., Vaglio S., Grazzini G. and Zolla L.,
Peroxiredoxin-2 as a candidate biomarker to test oxidative stress levels of stored red
blood cells under blood bank conditions. Transfusion, 2011, 51, 1439–1449.
Rogers S. C., Said A., Corcuera D., McLaughlin D., Kell P. and Doctor A., Hypoxia
limits antioxidant capacity in red blood cells by altering glycolytic pathway dominance.
FASEB J., 2009, 23, 3159–3170.

References
82
Rosenberg R., Young J. D. and Ellory J. C., L-Tryptophan transport in human red blood
cells. Biochim. Biophys. Acta, 1980, 598, 375–384.
Roux-Dalvai Gonzalez F., de Peredo A., Simo´ C., Guerrier, D. Bouyssie´ L., Zanella
A., Citterio A., Burlet-Schiltz O., Boschetti E., Righetti P. G. and Monsarrat B.,
Extensive analysis of the cytoplasmic proteome of human erythrocytes using the peptide
ligand library technology and advanced mass spectrometry. Mol. Cell. Proteomics,
2008, 7, 2254–2269.
Scalbert A., Brennan L., Fiehn O., Hankemeier T., Kristal B. S., van B. Ommen, Pujos-
Guillot E., Verheij E., Wishart D. and Wopereis S., Mass-spectrometry-based
metabolomics: limitations and recommendations for future progress with particular
focus on nutrition research. Metabolomics, 2009, 5, 435–458.
Schauer M., Heinrich R. and Rapoport S. M., Mathematical modelling of glycolysis and
adenine nucleotide metabolism of human erythrocytes: I. Reaction-kinetic statements,
analysis of in vivo state and determination of starting conditions for in vitro
experiments. Acta Biol. Med. Ger., 1981, 12, 1659–1682.
Schuster S. and Kenanov D., Adenine and adenosine salvage pathways in erythrocytes
and the role of S-adenosylhomocysteine hydrolase. A theoretical study using elementary
flux modes. FEBS J., 2005, 272, 5278–5290.
Shan X., Aw T. Y., Shapira R. and Jones D. P., Oxygen dependence of glutathione
synthesis in hepatocytes. Toxicol. Appl. Pharmacol., 1989, 101, 261–270.
Siciliano A., Turrini F., Bertoldi M., Matte A., Pantaleo A., Olivieri O. and De
Franceschi L., Deoxygenation affects tyrosine phosphoproteome of red cell membrane
from patients with sickle cell disease. Blood Cells, Mol., Dis., 2010, 44, 233–242.

References
83
Smith C. A., O’Maille G., Want E. J., Qin C., Trauger S. A., Brandon T. R. and
Custodio D. E., et al., METLIN: a metabolite mass spectral database. Ther. Drug
Monit., 2005, 27, 747–751.
Sprague R. S., Ellsworth M. L., Stephenson A. H. and Lonigro A. J., Participation of
cAMP in a signal-transduction pathway relating erythrocyte deformation to ATP
release. Am. J. Physiol.: Cell Physiol., 2001, 281, C1158–C1164.
Tautenhahn R., Patti G. J., Kalisiak E., Miyamoto T., Schmidt M., Lo F. Y., McBee J.,
Baliga N. S. and Siuzdak G., MetaXCMS: second-order analysis of untargeted
metabolomics data. Anal. Chem., 2011, 83(3), 696–700.
Tsikas D., Suchy M. T., Niemann J., Tossios P., Schneider Y., Rothmann S., Gutzki F.
M., Fro¨lich J. C. and Stichtenoth D. O., Glutathione promotes prostaglandin H
synthase (cyclooxygenase)-dependent formation of malondialdehyde and 15(S)-8-iso-
prostaglandin F(2a). FEBS Lett., 2012, 586, 3723–3730.
Tunnicliff G., Amino acid transport by human erythrocyte membranes. Comp.
Biochem. Physiol., Comp. Physiol., 1994, 108, 471–478.
van Wijk R. and van Solinge W. W., The energy-less red blood cell is lost: erythrocyte
enzyme abnormalities of glycolysis. Blood, 2005, 106, 4034–4042.
Veale M. F., Healey G. and Sparrow R. L., Effect of additive solutions on red blood cell
(RBC) membrane properties of stored RBCs prepared from whole blood held for 24
hours at room temperature. Transfusion, 2011, 51, 25S–33S.
Walder J. A., Chatterjee R., Steck T. L., Low P. S., Musso G. F., Kaiser E. T., Rogers P.
H. and Arnone A., The interaction of hemoglobin with the cytoplasmic domain of band
3 of the human erythrocyte membrane. J. Biol. Chem., 1984, 25, 10238–10246.

References
84
Wang L., Olivecrona G., Go¨tberg M., Olsson M. L., Winzell M. S. and Erlinge D.,
ADP acting on P2Y13 receptors is a negative feedback pathway for ATP release from
human red blood cells. Circ. Res., 2005, 96, 189–196.
Weber R. E., Voelter W., Fago A., Echner H., Campanella E. and Low P. S.,
Modulation of red cell glycolysis: interactions between vertebrate hemoglobins and
cytoplasmic domains of band 3 red cell membrane proteins. Am. J. Physiol.: Regul.,
Integr. Comp. Physiol., 2004, 287, R454–R464.
Werner A. and Heinrich R., A kinetic model for the interaction of energy metabolism
and osmotic states of human erythrocytes. Analysis of the stationary ‘‘in vivo’’ state
and of time dependent variations under blood preservation conditions. Biomed.
Biochim. Acta, 1985, 44, 185–212.
Wishart D. S., Knox C., Guo A. C., Eisner R. and Young N., et al., HMDB: a
knowledgebase for the human metabolome. Nucleic Acids Res., 2009, 37, D603–D610.
Yoshida T. and Shevkoplyas S. S., Anaerobic storage of red blood cells. J. Blood
Transfus., 2010, 8, 220–236.
Yoshida T., AuBuchon J. P., Tryzelaar L., Foster K. Y. and Bitensky M. W., Extended
storage of red blood cells under anaerobic conditions. Vox Sang., 2007, 92, 22–31.
Yoshida T.,. AuBuchon J. P, Dumont L. J., Gorham J. D., Gifford S. C., Foster K. Y.
and Bitensky M. W., The effects of additive solution pH and metabolic rejuvenation on
anaerobic storage of red cells. Transfusion, 2008, 48, 2096–1205.
Zolla L., Ioppolo C., Amiconi G., Benaglia A. and Antonini E., Changes in rate of
methemoglobin reduction and oxygen affinity of erythrocytes incubated with inosine,
pyruvate and phosphate. Experientia, 1977, 33, 1524–1526.

85
CHAPTER 4:
THIOL-BASED REGULATION OF GLYCERALDEHYDE-3-PHOSPHATE
DEHYDROGENASE IN BLOOD BANK–STORED RED BLOOD CELLS:
A STRATEGY TO COUNTERACT OXIDATIVE STRESS

Chapter 4
86
4.1 AIM OF THE STUDY
A growing body of evidence argues that regulation of red blood cell (RBC) energy
metabolism indirectly depends on the assembly of some glycolytic enzymes (GEs;
phosphofructokinase, aldolase, glyceraldehyde-3-phosphate dehydrogenase [GAPDH],
lactate dehydrogenase [LDH]) into complexes associated with the cytoplasmic domain
of the membrane protein Band 3 (CDB3) [Campanella et al., 2005, Lewis et al., 2009,
Castagnola et al., 2010]. In particular, it has been demonstrated that when bound to
CDB3, GEs are inhibited in their activity, while their release from the membrane to the
cytoplasm results in their activities being restored and, thus, in metabolic modulation
(Fig. 1) [Campanella et al., 2005, Lewis et al., 2009]. The Band 3–mediated metabolic
regulatory model is also strictly intertwined with the hemoglobin (Hb) oxygenation
state, because whereas oxy-Hb has no affinity for Band 3, deoxy-Hb binds to the GE
site on CDB3 with high affinity [Chu et al., 2008]. Consequently, competition between
deoxy-Hb and GEs for CDB3 causes GEs to be displaced from membrane with
following activation and increased glycolysis (Fig. 1) [Campanella et al., 2005, Giardina
et al., 1995, Messana et al., 1996, De Rosa et al., 2008]. Furthermore, tyrosine
phosphorylation of CDB3 at Positions 8 and 21 competes with GE binding as well
[Campanella et al., 2005], thus inducing an increased glycolytic flux and a reduced
pentose shunt activity (Fig. 1) [Lewis et al., 2009]. Beyond any doubt, oxygen-
dependent modulation of glucose metabolism in human RBCs has physiologic
relevance because of its connection to the regulation of intracellular levels of NADPH
and ATP. Over the past few years special attention has been devoted, in the framework
of transfusion medicine, to the metabolic flux alterations in stored RBCs with the goal
to improve cell survival and maintain good-quality RBC units up to the end of 42-day
shelf life. Indeed, nowadays it is well known that storage lesions include metabolic
effects such as potassium leakage, depletion of 2,3-diphosphoglycerate (2,3-DPG) and
ATP, pH decrease, and lactate accumulation [D’Alessandro et al., 2010, Gevi et al.,
2012]. In particular, under standard blood bank conditions (cold storage in the acidic
SAGM), RBCs face a rapid decrease of the glycolytic rate with a shift toward the
oxidative phase of the pentose phosphate pathway (PPP) [Gevi et al., 2012]. As
observed in vivo [Murphy 1960], this strategy is adopted in response to an exacerbation
of oxidative stress, due to altered glutathione homeostasis and reactive oxygen species

Chapter 4
87
accumulation [D’Alessandro et al., 2012]. A central role in the stress-induced partial
block of glycolysis may be played by the enzyme GAPDH that converts glyceraldehyde
3-phosphate (GAP) to 1,3-DPG. This reaction is considered a key regulatory point in
the glycolysis because it generates the reducing power (NADH) to maintain Hb in its
functional state. Unfortunately, GAPDH is extremely sensitive to oxidative radicals
with subsequent loss of enzyme activity. Elementary flux mode analysis indicated that
GAPDH deficiency causes cessation of all possible reaction routes within human RBCs
[Cakir et al., 2004], thereby irreversibly compromising RBC viability. Accordingly,
RBC deficiency of GAPDH has been described in association with hemolytic anemia
[Harkness 1966]. However, temporary inactivation of GAPDH due to reversible
oxidative modifications of the active-site thiolate (e.g., S-thiolation and intramolecular
disulfide cross-linking) is known to function as a metabolic switch to redirect
carbohydrate flux from glycolysis to PPP, allowing the cell to produce more NADPH in
an attempt to maintain oxidation-reduction balance and protect itself against oxidative
insults [Brandes et al., 2009, Ralser et al., 2007]. Based on these considerations, in this
study we followed the redox regulation of RBC GAPDH during blood storage under
control conditions (4°C, SAGM). Thus, membrane and cytosol fractions from stored
RBCs were analyzed separately by Western blotting for the presence of GAPDH and
assayed for catalytic activity. We revealed a time-dependent loss of membrane-bound
GAPDH with a consequent increase of activity in the cytosol within the first two
storage weeks, while a sharp decline in the cytosolic GAPDH activity was detected after
21-day storage, although we observed a restoration in enzyme activity toward the end of
preservation. Moreover, by mass spectrometry (MS) analysis we were able to
demonstrate the oxidant-mediated formation of an intramolecular disulfide bond
between Cys-152 and Cys-156 as being the molecular mechanism responsible for the
reversible inactivation of cytosolic RBC GAPDH.

Chapter 4
88
Figure 1-Schematic view of oxygen-dependent modulation of RBC metabolism. This regulatory model
accounts for the competitive binding of deoxy-Hb and GEs phosphofructokinase, aldolase, and GAPDH
to the CDB3. (A)When the RBC is at low oxygenation state, deoxy-Hb binds to the CDB3 and dislocates
GEs, thus promoting their activation and subsequent increase of glucose flux toward the glycolytic
pathway. This metabolic behavior may be consequence of CDB3 phosphorylation as well. (B) In response
to high oxygen saturation conditions and oxidative stress, GEs are mostly bound to the CDB3 and thereby
inhibited. This mechanism addresses more glucose toward the PPP with increased NADPH production.
HK = hexokinase; PGI = phosphoglucose isomerase; PFK = phosphofructokinase; ALDO = aldolase; TPI
= triose phosphate isomerase; PGK = phosphoglycerate kinase; DPGM = diphosphoglycerate mutase;
PGM = phosphoglycerate mutase; ENO = enolase; PK = pyruvate kinase; G6PD = glucose-6-phosphate
dehydrogenase; TKT = transketolase.
4.2 MATERIALS AND METHODS
4.2.1 Storage of RBCs and sample preparation
For this study RBC units were collected from five healthy donors (three males, two
females; age, 35 ± 10.2 years [mean ± SD]) in Rome (Italy) and used according to the
policy of the Italian National Blood Centre guidelines. All the volunteers provided their
informed consent in accordance with the Declaration of Helsinki. Whole blood (450 mL
± 10%) was collected into CPD (63 mL). After separation of plasma and buffy coat by
centrifugation, leukofiltered RBCs were suspended in 100 mL of SAGM. RBC units
were stored for up to 42 days under standard blood bank conditions (4 ± 2°C) and
samples were collected aseptically for the analysis every week from Day 0 until Day 42

Chapter 4
89
of storage. RBC protein extraction was performed exactly as previously described by
Rinalducci et al [Rinalducci et al., 2011].
4.2.2 GAPDH assay
Enzymatic activity was determined using a colorimetric assay kit (Science Cell
Research Laboratories, Carlsbad, CA) by measuring the rate of NADH oxidation, which
is proportional to the reduction in absorbance at 340 nm over time (ΔA340nm/min). To
control for possible loss of activity during sample handling and processing, spike and
recovery experiments were performed by adding 0.2 units/mL standard pure GAPDH to
the cell lysis buffer used for protein extraction. GAPDH activity was then measured in
the cytosolic extract, in the standard solution (positive control) and in the mix. Spike
recovery was 88% to 106%.
4.2.3 Western blotting analysis
After sodium dodecyl sulfate–polyacrylamide gel electrophoresis (SDS-PAGE)
separation (11% acrylamide for cytosolic samples and 8%-16% acrylamide for
membrane samples), RBC proteins were transferred onto a nitrocellulose filter.
Blocking was performed overnight (+4°C) in 1% (wt/vol) nonfat dried milk, 1%
(wt/vol) bovine serum albumin in Tris-buffered saline containing 0.1% Tween 20.
Incubation with mouse polyclonal antibodies against human GAPDH (sc-137179, Santa
Cruz Biotechnology, Dallas, TX) was performed for 1 hour at room temperature in 5%
(wt/vol) nonfat dried milk in Tris-buffered saline and 0.1% Tween 20. Bands were
detected with goat antimouse horseradish peroxidase using enhanced
chemiluminescence reagents and digitized by an advanced imaging system (ChemiDoc
XRS+ system, Bio-Rad, Hercules, CA).
4.2.4 Statistical analysis
Data were analyzed with computer software (GraphPad Prism 4.0 software, GraphPad,
San Diego, CA) using oneway analysis of variance (ANOVA) followed by Dunnett’s
test. Results were considered significant when p values were less than 0.05.

Chapter 4
90
4.2.5 In-gel digestion and peptide sequencing by nano-LC-ESI Q-TOF MS/MS
Protein bands observed in SDS-PAGE were carefully excised and subjected to in-gel
trypsin digestion according to Shevchenko and colleagues [Shevchenko et al., 2006].
Nano-LC MS/MS analyses were performed as described in detail by Egidi and
colleagues [Egidi et al., 2011]. Data were searched against the National Center for
Biotechnology Information nonredundant database (NCBInr, Version 20140323,
38032689 sequences) using computer software (Mascot, in-house version 2.2, Matrix
Science, London, UK) with the following constraints: taxonomy = human; enzyme =
trypsin; missed cleavage = 1; peptide and fragment mass tolerance = ±0.05 Da; variable
modifications = Deydro (Cys); Nethylmaleimide (Cys). For positive identification, the
score of the result of [–10 × Log(P)] had to be over the significance threshold level (p <
0.05). Peptide fragmentation spectra were also manually verified.
4.3 RESULTS
4.3.1 Effects of RBC storage on GAPDH activity
As it is known, RBC GAPDH is inactive in its membrane-bound state, since this
binding site (specific for CDB3) is located in the catalytic domain of the protein [Tsai et
al., 1982]. Thus, the enzymatic activity of GAPDH was measured in the cytosol of
RBCs at 0, 7, 14, 21, 28, 35, and 42 days of storage (Fig. 2A). To cope with biologic
variability, the same analysis was performed on RBC units collected from five different
matched donors and results are displayed as mean ± SD. The GAPDH activity is shown
to increase within the first storage days, likely corresponding to an initial burst of
glycolysis ensuing the internalization of extracellular glucose primarily found in the
additive storage solution SAGM. Interestingly, this immediate increase in the GAPDH
activity is followed by a net decrease at 21 storage days with a subsequent
reestablishment of activity at the end of preservation time.
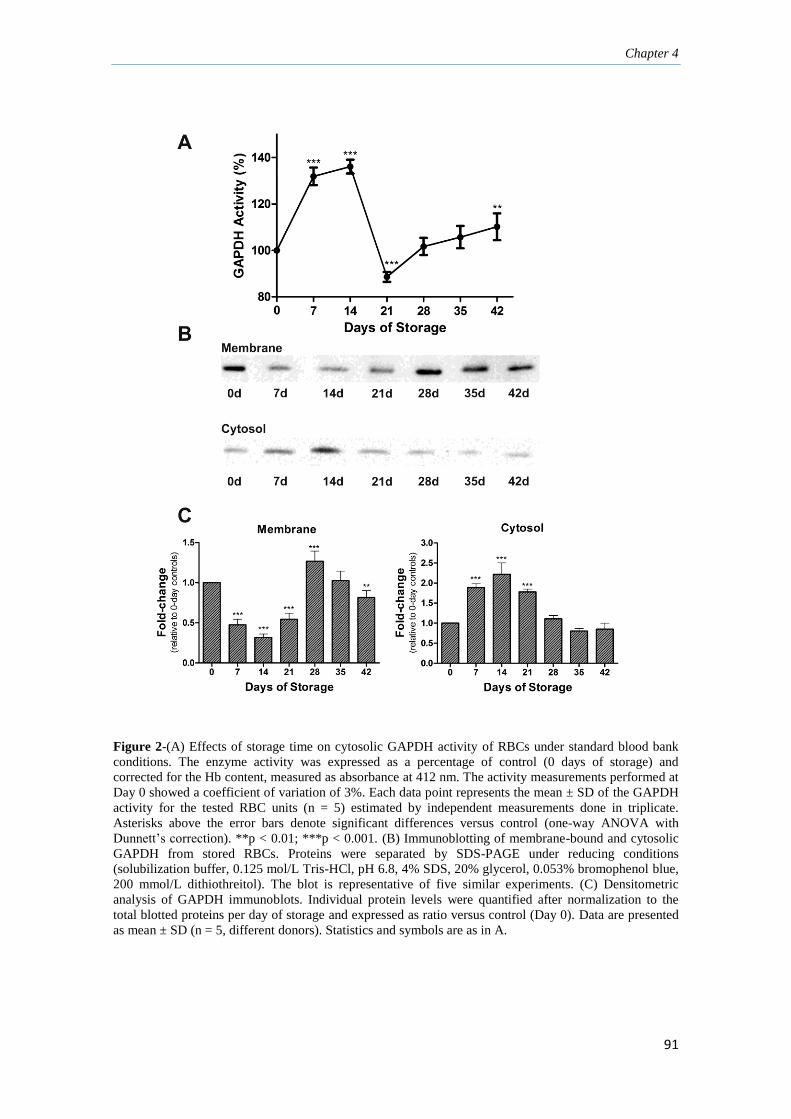
Chapter 4
91
Figure 2-(A) Effects of storage time on cytosolic GAPDH activity of RBCs under standard blood bank
conditions. The enzyme activity was expressed as a percentage of control (0 days of storage) and
corrected for the Hb content, measured as absorbance at 412 nm. The activity measurements performed at
Day 0 showed a coefficient of variation of 3%. Each data point represents the mean ± SD of the GAPDH
activity for the tested RBC units (n = 5) estimated by independent measurements done in triplicate.
Asterisks above the error bars denote significant differences versus control (one-way ANOVA with
Dunnett’s correction). **p < 0.01; ***p < 0.001. (B) Immunoblotting of membrane-bound and cytosolic
GAPDH from stored RBCs. Proteins were separated by SDS-PAGE under reducing conditions
(solubilization buffer, 0.125 mol/L Tris-HCl, pH 6.8, 4% SDS, 20% glycerol, 0.053% bromophenol blue,
200 mmol/L dithiothreitol). The blot is representative of five similar experiments. (C) Densitometric
analysis of GAPDH immunoblots. Individual protein levels were quantified after normalization to the
total blotted proteins per day of storage and expressed as ratio versus control (Day 0). Data are presented
as mean ± SD (n = 5, different donors). Statistics and symbols are as in A.

Chapter 4
92
4.3.2 Storage-dependent displacement of RBC GAPDH from membrane to cytosol
Due to the well-known correlation between the GAPDH activity and the cellular
localization of this protein, we investigated the storage-dependent release of the GE
from RBC membranes to cytosol, in the attempt to explain the changes observed in the
enzymatic activity described previously. GAPDH has been demonstrated to be largely
located at the membrane level in unstimulated, healthy, or oxygenated RBCs
[Campanella et al., 2005]; thus this conceivably represents our situation at 0-day storage
(freshly drawn RBCs). To verify this assumption, we performed a semiquantitative
Western blot analysis of RBC membranes and cytosol by using anti- GAPDH. Figure
2B and 2C shows the results obtained at 0, 7, 14, 21, 28, 35, and 42 days of storage. As
can be seen, a time-dependent GAPDH release from the membrane was observed within
the first 3 weeks of storage, in agreement with the initial storage-induced activation of
the enzyme (as reported in Fig. 2A). These findings suggest that most of the membrane-
bound GAPDH is activated early during storage through a displacement into the
cytosol. Curiously, a new membrane binding of the protein is observed toward the end
of storage time.
4.3.3 Identification of posttranslational oxidative modifications responsible for
GAPDH inactivation
GAPDH is extremely sensitive to the modification of the cysteine residue (Cys-152)
located in its catalytic center, especially under oxidative stress conditions [Hwang et al.,
2009]. For this reason, a proteomic approach using MS was employed to verify if the
temporary inactivation observed for this enzyme after 21 days of blood storage was due
to an oxidation of this active-site cysteine. To this end, in this set of experiments a thiol
blocking agent (N-ethylmaleimide) was used before sample preparation to lock any
possible GAPDH redox forms, so as to avoid artifacts of oxidation upon RBC lysis and
extract preparation [Murphy 1960, Rinalducci et al., 2011]. Membranes and cytosol of
stored RBC were then analyzed by reduced and nonreduced Western blotting using
antibodies to GAPDH. Interestingly, under nonreducing conditions, neither dimers nor
higher-molecular-weight aggregates of GAPDH were detected throughout the storage,
suggesting that storage-induced oxidative stress does not lead to the formation of
interdisulfide-linked GAPDH molecules (data not shown). The reactive gel bands

Chapter 4
93
corresponding to GAPDH were excised, subjected to trypsin digestion, and analyzed by
peptide sequencing with nano-LC-ESI-qTOF MS/MS. Figure 3 shows the MS/MS
spectra of the containing active-site peptide 146IISNASCTTNCLAPLAK162 (859.43
m/z, 2+) as it was identified from the cytosolic GAPDH gel band at 21 days storage.
The results indicate the presence of an intramolecular disulfide bridge between Cys-152
and Cys-156, which reasonably accounts for the reversible inactivation of the enzyme
registered after 21 days of storage. In agreement, no oxidative modifications were
detected in the same peptide when the GAPDH-corresponding bands were excised and
analyzed at 0 days (Fig. 3, right panel).
4.4 DISCUSSION AND CONCLUSION
During blood storage, RBCs undergo an exacerbation of oxidative injury due to the
rapid exhaustion of glutathione and its related enzymes (such as glutathione reductase
and glutathione peroxidase), with consequent accumulation of a number of structural
and biochemical changes (referred to as “storage lesions”) [D’Alessandro et al., 2010].
Hypothermic storage also causes significant metabolic alterations that negatively
influence enzyme activities, thus contributing to a rapid fall of glycolytic flux [Gevi et
al., 2012]. In fact, an increase of early glycolytic intermediates has been measured
within the first 2 weeks of storage, with a swift decrease soon afterward [Gevi et al.,
2012]. Nevertheless, RBC storage is accompanied by the constant accumulation of
lactate, the end product of anaerobic glycolysis [Gevi et al., 2012]. These observations
are therefore suggestive of metabolic fine-tunings, where GAPDH may have a crucial
role. This enzyme is recognized as an intriguing example of redox-regulated proteins
that undergo reversible oxidation of key cysteine residues to regulate their activity in
response to oxidants. Indeed, it functions as a homotetramer where each subunit
possesses one redox active cysteine in its catalytic center (Cys-152 in human), which is
essential for the initial nucleophilic attack on the aldehyde of GAP [Brandes et al.,
2009]. Under oxidative stress, this active-site cysteine has been shown to rapidly
become the target of a variety of oxidative thiol modifications (disulfide bond
formation, sulfinic and sulfonic acids, S-thiolation, S-nitrosylation) by different reactive
oxygen and nitrogen oxide species [Brandes et al., 2009, Hwang et al., 2009].
Remarkably, our findings demonstrated an evident decline in the cytosolic activity of

Chapter 4
94
GAPDH at approximately 21 days of storage. As is known, GAPDH catalyzes the
reversible oxidative phosphorylation of GAP to 1,3-DPG in the presence of NAD+ and
inorganic phosphate. Therefore, the observed trend of enzymatic activity is consistent
with the previously detected rapid consumption of GAP occurring between 7 and 21
days of storage [Gevi et al., 2012]. Inactivation of GEs has been long attributed to their
selective binding to CDB3 [Chu et al., 2008]; however, we found that membranes of 21-
day-stored RBCs contain few bound subunits of GAPDH (see Fig. 2B). On the whole,
these results indicated a storage-dependent impairment of the GAPDH activity that did
not correlate with the revealed concentration of the enzyme in the cytosol, thus favoring
the hypothesis of a reversible inactivation due to the oxidation of thiol groups at the
catalytic site. In support of this, we identified for the first time the storage-dependent
formation of an intramolecular disulfide bridge between the catalytic Cys-152 and Cys-
156 of cytosolic GAPDH, which was present in the containing active-site peptide only
at 21 days of storage. This in agreement with previous observations demonstrating that
oxidative stress–induced reactive oxygen species (probably in the form of hydroxyl
radicals and superoxide generated through HaberWeiss and Fenton reactions from Hb
heme iron) accumulated over the first 3 weeks of storage, to reach a plateau at 21 days
[D’Alessandro et al., 2012]. Interestingly, reversible oxidation of the GAPDH catalytic
Cys-152 has been associated with a temporary inactivation of the enzyme that uses this
posttranslational modification to reroute metabolites from glycolysis to PPP, thereby
increasing the cell capacity to defend against oxidative stress [Brandes et al., 2009,
Hwang et al., 2009]. Accordingly, NADPH formation continued to rise during storage,
as to reach doubled levels at 42 days in comparison to 0-day control [D’Alessandro et
al., 2012]. However, the ratio of metabolic intermediates of the PPP and glycolysis9,22
indicates that such a defensive mechanism might only be transitory, resulting in a
metabolic lesion leading to the progressive impairment of oxygen-dependent metabolic
modulation in stored RBCs [Messana et al., 2000]. Very interestingly, cytosolic
GAPDH activity is partially restored (to near 0-day levels) toward the end of storage.
Both glutaredoxin and thioredoxin systems are known to reverse oxidative thiol
modifications on proteins [Holmgren et al., 2005], thus regenerating enzyme activities
from inactivation due to disulfide formation. However, direct evidence of their
involvement in stored RBCs is missing so far. What is certain is that glycolysis does not

Chapter 4
95
stop (in agreement with the accumulation of glycolytic end products) [Gevi et al., 2012,
D’Alessandro et al., 2012]. or at least it is switched to producing metabolites involved
in antioxidant responses. Still, it should be noted that between 28 and 42 days a large
amount of GAPDH was found in its membrane-state. Since GAPDH is an abundant
cellular protein, it is possible that a subpopulation of the enzyme undergoes irreversible
modifications, so as to be localized at the membrane level for subsequent elimination by
microvesiculation. Such an observation (i.e., this storage-related late membrane
recruitment of GAPDH) deserves more consideration in the light of the fact that a
significant increase in tyrosine phosphorylation of Band 3 was observed between the
fourth and fifth weeks of storage by Antonelou and colleagues [Antonelou et al., 2012]
in SAGM preserved RBCs. As this phosphorylative event at the NH2 terminus of Band
3 is known to displace GEs (including GAPDH),1 it is reasonable to suppose that
additional docking sites on the RBC membrane may be involved in the GAPDH
attachment that we observed from 28 days onward. This assumption is consistent with
the recent findings of Puchulu-Campanella and colleagues [Puchulu-Campanella et al.,
2013] showing the existence of secondary binding sites for GEs on RBC membranes in
correspondence not only of Band 3, but also α- and β-spectrin, ankyrin, actin, p55, and
Protein 4.2. In conclusion, RBC GAPDH may play a main role in transitory redirection
of metabolites to PPP to augment NADPH production, both in vivo and during storage.
To our knowledge, this finding is the first evidence for a GAPDH thiol-based redox
switch in human RBCs, whose regulation may represent a fundamental strategy to fine-
tune cellular metabolism and presumably signal transduction.

Chapter 4
96
Fig
ure
3-O
xid
ativ
e m
odif
icat
ion
in
th
e ca
taly
tic
site
o
f cy
toso
lic
GA
PD
H
as
iden
tifi
ed
by
n
ano
-LC
-ES
I Q
-TO
F
MS
/MS
. (L
eft)
M
S/M
S
spec
tru
m
of
the
acti
ve-s
ite
try
pti
c p
epti
de
146II
SN
AS
CT
TN
CL
AP
LA
K1
62 (
85
9.4
3 m
/z,
2+
) as
det
ecte
d f
rom
21
-day
-sto
red
RB
Cs.
An
aly
sis
of
the
y-t
yp
e se
quen
ce i
on
s in
dic
ated
an
intr
amo
lecu
lar
dis
ulf
ide
bri
dge
bet
wee
n C
ys-
15
2 a
nd
Cy
s-
156
. A
s ex
pec
ted,
dis
ulf
ide
cro
ss-l
inkin
g d
ram
atic
ally
red
uce
s th
e in
ten
sity
of
pro
du
ced f
ragm
ent
ions
corr
esp
ond
ing t
o t
he
pep
tid
e se
qu
ence
str
etch
in
bet
wee
n (
i.e.
, 1
52C
TT
NC
15
6).
Mo
reov
er,
du
e to
dis
ulf
ide
form
atio
n,
the
pep
tid
e ca
lcu
late
d m
ass
obta
ined
fro
m t
he
obse
rved
pre
curs
or
mas
s w
as 1
716
.85
Da,
wh
ich
rep
rese
nts
−2
Da
of
the
ori
gin
al u
nm
odif
ied
pep
tid
e m
ass.
(R
igh
t) M
S/M
S
spec
trum
of
the
acti
ve-s
ite
tryp
tic
pep
tide
14
6II
SN
AS
CT
TN
CL
AP
LA
K162 (
985
.96
m/z
, 2
+)
as d
etec
ted
fro
m f
resh
ly d
raw
n R
BC
s. A
s sh
ow
n,
redu
ced
su
lfhyd
ryl
gro
up
s o
f C
ys-
15
2 a
nd
Cy
s-1
56
are
trap
ped
by
NE
M (
N-e
thy
lmal
eim
ide,
+21
5 D
a).
97
References
Antonelou MH, Tzounakas VL, Velentzas AD, et al., Effects of pre-storage
leukoreduction on stored red blood cells signaling: a time-course evaluation from shape
to proteome. J Proteomics 2012; 76:220-38.
Brandes N, Schmitt S, Jakob U., Thiol-based redox switches in eukaryotic proteins.
Antioxid Redox Signal 2009;11:997- 1014.
Cakir T, Tacer CS, Ulgen KO., Metabolic pathway analysis of enzyme-deficient human
red blood cells. Biosystems 2004; 78:49-67.
Campanella ME, Chu H, Low PS., Assembly and regulation of a glycolytic enzyme
complex on the human erythrocyte membrane. Proc Natl Acad Sci U S A 2005;102:
2402-7.
Castagnola M, Messana I, Sanna MT, et al., Oxygen-linked modulation of erythrocyte
metabolism: state of the art. Blood Transfus 2010; 8(Suppl 3):s53-8.
Chu H, Breite A, Ciraolo P, et al., Characterization of the deoxyhemoglobin binding site
on human erythrocyte band 3: implications for O2 regulation of erythrocyte properties.
Blood 2008; 111:932-8.
D’Alessandro A, D’Amici GM, Vaglio S, et al., Time-course investigation of SAGM-
stored leukocyte-filtered red bood cell concentrates: from metabolism to proteomics.
Haematologica 2012;97:107-15.
D’Alessandro A, Liumbruno G, Grazzini G, et al., Red blood cell storage: the story so
far. Blood Transfus 2010; 8:82-8.
De Rosa MC, Carelli Alinovi C, Galtieri A, et al., Allosteric properties of hemoglobin
and the plasma membrane of the erythrocyte: new insights in gas transport and
metabolic modulation. IUBMB Life 2008;60:87-93.

References
98
Egidi MG, Rinalducci S, Marrocco C, et al., Proteomic analysis of plasma derived from
platelet buffy coats during storage at room temperature. An application of
ProteoMiner™ technology. Platelets 2011; 22:252-69.
Gevi F, D’Alessandro A, Rinalducci S, et al., Alterations of red blood cell metabolome
during cold liquid storage of erythrocyte concentrates in CPD-SAGM. J Proteomics
2012; 76:168-80.
Giardina B, Messana I, Scatena R, et al. The multiple functions of hemoglobin. Crit Rev
Biochem Mol Biol 1995; 30: 165-96.
Harkness DR., A new erythrocytic enzyme defect with hemolytic anemia:
glyceraldehyde-3-phosphate dehydrogenase deficiency. J Lab Clin Med 1966; 68:879
80.
Holmgren A, Johansson C, Berndt C, et al., Thiol redox control via thioredoxin and
glutaredoxin systems. Biochem Soc Trans 2005; 33:1375-7.
Hwang NR, Yim SH, Kim YM, et al., Oxidative modifications of glyceraldehyde-3-
phosphate dehydrogenase play a key role in its multiple cellular functions. Biochem J
2009; 423: 253-64.
Lewis IA, Campanella ME, Markley JL, et al., Role of band 3 in regulating metabolic
flux of red blood cells. Proc Natl Acad Sci U S A 2009;106:18515-20.
Messana I, Ferroni L, Misiti F, et al., Blood bank conditions and RBCs: the progressive
loss of metabolic modulation. Transfusion 2000; 40:353-60.
Messana I, Orlando M, Cassiano L, et al., Human erythrocyte metabolism is modulated
by the O2-linked transition of hemoglobin. FEBS Lett 1996;390:25-8.

References
99
Murphy J., Erythrocyte metabolism. II. Glucose metabolism and pathways. J Lab Clin
Med 1960;55:286-302.
Puchulu-Campanella E, Chu H, Anstee DJ, et al., Identification of the components of a
glycolytic enzyme metabolon on the human red blood cell membrane. J Biol Chem
2013; 288:848-58.
Ralser M, Wamelink MM, Kowald A, et al., Dynamic rerouting of the carbohydrate
flux is key to counteracting oxidative stress. J Biol 2007; 6:10.
Rinalducci S, D’Amici GM, Blasi B, et al., Oxidative stress-dependent oligomeric
status of erythrocyte peroxiredoxin II (PrxII) during storage under standard blood
banking conditions. Biochimie 2011;93:845-53.
Rinalducci S, D’Amici GM, Blasi B, et al., Peroxiredoxin-2 as a candidate biomarker
to test oxidative stress levels of stored red blood cells under blood bank conditions.
Transfusion 2011; 51:1439-49.
Shevchenko A, Tomas H, Havlis J, et al., In-gel digestion for mass spectrometric
characterization of proteins and proteomes. Nat Protoc 2006;1:2856-60.
Tsai IH, Murthy SN, Steck TL., Effect of red cell membrane binding on the catalytic
activity of glyceraldehyde-3- phosphate dehydrogenase. J Biol Chem 1982; 257:1438-
42.

100
CHAPTER 5:
RED BLOOD CELL LIPIDOMICS ANALYSIS THROUGH HPLC-ESI-QTOF:
APPLICATION TO RED BLOOD CELL STORAGE

Chapter 5
101
5.1 Aim of the study
Lipidomics is the systematic identi"cation of the lipid molecular species of a biological
matrix (either a cell, organelle, globule, or whole organism) with emphasis on the
relative quantitation of composition changes in response to a perturbation, such as
ageing or drug treatments [Brown 2012].While the term “lipidomics” dates back to a
decade ago, investigations of the lipid content of specific biological matrices was an
already consolidated field of research over the last fifty years [Philips et al., 1959]. In
particular, this holds true for those matrices that are largely available and display limited
biological complexity, such as anucleated cells and, in particular RBCs [Philips et al.,
1959, Novgorodtseva et al., 2011]. Indeed, RBCs are also devoid of organelles and of
any de novo lipid synthesis capacity, which makes their lipidome rather stable in
comparison to other cell types. Indeed, phospholipid synthesis is known to be active in
reticulocytes and suppressed in mature RBCs [Percy et al., 1973]. Nonetheless,
alteration of lipid homeostasis is strictly tied to membrane reorganization during RBC
ageing in vivo and in vitro (RBC storage), mainly owing to lipid peroxidation
phenomena which promote membrane shape alterations through the progressive loss of
lipids (and membrane-associated proteins) via vesiculation [D'Alessandro et al., 2012,
Dinkla et al., 2012]. Therefore, it is small wonder that the RBC lipidome has long
attracted a great deal of interest over the last five decades. Yet in 1959, Phillips and
Roome provided a preliminary portrait of the human RBC phospholipidome [Philips et
al., 1959]. However, it was only in 1960 that Hanahan and colleagues described a more
complex scenario, also by including species-speci"c diWerences between human and
bovine RBCs [Hanahan et al., 1960]. Four years later, Ways and Hanahan reported a
detailed lipid class composition of normal human RBCs, indicating the following
percentages: cholesterol 25%, choline glycerophosphatides 30%, sphingomyelin 24%,
ethanolamine glycerophosphatides 26%, and serine glycerophosphatides 15% [Ways et
al., 1964]. Meanwhile, Farquhar and Ahrens [Farquhar et al., 1963] had showed that
67% of the PE, 8% of the PS, and 10% of the lecithin of human RBCs are in the
plasmalogen form, with a vinyl ether linkage at the sn-1 and an ester linkage at the sn-2
position. In 1967, Dodge and Philips described a silicic acid thin-layer chromatography
strategy to investigate the phospholipid and phospholipid fatty acids and aldehydes in
human RBCs [Dodge et al., 1967]. Thirtythree fatty acids and five aldehydes were

Chapter 5
102
separated and tentatively classified into lipid classes, including phosphatidyl
ethanolamine (PE), phosphatidyl serine (PS), lecithin, and sphingomyelin (SM) 24:0
and 24:1, while fatty acid moieties were tentatively attributed. Of note, the values
reported by Dodge and Philips [Dodge et al., 1967] were consistent with those by Ways
and Hanahan [Ways et al., 1964]. Interesting results were obtained also as far as it
concerned the composition in fatty acid moieties of the diWerent lipid classes. About
37% of the total fatty acid in PS was 18:0, while only about 3% was 16:0; in PE and
lecithin, 16:0 was the major saturated fatty acid, with the level in lecithin being over
twice that in PE. The relative amount of 18:1 was also much lower in PS than in PE and
lecithin. The fatty acid distribution of sphingomyelin differed markedly from that of the
glycerophospholipids (GP), in particular in the greater degree of saturation [Dodge et
al., 1967]. Only about 33% of the fatty acids were unsaturated; in addition, less than 6%
of the fatty acids appeared to have more than one double bond and less than 3% more
than two double bonds. The 16:0, 24:0, and 24:1 made up almost 7% of the total fatty
acids. Essentially all of the 24:0 and most of the 24:1 of the human RBC phospholipids
appeared to reside in sphingomyelin. Different instrumentations and techniques have
been tested for the improvement of lipid analysis. During the last two decades, big
technological strides have prompted the dissemination of chromatography separation
and mass spectrometry-based lipidomics studies of RBCs [Han et al., 1994,
Novgorodtseva et al., 2011]. At the dawn of the mass spectrometry-based lipidomics era
the complexity of the lipidome did not enable comprehensive studies like the ones
performed with thin layer chromatography (TLC) or gas chromatography (GC)
described in the previous paragraphs [Philips et al., 1959, Dougherty et al., 1987]. The
expensive instrumentation and the lack of bioinformatic tools to handle the high-
throughput amount of data collected via the mass spectrometry-based workflow
hampered at first its diffusion in the field [Brown 2012].More recently, the introduction
of highly accurate and less expensive instruments (in comparison to the ones available
decades ago) was also paralleled by consistent improvements in the field of
bioinformatic elaboration of the raw mass spectra [Brown 2012].The acquired expertise
have helped laboratories worldwide to cope with the intrinsic difficulties related to lipid
mass attribution and fueled new efforts to bring about the systematic classification of
lipid species and structures [Fahy et al., 2005, Sud et al., 2007]. The current burgeoning

Chapter 5
103
of OMICS disciplines has thus given new verve to the field of lipidomics research,
while enabling further steps forward. Regarding RBC lipid homeostasis, as premised by
Farquhar and Ahrens [Farquhar et al., 1963], lipid composition of human RBCs is
largely influenced by the diet. In this view, Dougherty and colleagues performed an
extensive investigation to relate region specific diets to the lipid content of plasma,
platelets and RBCs [Dougherty et al., 1987]. By comparing RBCs of individuals from
rural areas in Finland, Italy (province of Viterbo) and the United States, the Authors
demonstrated how diets largely relying on fish and olive oil consumption (in Finland
and Italy, respectively), resulted in a significant decrease (in comparison to the US
counterparts) in the levels of polyunsaturated fatty acids (PUFA), which they relate to
the potential production of unhealthy prostaglandins (thromboxane and prostacyclins)
byproducts [Dougherty et al., 1987]. Finally, the Authors also noted that in all plasma
and RBC glycerolphospholipids, the monounsaturated fatty acids (especially oleic acid
16:1 and palmitic acid, 16:0) were highest in the Italian and the saturated fatty acids
were highest in the Finnish samples. In this frame, we exploit novel databases such as
LIPID MAPS and ad hoc software suites for mass spectrometry-based metabolomics
analyses (such as MAVEN [Clasquin et al., 2012]) to address the key biological issue of
the RBC lipidome. Our investigation shares some features with the study by Dougherty
and colleagues [Dougherty et al., 1987], for it was performed on RBCs collected from
subjects living in the province of Viterbo, where olive oil consumption represents a
central aspect of the diet. We further address the RBC storage issue (from a lipidomic
standpoint) as to conclude that wider transfusion medicine-relevant studies should be
carried out to investigate whether inter-regional donor differences might lie upon
peculiar RBC lipidomic profiles, which in turn are likely to reflect the heterogeneity of
local alimentation regimes across Italy.
5.2 Materials and Method
5.2.1 Sample collection
Red blood cell units were drawn from healthy donor volunteers according to the policy
of the Italian National Blood Centre guidelines (Blood Transfusion Service for donated
blood) and upon informed consent in accordance with the declaration of Helsinki. We
Chapter 5
104
studied RBC units collected from 10 healthy donor volunteers [male=5, female=5, age
39.4 ± 7.5 (mean ± S.D.)]. RBC units were stored for up to 42 days under standard
conditions (CDP-SAGM, 4°C), while samples were removed aseptically for the analysis
on a weekly basis (at 0, 7, 14, 21, 28, 35 and 42 days of storage).
5.2.2 Untargeted Metabolomics Analyses
5.2.2.1 Metabolite extraction
For each sample, 0.5mL from the pooled erythrocyte stock was transferred into a
microcentrifuge tube (Eppendorf ® Germany). Erythrocyte samples were then
centrifuged at 1000g for 2 minutes at 4°C. Tubes were then placed on ice while
supernatants were carefully aspirated, paying attention not to remove any erythrocyte at
the interface. Samples were extracted following the protocol by D’Alessandro et al.
[D'Alessandro et al., 2011]. The erythrocytes were resuspended in 0.15mL of ice cold
ultra-pure water (18 MΩ) to lyse cell, then the tubes were plunged into a water bath at
37°C for 0.5 min. Samples were mixed with 0.6mL of -20°C methanol and then with
0.45mL chloroform. Subsequently, 0.15mL of ice cold ultra-pure water were added to
each tube and they were transferred to - 20°C freezer for 2-8 h. An equivalent volume of
acetonitrile was added to the tube and transferred to refrigerator (4°C) for 20 min.
Samples with precipitated proteins were thus centrifuged for 10000 x g for 10 min at 4
°C . Finally, samples were dried in a rotational vacuum concentrator (RVC 2-18 - Christ
Gmbh; Osterode am Harz, Germany) and re-suspended in 200 μl of water, 5% formic
acid and transferred to glass auto-sampler vials for LC/MS analysis.
5.2.3 Rapid Resolution Reversed-Phase HPLC
An Ultimate 3000 Rapid Resolution HPLC system (LC Packings, DIONEX, Sunnyvale,
USA) was used to perform metabolite separation. The system featured a binary pump
and vacuum degasser, well-plate autosampler with a six-port micro-switching valve, a
thermostated column compartment. Samples were loaded onto a Reprosil C18 column
(2.0mm×150mm, 2.5 μm - Dr Maisch, Germany) for metabolite separation. For lipids
multi-step gradient program was used. It started with 8% solvent A (ddH20, 20 mmol L-
1 ammonium formiate; pH 5) to 6% solvent A for 3 min than to 2% solvent A for 35

Chapter 5
105
min and finally to 100% solvent B (methanol) in 30 minutes. At the end of gradient, the
column was reconditioned with 8% solvent A for 10 min. The overall run time was 68
min. Column oven was set to 50°C and the flow rate was 0.2 mL/min.
5.2.4 Mass spectrometry analysis through microTOF-Q
Due to the use of linear ion counting for direct comparisons against naturally expected
isotopic ratios, time-of-flight instruments are most often the best choice for molecular
formula determination. Thus, mass spectrometry analysis was carried out on an
electrospray hybrid quadrupole time of flight mass spectrometer MicroTOF-Q (Bruker-
Daltonik, Bremen, Germany) equipped with an ESI-ion source. MS analysis was carried
out in negative ion mode capillary voltage 2800V, nebulizer 45 psi and dry gas of 9
l/min, scan mode 100-1500 m/z. For sample injection, solutions were evaporated to
dryness and reconstituted in an adequate volume of methanol:ethanol 1:1. Lipids
extracts were prepared by dilution to a concentration of 5 pmol*L-1 ( where total
phospholipids concentration was 2.5 pmol*L-1). Tandem mass spectrometry (MS/MS)
is used for glycerophospholipid species structural characterization. Unambiguous
species identification is done by analysis of the retention time and fragmentation pattern
and through direct comparison against the same parameters, as acquired from
chemically defined standards (Avanti Polar Lipids, Inc., Alabaster, Al.), in agreement
with Ivanova et al. [Ivanova et al., 2010]. Automatic isolation and fragmentation
(AutoMSn mode) was performed on the 4 most intense ions simultaneously throughout
the whole scanning period (30 min per run). Calibration of the mass analyzer is essential
in order to maintain an high level of mass accuracy. Instrument calibration was
performed externally every day with a sodium formate solution consisting of 10 mM
sodium hydroxide in 50% isopropanol, water, 0.1 % formic acid. Automated internal
mass scale calibration was performed through direct automated injection of the
calibration solution at the beginning and at the end of each run by a 6-port divert-valve.
5.2.5 Data elaboration and statistical analysis
In order to reduce the number of possible hits in molecular formula generation, we
exploited the in house SmartFormula application of MAVEN [Clasquin et al., 2012],
which directly calculates molecular formulae based upon the MS spectrum (isotopic

Chapter 5
106
patterns) and transition fingerprints (fragmentation patterns). This software generates a
confidence-based list of chemical formulae on the basis of the precursor ions and all
fragment ions, and the significance of their deviations to the predicted intact mass and
fragmentation pattern (within a predefined window range of 5 ppm). Triplicate runs for
each one of the 10 biological replicate at day 0 and over storage duration were exported
as mzXML files and processed through METLIN/XCMS data analysis software
(Scripps Centre for Metabolomics) [Tautenhahn et al., 2012] and MAVEN [Clasquin et
al., 2012]. Mass spectrometry chromatograms were elaborated for peak alignment
(m/zwidth = 0.025, minfrac = 0.5, bw = 5), matching and comparison of parent and
fragment ions, and tentative metabolite identification (within a 20 ppm massdeviation
range between observed and expected results against the imported LIPID MAPS
database [Sud et al., 2007] – annotations included adduct ions in positive ion mode).
XCMS and MAVEN are open-source software that could be freely used or downloaded
from their websites (http:// metlin.scripps.edu/download/ and http://genomicspubs.
princeton.edu/mzroll/index.php?show=download). Quantitative variations were
determined against day 0 controls and only statistically significant results were
considered (fold change > 2.5 and ANOVA p-values < 0.01). Data were further refined
and plotted with GraphPad Prism 5.0 (GraphPad Software Inc.).
5.3 Results and Discussion
HPLC-MS analysis of the RBC lipidome yielded the tentative identification of a huge
number of lipid molecules on the basis of accurate intact mass values and retention
times (RT). Results were further validated against MS/MS feature transitions
(fragmentation patterns) for RBC storage time course analyses, where we reported
statistically significant variations (p < 0.01 ANOVA) of specific lipid molecules over
storage duration on a weekly basis in comparison to day 0 controls (Table 1). This
helped coping with the di\culties related to the attribution of fatty acid moieties in
detected lipids, a problem that hampered major translational applications of early MS-
based approaches to the RBC lipidome [Han et al., 1994, Beermann et al., 2005]. A 2D
map overview of the lipid features identified in a single run is provided in Figure 1,
where compound class specific separations are indicated according to the established
nomenclature (fatty acids – FA; glycerolipids – GL; glycerophospholipids – GP;

Chapter 5
107
sphingolipids – SP; sterols – ST; prenols – PR and polyketides – PK). While FA, GL,
GP and SP eluted rather early (within the first six minutes of RT), ST first and PR or PK
displayed higher RTs, consistently with their more hydrophobic nature. In the following
paragraphs, we will detail the major findings of the currently proposed investigation
through the description of the main distinct lipid classes. Results will be discussed in the
light of existing literature in the field.
Figure 1-2D map overview of the lipid features identi"ed in a single run compound. Class speci"c
separations are indicated according to the established nomenclature (fatty acids – FA; glycerolipids – GL;
glycerophospholipids – GP; sphingolipids – SP; sterols – ST; prenols – PR and polyketides – PK).

Chapter 5
108

Chapter 5
109

Chapter 5
110
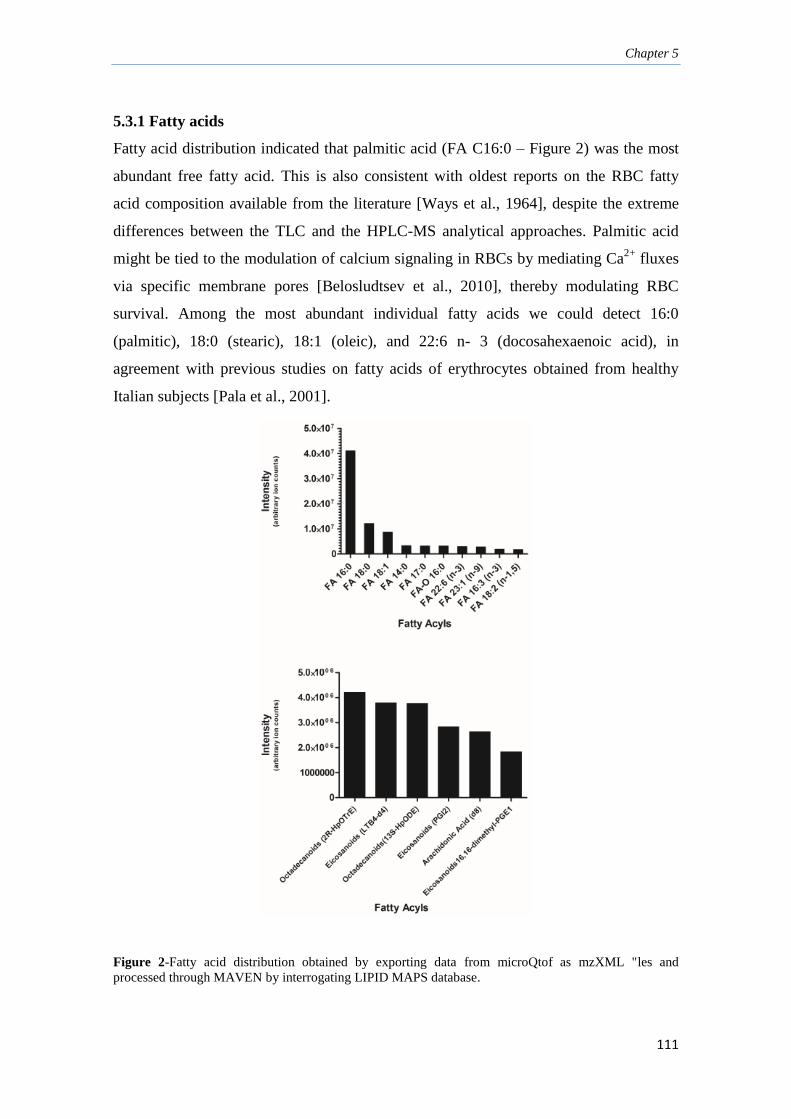
Chapter 5
111
5.3.1 Fatty acids
Fatty acid distribution indicated that palmitic acid (FA C16:0 – Figure 2) was the most
abundant free fatty acid. This is also consistent with oldest reports on the RBC fatty
acid composition available from the literature [Ways et al., 1964], despite the extreme
differences between the TLC and the HPLC-MS analytical approaches. Palmitic acid
might be tied to the modulation of calcium signaling in RBCs by mediating Ca2+
fluxes
via specific membrane pores [Belosludtsev et al., 2010], thereby modulating RBC
survival. Among the most abundant individual fatty acids we could detect 16:0
(palmitic), 18:0 (stearic), 18:1 (oleic), and 22:6 n- 3 (docosahexaenoic acid), in
agreement with previous studies on fatty acids of erythrocytes obtained from healthy
Italian subjects [Pala et al., 2001].
Figure 2-Fatty acid distribution obtained by exporting data from microQtof as mzXML "les and
processed through MAVEN by interrogating LIPID MAPS database.

Chapter 5
112
Furthermore, octadecadienoic acid (18:2 n- 1,5) had already been reported among the
most abundant ten fatty acids of RBCs [Ways et al., 1964]. The abundance of oleic acid
in particular was an expected result, since olive oil holds a key role in the frame of the
Mediterranean diet and, in particular, in the province of Viterbo (Italy) where blood
samples were collected from healthy donor volunteers. The intertwinement between
oleic acid relative concentrations and high olive oil consumption rates had already been
postulated and demonstrated through TLC approaches [Dougherty et al., 1987], and
hereby confirmed through MS. On the other hand, no previous investigation indicated
myristic acid (14:0) as one of the most abundant fatty acid in RBCs, except for those
studies suggesting a role for myristic acid supplementation as a substitute of oleic acid
in the diet, which results in the relative increase of α-linolenic and doxosahexaenoic
acid levels [Rioux et al., 2008] and alterations of RBC membrane Yuidity [Dabadie et
al., 2006]. Analogously, heptadecanoic acid (17:0) has been proposed as a controversial
biomarker for the assessment of energy and macronutrient composition in response to
specific diets [29]. Eicosanoids and octadecanoids and their peroxidation products
(relative abundances are reported in Figure 1) are thought to play a role in mediating
RBC maturation from reticulocytes by promoting the degradation of mitochondrial
membranes and thus elimination of these organelles [Grüllich et al., 2001]. Also,
eicosanoids serve as substrates for cycloxygenase, lipoxygenase and epoxygenase
activities, which result in the production of pro-inflammatory factors that are associated
with increased cardiovascular risk and cancer [Smith et al., 2002].
5.3.2 Glycerolipids and glycerophospholipds
Relative abundances of RBCs glycerolipids (GL) and glycerophospholipids (GP) are
reported in Figure 3 and 4, respectively, whereas the latter class has been further
subdivided into phosphatidic acid (PA), phosphatidylcholines (PC),
phosphatidylethanolamines (PE) and phosphatidylserine (PS), in the light of the
observed elevated concentrations in RBCs. Fatty acid incorporation stages into RBC
membrane GLs and GPs has been long investigated [Oliveira et al., 1964, Donabedian
et al., 1967, Mulder et al., 1962], indicating higher rates for reticulocytes in comparison
to adult RBCs [Shohet et al., 1968, Van Gastel et al., 1965]. Indeed, RBC, GL and GP
metabolism is a key aspect in RBC survival [Mulder et al., 1965], since during their 120

Chapter 5
113
days approximate lifespan in the circulatory system RBCs shed approximately 1
microvesicle/h, thus continuously remodeling their membrane and its lipid composition.
Also, early approaches to GP composition of RBCs have been purported via TLC
[Skipski et al., 1964] indicated a relation of GP composition with RBC membrane
anomalies, such as in the case of spheorcytosis [Kates et al., 1961]. These
considerations are relevant in the light of the incomplete long chain fatty acid
synthesizing system which characterizes RBCs [Pittman et al., 1966]. The introduction
of high-resolution capillary gas chromatography approaches recently shed new light on
this delicate issue [Jakobik et al., 2009], further evidencing compositional anomalies of
GL and GP in cancer patients [Mikirova et al., 2004]. Our results provide further
supporting evidence about elevated levels of C16:0 and C18:0 fatty acids in lyso-PCs
from adult RBCs (Figure 4), as previously reported with different approaches
[Dougherty et al., 1987, Jakobik et al., 2009, Mikirova et al., 2004]. Analogous
considerations can be made for PE 38:4, PE 40:6 and lyso-PE 18:0, as well as for PS
38:4 (Figure 4), in agreement with the literature [Dougherty et al., 1987, Mikirova et al.,
2004]. In particular, PS 38:4 had been recently indicated as the most abundant RBC-
specific PS, in comparison to other blood cell types [Mikirova et al., 2004]. Distribution
of saturated and unsaturated fatty acids in GL and GP was also consistent with the
literature [Ways et al., 1964, Dougherty et al., 1987, Mikirova et al., 2004]. As
expected, compositional differences were observed as well, which are probably
attributable to the different diets of the subjects enrolled in the present study in
comparison to data available from literature.

Chapter 5
114
Figure 3-Glycerolipids distribution obtained by exporting data from microQtof as mzXML "les and
processed through MAVEN by interrogating LIPID MAPS database.
Figure 4-Glycerophospholipids distribution obtained by exporting data from microQtof as mzXML "les
and processed through MAVEN by interrogating LIPID MAPS database.

Chapter 5
115
5.3.3 Sphingolipids, sterols and prenol lipids
Sphingolipids (SP), among which ceramides (Cer), have been recently associated with
in vivo and in vitro ageing of RBCs [Dinkla et al., 2012]. Though the mechanisms have
not yet been fully elucidated, sphinogosines and ceramides seem to aWect RBC survival
by serving as signaling molecules upon acid sphingomyelinase hydrolysis of
sphingomyelin into ceramide [Smith et al., 2008] or rather they directly aWect RBC
membrane stability by forming speci"c pores and thus altering membrane permeability
and potential [Siskind et al., 2005]. Ceramide-enriched membrane domains have been
indeed associated with hot-cold hemolysis [Montes et al., 2008]. Besides, SP
metabolites, including ceramides, sphingosine and sphingosine 1-phosphate have
recently emerged as a new class of lipid biomodulators also in the extracellular space
[Tani et al., 2006]. In Figures 5 and 6 we report the relative abundances of the top SP,
with a focus on ceramides, respectively. Of note, C16 sphingosine (Figure 5) has been
recently reported to be the most abundant RBC-specific SP [Leidl et al., 2008]. On the
other hand, while we expected elevated levels of Cer 24:1 and 24:0, in agreement with
Leidl et al. [Leidl et al., 2008], we could instead observe elevated levels of Cer 18:0 and
18:1 in all ceramide subclass (Figure 6), which might reflect the relative composition of
free fatty acid, as mentioned in the previous paragraphs. Recent studies have also
demonstrated that sphingolipids dynamically cluster with sterols to form lipid
microdomains or rafts, which function as platforms for effective signal transduction and
protein sorting [Simons et al., 1987]. Sterol profiling of RBCs is also a powerful
diagnostic tool to investigate the effects of total parental nutrition diet supplementation
to the newborn, a lifesaving therapy in children with intestinal failure [Pianese et al.,
2008]. An overview of the most abundant sterol lipids is provided in Figure 7, where
sterol lipids are reported with their relative name from the Lipid Maps database [Sud et
al., 2007], owing to the impossibility to adapt graphic limitations to the lengthy
extended names of each sterol lipid. Prenol lipids are often under-investigated class of
lipids, which are synthesized from five carbon isoprene units. Recent lipidomics studies
focused on plasma levels of dolichols (a group of α-saturated polyprenols characterized
by 14 to 24 isoprene subunits) and ubiquinones (a group of 1,4- benzoquinones
modified with 9-10 repeated isoprene units) [Quehenberger et al., 2010]. However, to
the best of the Authors’ knowledge, little is known about the composition of prenol
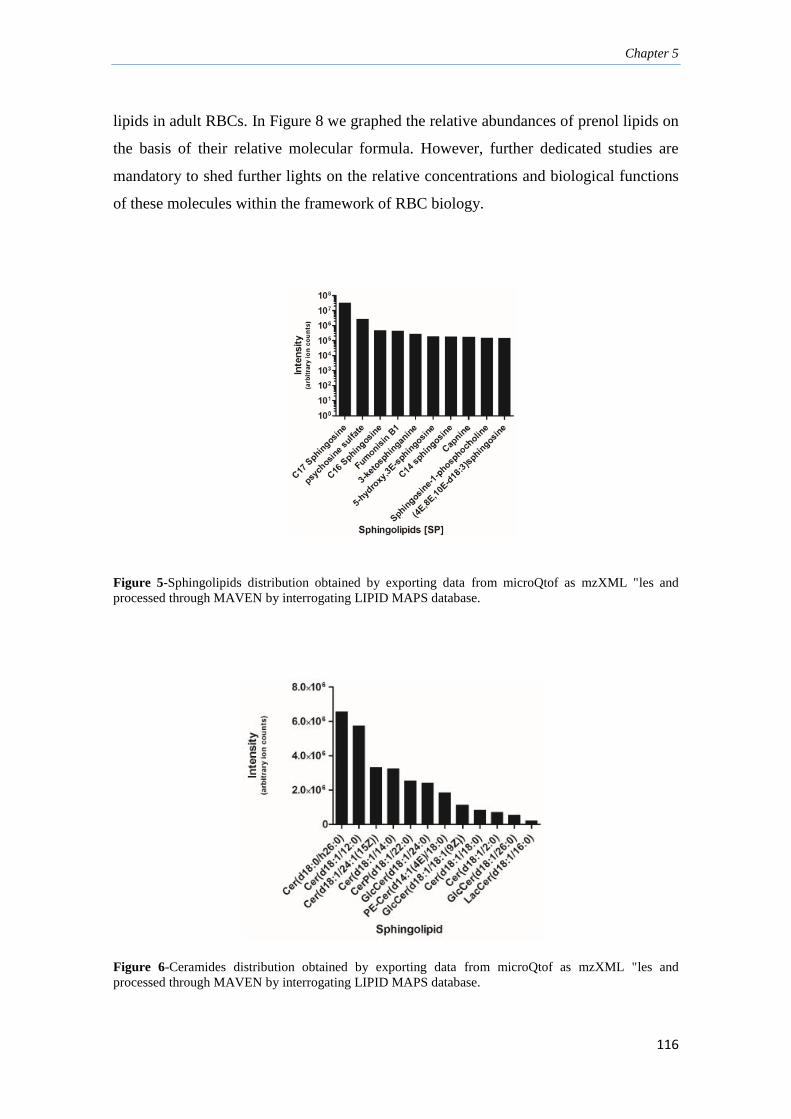
Chapter 5
116
lipids in adult RBCs. In Figure 8 we graphed the relative abundances of prenol lipids on
the basis of their relative molecular formula. However, further dedicated studies are
mandatory to shed further lights on the relative concentrations and biological functions
of these molecules within the framework of RBC biology.
Figure 5-Sphingolipids distribution obtained by exporting data from microQtof as mzXML "les and
processed through MAVEN by interrogating LIPID MAPS database.
Figure 6-Ceramides distribution obtained by exporting data from microQtof as mzXML "les and
processed through MAVEN by interrogating LIPID MAPS database.

Chapter 5
117
Figure 7-Steroids distribution obtained by exporting data from microQtof as mzXML "les and processed
through MAVEN by interrogating LIPID MAPS database.
Figure 8-Prenols distribution obtained by exporting data from microQtof as mzXML "les and processed
through MAVEN by interrogating LIPID MAPS database.
5.3.4 Red blood cell Lipidomics: application to the storage of erythrocyte
concentrates
RBC concentrates for transfusion purposes are routinely stored at 2-6°C for up to 42
days, according to international standard guidelines [European Directorate for the

Chapter 5
118
Quality of Medicines & HealthCare 2011]. Despite decades of substantial
improvements in the field of RBC storage [D'Alessandro et al., 2012], concerns still
arise and persist about the quality of longer stored RBCs, since it is clearly emerging –at
least from a biochemical standpoint– that storage progression corresponds to the
accumulation of a wide series of RBCs storage lesions [D'Alessandro et al., 2012], as,
among others, we could recently document at the morphologic, metabolomics and
proteomics level [Blasi et al., 2012, D'Amici et al., 2012, Xu et al., 2010]. On the other
hand, lipidomic aspects of RBC storage in the blood bank still lie undisclosed. Recently,
Bosman’s group demonstrated that specific treatment with exogenous
sphingomyelinases resulted in the accumulation of ceramides RBC morphological
lesions, thereby mimicking the effects of long-stored RBCs [Dinkla et al., 2012].
Indeed, accumulation of ceramides and their metabolites (sphingosine and sphingosine
1-phosphate – S1P) might promote intrinsic stimuli leading to the exacerbation of
ageing phenomena in RBCs [Dinkla et al., 2012], by altering membrane conformation
[Siskind et al., 2005] or mediating specific intra- or extra-cellular signaling cascades
[Smith et al., 2008]. In this view, it is worthwhile noting that plasma S1P mainly
originates from erythrocytes, since RBCs display alkaline (but not acid or neutral)
ceramidase activity on D-e-C(18:1)-ceramide [Neidlinger et al., 2006]. First of all, we
wish to stress that the most abundant ceramides we could detect in control adult RBCs
could be catalogued as C18:0 or 18:1 (Figure 6). Moreover, in the present study
prolonged storage of RBC was apparently associated with statistically significant
decrease (p < 0.01 ANOVA) of ceramides (C-8, Ceramide d18:1/12:0 and ceramide C-2
– Table 1) after three weeks of storage, which is a critical timespan threshold for the
accumulation of storage lesions at the biochemical level, as we could previously report
at the proteomics and metabolomics level [D'Amici et al., 2012, Xu et al., 2010]. These
results are suggestive of a likely ceramidase-mediated digestion of ceramides, or rather
of an alteration of the lipid composition of long-stored RBCs probably reYecting the
membrane remodeling occurring over RBC storage duration [Blasi et al., 2012].
However, we could also observe a decrease in the levels of several sphingosines
(N,N,N-trimethyl sphingosine, sphingosine, phytosphingosine and D-erythro-
Sphingosine C-15 – Table 1), which did not help us ruling out any definitive scenario to
explain the observed phenomena. After an initial increase (attributable to phospholipase

Chapter 5
119
activities [Chaudhary et al., 2012]), prolonged storage of RBC concentrates hereby
resulted in the progressive statistically significant (p<0.01 ANOVA) decrease of a wide
series of fatty acids, prostaglandins (such as PGF2α and prostaglandin E2) and fatty
acid oxidation products ((1R,2R)-3-oxo-2-pentylcyclopentanehexanoic acid) (Table 1).
This is consistent with the reported progressive accumulation of lipid oxidation
byproducts in the supernatants of long-stored erythrocyte concentrate units [Gevi et al.,
2012, Chaudhary et al., 2012]. The initial increase in the levels of diacyl-glycerols (DG)
and triacyl-glycerols (TG) (Table 1) is difficult to interpret, if not in the light of the need
for RBCs to cope with the initial free fatty acid accumulation through their sequestering
and accumulation in the form of DGs and TGs. This is consistent with the hypothesis
that, whether a Save or Sacrifice mechanism is innate in RBCs, as suggested by in silico
elaborations [Goodman et al., 2007, D'Alessandro et al., 2010], this mechanism is active
within the first two weeks of storage [Blasi et al., 2012, D'Amici et al., 2012]. Recently,
Bicalho et al. investigated the alterations to the RBCs phospholipidome by performing a
direct comparison of fresh RBC phospholipids against the phospholipid composition of
RBC-shed microvesicles [Bicalho et al., 2012]. As a result, the Authors could point out
the alterations of PS 38:4 and PS 38:1 composition in fresh controls and RBC-derived
microvesicles [Bicalho et al., 2012]. In the present study, while we could confirm
previous evidences about PS 38:4 being preponderant in RBCs (Figure 4), also in
agreement with Leidl et al. [Leidl et al., 2008], we could not detect any statistically
significant variation as far as PS are concerned. On the other hand, we could detect
significant decrease in the levels of two PCs (O-1:0/O-18:0 and 10:0/18:0 – Table 1),
Pes (lyso-PE(0:0/22:2(13Z,16Z)) and lyso-PE(0:0/22:2(13Z,16Z)) – Table 1), while PIs
followed a controversial trend, especially within the first two weeks of storage. Finally,
sterols, prenols, saccharolipids and polyketides were hereby investigated for the first
time within the framework of RBC storage. Intriguingly, all these classes of lipids
statistically significant decreases throughout storage duration (Table 1). Most of the
observed decreases account for sterols (e.g. desmosterol, gorgosterol), and in particular
for vitamin D3-related metabolites (Table 1). This is relevant in the light of the well-
established role for Vitamin D in modulating RBC survival [Alexander 1977], also by
inYuencing anti-oxidant potential and Ca2+
permeability [Holmes et al., 1963], a
phenomenon which is strictly tied to erythrocyte-specific apoptosis, also known as

Chapter 5
120
eryptosis [Pompeo et al., 2010]. On the other hand, earliest studies on the likely long
term eWect of RBC storage on the lipidome suggested that cholesterol loss is limited in
comparison to the loss of phospholipids and phosphoinositides [Greenwalt et al., 1990].
Finally, our results about a generalized decrease in lipid contents of the major lipid
classes in long stored RBCs also confirm and expand/ complement recent evidences by
Acker’s group [Bicalho et al., 2013, Almizraq et al., 2013].
5.4 Conclusion
Despite decades of investigations, the field of lipidomics recently drained new lymph
from the introduction of recent technical innovations. From TLC to gas chromatography
and MS, consolidated lipidomics expertise in the field of RBC biology has paved the
way for a deeper understanding of the functioning of this pivotal cell and, in parallel, to
the accumulation of a wealth of knowledge that will be soon transferred to the clinical
setting. Indeed, owing to their relative abundances and widespread biological activities,
lipids are well suited to play the role of biological markers and will soon serve this
purpose. In this study, we presented an HPLC-microTOF-Q approach to investigate the
RBC lipidome. We could exploit this analytical workflow to consolidate existing
knowledge on the RBC lipid composition and individuate statistically significant
fluctuations of lipids throughout storage duration of RBC concentrates under blood
bank conditions. While this field of research still warrants future investigations, which
could be exploiting for example recently introduced imaging mass spectrometry
approaches [Mainini et al., 2013], we could indicate ceramides, glycerophospholipids
and sterols as key targets of RBC storage lesions to the lipidome, that will deserve
further targeted investigations in the future. Finally, in the light of minor differences
with other reports available from the literature, we posited how compositional analyses
of the RBC lipidome might end up yielding different results on the basis of the
background of the blood donor (above all, the diet), which might translate into
regionspecific lipidomic alterations over storage progression of RBC concentrates. This
is relevant in the light of the constant efforts pursued by transfusion services to improve
the quality of blood-derived therapeutics [Liumbruno et al., 2010], by shifting the focus
of attention from the end-product (RBC concentrates) to their providers (the donors).

121
References
Alex Brown H., Lipidomics: when apocrypha becomes canonical. Curr Opin Chem Biol
16 (2012) 221-226.
Almizraq R., Tchir J.D., Holovati J.L., Acker J.P., Storage of red blood cells affects
membrane composition, microvesiculation, and in vitro quality. Transfusion. 2013
Beermann C., Mobius M., Winterling N., Beermann, C., Möbius, M., Winterling, N.,
Schmitt, J.J., Boehm, G. (2005) SN-position determination of phospholipid linked fatty
acids derived from erythrocytes by liquid chromatography electrospray ionization ion-
trap mass spectrometry LC/ESI-ITMS. Lipids 40, 211-218 Lipids 40 (2005) 211-218.
Belosludtsev K.N., Trudovishnikov A.S., Belosludtseva N.V., Agafonov A.V.,
Mironova G.D., Palmitic Acid Induces the Opening of a Ca2+-Dependent Pore in the
Plasma Membrane of Red Blood Cells: The Possible Role of the Pore in Erythrocyte
Lysis. J Membr Biol 237 (2010) 13-19.
Bicalho B., Holovati J.L., Acker J.P., Phospholipidomics reveals differences in
glycerophosphoserine profiles of hypothermically stored red blood cells and
microvesicles. Biochim Biophys Acta 1828 (2013) 317-326.
Blasi B., D'Alessandro A., Ramundo N., Zolla L., Red blood cell storage and cell
morphology. Transfus Med 22 (2012) 90-96.
Chaudhary R., Katharia R., Oxidative injury as contributory factor for red cells storage
lesion during twenty eight days of storage. Blood Transfus 10 (2012) 59- 62 .
Clasquin M.F., Melamud E., Rabinowitz J.D., LC-MS data processing with MAVEN: a
metabolomic analysis and visualization engine.Current Protocols in Bioinformatics. 14
(2012) 14-11.
Dabadie H., Motta C., Peuchant E., LeRuyet P., Mendy F., Variations in daily intakes of
myristic and alpha-linolenic acids in sn-2 position modify lipid profile and red blood
cell membrane fluidity. Brit J Nutr 96 (2006) 283-289.D'Alessandro A., D'Amici G.M.,
Vaglio S., Zolla L., Time-course investigation of SAGM-stored leukocyte-filtered red

122
bood cell concentrates: from metabolism to proteomics. Hematologica 97 (2012) 107–
115.
D'Alessandro A., Gevi F., Zolla L., Mol Biosyst. 27 (2011) 1024-1032. DOI:
10.1039/c0mb00274g.
D'Alessandro A., Liumbruno G., Grazzini G., Zolla L., Blood Transfus 8 (2010) 82-88.
DOI: 10.2450/2009.0122-09.
D'Alessandro A., Righetti P.G., Zolla L., The red blood cell proteome and interactome:
an update. J Proteome Res 9 (2010) 144-163.
D'Amici G.M., Mirasole C., D'Alessandro A., Yoshida T., Dumont L.J., Zolla L., Red
blood cell storage in SAGM and AS3: a comparison through the membrane two-
dimensional electrophoresis proteome. Blood Transfus 10 (2012) 46-54.
Dinkla S., Wessels K., Verdurmen W.P., Tomelleri C., Cluitmans J.C., Fransen J.,
Fuchs B., Schiller J., Joosten I., Brock R., Bosman G.J., Functional consequences of
sphingomyelinase-induced changes in erythrocyte membrane structure. Cell Death Dis
18 (2012) 410-418.
Dodge J.T., Phillips G.B., Composition of phospholipids and of phospholipid fatty acids
and aldehydes in human red cells. J Lipid Res 8 (1967) 667-675.
Donabedian R.K., Karmen A., Fatty Acid Transport and Incorporation into Human
Erythrocytes In Vitro. J Clin Invest 46 (1967) 1017- 1027.
Dougherty R.M., Galli C., Ferro-Luzzi A., Iacono J.M., Lipid and phospholipid fatty
acid composition of plasma, red blood cells, and platelets and how they are affected by
dietary lipids: a study of normal subjects from Italy, Finland, and the USA. Am J Clin
Nutr 45(1987) 443-455.
European Directorate for the Quality of Medicines & HealthCare, Guide to the
Preparation,Use and Quality Assurance of Blood Components. Recommendation No. R
(95) 15.16th Edition. Council of Europe (2011)

123
Fahy E., Subramaniam S., Brown H.A., et al., A comprehensive classification system for
lipids. J Lipid Res 46 (2005) 839-861.
Farquhar J.W., Ahrens E.H. Jr, Effects of dietary fats on human erythrocyte fatty acid
patterns. J Clin Invest 42 (1963) 675- 685.
Gevi F., D'Alessandro A., Rinalducci S., Zolla L., J Proteomics. 76 (2012) 168-180.
DOI: 10.1016/ j.jprot.2012.03.012.
Goodman S.R., Kurdia A., Ammann L., Kakhniashvili D., Daescu O., The human red
blood cell proteome and interactome. Exp Biol Med (Maywood) 232 (2007) 1391-408.
Greenwalt T.J., Zehner Sostok C., Dumaswala U.J., Studies in red blood cell
preservation. 1. Effect of the other formed elements. Vox Sang 58 (1990) 90-3.
Grüllich C., Duvoisin R.M., Wiedmann M. K., van Leyen., Inhibition of 15-
lipoxygenase leads to delayed organelle degradation in the reticulocyte. FEBS Lett. 489
(2001) 51-54.
Han X., Gross R.W., Electrospray ionization mass spectroscopic analysis of human
erythrocyte plasma membrane phospholipids. Proc Natl Acad Sci U S A 91 (1994)
10635-10639.
Hanahan D.J., Watts R.M., Papajohn D., J Lipid Res 1 (1960) 421-432.
DOI:jlr.org/content/1/5/421.short.
Holmes R.P., Mahfouz M., Travis B.D., Yoss N.L., Keenan M.J., The effect of
membrane lipid composition on the permeability of membranes to Ca2. Ann N Y Acad
Sci 414 (1983) 44-56.
Ivanova P.T., Milne S.B., Brown H.A., Identification of atypical ether-linked
glycerophospholipid species in macrophages by mass spectrometry. J Lipid Res 51
(2010) 1581-1590.
Jakobik V., Burus I., Decsi T., Fatty acid composition of erythrocyte membrane lipids
in healthy subjects from birth to young adulthood. Eur J Pediatr 168 (2009) 141- 147.

124
Kabagambe E.K., Tsai M.Y., Hopkins P.N., et al., The Relation between Erythrocyte
Trans Fat and Triglyceride, VLDL- and HDL-Cholesterol Concentrations Depends on
Polyunsaturated Fat. Clin Chem 54 (2008) 154-162.
Kates M., Allison A.C., James A.T., Phosphatides of human blood cells and their role
in spherocytosis. Biochim Biophys Acta 48 (1961) 571-582. DOI: 10.1016/0006-
3002(61)90055 -5.
Leidl K., Liebisch G., Richter D., Schmitz G., Mass spectrometric analysis of lipid
species of human circulating blood cells. Biochim Biophys Acta 1781 (2008) 655-664.
Liumbruno G., D'Alessandro A., Grazzini G., Zolla L., Blood-related proteomics. J
Proteomics 73 (2010) 483-507.
Mainini V, Bovo G, Chinello C, et al., Detection of high molecular weight proteins by
MALDI imaging mass spectrometry. Mol Biosyst. 2013.
Mikirova N., Riordan H.D., Jackson J.A., Wong K., Miranda-Massari J.R., Gonzalez
M.J., PR Health, Erythrocyte membrane fatty acid composition in cancer patients. Sci J.
23 (2004) 107-113.
Montes L.R., López D.J., Sot J., Bagatolli L.A., Stonehouse M.J., Vasil M.L., Wu B.X.,
Hannun Y.A., Goñi F.M., Alonso A., Ceramide-Enriched Membrane Domains in Red
Blood Cells and the Mechanism of Sphingomyelinase-Induced Hot-Cold Hemolysis.
Biochemistry. 47 (2008) 11222-11230. M. Alexander, Biomedicine (1977) 108-110.
Mulder E., de Gier J., Van Deenen L.L.M., Biochim Biophls Acta 70 (1962) 94-96.
DOI:11.1572/BBA133211
Mulder E., Van Den Berg J.W.O., Van Deenen L.L.M., Biochim. Biophys. Acta. 106
(1965) 118-125.
Neidlinger N.A., Larkin S.K., Bhagat A., Victorino G.P., Kuypers F.A., Hydrolysis of
phosphatidylserine-exposing red blood cells by secretory phospholipase A2 generates
lysophosphatidic acid and results in vascular dysfunction. J Biol Chem 281 (2006) 775-
781

125
Novgorodtseva T.P., Karaman Y.K., Zhukova N.V., Lobanova E.G., Antonyuk M.V.,
Kantur , Composition of fatty acids in plasma and erythrocytes and eicosanoids level in
patients with metabolic syndrome. Lipids Health Dis 10 (2011) 82-92.
Oliveira M.M., Vaughn M., Incorporation of fatty acids into phospholipids of
erythrocyte membranes. J Lipid Res 5 (1964)156-162.
Owen J.S., Bruckdorfer K.R., Day R.C., McIntyre N., Decreased erythrocyte membrane
fluidity and altered lipid composition in human liver disease. J Lipid Res. 23 (1982)
124-132.
Pala V., Krogh V., Muti P., Chajès V., Riboli E., Micheli A., Saadatian M., Sieri S.,
Berrino F., Erythrocyte Membrane Fatty Acids and Subsequent Breast Cancer: a
Prospective Italian Study. J Natl Cancer Inst 93 (2001) 1088-1095.
jnci.oxfordjournals.org/ content/93/14/1088.short.
Percy A.K., Schmell E., Earles B.J., Lennarz W.J., Phospholipid biosynthesis in the
membranes of immature and mature red blood cells. Biochemistry 12 (1973) 2456–
2461.
Philips G.B., Roome N.S., Proc Soc Exp Biol Med 100 (1959) 489-492.
Pianese P., Salvia G., Campanozzi A., D'Apolito O., Dello M. Russo A., Pettoello-
Mantovani G., Sterol profiling in red blood cell membranes and plasma of newborns
receiving total parenteral nutrition. J. Corso, Pediatr Gastroenterol Nutr 47 (2008) 645-
651.
Pittman J.G., Martin D.B.J., Clin Invest 45 (1966) 165-172. DOI: 10.1172/JCI105328
Pompeo G., Girasole M., Cricenti A., Boumis G., Bellelli A., Amiconi S., Erythrocyte
death in vitro induced by starvation in the absence of Ca(2+). Biochim Biophys Acta
1798 (2010) 1047-1055.
Poppitt S.D., Kilmartin P., Butler P., Keogh G.F., Assessment of erythrocyte
phospholipid fatty acid composition as a biomarker for dietary MUFA, PUFA or
saturated fatty acid intake in a controlled cross-over intervention trial. Lipids Health
Dis 4 (2005) 30-36.

126
Quehenberger O., Armando A.M., Brown A.H., Milne S.B., Myers D.S., Merrill A.H.,
Bandyopadhyay S., Jones K.N., Kelly S., et al., Lipidomics reveals a remarkable
diversity of lipids in human plasma. J Lipid Res 51 (2010):3299-3305.
Rioux V., Catheline D., Beauchamp E., Le Bloc'h J., Pédrono F., Legrand P.,
Substitution of dietary oleic acid for myristic acid increases the tissue storage of α-
linolenic acid and the concentration of docosahexaenoic acid in the brain, red blood
cells and plasma in the rat. Animal. 2 (2008) 636-644.
Rise P., Eligini S., Ghezzi S., et al., Fatty acid composition of plasma, blood cells and
whole blood: Relevance for the assessment of the fatty acid status in humans.
Prostaglandins Leukot Essent Fatty Acids 76 (2007) 363-369.
S.B. Shohet, D.G. Nathan, M.L. Karnovsky, Stages in the incorporation of fatty acids
into red blood cells. J Clin Invest 47 (1968) 1096-108.
Simons K., Ikonen E., Functional rafts in cell membranes. Nature 387 (1997) 569-572.
Siskind L.J., Fluss S., Bui M., Colombini M., Sphingosine Forms Channels in
Membranes That Differ Greatly from Those Formed by Ceramide. J Bioenerg
Biomembr 37 (2005) 227-236.
Skeaff C.M., Hodson L., McKenzie J.E., Dietary-induced changes in fatty acid
composition of human plasma, platelet, and erythrocyte lipids follow a similar time
course. J Nutr 136 (2006) 565-569.
Skipski V.P., Peterson R.F., Barclay M., Quantitative analysis of phospholipids by thin-
layer chromatography. Biochem. J 90 (1964) 374-378.
Smith E.L., Schuchman E.H., The unexpected role of acid sphingomyelinase in cell
death and the pathophysiology of common diseases. FASEB J. 22 (2008) 3419- 3431.
Smith W.L., Murphy R.C., Chapter 13, In Biochemistry of lipids, lipoproteins and
membranes (4th Edition) 2002; Vance DE and Vance JE Eds. Elsevier.

127
Sud M., Fahy E., Cotter D., Brown A., Dennis E.A., Glass C.K., Merrill A.H. Jr,
Murphy R.C., Raetz C.R., Russell D.W., Subramaniam S., LMSD: LIPID MAPS
structure database. Nucleic Acids Res. 35 (Database issue) (2007) D527-532.
Tani M., Ito M., Igarashi Y., Ceramide/sphingosine/sphingosine 1-phosphate
metabolism on the cell surface and in the extracellular space. Cell Signal 19 (2007)
229-237.
Tautenhahn R., Patti G.J., Rinehart D., Siuzdak G., XCMS Online: a web-based
platform to process untargeted metabolomic data. Anal Chem 84 (2012) 5035-5039.
Van Gastel C., Van Den Berg D., de Gier J., Van Deenen L.L.M., Some Lipid
Characteristics of Normal Red Blood Cells of Different Age. Brit. J Haematol 11 (1965)
193-199.
Ways P., Hanahan D.J., Characterization and quantification of red cell lipids in normal
man. Lipid Res 5 (1964) 318-328.
Xu R., Sun W., Jin J., Obeid L.M., Mao C., Role of alkaline ceramidases in the
generation of sphingosine and its phosphate in erythrocytes. FASEB J 24 (2010) 2507-
251.