evaluation of biodiesel fuel in an emd gp38-2 locomotive · csx no. 2629 at the swri locomotive...
TRANSCRIPT

May 2004 • NREL/SR-510-33436
Evaluation of Biodiesel Fuel in an EMD GP38-2 Locomotive
S.G. Fritz Southwest Research Institute San Antonio, Texas
National Renewable Energy Laboratory1617 Cole Boulevard, Golden, Colorado 80401-3393 303-275-3000 • www.nrel.gov
Operated for the U.S. Department of Energy Office of Energy Efficiency and Renewable Energy by Midwest Research Institute • Battelle
Contract No. DE-AC36-99-GO10337

ERRATA SHEET NREL REPORT/PROJECT NUMBER: SR-510-33436
TITLE: Evaluation of Biodiesel Fuel in an EMD GP38-2 Locomotive
AUTHOR(S): S.G. Fritz, Southwest Research Institute
ORIGINAL PUBLICATION DATE: May 2004
DATE OF CORRECTIONS: August 2012
The following corrections were made to this report/document:
Appendices A-F were not included in the original publication.
Corrections to appendix references have also been made. No other changes are included
in this revision.

May 2004 • NREL/SR-510-33436
Evaluation of Biodiesel Fuel in an EMD GP38-2 Locomotive
S.G. Fritz Southwest Research Institute San Antonio, Texas
NREL Technical Monitor: K.S. Tyson Prepared under Subcontract No. AXE-9-29057-01
National Renewable Energy Laboratory1617 Cole Boulevard, Golden, Colorado 80401-3393 303-275-3000 • www.nrel.gov
Operated for the U.S. Department of Energy Office of Energy Efficiency and Renewable Energy by Midwest Research Institute • Battelle
Contract No. DE-AC36-99-GO10337

NOTICE
This report was prepared as an account of work sponsored by an agency of the United States government. Neither the United States government nor any agency thereof, nor any of their employees, makes any warranty, express or implied, or assumes any legal liability or responsibility for the accuracy, completeness, or usefulness of any information, apparatus, product, or process disclosed, or represents that its use would not infringe privately owned rights. Reference herein to any specific commercial product, process, or service by trade name, trademark, manufacturer, or otherwise does not necessarily constitute or imply its endorsement, recommendation, or favoring by the United States government or any agency thereof. The views and opinions of authors expressed herein do not necessarily state or reflect those of the United States government or any agency thereof.
Available electronically at http://www.osti.gov/bridge
Available for a processing fee to U.S. Department of Energy and its contractors, in paper, from:
U.S. Department of Energy Office of Scientific and Technical Information P.O. Box 62 Oak Ridge, TN 37831-0062 phone: 865.576.8401 fax: 865.576.5728 email: mailto:[email protected]
Available for sale to the public, in paper, from: U.S. Department of Commerce National Technical Information Service 5285 Port Royal Road Springfield, VA 22161 phone: 800.553.6847 fax: 703.605.6900 email: [email protected] online ordering: http://www.ntis.gov/ordering.htm
Printed on paper containing at least 50% wastepaper, including 20% postconsumer waste

ACKNOWLEDGMENTS
The work reported in this document was performed for the National Renewable Energy Laboratory, as outlined in SwRI Proposal No. 08-25148a, titled “Biodiesel Emissions from a Locomotive Engine,” dated May 27, 1999. This project was performed by the Department of Emissions Research of the Automotive Products and Emissions Research Division under the supervision of Mr. Charles T. Hare. The Project Manager for SwRI was Mr. Steven G. Fritz, Principal Engineer in the Department of Emissions Research. SwRI technical personnel making significant contributions to the project were Mr. C. E. Grinstead, Research Technologist, Mr. S. Tenay, Senior Technician, Mr. C. Medelez, Lab Assistant, and Ms. Kathy Jack, Research Assistant.
The NREL technical contact was Dr. K. Shaine Tyson, Renewable Diesel Project Manager. The assistance of Mr. Ted Stewart of CSX Transportation for coordinating use of the EMD GP38-2 locomotive was greatly appreciated.
i

TABLE OF CONTENTS
Page
ACKNOWLEDGMENTS . . . . . . . . . . . . . . . . . . . . . . . . . . . . . . . . . . . . . . . . . . . . . . . . . . . . . . . i
LIST OF FIGURES . . . . . . . . . . . . . . . . . . . . . . . . . . . . . . . . . . . . . . . . . . . . . . . . . . . . . . . . . . . iii
LIST OF TABLES . . . . . . . . . . . . . . . . . . . . . . . . . . . . . . . . . . . . . . . . . . . . . . . . . . . . . . . . . . . . iii
LIST OF ABBREVIATIONS . . . . . . . . . . . . . . . . . . . . . . . . . . . . . . . . . . . . . . . . . . . . . . . . . . . iv
EXECUTIVE SUMMARY . . . . . . . . . . . . . . . . . . . . . . . . . . . . . . . . . . . . . . . . . . . . . . . . . . . . . . v
I. TECHNICAL APPROACH . . . . . . . . . . . . . . . . . . . . . . . . . . . . . . . . . . . . . . . . . . . . . . . . 1
A. Test Locomotive . . . . . . . . . . . . . . . . . . . . . . . . . . . . . . . . . . . . . . . . . . . . . . . . . . 1 B. EMD Engine Power Measurement . . . . . . . . . . . . . . . . . . . . . . . . . . . . . . . . . . . . 2 C. Fuel Consumption Measurement . . . . . . . . . . . . . . . . . . . . . . . . . . . . . . . . . . . . . . 3 D. Test Fuels . . . . . . . . . . . . . . . . . . . . . . . . . . . . . . . . . . . . . . . . . . . . . . . . . . . . . . . . 3 E. Exhaust Emissions Test Procedures . . . . . . . . . . . . . . . . . . . . . . . . . . . . . . . . . . . 6 F. Test Sequence . . . . . . . . . . . . . . . . . . . . . . . . . . . . . . . . . . . . . . . . . . . . . . . . . . . . 8
II. TEST RESULTS . . . . . . . . . . . . . . . . . . . . . . . . . . . . . . . . . . . . . . . . . . . . . . . . . . . . . . . . 9
III. CONCLUSIONS . . . . . . . . . . . . . . . . . . . . . . . . . . . . . . . . . . . . . . . . . . . . . . . . . . . . . . . 12
ii

LIST OF FIGURES
Figure Page
1 CSX No. 2629 at the SwRI Locomotive Test Center . . . . . . . . . . . . . . . . . . . . . . . . . . . . 1
2 550-Gallon Fuel Storage Tanks Located Next to Locomotive . . . . . . . . . . . . . . . . . . . . . 5
LIST OF TABLES
Table Page
ES-1 Summary of Locomotive Tests Using Biodiesel Fuel Blends . . . . . . . . . . . . . . . . . . . . . . v
1 EMD 16-645-E Engine Specifications . . . . . . . . . . . . . . . . . . . . . . . . . . . . . . . . . . . . . . . 2
2 Properties of Diesel Fuels Used in Locomotive Testing . . . . . . . . . . . . . . . . . . . . . . . . . . 4
3 Duty Cycles Used to Compute Weighted Composite Emissions . . . . . . . . . . . . . . . . . . . 7
4 Test Sequence . . . . . . . . . . . . . . . . . . . . . . . . . . . . . . . . . . . . . . . . . . . . . . . . . . . . . . . . . . 8
5 CSX No. 2629 Test Summary . . . . . . . . . . . . . . . . . . . . . . . . . . . . . . . . . . . . . . . . . . . . . 10
iii

LIST OF ABBREVIATIONS
AAR Association of American RailroadsAPI American Petroleum InstituteASTM American Society for Testing and MaterialsBSFC brake specific fuel consumptionBTU British Thermal UnitsCFR Code of Federal Regulationscm centimeterCO carbon monoxideCO2 carbon dioxidecSt centistokesEMD Electro-Motive Division of General Motors CorporationEP end pointEPA Environmental Protection Agency°F degrees Fahrenheitf/a mass fuel to dry air ratioFBP final boiling pointFTP Federal Test Procedureg gramgal gallonH2O waterHC hydrocarbonsHFID heated flame ionization detectorhp horsepowerhr hourIBP initial boiling pointin inchkW kilowattlb poundmin minutemm millimeterNREL National Renewable Energy LaboratoryNDIR non-dispersive infraredNOX oxides of nitrogenO2 OxygenPHS Public Health ServicePM particulate matterrpm revolutions per minutesec secondsSwRI Southwest Research InstituteTDC top dead centerwt weight% percent
iv

EXECUTIVE SUMMARY
This report documents results of fuel consumption and exhaust emission tests performed on a 2,000 hp EMD GP38-2 locomotive operating on four different fuels. No operational problems were observed by SwRI on any of the test fuels, and the locomotive engine was able to produce within 1% to 2% of full rated power while operating on the biodiesel blends. Locomotive tests were performed at the SwRI Locomotive Exhaust Emissions Test Center in October, 2000.
Table ES-1 summarizes the average EPA Line-Haul and Switch duty-cycle weighted exhaust emissions from triplicate tests using a diesel fuel meeting EPA locomotive certification test specifications, on a CARB diesel fuel, with a blend of 20% bio-fuel into the EPA locomotive certification fuel (B20), and a second blend of 20 percent bio-fuel with the CARB diesel (C20). The 4% to 6% increase in NOX emissions with B20 fuel compared to EPA locomotive certification diesel is consistent with B20 tests performed in other engine test programs. The lack of PM response with any of the test fuels is attributed to the fact that most of the PM emissions from this two-stroke EMD engine are lubricating-oil derived. Long term durability and reliability were not addressed in this study.
Table ES-1. Summary of Locomotive Tests Using Biodiesel Fuel Blends
Fuel HC CO NOX PM
EPA Line-Haul Duty-Cycle Weighted Emissions, g/hp-hr a
EPA Loco. Cert. Diesel 0.64 5.4 12.4 0.46
CARB diesel 0.64 4.3 12.3 0.46
B20 0.64 4.5 13.1 0.50
C20 0.64 4.0 12.8 0.48
EPA Switch Duty-Cycle Weighted Emissions, g/hp-hr a
EPA Loco. Cert. Diesel 0.82 2.2 12.8 0.38
CARB diesel 0.76 1.8 12.5 0.34
B20 0.78 2.0 13.5 0.37
C20 0.73 1.8 13.1 0.37 a Average of three runs on each fuel.
v

I. TECHNICAL APPROACH
Locomotive exhaust emission tests for this project were performed by Southwest Research Institute (SwRI) at the Locomotive Exhaust Emissions Test Center in San Antonio, Texas. This facility was established in August 1993 in cooperation with the Association of American Railroads (AAR).
Presented below is an overview of the technical approach used to conduct locomotive exhaust emissions testing. Included is a description of the locomotive selected for testing, engine power measurements, fuel consumption measurements, the test fuels, exhaust emissions test procedures, analytical procedures, particulate measurement procedures, and smoke opacity test procedures.
A. Test Locomotive
The locomotive tested in this project was CSX No. 2629, a model GP38-2, manufactured in 1973 by the Electro-Motive Division (EMD) of General Motors Corporation. CSX No. 2629 shown in Figure 1, is generally classified as a “road-switcher” locomotive, meaning it serves as a local switcher locomotive as well as a line-haul locomotive.
FIGURE 1. CSX NO. 2629 at the SWRI Locomotive Test Center
The GP-38 locomotive was equipped with a 2,000 hp roots-blown EMD model 16-645-E diesel engine (SN 84-B3-1505). Table 1 gives the specifications for the EMD engine. Immediately
-1-

before shipping the locomotive to SwRI, the locomotive was serviced at CSX’s Cumberland, Maryland shop. Service included replacing the fuel injectors, changing the fuel, lubricating oil and engine intake air filters, and changing the engine lubricating oil.
Table 1. EMD 16-645-E Engine Specifications
Type 2-stroke, uniflow scavenged diesel
Aspiration
Bore, in. (mm)
Stroke, in. (mm)
No. of Cylinders
Displacement, cu. in./cyl. (L)
Total displacement cu. in. (L)
Compression Ratio
Fuel Injection System
Rated Power, bhp (kW)
Rated Speed, rpm
roots-blown, non-turbocharged
9 1/16 (230)
10 (254)
16
645 (10.6)
10,320 (169.1)
16:1
Unit Injector
2,000 (1,491)
900
B. EMD Engine Power Measurement
Most line-haul locomotives are equipped with the “dynamic brake” feature in which the electric motors used for traction are reverse-excited to become generators for slowing the train. The electrical power generated is dissipated in resistance grids. Locomotives with the self-load feature can dissipate the main alternator power into these “dynamic brake” resistance grids. The CSX locomotive tested in this program was equipped with dynamic brake grids capable of dissipating the full engine power, and these grids were used to load the stationary locomotive.
Engine flywheel (gross) power was determined by direct measurement of the main alternator voltage and current, plus auxiliary power values obtained from load box testing procedures published by EMD. EPA locomotive test procedures call for direct measurement of main generator voltage and current, and for the manufacturer to apply a known generator efficiency to calculate gross power. In this case, a single alternator efficiency of 93.9%was used for all test points, following EMD load box testing procedures. Power for the various auxiliary systems (auxiliary generator, traction motor blower, inertial separator blower, and radiator fans) was computed using published EMD test procedures. The air compressor on the locomotive was disabled during testing, and compressed air was supplied to the locomotive.
Power and fuel rates were recorded as observed values. Corrected brake-specific fuel
-2-

consumption (BSFC) values were computed using published EMD power correction factors. Observed power was used to report brake-specific exhaust emissions in g/hp-hr.
C. Fuel Consumption Measurement
Fuel consumption was measured on a mass basis, using a mass flow meter. The system was equipped with a heat exchanger to control fuel supply temperature to 90±10°F. Hot return fuel, which would normally return to the locomotive on-board fuel tank, was cooled before returning to the fuel measurement reservoir (“day tank”) to assure a consistent fuel supply temperature at the engine.
D. Test Fuels
Four fuels were included in this study, and selected properties of the fuels are summarized in Table 2. Baseline tests were performed using diesel fuel meeting EPA specifications for locomotive emissions test fuel given in the Code of Federal Regulations, Title 40, Part 92, Section 92.113. This “locomotive cert fuel” had a sulfur content of 0.30 percent, which is the midpoint of the EPA specification of 0.2%to 0.4% sulfur for locomotive testing. Table 2 also gives the specifications for EPA locomotive test fuel.
The second fuel used in this program was a “CARB fuel.” This fuel was used in a recently completed locomotive fuel-effects program performed by SwRI for CARB.1 The “CARB” fuel was a 50/50 blend of two commercially available CARB-approved fuels, one batch was from the Texaco refinery in Los Angeles, California, and the second batch was from the ARCO refinery in South Gate, California. The properties of the CARB fuel, as reported in Table 2, were considered by ARB to be representative of commercially available on-highway fuel sold in California.
The third and fourth fuels tested in this program were 20% blends (by volume) bio-fuel blended into the two different base fuels. These are referred to as “B20,” which was 20% bio-fuel blended with the “locomotive cert fuel,” and “C20," which was 20% biodiesel blended with the CARB diesel fuel.
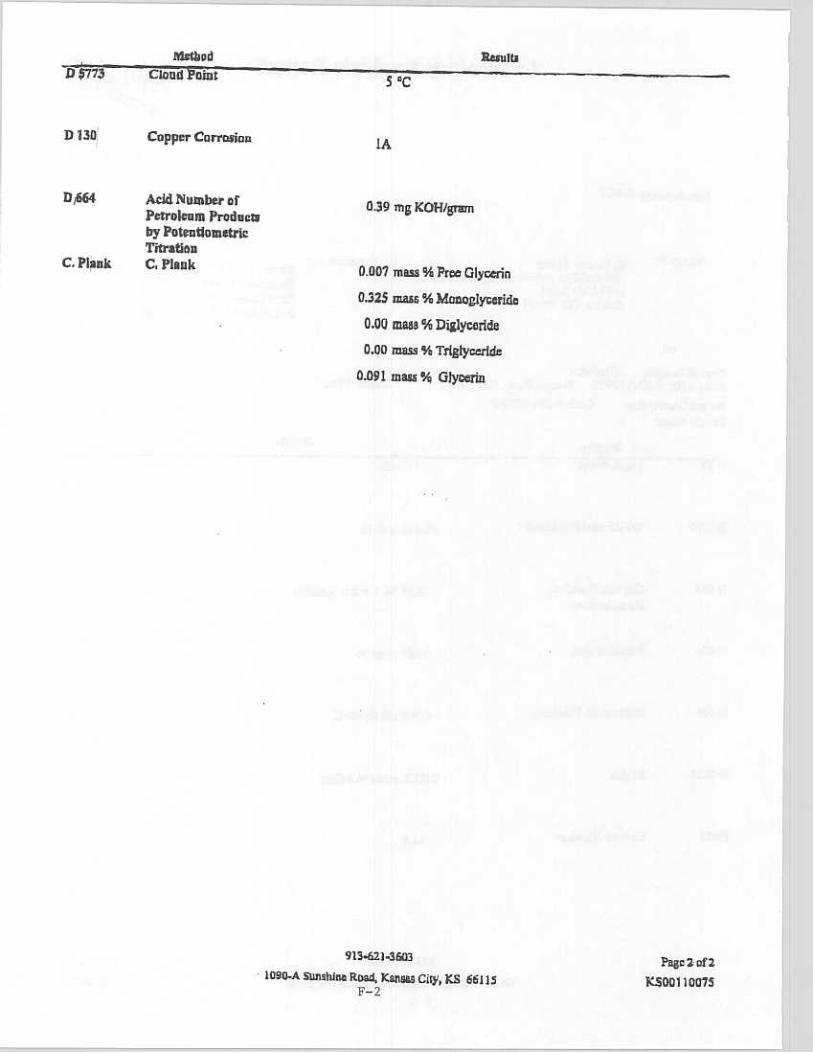
The bio-fuel used in this program was supplied by Griffin Industries, Inc. of Cold Spring, Kentucky. Eleven 55-gallon drums of Bio “G-3000™” were supplied to SwRI for blending. Blended fuels were stored in 550-gallon totes that were located next to the locomotive, as shown in Figure 2.
1 Fritz, S.G., “Diesel Fuel Effects on Locomotive Exhaust Emissions,” SwRI Report No. 08-02062 (October 2000).
-3-
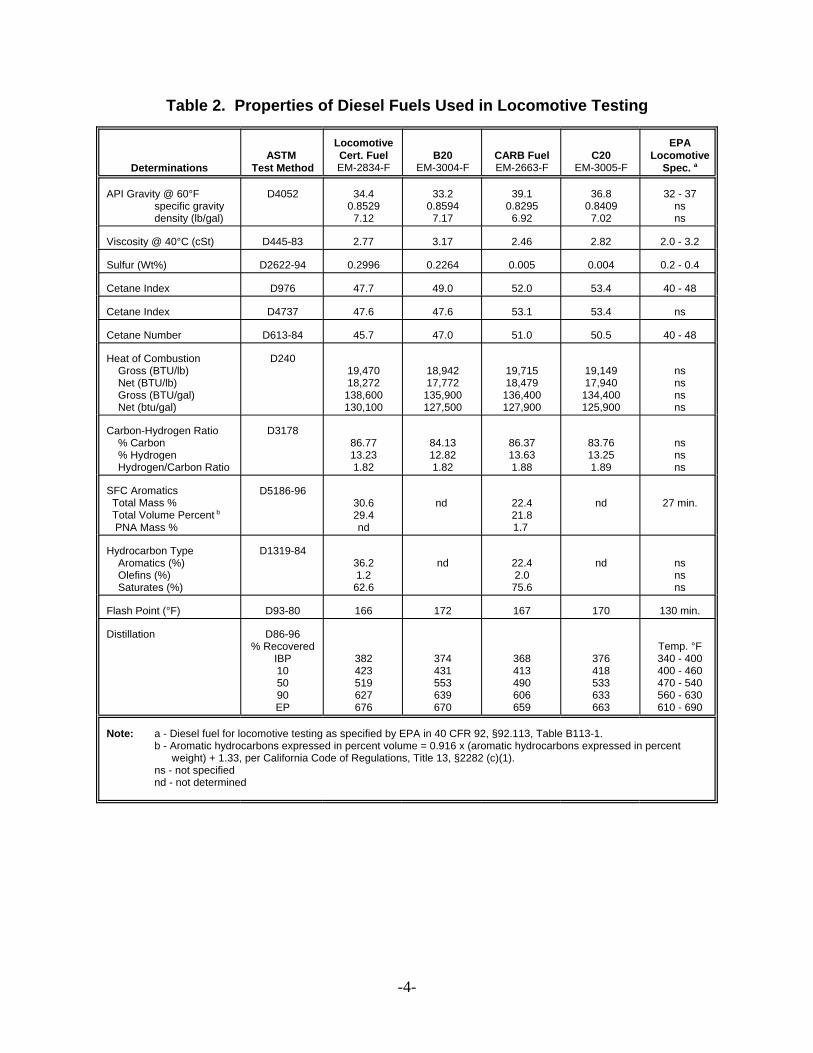
Table 2. Properties of Diesel Fuels Used in Locomotive Testing
Determinations ASTM
Test Method
Locomotive Cert. Fuel EM-2834-F
B20 EM-3004-F
CARB Fuel EM-2663-F
C20 EM-3005-F
EPA Locomotive
Spec. a
API Gravity @ 60°F specific gravity density (lb/gal)
D4052 34.4 0.8529
7.12
33.2 0.8594
7.17
39.1 0.8295
6.92
36.8 0.8409
7.02
32 - 37 ns ns
Viscosity @ 40°C (cSt) D445-83 2.77 3.17 2.46 2.82 2.0 - 3.2
Sulfur (Wt%) D2622-94 0.2996 0.2264 0.005 0.004 0.2 - 0.4
Cetane Index D976 47.7 49.0 52.0 53.4 40 - 48
Cetane Index D4737 47.6 47.6 53.1 53.4 ns
Cetane Number D613-84 45.7 47.0 51.0 50.5 40 - 48
Heat of Combustion Gross (BTU/lb) Net (BTU/lb) Gross (BTU/gal) Net (btu/gal)
D240 19,470 18,272
138,600 130,100
18,942 17,772
135,900 127,500
19,715 18,479
136,400 127,900
19,149 17,940
134,400 125,900
ns ns ns ns
Carbon-Hydrogen Ratio % Carbon % Hydrogen Hydrogen/Carbon Ratio
D3178 86.77 13.23 1.82
84.13 12.82 1.82
86.37 13.63 1.88
83.76 13.25 1.89
ns ns ns
SFC Aromatics Total Mass % Total Volume Percent b
PNA Mass %
D5186-96 30.6 29.4 nd
nd 22.4 21.8 1.7
nd 27 min.
Hydrocarbon Type Aromatics (%) Olefins (%) Saturates (%)
D1319-84 36.2 1.2
62.6
nd 22.4 2.0
75.6
nd ns ns ns
Flash Point (°F) D93-80 166 172 167 170 130 min.
Distillation D86-96 % Recovered
IBP 10 50 90 EP
382 423 519 627 676
374 431 553 639 670
368 413 490 606 659
376 418 533 633 663
Temp. °F 340 - 400 400 - 460 470 - 540 560 - 630 610 - 690
Note: a - Diesel fuel for locomotive testing as specified by EPA in 40 CFR 92, §92.113, Table B113-1. b - Aromatic hydrocarbons expressed in percent volume = 0.916 x (aromatic hydrocarbons expressed in percent
weight) + 1.33, per California Code of Regulations, Title 13, §2282 (c)(1). ns - not specified nd - not determined
-4-

Figure 2. 550-Gallon Fuel Storage Tanks Located Next to Locomotive
-5-

E. Exhaust Emissions Test Procedure
Exhaust emission tests were performed using the locomotive Federal Test Procedure (FTP) detailed in the U.S. Code of Federal Regulations (CFR), Title 40, Part 92, “Emission Standards for Locomotives and Locomotive Engines.”
1. Gaseous Emissions Sampling
A gaseous sample probe was designed using EPA locomotive test specifications. Gaseous emissions were sampled within the exhaust stack extension installed on the roof of the locomotive. A heated line was used to transfer the raw exhaust sample to the emission instruments for analysis. Measured gaseous emissions included hydrocarbons (HC), carbon monoxide (CO), carbon dioxide (CO2), oxygen (O2), and oxides of nitrogen (NOX).
The hydrocarbon concentration in the raw exhaust was determined using a Rosemount Analytical model 402 heated flame ionization detector (HFID), calibrated on propane. NOX concentration in the raw exhaust was measured with a Rosemount model 955 chemiluminescent analyzer. NOX correction factors for engine intake manifold air temperature and ambient air humidity were applied as specified by EPA in 40 CFR §86.132(d). Concentrations of CO and CO2 in the raw exhaust were determined by non-dispersive infrared (NDIR) instruments.
Gaseous mass emission rates were computed using the measured concentration, the observed (measured) fuel consumption rate, and calculated engine air flow. Following the FTP, engine air flow was not directly measured in this test program. Instead, engine air flow was determined using a carbon balance of the carbon-containing constituents in the exhaust (CO2, CO, and HC) to compute the fuel/air ratio (f/a). Engine air flow rate was then computed using the measured fuel consumption rate and the computed f/a ratio.
2. Particulate Emissions Sampling
Particulate emissions were measured at each test point using a “split then dilute” technique, in which a portion of the raw locomotive exhaust was “split” from the total exhaust and mixed with filtered dilution air in a 10-inch diameter dilution tunnel. The split sample of raw exhaust was transferred to the dilution tunnel through a 2-inch diameter stainless steel tube that was insulated and electrically heated to 375°F. Using filtered dilution air, the raw exhaust was diluted and the temperature reduced to less than 125°F before sampling for particulate emissions.
A particulate sample was extracted from the dilution tunnel through sample probes fitted with stainless steel filter holders. Particulate was accumulated on 90 mm fluorocarbon-coated glass fiber filters (Pallflex T60A20) at a target filter face velocity of 70 cm/s. Following the FTP, PM sampling began ten seconds after a throttle notch change, and continued for five minutes. Particulate filters were preconditioned and weighed before and after testing, following the FTP. The particulate mass emission rate was computed using the increase of mass on the filters, the volume of dilute exhaust drawn through the filters, and dilution air and raw exhaust flow parameters (fuel and computed air flow).
-6-

3. Smoke Opacity Test Procedures
Smoke opacity was measured using a modified Public Health Service (PHS) full-flow opacity meter (smokemeter) mounted above one of the two locomotive exhaust stacks. This smokemeter used standard PHS smokemeter optics and electronics, but was modified to a 20-inch diameter to accommodate larger exhaust plume diameters. The construction, calibration, and operation of the smokemeter adhered to the FTP.
The smokemeter was aligned with the long axis of the rectangular exhaust stack, resulting in a through-exhaust path length of approximately 14 inches (as determined by the dimensions of the exhaust stack extension). The center of the light beam was positioned 5±1 inches above the outlet of the exhaust stack extension. The smokemeter control unit was located in the control building. Voltage output proportional to opacity was recorded on a strip chart, along with engine speed. Smoke opacity was continuously monitored during the EPA Locomotive Test Sequence.
4. Duty-Cycle Weighting Factors
Table 3 gives the weighting factors for the two duty cycles applied to the individual notch data points to compute “EPA Line-Haul” and “EPA Switch” duty-cycle weighted composite results. The two EPA cycles are specified in Table B132-1 of §92.131 of CFR Title 40, Part 92 of the FTP.
Table 3. Duty Cycles Used to Compute Weighted Composite Emissions
Throttle Notch Setting EPA Line-Haul Cycle EPA Switch
Cycle Low Idle
Idle
Dynamic Brake
Notch 1
Notch 2
Notch 3
Notch 4
Notch 5
Notch 6
Notch 7
19.0 % 29.9 %
19.0 % 29.9 %
12.5 % 0.0 %
6.5 % 12.4 %
6.5 % 12.3 %
5.2 % 5.8 %
4.4 % 3.6 %
3.8 % 3.6 %
3.9 % 1.5 %
3.0 % 0.2 %
Notch 8 16.2 % 0.8 %
TOTAL 100.0 % 100.0 %
-7-

1
2
3
4
5
6
7
8
9
10
11
12
F. Test Sequence
One problem commonly reported with the use of biodiesel fuels in older engines is fuel filter plugging resulting from the solvent nature of the biodiesel, removing accumulated deposits, gum, and varnish from the fuel system. Filter plugging usually occurs only once, after the initial removal of deposits. In anticipation of this potential problem with the nearly 30-year locomotive, SwRI ran the locomotive on neat bio-fuel for approximately two hours at rated power, then shut the locomotive engine down with the neat bio-fuel in the fuel system. The next morning, the locomotive was restarted and run for another hour on neat bio-fuel. Although no operational problems were noticed during this fuel system conditioning, as a precautionary measure, the primary and secondary fuel filters on the locomotive were replaced before beginning the fuel-effects testing.
Triplicate tests were run on each of the four test fuels. The test sequence was randomized to minimize potential bias due to ambient temperature, humidity, and barometric pressure changes during the test program. Table 4 gives the test sequence used.
Table 4. Test Sequence
Test Number Fuel Run Number
EPA 1 / 3
B20 1 / 3
C20 1 / 3
CARB 1 / 3
CARB 2 / 3
B20 2 / 3
EPA 2 / 3
C20 2 / 3
C20 3 / 3
CARB 3 / 3
B20 3 / 3
EPA 3 / 3
-8-

II. TEST RESULTS
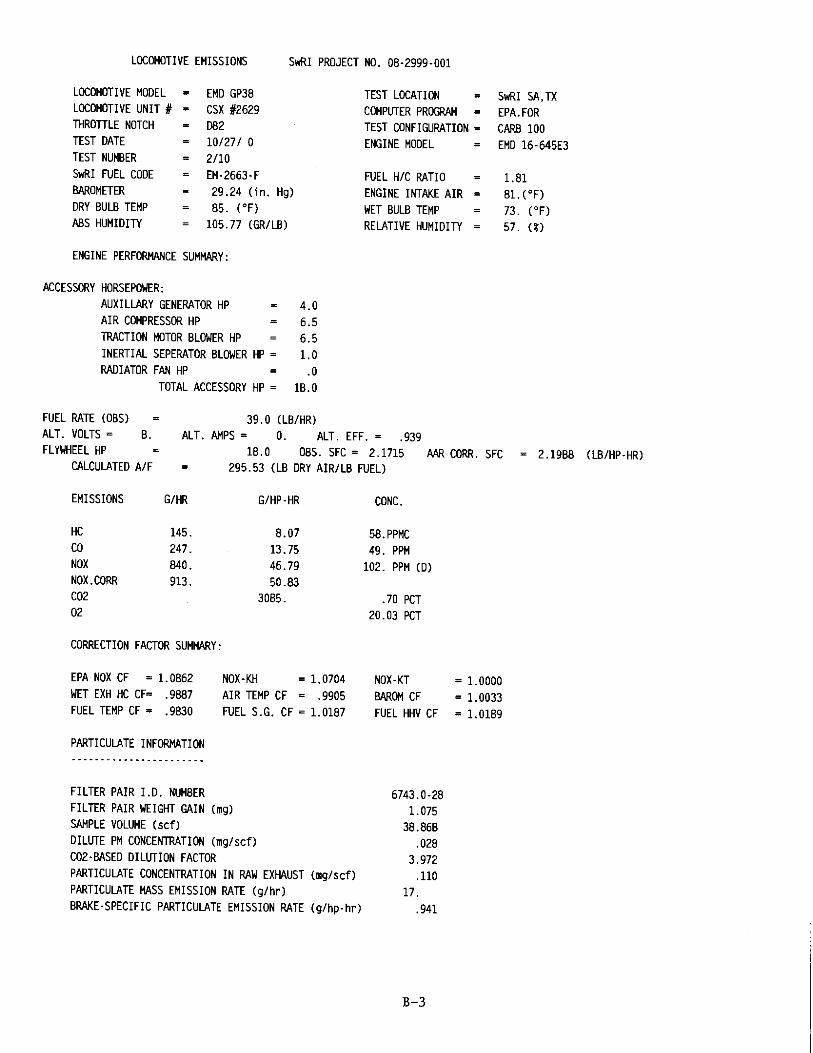
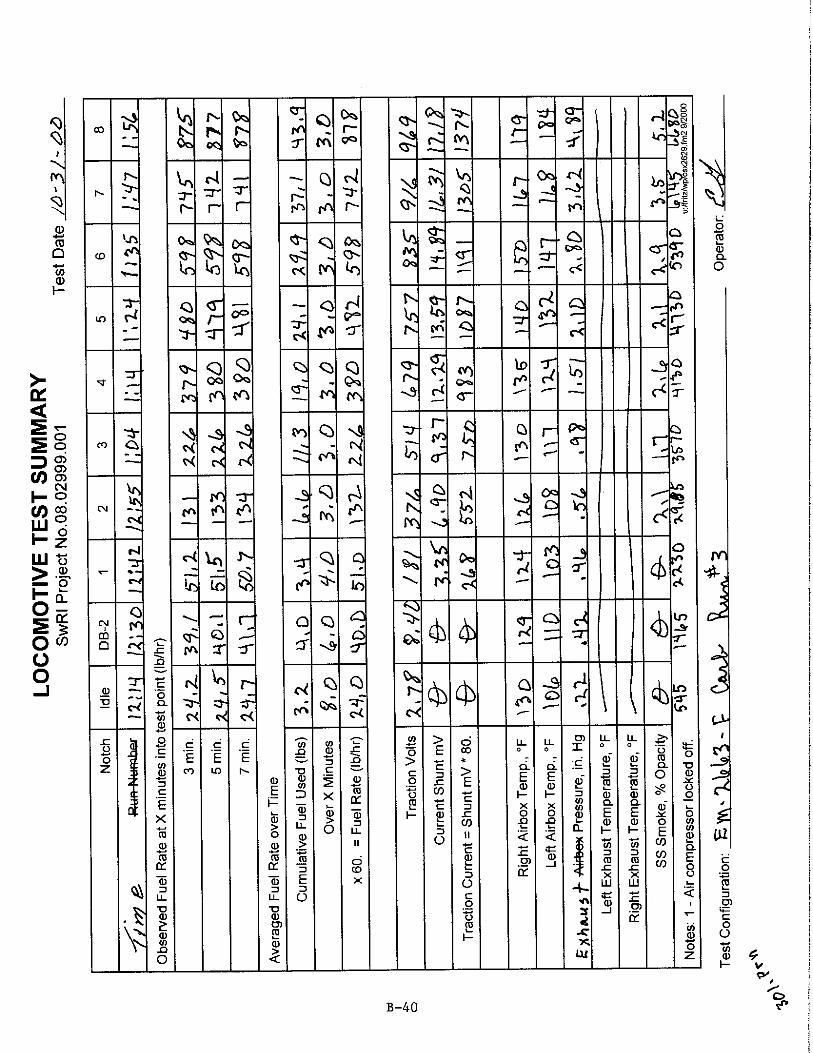
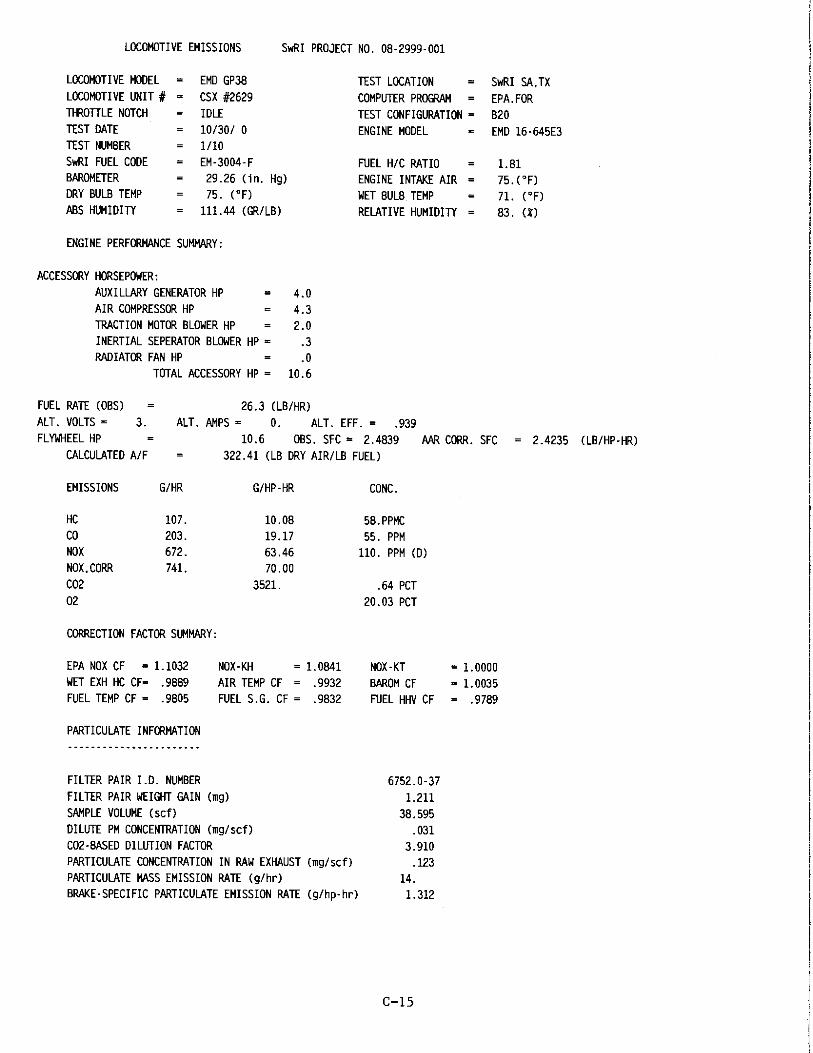
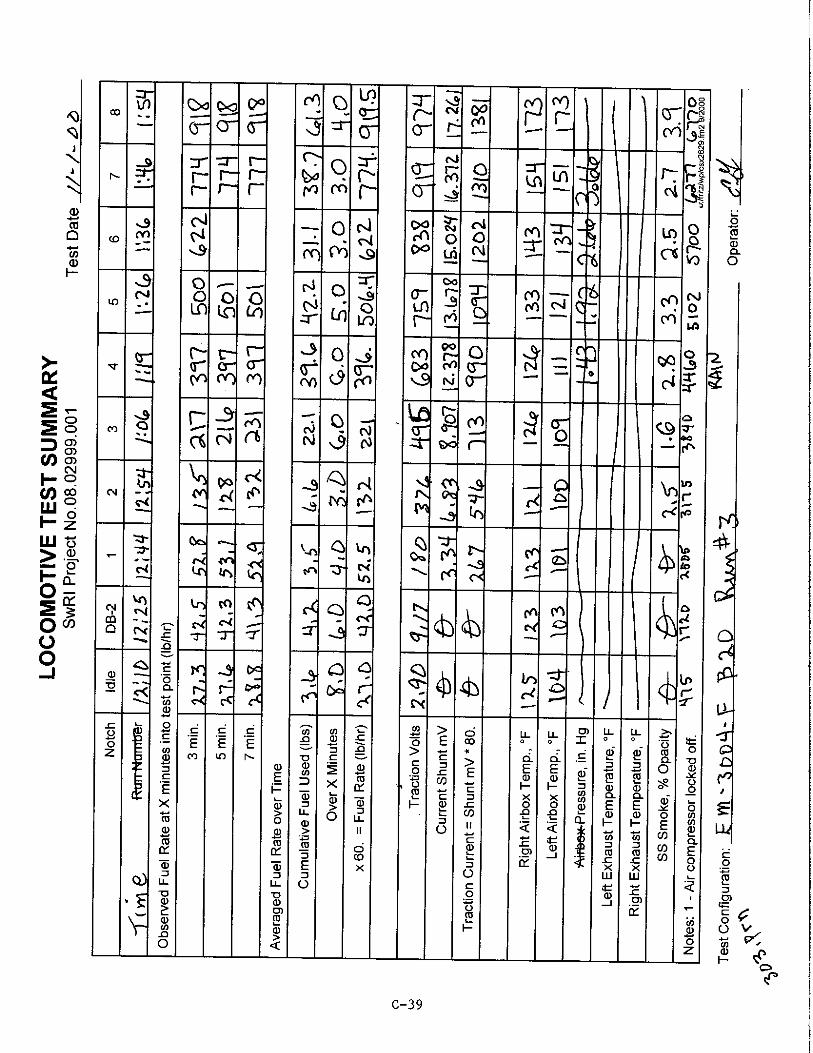
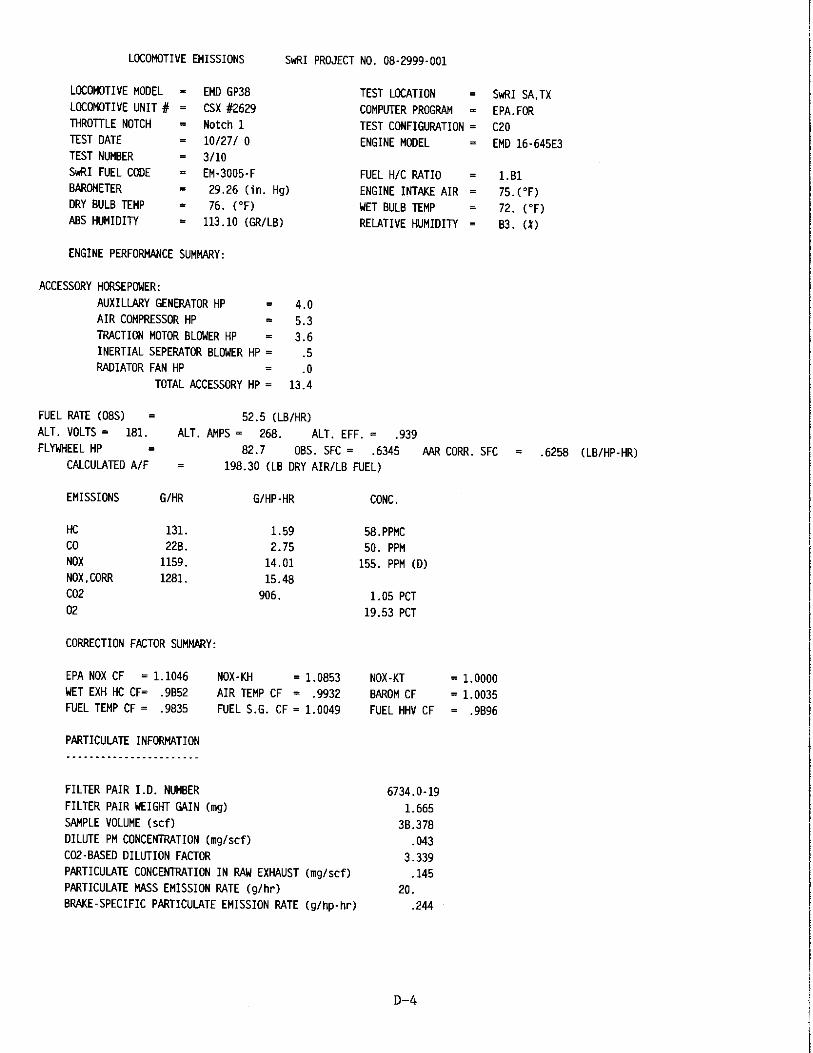
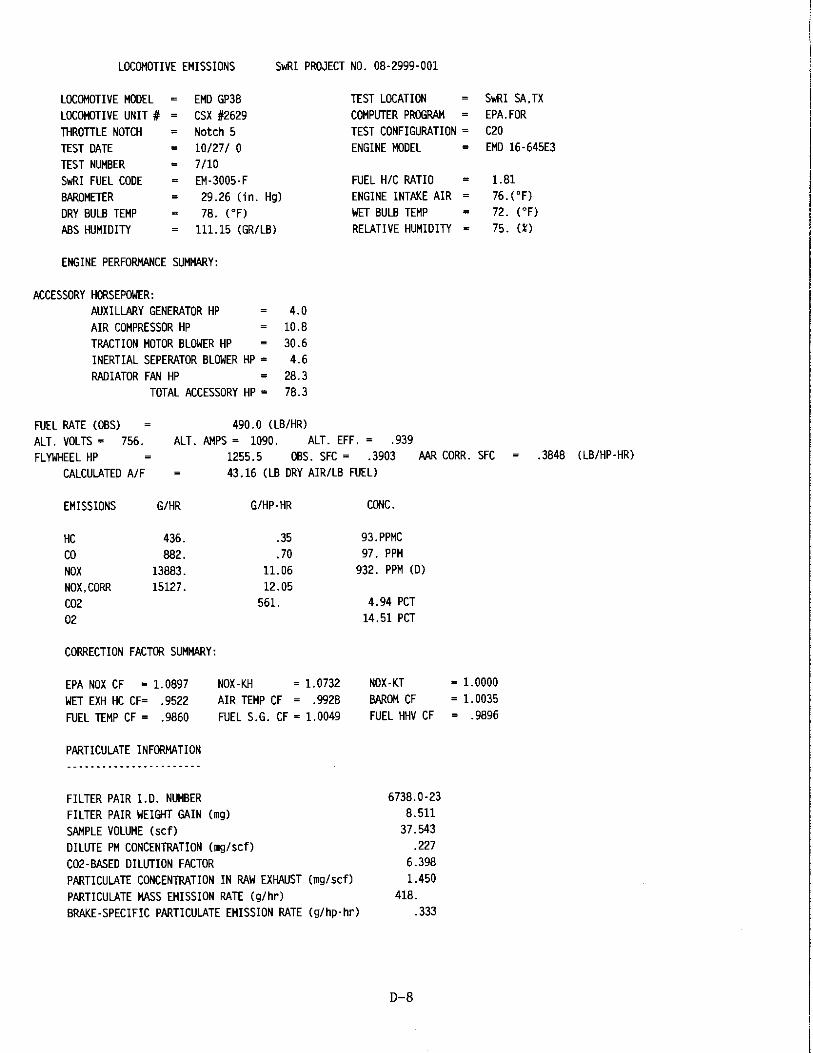
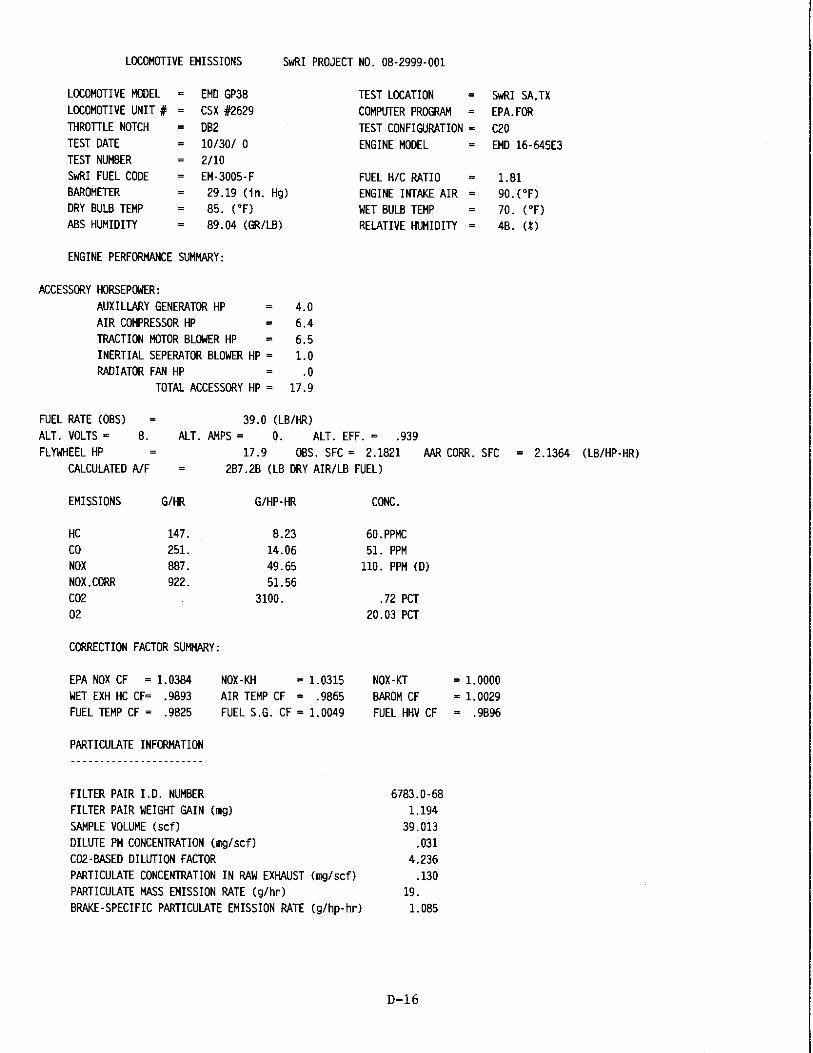
Table 5 summarizes duty-cycle weighted results from each of the triplicate tests performed on the four fuels. Detailed test results are given in Appendices A through F. Table 5 includes both EPA Line-Haul and Switch duty cycle composite brake-specific emissions of HC, CO, NOX, and PM, and AAR-corrected brake-specific fuel consumption. Average results for the triplicate runs are given for each fuel, along with the coefficient of variation (cov). At the bottom of Table 5, the average percentage change between fuels is reported. No formal statistical analysis of the data was performed to establish statistically significant differences.
Observations of the data in Table 5 show that the use of the CARB diesel reduced NOX by one percent on the Line-Haul cycle and by two percent on the Switch cycle, compared to the baseline EPA locomotive certification fuel. This level of NOX reduction is notably smaller than the four to six percent reduction in the average Line-Haul cycle NOX measured by SwRI in three 4,000 hp, turbocharged, EMD 710 engines in a study for CARB, using the same batch of CARB fuel.2
B20 fuel increased NOX by six percent on the Line-Haul cycle and by five percent on the Switch cycle, compared to the baseline EPA locomotive certification fuel. This NOX increase is in the range noted for other diesel engine studies using B20 fuel. Comparing C20 to CARB fuel, NOX increased by four percent for both cycles. Comparing C20 to the baseline EPA locomotive certification fuel, the NOX increase associated with the biodiesel is partially offset with the NOX reduction associated with the CARB fuel, resulting in a NOX increase of three percent on the Line-Haul cycle and two percent on the Switch cycle.
PM emissions for this locomotive engine were generally unresponsive to fuel type, with small changes likely due to test-to-test variability. Because PM emissions from two-stroke EMD engines are dominated by lubricating-oil derived components, the influence of fuel type is relatively small. In the CARB locomotive fuel effects study, the soluble organic fraction (SOF) of PM emissions from the turbocharged EMD engines accounted for about 75 percent of total PM. Although no SOF analyses were performed on the PM samples in this project, non-turbocharged EMD engines, like that tested in this project, typically have higher brake-specific lubricating oil consumption than their turbocharged counterparts, suggesting that the SOF of PM would be even higher than observed for the turbocharged engines.
Hydrocarbon emissions also were generally unresponsive to fuel type using the Line-Haul cycle, but some reductions on the Switch cycle were noted with all three fuels compared to the EPA certification fuel, although the changes were likely not be statistically significant.
2 “S. G. Fritz, “Diesel Fuel Effects on Locomotive Exhaust Emissions,” SwRI Final Report 08-02062 (October 2000), prepared for the California Air Resources Board.
-9-

Table 5. CSX No 2629 Test Summary
EPA Line-Haul Duty Cycle EPA Switch Duty Cycle
HC g/hp-hr
CO g/hp-hr
NOx g/hp-hr
PM g/hp-hr
AAR Corr. BSFC
lb/hp-hr
HC g/hp-hr
CO g/hp-hr
NOx g/hp-hr
PM g/hp-hr
AAR Corr. BSFC
lb/hp-hr
EPA Cert Baseline #1/3 0.71 5.9 11.9 0.47 0.433 0.87 2.4 12.7 0.37 0.464
EPA Cert Baseline #2/3 0.62 5.1 12.3 0.49 0.435 0.80 2.2 12.9 0.42 0.474
EPA Cert Baseline #3/3 0.58 5.1 12.9 0.44 0.434 0.78 2.1 12.9 0.36 0.460
Average 0.64 5.4 12.4 0.46 0.434 0.82 2.2 12.8 0.38 0.466
c.o.v. 10% 9% 4% 5% 0% 6% 7% 1% 8% 2%
CARB #1/3 0.63 4.6 12.2 0.48 0.431 0.78 1.8 12.7 0.34 0.467
CARB #2/3 0.62 4.7 12.0 0.46 0.429 0.77 1.9 12.3 0.35 0.457
CARB #3/3 0.67 3.7 12.6 0.45 0.433 0.72 1.6 12.7 0.32 0.466
Average 0.64 4.3 12.3 0.46 0.431 0.76 1.8 12.5 0.34 0.463
c.o.v. 4% 13% 3% 4% 0% 4% 6% 2% 5% 1%
B20 #1/3 0.66 5.3 12.6 0.48 0.430 0.78 2.2 13.4 0.36 0.462
B20 #2/3 0.63 4.2 13.0 0.55 0.431 0.73 2.0 13.4 0.38 0.468
B20 #3/3 0.64 3.9 13.6 0.46 0.434 0.82 1.9 13.8 0.38 0.470
Average 0.64 4.5 13.1 0.50 0.432 0.78 2.0 13.5 0.37 0.467
c.o.v. 2% 17% 3% 10% 0% 6% 9% 2% 3% 1%
C20 #1/3 0.63 4.2 12.9 0.49 0.434 0.75 1.9 13.1 0.36 0.468
C20 #2/3 0.63 3.9 12.8 0.48 0.431 0.80 1.8 13.3 0.39 0.473
C20 #3/3 0.67 3.9 12.8 0.48 0.432 0.73 1.8 13.1 0.37 0.467
Average 0.64 4.0 12.8 0.48 0.432 0.73 1.8 13.1 0.37 0.467
c.o.v. 4% 4% 1% 2% 0% 11% 3% 2% 5% 1%
Average Percent Change from Average EPA Cert. Diesel Baseline
CARB vs. EPA Cert. 1% -19% -1% 0% -1% -7% -21% -2% -12% -1%
B20 vs EPA Cert. 1% -17% 6% 7% -1% -5% -10% 5% -3% 0%
C20 vs EPA Cert 1% -26% 3% 4% 0% -11% -19% 2% -5% 0%
C20 vs. CARB 1% -8% 4% 4% 0% -4% 2% 4% 8% 1%
C20 vs. B20 0% -11% -2% -2% 0% -6% -10% -3% -2% 0%
Carbon monoxide (CO) emissions were reduced on both cycles for all three fuels compared to the EPA certification fuel, although again, the changes may not be statistically significant beyond test-to-test variability.
Table 5 also includes AAR-corrected brake-specific fuel consumption results. SwRI used published AAR corrections for ambient air temperature, barometric pressure, fuel temperature, fuel specific gravity, and fuel heating value to compute “AAR-corrected” brake-specific fuel
-10-

consumption from observed values. Results given in Table 5 show that there was essentially no change in the AAR-corrected brake-specific fuel consumption results between the four test fuels.
Compared to the baseline EPA certification fuel, locomotive power output was 1.7 percent lower with the CARB fuel, 0.9 percent lower with the B20 fuel, and 2.4 percent lower with the C20 fuel. The power reductions observed are due to the lower volumetric heating value of the fuels (see Table 2), and that fact that the engine load control system on the GP38-2 locomotive essentially sets to a fixed volumetric fuel rate at each notch position.
Smoke opacity from this type of locomotive engine is characteristically very low, in most cases below the five percent threshold of visibility. Smoke test results show that CSX No. 2629 had very low smoke opacity during steady-state conditions, and during throttle notch changes, and that there was no appreciable change in smoke opacity between the four test fuels.
-11-
III. CONCLUSIONS
Exhaust emissions and fuel consumption testing was performed on an EMD GP38-2 locomotive operating on a 20-percent by volume biodiesel blended into EPA locomotive certification diesel fuel and into CARB diesel fuel. No operational problems were observed by SwRI on any of the test fuels, and the locomotive engine was able to produce within 1 to 2 percent of full rated power while operating on the biodiesel blends. Long term durability and reliability were not addressed in this study.
The 5 to 6 percent increase in NOX emissions with B20 fuel compared to EPA locomotive certification diesel was consistent with B20 tests performed in other engine test programs. The lack of PM response with any of the test fuels is attributed to the fact that most of the PM emissions from this mode of two-stroke EMD engine are lubricating-oil derived.
The EMD 645E engine is arguably the most likely candidate for use of biodiesel-blended fuels by the freight railroads, as the 645E engine is used extensively in switcher and road-switcher applications, where they are likely to be centrally fueled, and operated in urban areas. However, a roots-blown (non-turbocharged) EMD 645E locomotive engine may not have been the best choice for demonstrating fuel effects on PM emissions, due to the dominance lubricating oil consumption has on the PM emissions from these engines.
-12-


E-1


REPORT DOCUMENTATION PAGE Form Approved OMB No. 0704-0188
The public reporting burden for this collection of information is estimated to average 1 hour per response, including the time for reviewing instructions, searching existing data sources, gathering and maintaining the data needed, and completing and reviewing the collection of information. Send comments regarding this burden estimate or any other aspect of this collection of information, including suggestions for reducing the burden, to Department of Defense, Washington Headquarters Services, Directorate for Information Operations and Reports (0704-0188), 1215 Jefferson Davis Highway, Suite 1204, Arlington, VA 22202-4302. Respondents should be aware that notwithstanding any other provision of law, no person shall be subject to any penalty for failing to comply with a collection of information if it does not display a currently valid OMB control number. PLEASE DO NOT RETURN YOUR FORM TO THE ABOVE ADDRESS. 1. REPORT DATE (DD-MM-YYYY) 2. REPORT TYPE 3. DATES COVERED (From - To)
4. TITLE AND SUBTITLE 5a. CONTRACT NUMBER
5b. GRANT NUMBER
5c. PROGRAM ELEMENT NUMBER
6. AUTHOR(S) 5d. PROJECT NUMBER
5e. TASK NUMBER
5f. WORK UNIT NUMBER
7. PERFORMING ORGANIZATION NAME(S) AND ADDRESS(ES) 8. PERFORMING ORGANIZATION REPORT NUMBER
9. SPONSORING/MONITORING AGENCY NAME(S) AND ADDRESS(ES) 10. SPONSOR/MONITOR'S ACRONYM(S)
11. SPONSOR/MONITOR'S REPORT NUMBER(S)
12. DISTRIBUTION/AVAILABILITY STATEMENT
13. SUPPLEMENTARY NOTES
14. ABSTRACT
15. SUBJECT TERMS
16. SECURITY CLASSIFICATION OF: 17. LIMITATION OF ABSTRACT
18. NUMBER OF PAGES
19a. NAME OF RESPONSIBLE PERSON a. REPORT b. ABSTRACT c. THIS PAGE
19b. TELEPHONE NUMBER (Include area code)
May 2004 Subcontract Report
Evaluation of Biodiesel Fuel in an EMD GP38-2 Locomotive AXE-9-29057-01
BB044630
S.G. Fritz
Southwest Research Institute San Antonio, TX
National Renewable Energy Laboratory 1617 Cole Blvd. Golden, CO 80401-3393
NREL
NREL/SR-510-33436
NREL Technical Monitor: K.S. Tyson
This report documents results of fuel consumption and exhaust emission tests performed on a 2,000 hp EMD GP38-2 locomotive operating on four different fuels. No operational problems were observed by SwRI on any of the test fuels, and the locomotive engine was able to produce within 1% to 2% of full rated power while operating on the biodiesel blends.
biodiesel; locomotive; SwRI
ResetF1075-E(07/2003)