evaluation of computer network security based on …isyou.info/jowua/papers/jowua-v5n3-2.pdf ·...
TRANSCRIPT

Evaluation of Computer Network Securitybased on Attack Graphs and Security Event Processing∗
Igor Kotenko1,2† and Elena Doynikova1
1Laboratory of Computer Security ProblemsSt. Petersburg Institute for Informatics and Automation (SPIIRAS)
39, 14 Liniya, St. Petersburg, 199178, Russia{ivkote, doynikova}@comsec.spb.ru
2St. Petersburg National Research University of Information Technologies, Mechanics and Optics49, Kronverkskiy prospekt, Saint-Petersburg, Russia
Abstract
The paper is devoted to the security assessment problem. Authors suggest an approach to the securityassessment based on the attack graphs that can be implemented in contemporary Security Informa-tion and Event Management (SIEM) systems. Key feature of the approach consists in the applicationof the developed security metrics system based on the differentiation of the input data for the metricscalculations. Input data includes, among others, current events from the SIEM system. Proposedmetrics form the basis for security awareness and reflect current security situation, including devel-opment of attacks, attacks sources and targets, attackers’ characteristics. The suggested technique isdemonstrated on a case study.
Keywords: cyber situational awareness, security metrics, security metrics taxonomy, attack graphs,security incidents, SIEM systems
1 Introduction
Currently in information systems a huge set of the security related information and heterogeneous secu-rity events are generated. As an answer on the problem of processing, analysis and visualization of thisinformation, Security Information and Event Management (SIEM) systems [2, 1, 3] appeared. To repre-sent security situation for the user of the system the set of the security metrics can be used. Obviouslythese metrics should be clear and valuable for security decisions and represent security situation in thereal-time (or near real-time) mode.
Currently there are a lot of investigations that consider different security assessment techniques andsecurity metrics [4, 5, 6, 7, 8, 9]. In the paper we suggest an approach that allows considering the avail-able input data (information system description, attack graphs, service dependencies graphs and securityincidents) for the security metrics recalculation in the offline (static) and online (near real-time) mode.For this goal we define the system of the security metrics that considers the recent research in the securitymetrics area, modeling of attacker steps as attack graphs, features of SIEM systems, protocols and stan-dards in the area of the information security. We use known and adopted techniques for the calculationof security metrics. Calculated metrics allow to determine current security situation, including existenceof attacks, attacker skills, position and goals.
The main contribution of the paper consists in the specification of the structure of the security metrics
Journal of Wireless Mobile Networks, Ubiquitous Computing, and Dependable Applications, volume: 5, number: 3, pp. 14-29∗This paper is an extended version of the work originally presented at the 2014 Asian Conference on Availability, Reliability
and Security (AsiaARES’14), Bali, Indonesia, April 2014 [1].†Corresponding author: Tel: +7(812) 328-71-81, Web: http://www.comsec.spb.ru/
14
Evaluation of Computer Network Security Kotenko and Doynikova
system (including groups of metrics, metrics, and their interconnections) and in definition of calculationtechniques for the defined metrics. We consider that this system should be applied for the security as-sessment of computer networks on the base of attack graphs in the scope of the SIEM systems. Currentlythe application of attack graphs for the analysis and prediction of attacker steps is not typical for SIEMsystems. Thus, the key difference of the suggested technique from other techniques of the security as-sessment on the base of attack graphs consists in its integration in the SIEM architecture. It is achievedby taking into account current security in-formation and security events from the SIEM system and de-livering to the SIEM system the set of security metrics for the decision support. This paper is an extendedversion of the paper presented on ICT-EurAsia 2014 [1]. It contains detailed description of the suggestedsecurity metrics system; stages of the security assessment technique and algorithms of metrics calcula-tions. The paper is organized as follows. In Section 2 main related works are considered. Section 3provides description of the assessment technique and its stages. Section 4 contains case study and exper-iments for evaluating the security assessment technique. Conclusion provides the paper results and plansfor the future work.
2 Related Work
A lot of the security metrics taxonomies were developed by now. Some of them are defined according tothe goals of the security assessment. For example, in [10] metrics are divided on three categories: techni-cal, operational and organizational. In [11] two categories are considered: organizational and technical.Taxonomy suggested by NIST [12] includes three categories: management, technical and organizational,and 17 sub-categories. Taxonomy in [13] includes three categories (security, quality of service, availabil-ity). Each category contains technical, organizational and operational metrics. In [9] metrics are dividedaccording to six business functions : incident management, vulnerability management, patch manage-ment, application security, configuration management, and financial metrics.
Other classifications divide security metrics according to the way of their computation. In [8] pri-mary metrics (defined directly on the base of the attack graphs) and secondary metrics (calculated on thebase of the primary metrics) are outlined. [14] classifies metrics on the ones that are calculated for theattack graph (for example, attacker skill level or attack potentiality) and the ones that are calculated forthe service dependencies graph (for instance, attack/response impact or response benefit).
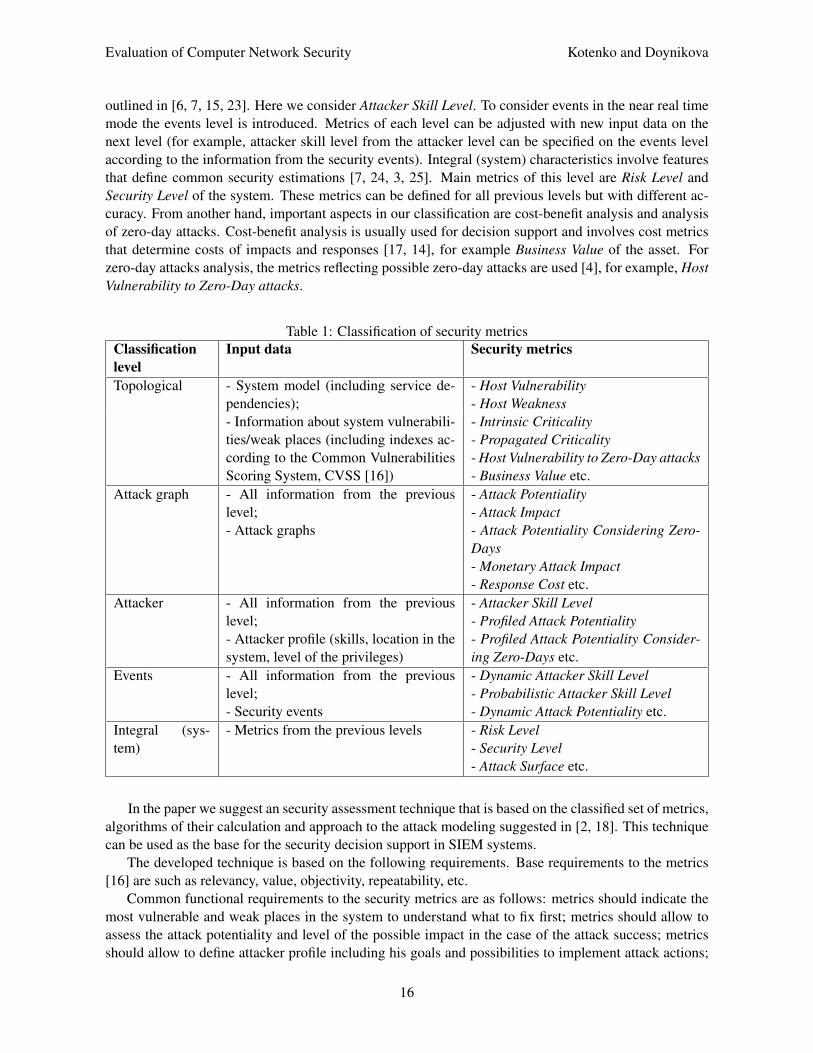
In [5] metrics are divided according to the value type: existence; ordinal; score; cardinal; percentage;holistic; value; uncertainty. We have not found a system of security metrics that is based on attackgraphs and applicable for security assessment in SIEM systems. Thus, we aimed to develop the appropri-ate system considering the following aspects: the last research in the security metrics area [10, 15, 16];architecture of the security evaluation component in the scope of the SIEM system (modeling of theattack sequences on the base of attack graphs [17, 18, 19, 20] and service dependencies [15, 14]); dif-ferent stages of security analysis (static and dynamic). We outlined the following categories or levels(Table 1) [21]: topological, attack graph, attacker, events, and integral (system). We also selected threesub-categories for each category: base characteristics, cost characteristics (these characteristics are cal-culated with consideration of the monetary value of the resources), and zero-day characteristics (thesecharacteristics are calculated with consideration of the zero-day vulnerabilities).
Topological characteristics can be defined from the network topology and the description of hosts[22, 9]. They involve host parameters [22], application characteristics [9], features of service depen-dencies [15, 14], characteristics that consider information about the vulnerabilities and possible attacks[9]. We outline, for example, Host Criticality, Host Vulnerability, etc. Attack characteristics (such asattack potentiality/probability) are defined on the base of attack graphs [15]. They include such metricsas Attack Potentiality and Attack Impact. Attacker parameters are related to possible attackers and are
15
Evaluation of Computer Network Security Kotenko and Doynikova
outlined in [6, 7, 15, 23]. Here we consider Attacker Skill Level. To consider events in the near real timemode the events level is introduced. Metrics of each level can be adjusted with new input data on thenext level (for example, attacker skill level from the attacker level can be specified on the events levelaccording to the information from the security events). Integral (system) characteristics involve featuresthat define common security estimations [7, 24, 3, 25]. Main metrics of this level are Risk Level andSecurity Level of the system. These metrics can be defined for all previous levels but with different ac-curacy. From another hand, important aspects in our classification are cost-benefit analysis and analysisof zero-day attacks. Cost-benefit analysis is usually used for decision support and involves cost metricsthat determine costs of impacts and responses [17, 14], for example Business Value of the asset. Forzero-day attacks analysis, the metrics reflecting possible zero-day attacks are used [4], for example, HostVulnerability to Zero-Day attacks.
Table 1: Classification of security metricsClassificationlevel
Input data Security metrics
Topological - System model (including service de-pendencies);
- Host Vulnerability- Host Weakness
- Information about system vulnerabili-ties/weak places (including indexes ac-cording to the Common VulnerabilitiesScoring System, CVSS [16])
- Intrinsic Criticality- Propagated Criticality- Host Vulnerability to Zero-Day attacks- Business Value etc.
Attack graph - All information from the previouslevel;- Attack graphs
- Attack Potentiality- Attack Impact- Attack Potentiality Considering Zero-Days- Monetary Attack Impact- Response Cost etc.
Attacker - All information from the previouslevel;- Attacker profile (skills, location in thesystem, level of the privileges)
- Attacker Skill Level- Profiled Attack Potentiality- Profiled Attack Potentiality Consider-ing Zero-Days etc.
Events - All information from the previouslevel;- Security events
- Dynamic Attacker Skill Level- Probabilistic Attacker Skill Level- Dynamic Attack Potentiality etc.
Integral (sys-tem)
- Metrics from the previous levels - Risk Level- Security Level- Attack Surface etc.
In the paper we suggest an security assessment technique that is based on the classified set of metrics,algorithms of their calculation and approach to the attack modeling suggested in [2, 18]. This techniquecan be used as the base for the security decision support in SIEM systems.
The developed technique is based on the following requirements. Base requirements to the metrics[16] are such as relevancy, value, objectivity, repeatability, etc.
Common functional requirements to the security metrics are as follows: metrics should indicate themost vulnerable and weak places in the system to understand what to fix first; metrics should allow toassess the attack potentiality and level of the possible impact in the case of the attack success; metricsshould allow to define attacker profile including his goals and possibilities to implement attack actions;
16

Evaluation of Computer Network Security Kotenko and Doynikova
metrics should assess benefit in case of the countermeasures implementation; metrics should considersecurity events in the system for the accurate representation of the current security situation.
Main functional requirements to the security assessment technique are as follows: the techniqueshould implement the comprehensive risk assessment procedures; the technique should support securityadministrator in generation of efficient security decisions from the time and cost point of view; thetechnique should consider requirements of the standards and protocols of the information security.
Main nonfunctional requirements to the algorithms of the calculation of the security metrics includerequirements to the efficiency (calculation of the metrics for the adequate time interval) and validity(compliance of the assessments with real security state of the information system).
Main stages of the approach are presented in the next section.
3 Technique of the Security Assessment
Suggested security assessment technique is implemented as the part of the security evaluation systembased on attack graphs [2, 18]. The architecture of the component is represented in Figure 1.
Dependency
Graph Generator
Correlation
engineAttack Graph
Generator
MapperSecurity Evaluation
Algorithms
External sensors
Network description
(including service
dependencies)
External databases of
vulnerabilities Input data
sources
Security evaluation
component
Visualization system Decision support system
Security events
Security events
Vulnerabilities
Dependency graph
Attack sequence on graph
Security metrics
Network topology
Attack graph
Figure 1: Architecture of the security evaluation component
The component involves the set of security evaluation algorithms for calculation of the metrics andMapper that allows detecting attacker position on the attack graph according to the security events. Se-curity evaluation component gets input data from the next sources: attack graph generator that buildsattack graphs for the analyzed network; dependency graph generator that provides graph of the depen-dencies between the network services; and correlation engine that generates security events on the baseof the security events. Output data includes different security metrics according to the suggested system.Further output data is provided to the visualization system and decision support system.
17
Evaluation of Computer Network Security Kotenko and Doynikova
3.1 Input Specification
To describe the security assessment technique the following input details are used:
1. Test network with host characteristics and values of the topological metrics: Business Value, Crit-icality (including propagated criticality via service dependencies), etc.
2. Attack graph that contains system vulnerabilities as vertexes and transitions between the vulner-abilities as arcs (these paths of the sequential exploitation of the vulnerabilities constitute threatsintroduced by the attackers). Possibility of transition from one vulnerability to another is definedby pre- and post-conditions of the vulnerabilities exploitation according CVSS [16].
3. Calculated unconditional probabilities for each node (in consideration that the attacker can imple-ment all attack actions). These probabilities define possibility of the fact that attacker achievespost-conditions of the exploitation of the vulnerability that corresponds to the appropriate node.Unconditional probabilities are defined on the base of the local conditional distributions for eachnode Si, i ∈ [1,n]: Pr(S1, ...,Sn) = ∏
ni=1 Pr(Si|Pa[Si]), where Pa[Si] – set of all parents of Si [20].
Conditional probabilities of the transitions between nodes are defined on the base of CVSS indexes(AccessComplexity and Authentication) and define possibility of the fact that attacker achievespost-conditions of the exploitation of the vulnerability that corresponds to the node in consider-ation that all previous nodes are compromised. Initial probability of the attack is defined by theselected attacker model (network and local) and considers CVSS index AccessVector.
4. Calculated impact and criticality values for each node of the attack graph.
5. Security events that include information about the attacked host, privileges and/or impact on thehost.
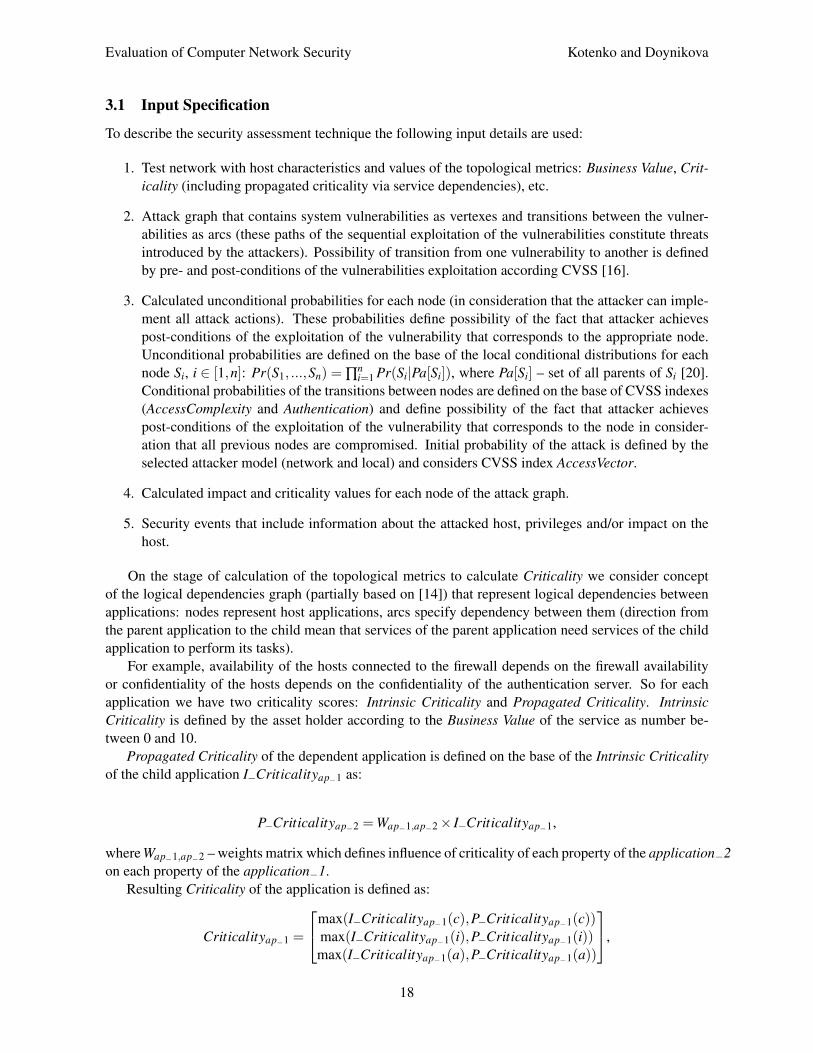
On the stage of calculation of the topological metrics to calculate Criticality we consider conceptof the logical dependencies graph (partially based on [14]) that represent logical dependencies betweenapplications: nodes represent host applications, arcs specify dependency between them (direction fromthe parent application to the child mean that services of the parent application need services of the childapplication to perform its tasks).
For example, availability of the hosts connected to the firewall depends on the firewall availabilityor confidentiality of the hosts depends on the confidentiality of the authentication server. So for eachapplication we have two criticality scores: Intrinsic Criticality and Propagated Criticality. IntrinsicCriticality is defined by the asset holder according to the Business Value of the service as number be-tween 0 and 10.
Propagated Criticality of the dependent application is defined on the base of the Intrinsic Criticalityof the child application I−Criticalityap−1 as:
P−Criticalityap−2 =Wap−1,ap−2× I−Criticalityap−1,
where Wap−1,ap−2 – weights matrix which defines influence of criticality of each property of the application−2on each property of the application−1.
Resulting Criticality of the application is defined as:
Criticalityap−1 =
max(I−Criticalityap−1(c),P−Criticalityap−1(c))max(I−Criticalityap−1(i),P−Criticalityap−1(i))max(I−Criticalityap−1(a),P−Criticalityap−1(a))
,
18

Evaluation of Computer Network Security Kotenko and Doynikova
Host Criticality is defined as maximum criticality of its applications and is defined as:
H−Criticality =
maxk Criticalityap−k(c)maxk Criticalityap−k(i)maxk Criticalityap−k(a)
,
where k – number of the application on the host, k ∈ [1,m].Other input for the technique is the attack graph [18]. For the goals of the metrics calculation the
vulnerabilities of each host are grouped according to their pre and post conditions. Pre conditions aredefined by the access vector according to the CVSS index Access Vector (AV) which possible values are”Network” or ”Local” (we designate pre conditions as AV: Network or AV: Local). Post conditions areacquired privileges (admin, other, none). Groups are as follows (Figure 2):
• Group1: pre conditions – AV: Network, post conditions – acquired privileges: user or other.
• Group2: pre conditions – AV: Network, post conditions – acquired privileges: admin.
• Group3: pre conditions – AV: Network, post conditions – acquired privileges: none.
• Group4: pre conditions – AV: Local, post conditions – acquired privileges: admin.
• Group5: pre conditions – AV: Local, post conditions – acquired privileges: user, other or none.
AV: NetworkPrivileges: Give access
(user, other)Impact: Any
AV: NetworkPrivileges: NoImpact: Any
AV: LocalPrivileges: Give access
(admin)Impact: Any
AV: NetworkPrivileges: Give access
(admin)Impact: Any
AV: LocalPrivileges: Give access
(user, other) or No Impact: Any
Previous host
Next host
Figure 2: Grouping of the vulnerabilities for the host
Vulnerability groups of the host are connected with vulnerability groups of the host that areaccessible from the current host (Figure 2). Further this groups are used for the calculation of the attackpotential. Nodes of the graph (vulnerability groups) are defined as a set of possible states.
State success is defined as successful exploitation of one from the vulnerabilities in the group andachievement of the group post conditions. Local probability of the state success is defined with CVSSindexes: Access Complexity and Authentication. Initial probability of the attack (of the first step) isdefined with Access Vector index.
For each group the possible Impact is determined for the further Risk Level calculation. Total Impactis defined on the base of the CVSS impact indexes and Criticality of the applications in group:
Group−Impact = maxk Host−Criticality×
Impactk(c)Impactk(i)Impactk(a)
,
19
Evaluation of Computer Network Security Kotenko and Doynikova
where k – number of the vulnerability in group, k ∈ [1,m].Security events in this case are not events from the intrusion detection system, these events are
correlated events from the SIEM system with information about host with malicious activity and acquiredimpact on it. These events can be represented on the nodes of the attack graph.
3.2 Security Assessment Stages
The security assessment technique includes the following stages:
1. Definition of the attacker position on the attack graph on the base of the information from thesecurity event. It can be done on the base of the next steps:
(a) Define the list of the vulnerabilities for the host that is described in the security event.
(b) Select the vulnerabilities that lead to the privileges and/or impact described in the event.
(c) If only one vulnerability was selected, the next steps of the technique should be performedfor the node that corresponds to the exploitation of this vulnerability.
(d) If multiple vulnerabilities were selected, the next steps of the technique should be performedfor all possible nodes.
(e) If a vulnerability was not selected, then the event is defined as exploitation of the zero-day.
2. Determination of the attacker skill level on the base of information from the security event. Thenext steps should be performed for all nodes selected on the previous stage:
(a) Define the most probable path of the attacker to the current node on the base of the Bayestheorem (posterior probability for the node A considering that B has happened): Pr(A|B) =Pr(B|A)×Pr(A)/Pr(B), where
(b) Select vulnerabilities with the maximum CVSS access complexity [16] for this path.
(c) Define the attacker skill level according to the access complexity as “High”/”Medium”/”Low”.Quantitative values are defined: 0.7 “High”, 0.5 “Medium”, 0.3 “Low” Attacker Skill Level.
(d) Define the probability of skills as (number of nodes with vulnerability with this access com-plexity)/(total number of steps in the path).
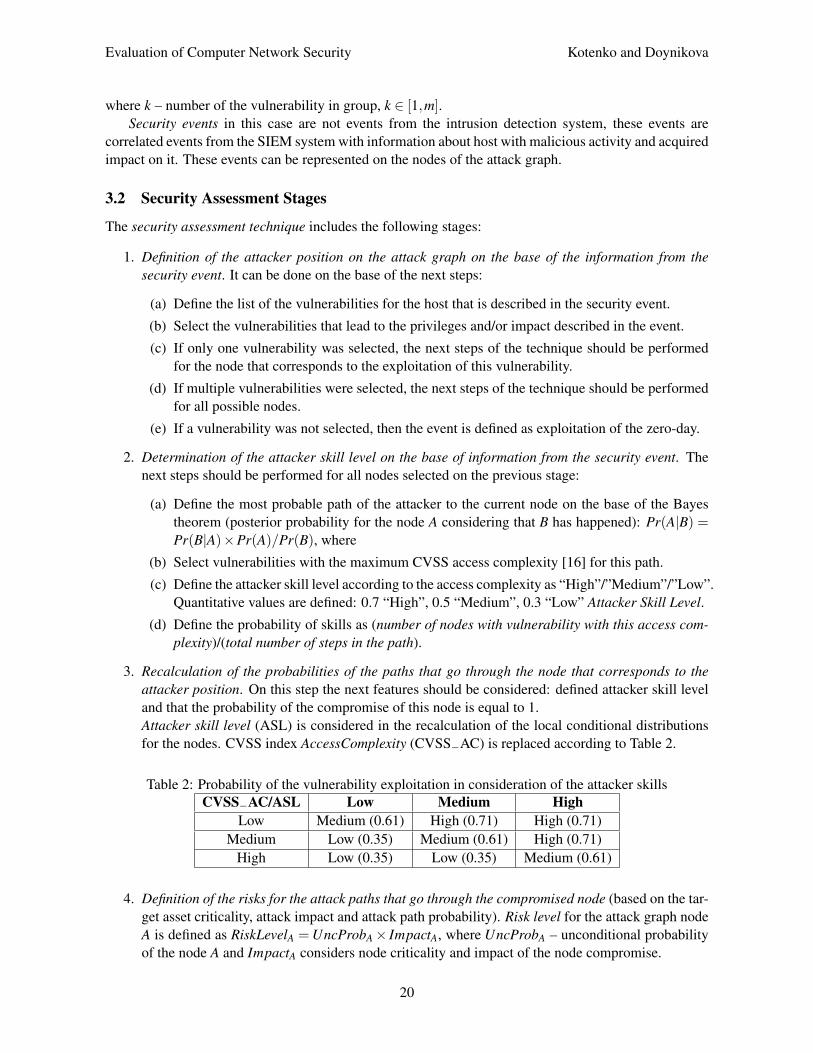
3. Recalculation of the probabilities of the paths that go through the node that corresponds to theattacker position. On this step the next features should be considered: defined attacker skill leveland that the probability of the compromise of this node is equal to 1.Attacker skill level (ASL) is considered in the recalculation of the local conditional distributionsfor the nodes. CVSS index AccessComplexity (CVSS−AC) is replaced according to Table 2.
Table 2: Probability of the vulnerability exploitation in consideration of the attacker skillsCVSS−AC/ASL Low Medium High
Low Medium (0.61) High (0.71) High (0.71)Medium Low (0.35) Medium (0.61) High (0.71)
High Low (0.35) Low (0.35) Medium (0.61)
4. Definition of the risks for the attack paths that go through the compromised node (based on the tar-get asset criticality, attack impact and attack path probability). Risk level for the attack graph nodeA is defined as RiskLevelA =UncProbA× ImpactA, where UncProbA – unconditional probabilityof the node A and ImpactA considers node criticality and impact of the node compromise.
20

Evaluation of Computer Network Security Kotenko and Doynikova
5. Selection of the path with maximum value of risk. This path is selected as the most probable attackpath and its end point should be selected as attacker goal.
As the result of the technique, we get the next output data: attacker skill level, attack path and attackergoal. Further this information is used for the decision support.
4 Case Study
4.1 Input Data
The following input data for the security assessment is considered below: topology of the test network(Figure 3), values of the topological metrics, especially Criticality of the hosts (calculated on the previousassessment stage), attack graph, security events.
Firewall-1
Firewall-2
Authentication serverHost-2 (web-server for the web-application 2)
Host-1 (web-server for the web-application 1)
Attacker
Router-1 External users
Firewall-3
Web-server
Database server
DMZ
Local network
Router-2
Internal users
[0.8, 0.8, 0.8][0.8, 0.8, 0.8]
[0.6, 0.7, 0.6]
[1.6, 1.1, 1.6]
[1.6, 1.1, 1.6]
[0.8, 0.8, 0.8]
[0.6, 1.1, 1.6]
[0.6, 1.1, 1.6]
Figure 3: Topology of the test network and Criticality values
Test network includes two web-servers with critical web applications Host-1 and Host-2. Externalusers of the local network are directed to the web-applications through Router-1 and Firewall-1. Authen-tication is needed to work with these applications. Authentication data is stored on the Authenticationserver. Critical data that the user get or add when working with applications is stored on Database server.Requests from Host-1 and Host-2 are handled by Web-server first. Internal users have access to Web-server via Router-2 and Firewall-3.
The parameters of the hosts for the test network are as follows:
1. External users – Microsoft Windows 7 64-bit, Apple ITunes 9.0.3, Mi-crosoft Office 2007 SP1,Microsoft Internet Explorer 7.
2. Web-server – Windows Ftp Server 2.3.0, Windows Server 2008 for 32-bit Systems.
3. Database server – Apache Software Foundation Derby 10.1.3.1, phpMYAdmin 3.5.2.2, OracleMySQL 5.5.25, Linux Kernel 2.6.27.33.
21

Evaluation of Computer Network Security Kotenko and Doynikova
4. Host-1 and Host-2 – Red Hat JBoss Community Application Server 5.0.1, Windows Server 2008R2 for x64-based Systems.
5. Firewall-1 and Firewall-3 – Linux Kernel 2.6.27.33, Citrix ICA Client.
6. Firewall-2 – Novell SUSE Linux Enterprise Server 11 Service Pack 1 (with Netfilter).
7. Authentication server – Novell SUSE Linux Enterprise Server 11 Service Pack 1, Novell eDirec-tory 8.8.1.
8. Internal users – Apple Mac OS X Server 10.6.1, Apple iTunes 9.0.2 for Mac OS X, MicrosoftOffice 2008 Mac.
Figure 3 depicts the values of the host Criticality. It is calculated on the base of the Business Valueof the hosts for the system and the dependencies between the network services.
Criticality is a vector that includes three scores <Criticality of Confidentiality, Criticality of Integrity,Criticality of Availability>.
The example of the user interface for the security evaluation system is shown in Figure 4 [2, 18].
Figure 4: Example of the user interface
It includes tab with fragment of the attack graph in the center part. Nodes of the graph are signed withcalculated metrics values (Criticality, Attack Potentiality and Risk). Node with detected security event isoutlined with the red frame. Recalculated metrics after detection of this security event are presented inthe red color. User interface also contains control toolbar and panel with metrics values in the top part.In the right part there is network explorer with characteristics of the network objects.
22

Evaluation of Computer Network Security Kotenko and Doynikova
Common attack graph for the considered test case is presented in Figure 5. Nodes of the attack graphare defined as triple <Exploited vulnerability, Pre-conditions, Post-conditions>. Pre-conditions includeprivileges that are needed to exploit the vulnerability, Post-conditions are acquired privileges and impact.For each node of the attack graph the appropriate vulnerabilities (according to the NVD database) arerepresented. Color of the node is defined with vulnerability BaseScore according to the CVSS [16](yellow color – Medium score, red color – High score). For each node the probabilities that attacker canreach the node are calculated.
Attacker
Physical connections
Host-1
Host-2
Authentication server
Firewall-1
1716 18
19 20
Firewall-2
Firewall-3
Web-server
6
Database server
1
3 45
7
810
9
11
12
13
2
14 15
21
22
23
0.61
0.3721
0.3721
0.4331
0.4331
0.71
0.2485
0.5041
0.61
0.3721
0.3721
0.4331 0.4331
0.4331
0.4331
CVE-2010-2990
CVE-2010-4258 CVE-2011-1495
CVE-2008-2249, CVE-2010-
0017, CVE-2010-0018, CVE-
2010-0811, CVE-2010-1883
CVE-2008-1436,
CVE-2010-0020
CVE-2008-4038, CVE-2008-
4250, CVE-2008-4835, CVE-
2009-2532, CVE-2010-0239,
CVE-2010-0240, CVE-2010-
0241, CVE-2010-2550
CVE-2008-4268,
CVE-2008-4269
CVE-2010-0484, CVE-2010-
0485, CVE-2010-1255, CVE-
2010-1893, CVE-2010-2554,
CVE-2010-2555, CVE-2010-
2744
CVE-2008-2252, CVE-2009-1124,
CVE-2010-0233, CVE-2010-0819,
CVE-2010-1889, CVE-2010-1896,
CVE-2010-1897
CVE-2012-5159
CVE-2010-4258
CVE-2011-1495
CVE-2010-2990
CVE-2010-4258 CVE-2011-1495
CVE-2010-0018 CVE-2010-0020 CVE-2010-2550
CVE-2010-1893, CVE-2010-
2554, CVE-2010-2555
CVE-2010-1897, CVE-
2010-2744
CVE-2006-4177
CVE-2006-4509, CVE-2006-
4510, CVE-2008-4478
CVE-2008-0924
Figure 5: Attack graph with calculated probabilities
For example, conditional probability on the node 1 in case of successful initialization of attack isequal to 0.61 (access complexity of the CVE-2010-2990). Conditional probability on the node 6 in caseof the success on the node 1 is equal to 0.71 (access complexity of the CVE-2008-1436). Unconditionalprobability for the node 6 is defined as product of probabilities of successful states: 1 · 0.61 · 0.71 =0.4331.
As was defined above the description of the security event should include information about theattacked host and acquired privileges and/or impact.
To illustrate the experiments in the paper, two types of attackers were defined:
23
Evaluation of Computer Network Security Kotenko and Doynikova
Attacker
Physical
connectionsHost-1
Host-2
Authentication server
Firewall-1
1716 18
19 20
Firewall-2
Firewall-3
Web-server
6
Database server
1
3 4 5
7
8
10
9
11
12
13
2
14 15
21
22
23
s11
s21
s31
s41
Z-day 18s12
s22 s32
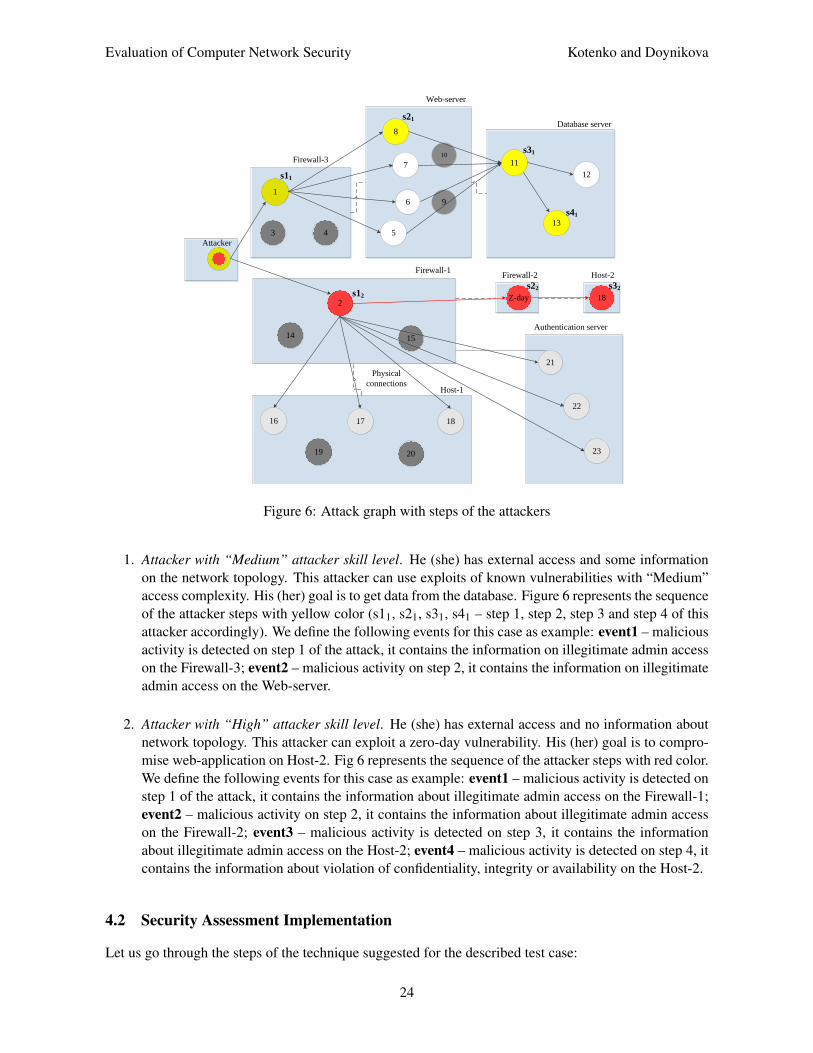
Figure 6: Attack graph with steps of the attackers
1. Attacker with “Medium” attacker skill level. He (she) has external access and some informationon the network topology. This attacker can use exploits of known vulnerabilities with “Medium”access complexity. His (her) goal is to get data from the database. Figure 6 represents the sequenceof the attacker steps with yellow color (s11, s21, s31, s41 – step 1, step 2, step 3 and step 4 of thisattacker accordingly). We define the following events for this case as example: event1 – maliciousactivity is detected on step 1 of the attack, it contains the information on illegitimate admin accesson the Firewall-3; event2 – malicious activity on step 2, it contains the information on illegitimateadmin access on the Web-server.
2. Attacker with “High” attacker skill level. He (she) has external access and no information aboutnetwork topology. This attacker can exploit a zero-day vulnerability. His (her) goal is to compro-mise web-application on Host-2. Fig 6 represents the sequence of the attacker steps with red color.We define the following events for this case as example: event1 – malicious activity is detected onstep 1 of the attack, it contains the information about illegitimate admin access on the Firewall-1;event2 – malicious activity on step 2, it contains the information about illegitimate admin accesson the Firewall-2; event3 – malicious activity is detected on step 3, it contains the informationabout illegitimate admin access on the Host-2; event4 – malicious activity is detected on step 4, itcontains the information about violation of confidentiality, integrity or availability on the Host-2.
4.2 Security Assessment Implementation
Let us go through the steps of the technique suggested for the described test case:
24

Evaluation of Computer Network Security Kotenko and Doynikova
1. Definition of the node of graph that corresponds to the attacker position. For example, for the firstscenario to detect the attacked node after event1 we determine all vulnerabilities on the definedin the event Firewall-3 and select vulnerabilities that provide privileges/impact described in theevent. For the first scenario it is still vulnerability ‘1’.
2. Calculation of the attacker skill level on the base of security event. For the defined on the previousstage nodes the previous attacker steps are defined (the attack sequence on the attack graph withthe maximum probability value). For the first scenario after event1 it is external network andvulnerability ’1’. The attacker skill level is defined as maximum access complexity of his steps.
3. Determination of the probabilities of the attack sequences that go through the node with attackerand definition of the attacker goal. Figure 7 depicts probabilities after each defined security eventfor the first scenario (the sequence of attacker actions is represented with yellow color).
Attacker
Physical connectionsHost-1
Host-2
Authentication server
Firewall-1
17
16 18
19 20
Firewall-2
Firewall-3
Web-server
6
Database server
1
3 45
7
8
10
9
11
12
13
2
14 15
21
22
23
Initial:0.61 -> Event1: 0.305 -> Event2: 0.305
Initial: 0.3721 -> Event1: 0.1861 -> Event1: 0.1861
Initial: 0.4331 -> Event1: 0.2166 -> Event2: 0.2166
s1
s2
s3
s4
Event1:
Attacker position
Event1: Attack Probability = 1
Event1: Attacker Skill Level = Medium
Initial: 0.3721 -> Event1: 0,305 -> Event2: 0,5
Initial: 0.3721 -> Event1: 0,305
Initial: 0.4331 -> Event1: 0,355
Initial: 0.4331 -> Event1: 0,355
Initial: 0.71 -> Event1: 0,71 ->
Event2: 0,71
Initial: 0.2485 -> Event1: 0,2485 ->
Event2: 0,2485
Initial: 0.5041 -> Event1: 0,5041 ->
Event2: 0,5041
Initial: 0.4331 -> Event1: 0.2166 -> Event1: 0.2166
Initial: 0.4331 -> Event1: 0.2166 -> Event2: 0.2166
Initial: 0.4331 -> Event1: 0.2166 -> Event1: 0.2166
Initial: 0.3721 -> Event1: 0.1861 ->
Event2: 0.1861
Initial: 0.61 -> Event1: 1 -> Event2: 1
Event2: Attacker position
Initial: Most probable goal ->
Event1: Most probable goal ->
Event2: Most probable goal
Initial: 2.013 -> Event1: 3.3 ->
Event2: 3.3
Initial: 0.89 -> Event1: 0.732 ->
Event2: 1.2
Initial: 3.053 -> Event1: 3.053 ->
Event2: 3.053
Initial: 1.069 -> Event1: 1.069 ->
Event2: 1.069
Initial: 2.168 -> Event1: 2.168 ->
Event2: 2.168
Figure 7: Changes of attack probabilities after security events for the scenario 1
For the first scenario, according to event1, new probabilities are calculated: the probabilities on thenodes 5-8 are decreased, as they were influenced by the new knowledge about the attacker position
25

Evaluation of Computer Network Security Kotenko and Doynikova
and attacker skills. Probabilities of the attacks on the nodes 2, 16-18, 21-23 are decreased, becauseof the new knowledge about attacker skills. Thus, after the first security event we can suppose thatattack goal is Database Server, but additional information is needed. Figure 8 outlines the samecalculations made for the second scenario (the sequence of attacker actions is represented with redcolor).
Attacker
Physical connectionsHost-1
Host-2
Authentication server
Firewall-1
1716 18
19 20
Firewall-2
Firewall-3
Web-server
6
Database server
1
3 4 5
7
8
10
9
11
12
13
2
14 15
21
22
23
Initial: 0.61 -> Event1: 0.305 -> Event2: 0.427
Initial: 0.3721 -> Event1: 0.1861
Initial: 0.3721 -> Event1: 0.1861
Initial: 0.4331 -> Event1: 0.2166
Initial: 0.4331 -> Event1: 0.2166
Initial: 0.71 -> Event1: 0.71
Initial: 0.2485 -> Event1: 0.2485
Initial: 0.5041 -> Event1: 0.5041
Initial: 0.61 -> Event1: 1 -> Event2: 1
Initial: 0.3721 -> Event1: 0.305 ->
Event2: 0.427
Initial: 0.3721 -> Event1: 0.305 -> Event2: 0.427
Initial: 0.4331 -> Event1:
0.355 -> -> Event2: 0.497 Initial: 0.4331 ->
Event1: 0.355 ->
Event2: 0.497
Initial: 0.4331 ->
Event1: 0.355 ->
Event2: 0.497
Initial: 0.4331 -> Event1:
0.355 -> Event2: 0.497
s1
Z-day
18s2
s3
Event1
Event2
Initial: 0 -> Event1: 0 -> Event2: 1
Initial: 0 -> Even1: 0 ->
Event2: 0.497
16
17
Initial: 0 -> Event1: 0 -> Event2: 0.497
Initial: 0 ->
Event1: 0 ->
Event2: 0.427
Figure 8: Changes of attack probabilities after security events for the scenario 2
4. Definition of the risks of the attack sequences. On this step the Criticality and Impact values areconsidered. According to the experiments cumulative risk values on the attacker goal nodes of thegraph increase with new events.
Output of the security assessment technique contains the following data: attack path with maximumrisk value that defines the most probable attack sequence and attackers goal; the most probable previousattacker steps; attacker skills.
These results allow making decision about the most efficient countermeasures. These experiments
26

Evaluation of Computer Network Security Kotenko and Doynikova
demonstrate the main possibilities of the suggested security evaluation system on security metrics calcu-lation.
5 Conclusion
The paper suggests security assessment technique for computer networks. The technique is based onthe attack graphs and can be applied for the SIEM systems that are actively implemented in the moderninformation systems. It is oriented on the near real time assessment of the security situation. So the tech-nique allows monitoring the current attacker position and forecast his (her) path in the network. It leadsto the hard time limitations for calculations. In the paper we suggested some calculation techniques andanalyzed their application in scope of the of the security assessment technique for computer networks.
We defined the set of security metrics and traced their changes after appearance of the security events.Technique provides different calculation algorithms according to the available input data and allows toget adequate security assessment in any time of the system operation. On the example of the case studyit was shown that new data from the SIEM system influences on the probability and risk values of theattack. This allows monitoring the track of the attacker in the system.
5.1 Future Work
In the future work we plan to proceed specification of the technique and extend the set of the experiments.
5.2 Acknowledgments
This research is being supported by the grants of the Russian Foundation of Basic Research (13-01-00843, 13-07-13159, 14-07-00697, 14-07-00417), the Program of fundamental research of the Depart-ment for Nanotechnologies and Informational Technologies of the RAS (contract ]2.2), and by Govern-ment of the Russian Federation, Grant 074-U01, and State contract ]14.604.21.0033.
References[1] I. Kotenko and E. Doynikova, “Security assessment of computer networks based on attack graphs and security
events,” in Proc. of the 2nd IFIP TC5/8 International Conference (ICT-EurAsia’14), Bali, Indonesia, LNCS,vol. 8047. Springer-Verlag, April 2014, pp. 462–471.
[2] I. Kotenko and A. Chechulin, “Attack modeling and security evaluation in SIEM systems,” InternationalTransactions on Systems Science and Applications, vol. 8, pp. 129–147, December 2013.
[3] I. Kotenko, I. Saenko, O. Polubelova, and E. Doynikova, “The ontology of metrics for security evaluation anddecision support in SIEM systems,” in Proc. of the 8th International Conference on Availability, Reliabilityand Security (ARES’13), Regensburg ,Germany. IEEE, September 2013, pp. 638–645.
[4] M. S. Ahmed, E. Al-Shaer, and L. Khan, “A novel quantitative approach for measuring network security,” inProc. of The 27th IEEE Conference on Computer Communications (INFOCOM’08), Phoenix, Arizona, USA.IEEE, April 2008, pp. 1957–1965.
[5] C. W. Axelrod, “Accounting for value and uncertainty in security metrics,” Information Systems ControlJournal, vol. 6, pp. 1–6, 2008.
[6] B. A. Blakely, “Cyberprints identifying cyber attackers by feature analysis,” Ph.D. dissertation, Iowa StateUniversity, 2012.
[7] R. Dantu, P. Kolan, and J. Cangussu, “Network risk management using attacker profiling,” Security andCommunication Networks, vol. 2, no. 1, pp. 83–96, 2009.
[8] N. Idika, “Characterizing and aggregating attack graph-based security metric,” Ph.D. dissertation, PurdueUniversity, 2010.
27

Evaluation of Computer Network Security Kotenko and Doynikova
[9] “The CIS security metrics,” The Center for Internet Security, 2009.[10] R. Henning and et al., “Security metrics,” in Proc. of the Workshop on Information Security System, Scoring
and Ranking. Williamsburg, Virginia: MITRE, 2001.[11] R. Vaughn, R. Henning, and A. Siraj, “Information assurance measures and metrics: State of practice and
proposed taxonomy,” January 2003.[12] M. Swanson, N. Bartol, J. Sabato, J. Hash, and L. Graffo, “Security metrics guide for information technology
systems,” NIST Special Publication 800-55, Tech. Rep., July 2003.[13] N. Seddigh, P. Pieda, A. Matrawy, B. Nandy, I. Lambadaris, and A. Hatfield, “Current trends and advances
in information assurance metrics,” pp. 197–205, October 2004.[14] N. Kheir, N. Cuppens-Boulahia, F. Cuppens, and H. Debar, “A service dependency model for cost-sensitive
intrusion response,” pp. 626–642, September 2010.[15] W. Kanoun, N. Cuppens-Boulahia, F. Cuppens, and J. Araujo, “Automated reaction based on risk analysis
and attackers skills in intrusion detection systems,” pp. 117–124, October 2008.[16] P. Mell, K. Scarfone, and S. Romanosky, “A complete guide to the common vulnerability scoring system
version 2.0,” 2007.[17] M. Jahnke, C. Thul, and P. Martini, “Graph-based metrics for intrusion response measures in computer
networks,” pp. 1035–1042, October 2007.[18] I. Kotenko and A. Chechulin, “A cyber attack modeling and impact assessment framework,” pp. 119–142,
June 2013.[19] A. P. Moore, R. J. Ellison, and R. C. Linger, “Attack modeling for information security and survivability,”
Survivable Systems, Tech. Rep. Technical Note CMU/SEI-2001-TN-001, 2001.[20] N. Poolsappasit, R. Dewri, and I. Ray, “Dynamic security risk management using bayesian attack graphs,”
IEEE Transactions on Dependable and Security Computing, vol. 9, no. 1, pp. 61–74, 2012.[21] I. Kotenko, E. Doynikova, and A. Chechulin, “Security metrics based on attack graphs for the Olympic
Games scenario,” pp. 561–568, February 2014.[22] A. Mayer, “Operational security risk metrics: Definitions, calculations, visualizations,” Metricon 2.0, CTO
RedSeal Systems, Tech. Rep., 2007.[23] “NMap reference guide,” http://nmap.org/book/man.html.[24] “ISO/IEC 27005:2008, Information technology — Security techniques — Information security risk manage-
ment,” 2008.[25] P. K. Manadhata and J. M. Wing, “An attack surface metric,” IEEE Transactions on Software Engineering,
vol. 37, no. 3, pp. 371–386, 2010.
——————————————————————————
Author Biography
Igor Kotenko graduated with honors from St.Petersburg Academy of Space Engi-neering and St. Petersburg Signal Academy. He obtained the Ph.D. degree in 1990and the National degree of Doctor of Engineering Science in 1999. He is Professor ofcomputer science and Head of the Laboratory of Computer Security Problems of St.Petersburg Institute for Informatics and Automation. He is the author of more than200 refereed publications, including 12 textbooks and monographs. Igor Kotenkohas a high experience in the research on computer network security and participated
in several projects on developing new security technologies. For example, he was a pro-ject leader inthe research projects from the US Air Force research department, via its EOARD (European Office ofAerospace Research and Development) branch, EU FP7 and FP6 Projects, HP, Intel, F-Secure, etc. Theresearch results of Igor Kotenko were tested and implemented in more than fifty Russian research anddevelopment projects.
28

Evaluation of Computer Network Security Kotenko and Doynikova
Elena Doynikova graduated with honors from St. Petersburg Electrotechnical Uni-versity “LETI”. She is researcher of the Laboratory of Computer Security Problemsof St. Petersburg Institute for Informatics and Automation. She is the author ofmore than 30 publications and participate in several Russian and international re-search projects. Her main research interests are risk analysis and security assessmentin the computer networks.
29