evaluation of design and construction of hpc deck girder
TRANSCRIPT

Final Report
North Carolina Department of TransportationResearch Project No. 2006-16 (IBRC 2004)
Evaluation of Design and Construction of HPC Deck Girder Bridge inStanly County, North Carolina
By
Janos Gergely, Ph.D., P.E.Principal Investigator
Garrett L. Overcash, E.I.Graduate Research Assistant
Jacob B. Mock, E.I.Graduate Research Assistant
Chris M. Clark, E.I.Graduate Research Assistant
Kevin G. Bailey, MSCE, P.E.Consulting Engineer at RWA
Department of Civil EngineeringUniversity of North Carolina at Charlotte
9201 University City BoulevardCharlotte, NC 28223
January 4, 2007

2
Technical Report Documentation Page
1. Report No.FHWA/NC/2006-18
2. Government Accession No. 3. Recipient’s Catalog No.
4. Title and SubtitleEvaluation of Design and Construction of HPC Deck Girder Bridge inStanly County, North Carolina
5. Report Date January 4, 2007
6. Performing Organization Code
7. Author(s)Janos Gergely, Garrett L. Overcash, Jacob B. Mock, Chris M. Clark,Kevin G. Bailey
8. Performing Organization Report No.
9. Performing Organization Name and AddressUniversity of North Carolina at CharlotteCivil Engineering Department9201 University City BlvdCharlotte, NC 28223
10. Work Unit No. (TRAIS)
11. Contract or Grant No.
12. Sponsoring Agency Name and AddressNorth Carolina Department of TransportationResearch and Analysis Group
13. Type of Report and Period CoveredFinal Report
6/06/05-6/30/061 South Wilmington StreetRaleigh, North Carolina 27601
14. Sponsoring Agency Code 2006-16
Supplementary Notes:
16. Abstract
A current initiative by the Federal Highway Administration (FHWA), and the Innovative Bridge Research and Construction(IBRC) Program, focuses on new materials and technologies in bridge design and construction. Under this program, a recentproject awarded to the North Carolina Department of Transportation (NCDOT) concentrates on a high performance concrete(HPC) deck girder system, comprising of a modified AASHTO Type III girder with an additional flange (deck) section, with theobjectives to review the design and detailing information, monitor the deck girder fabrication and the bridge constructionprocesses, load test the completed bridge, and to evaluate the embedded stud connection. The load testing of the deck girderbridge was performed using two tandem trucks. The bridge was instrumented using strain transducers, strain gages, anddisplacement transducers. The instrument layout was designed to experimentally determine the transverse distribution factors,impact factors, strain levels, and displacements of each girder due to different loading conditions.
A finite element (FE) model was also developed, for which, model calibration was performed by comparing verticaldisplacement and stress values using NCDOT, Larsa™, and ANSYS™ results on a single deck girder. Once calibrated, thesingle-girder model was then copied to create five identical deck girders. The plate and diaphragm components were created andthe appropriate loads were placed on the model. The results were then compared to the actual quasi-static load test performed onthe finished bridge. Furthermore, using the working ANSYS model, a parametric study was then performed to investigate theinfluence of diaphragm and flange connection spacing.
The capacity and failure mechanism of the embedded stud connection used to join the adjacent deck girders is not accuratelydefined by current PCI specifications. Therefore, the shear and tension capacity of the connection was investigated through FEanalysis, followed by laboratory testing of four specimens of each type. Only few of the calculations compared closely to thepredicted values from the 6th Edition of the PCI Design Handbook. Hence, in order to accurately assess the capacity of non-traditional connections not resembling the standard headed stud details, experimental and/or FE studies should be performed.17. Key WordsPrecast, prestressed, concrete deck girders, AASHTOType III girders
18. Distribution Statement
19. Security Classif. (of this report)Unclassified
20. Security Classif. (of this page)Unclassified
21. No. of Pages178
22. Price
Form DOT F 1700.7 (8-72) Reproduction of completed page authorized

3
Executive Summary
The objectives of the present research project were to: (1) review the design and detailing
information; (2) monitor the deck girder fabrication and the bridge construction
processes; (3) load test the completed bridge, and (4) evaluate the embedded stud
connection. This final report summarizes the findings of the project as a whole, including
recommendations and conclusions reached throughout the duration of this project.
The load testing of the deck girder bridge was performed using two tandem trucks with a
combined total weight of approximately 100,000 lbs. The bridge was instrumented using
strain transducers, strain gages, and displacement transducers. The instrument layout was
designed to experimentally determine the distribution factors, impact factors, strain
levels, and displacements of each girder due to different loading conditions.
Graphs of the deck girder strain and vertical displacement were obtained as the load test
trucks traveled across the bridge. The maximum transverse compressive and tensile
stress that occurred in the top extreme fiber of the instrumented plates was also recorded.
The instrumented steel diaphragms also resulted in normal stress values at both of the
diaphragm ends. The load test revealed that the plate connectors have a safety factor of
approximately 2.1. The diaphragm members transmitted a relatively small portion of the
load, and had a significantly larger safety margin.
A finite element (FE) model was developed, for which, model calibration was performed
by comparing vertical displacement and stress values using NCDOT, Larsa™, and
ANSYS™ results on a single deck girder. The FE model was found to match both sets of
calculations when the prestress force and self-weight was applied. Once calibrated, the
single-girder model was then repeated to create five identical deck girders. The plate and
diaphragm components were created and the appropriate loads were placed on the model.
The results were then compared to the actual quasi-static load test performed on the
finished bridge. The resulting normal stresses and displacements obtained from the
computer models were very similar to the actual load test values. The plate and
4
diaphragm maximum stress values were also very similar to the actual load test results.
The maximum stress in the plates was found to be significantly less than the allowed
LRFD stress values.
Using the working ANSYS model, a parametric study was then performed to investigate
the influence of diaphragms and flange connection spacing. The spacing of the plates
was investigated with the spacing increased to 10’-0”. The increased spacing resulted in
a negligible distribution factor change and increased mid-span diaphragm stress slightly.
The stress increase in the plates when spacing was increased was mainly in compression
and seemed to be a viable alternative to the 5’-0” original design. The diaphragm stresses
were observed at both plate spacing, and resulted in relatively small values compared to
the yield stress.
The capacity and failure mechanism of the embedded stud connection used to join the
adjacent deck girders is not accurately defined by current PCI specifications. Therefore,
the shear and tension capacity of the connection was investigated through FE analysis,
followed by laboratory testing of four specimens of each type. The connection capacity
was governed by tensile (eccentric) loading, with an average capacity of 12.78 kips. The
shear specimens’ average ultimate capacity was 24.65 kips. Only few of the calculations
compared closely to the predicted values from the 6th Edition of the PCI Design
Handbook. Therefore, in order to accurately assess the capacity of non-traditional
connections not resembling the standard headed stud details, experimental and/or FE
studies should be performed.

5
Table of Contents
1 Introduction............................................................................................................... 121.1 Literature Review.............................................................................................. 131.2 Research Objectives .......................................................................................... 14
2 Design and Detailing................................................................................................. 152.1 Bridge Description............................................................................................ 152.2 Design Review .................................................................................................. 152.3 Larsa™ Model Construction............................................................................. 192.4 Larsa™ Model Results...................................................................................... 232.5 Construction Economical Analysis ................................................................... 30
3 FE Analysis ............................................................................................................... 313.1 Model Description............................................................................................. 313.2 Model Calibration............................................................................................. 353.3 Parametric Study............................................................................................... 39
4 Flange Connection Analysis...................................................................................... 504.1 FE Model........................................................................................................... 504.2 Testing Procedure.............................................................................................. 534.3 Experimental Results......................................................................................... 564.4 PCI Calculations vs. Experimental Results....................................................... 604.5 Connection Conclusions.................................................................................... 70
5 Deck Girder Fabrication............................................................................................ 715.1 Deck Formwork................................................................................................. 715.2 AASHTO Girder Fabrication............................................................................ 745.3 Deck Fabrication............................................................................................... 775.4 Formwork Critique ............................................................................................ 835.5 Release Camber and Stress Comparison........................................................... 865.6 Actual vs. Design Camber................................................................................. 875.7 Strain Measurements......................................................................................... 885.8 Transportation................................................................................................... 925.9 Construction...................................................................................................... 96
6 Bridge Load Test....................................................................................................... 976.1 Instrumentation.................................................................................................. 976.2 Load Test........................................................................................................... 996.3 Test Results..................................................................................................... 1026.4 Distribution Factors......................................................................................... 1056.5 End Fixity Investigation.................................................................................. 1086.6 Girder Displacements, Diaphragm and Plate Connection Stresses................. 1096.7 Impact Factors................................................................................................. 115
7 Comparison of Analytical and Experimental Studies ............................................. 1207.1 Girder Stresses and Deformation.................................................................... 1207.2 Plate Stresses................................................................................................... 1267.3 Connection...................................................................................................... 1297.4 Diaphragm Stresses......................................................................................... 129
8 Conclusions and Recommendations........................................................................ 133

6
9 Implementation and Technology Transfer .............................................................. 13510 References ........................................................................................................... 136Appendix......................................................................................................................... 138
A- Construction Report ........................................................................................ 138A.1 Site Preparation.................................................................................................. 138A.2 Girder Installation............................................................................................... 146A.3 Superstructure Construction............................................................................... 149A.4 Integral End Bent................................................................................................ 155A.5 Parapet and Guardrail......................................................................................... 157A.6 Approach Slab and Wearing Surface ................................................................. 160B- Connection Test Details .................................................................................. 165B.1 Concrete Specimen Log...................................................................................... 165C- Bridge Test Details.......................................................................................... 166D- ANSYS™ Batch Input File............................................................................. 168

7
List of Figures
Figure 2-1. Category k and j Moment Distribution Factor Comparison.........................17Figure 2-2. Independent Loss Calculations.....................................................................17Figure 2-3. Independent Stress Calculations...................................................................18Figure 2-4. Larsa™ Exterior Shear Key Girder Cross Section.......................................20Figure 2-5. Larsa™ Embedded Steel Angle Detail.........................................................20Figure 2-6. Larsa™ Plan View of Plate and Connection Detail .....................................21Figure 2-7. Larsa™ Complete Bridge Section................................................................21Figure 2-8. Truck 1 and Lane Load Layout ....................................................................22Figure 2-9. Truck 2 and Lane Load Layout ....................................................................22Figure 2-10. Truck 3 and Lane Load Layout ...................................................................22Figure 2-11. Truck 4 and Lane Load Layout ...................................................................23Figure 2-12. Plate Numbering in Plan View....................................................................25Figure 2-13. Local Plate Axis in Larsa™ ........................................................................26Figure 3-1. Equivalent Deck Girder Cross Section.........................................................32Figure 3-2. Prestress + Self-Weight Normal Stress ........................................................33Figure 3-3. Deck Girder Bridge Model...........................................................................34Figure 3-4. Plate Connecting Deck Girder Flanges ........................................................34Figure 3-5. Diaphragms on Half-Bridge Model..............................................................35Figure 3-6. Equivalent Deck Girder Stress at Extreme Fiber Comparison.....................36Figure 3-7. Equivalent Deck Girder Displacement Comparison....................................37Figure 3-8. Equivalent Truck Live Loading....................................................................37Figure 3-9. Bridge Load Test Truck Paths ......................................................................38Figure 3-10. ANSYS™ Maximum Tensile Transverse Plate Stress ..............................39Figure 3-11. ANSYS™ Maximum Compressive Transverse Plate Stress .....................40Figure 3-12. ANSYS™ Maximum Tensile Principle Plate Stress..................................40Figure 3-13. ANSYS™ Maximum Compressive Principle Plate Stress ........................41Figure 3-14. ANSYS™ Maximum Normal Stress – Diaphragm D1 .............................42Figure 3-15. ANSYS™ Maximum Normal Stress – Diaphragm D2..............................42Figure 3-16. ANSYS™ Maximum Normal Stress – Diaphragm D3..............................43Figure 3-17. ANSYS™ Maximum Normal Stress – Diaphragm D5..............................43Figure 3-18. ANSYS™ Maximum Normal Stress – Diaphragm D6..............................44Figure 3-19. 2 –Wheel Lines Distribution Factor for Interior Girder Paths ...................45Figure 3-20. 2 –Wheel Lines Distribution Factor for Exterior Girder Paths ..................45Figure 3-21. 4 –Wheel Lines Distribution Factor for Interior Girder Paths ...................46Figure 3-22. 4 –Wheel Lines Distribution Factor for Exterior Girder Paths ..................46Figure 3-23. Top Fiber Live Load Normal Stress - Deck Girder 1.................................48Figure 3-24. Deformed Shape and Un-adjusted Normal Stress- Deck Girder 1.............49Figure 4-1. Flange Connection Un-deformed Shape .......................................................50Figure 4-2. Flange Connection Deformed Shape.............................................................51Figure 4-3. Deformed Flange Connection with Pivot Surface.........................................52Figure 4-4. Test Specimen Cross-Section View ..............................................................54Figure 4-5. Test Specimen Plan View..............................................................................54Figure 4-6. Rebar Assembly in Formwork.......................................................................55Figure 4-7. Tension Connection Test...............................................................................57

8
Figure 4-8. Load vs. Displacement for Tension Tests .....................................................57Figure 4-9. Tensile Connection Failure............................................................................58Figure 4-10. Shear Connection Test.................................................................................59Figure 4-11. Load vs. Displacement for Shear Tests .......................................................59Figure 4-12. Shear Connection Failure............................................................................60Figure 4-13. Trapezoidal Areas........................................................................................65Figure 4-14. Distance Explanation for Specimen...........................................................67Figure 5-1. Space Truss Used for Support in Deck Form Work.....................................72Figure 5-2. Bolt and Collar System for Inside Truss in Deck Formwork.......................73Figure 5-3. Deck Form Work Slid Back for the Girder Fabrication...............................73Figure 5-4. End Plate of the Formwork for the Girder....................................................74Figure 5-5. End Anchorage for the Strands.....................................................................75Figure 5-6. PVC Inserts for the Diaphragms...................................................................75Figure 5-7. Final Placement of Girder Formwork with Connectors ...............................77Figure 5-8. Vehicle Used to Place the Concrete into the Formwork ..............................77Figure 5-9. Channel Welded to the Deck Formwork......................................................78Figure 5-10. Steel Angles Welded to Formwork to Form the Shear Key.......................79Figure 5-11. Inserts in Deck for Jacking.........................................................................80Figure 5-12. Embedded Angle Installation Before Placing the Concrete.......................80Figure 5-13. Block-out for Embedded Angle Connection..............................................81Figure 5-14. Dry Assembly – Lateral View....................................................................82Figure 5-15. Dry Assembly – Top View.........................................................................82Figure 5-16. AASHTO Girder Formwork.......................................................................83Figure 5-17. Section of Deck Formwork ........................................................................84Figure 5-18. Side View of Deck Formwork....................................................................84Figure 5-19. Formwork with Turn Buckles ....................................................................85Figure 5-20. Predicted vs. Actual Camber Measurements..............................................88Figure 5-21. Location of Tab Inserts at Quarter Point on the Girder..............................89Figure 5-22. Location of Tab Inserts at Mid-Span of the Girder ....................................89Figure 5-23. Actual vs. Predicted Stress Levels at Selected Points ................................91Figure 5-24. Hook Attached to Girder for Securing Down.............................................92Figure 5-25. Timbers Used for Protection of the Top Surface from the Chains.............93Figure 5-26. Truck Used for Transporting Girders.........................................................94Figure 5-27. Slot for Placement of the End of a Girder ..................................................94Figure 5-28. Chain Assembly for Securing the Girders..................................................95Figure 5-29. ArcView GIS 3.3® Image of Riding Surface Without Wearing Surface ...97Figure 6-1. Displacement Transducer Attached to the Bottom of Deck Girder .............98Figure 6-2. Strain Gages Applied to Plate Connection...................................................98Figure 6-3. Strain Transducer Attached to the Bottom of Deck Girder..........................99Figure 6-4. SAP2000™ Model.......................................................................................100Figure 6-5. Testing Vehicles Provided by NCDOT........................................................101Figure 6-6. Loading Paths for Testing.............................................................................101Figure 6-7. Top View of Deck Girder Bridge .................................................................101Figure 6-8. Deck Girder 1 Strain Values from Path 1W.................................................103Figure 6-9. Deck Girder 1 Strain Values from Path 4E..................................................104Figure 6-10. Deck Girder 2 Strain from Path 4W...........................................................104

9
Figure 6-11. Strain Readings at the Quarter-Points on Path 2 West...............................107Figure 6-12. Strain Readings at the Quarter-Points on Path 4 West...............................107Figure 6-13. Strains in D2 for Path 2 East ......................................................................110Figure 6-14. Strains in D3 for Path 3 West.....................................................................111Figure 6-15. Strains in D6 for Path 2 West.....................................................................111Figure 6-16. Diagram of Axial Forces in Diaphragms (kips) for Path 1 West...............112Figure 6-17. Diagram of Axial Forces in Diaphragms (kips) for Path 2 West...............112Figure 6-18. Plate Strains From Path 2 East ...................................................................113Figure 6-19. Deflections in Deck Girder 2 from Load Path 1 East.................................115Figure 6-20. One Truck (Slow) Loading Strains for Path 1E .........................................117Figure 6-21. One Truck (Slow) Loading Strains for Path 2E .........................................117Figure 6-22. One Truck (Slow) Loading Strains for Path 3E .........................................118Figure 6-23. Dynamic Loading Strains for Path 1E........................................................118Figure 6-24. Dynamic Loading Strains for Path 2E........................................................119Figure 6-25. Dynamic Loading Strains for Path 3E........................................................119Figure 7-1. Normal Stress at Mid-Span Path 1 ................................................................120Figure 7-2. Normal Stress at Mid-Span Path 2 ................................................................121Figure 7-3. Normal Stress at Mid-Span Path 4 ................................................................121Figure 7-4. Vertical Displacement at Mid-Span Path 1 ...................................................122Figure 7-5. Vertical Displacement at Mid-Span Path 2 ...................................................123Figure 7-6. Vertical Displacement at Mid-Span Path 4 ...................................................123Figure 7-7. 2 –Wheel Lines Distribution Factor for Interior Deck Girder Paths............124Figure 7-8. 2 –Wheel Lines Distribution Factor for Exterior Deck Girder Paths ...........125Figure 7-9. 4 –Wheel Lines Distribution Factor for Interior Deck Girder Paths............125Figure 7-10. 4 –Wheel Lines Distribution Factor for Exterior Deck Girder Paths .........126Figure 7-11. Maximum Transverse Tensile Plate Stress.................................................127Figure 7-12. Maximum Transverse Compressive Plate Stress .......................................127Figure 7-13. Maximum Principle Plate Stress ................................................................128Figure 7-14. Maximum Normal Stress - Diaphragm D1 ................................................130Figure 7-15. Maximum Normal Stress - Diaphragm D2 ................................................130Figure 7-16. Maximum Normal Stress - Diaphragm D3 ................................................131Figure 7-17. Maximum Normal Stress - Diaphragm D5 ................................................131Figure 7-18. Maximum Normal Stress - Diaphragm D6 ................................................132Figure A-1. Erosion Control Measures ...........................................................................138Figure A-2. Section View of Deck Girder Bridge ..........................................................139Figure A-3. Transverse Slope of New Deck Girder Bridge ............................................140Figure A-4. Vertical Rebar Protruding Out of Abutment ...............................................141Figure A-5. Elastomeric Bearing Pad .............................................................................141Figure A-6. Rip Rap Installed Along the Creek Bank in Front of the Abutment ...........142Figure A-7. Installation of Temporary Bridge System....................................................143Figure A-8. Finished Temporary Bridge with Safety Lines............................................144Figure A-9. 240 Ton Crane Used for Deck Girder Installation......................................145Figure A-10. Steel Beam and Scaffolding for Diaphragm Installation...........................146Figure A-11. Lifting Loops Used for Deck Girder Installation......................................147Figure A-12. Hand Tightening of the Angles Before Deck Girder Placement...............147Figure A-13. Installation of Deck Girder........................................................................148
10
Figure A-14. Stabilizing System for Deck Girders.........................................................149Figure A-15. Small Crane System Used for Diaphragm Installation..............................150Figure A-16. Collapsible Washer Used for Tightening Bolts.........................................150Figure A-17. Welding of Flange Connections ................................................................151Figure A-18. Welded Flange Connections ......................................................................152Figure A-19. Plywood Used to Form the Shear Key ......................................................152Figure A-20. Insulating Foam Used in Place of Backer Rod..........................................153Figure A-21. Gasoline Powered Rotary Mixer ...............................................................154Figure A-22. Trowel Used to Smooth Out Flange Connection Pocket...........................154Figure A-23. Damp Burlap Used to Cover the Grouted Connections ............................155Figure A-24. Integral End Bent Rebar and Formwork....................................................156Figure A-25. Concrete Used to Pour the Integral End Bent............................................156Figure A-26. Mechanical Vibration Device Used to Vibrate Concrete ..........................157Figure A-27. Removal of Block Out for Drainage Holes ...............................................158Figure A-28. Concrete Insert Placed Into the Parapet.....................................................159Figure A-29. One-Bar Metal Railing...............................................................................159Figure A-30. Geo-Membrane Installed Underneath Approach Slab...............................160Figure A-31. Epoxy Coated Rebar for Approach Slab ...................................................161Figure A-32. Raked Finish on Top of Approach Slab ....................................................162Figure A-33. Guard Rail Placed Along Side of Roadway..............................................163Figure A-34. Hydraulic Hammer Used for Driving Posts ..............................................163Figure A-35. Underside of Deck Girder Bridge..............................................................164Figure A-36. Deck Girder Bridge on Austin Rd. in Stanly Co., NC..............................164Figure C-1. Strain Transducer Layout.............................................................................166Figure C-2. Displacement Transducer Layout ................................................................166Figure C-3. Plate Connection Strain Gage Layout..........................................................167Figure C-4. Diaphragm Strain Gage Layout ...................................................................167

11
List of Tables
Table 2-1. Deck Girder Member Stress: Larsa 2000™ vs. NCDOT Design...................24Table 2-2. Unfactored Vertical Displ. Comparison: Larsa 2000™ vs. NCDOT Design.24Table 2-3. Unfactored Shear and Moment Comp. Larsa 2000™ vs. NCDOT Design....25Table 2-4. Maximum Plate Stresses - Truck 1 Fatigue (with Diaphragms)....................27Table 2-5. Maximum Plate Stresses - Truck 1 Fatigue (Without Diaphragms)..............28Table 2-6. Strength I (with Diaphragms) - Connector Plate Stresses .............................28Table 2-7. Strength I (Without Diaphragms)- Connector Plate Stresses ........................29Table 2-8. Price Comparison of NCDOT Type Bridges.................................................30Table 3-1. ANSYS™ Top Fiber Normal Stress Values – Girder 1 ................................49Table 4-1. Experimental Results – Ultimate Values.......................................................56Table 5-1. Comparison of Camber Values......................................................................87Table 5-2. Measured Strain Values After Release of Strands.........................................90Table 5-3. Comparison of Design Values and Actual Values of Stress..........................91Table 5-4. Stress Values From Larsa™ Model...............................................................91Table 6-1. Measured Weight of NCDOT Tandem Trucks..............................................100Table 6-2. Maximum Deck Girder Strain (µe) for Load Paths (Both Directions) ..........103Table 6-3. Moment Values (in k-ft) for Deck Girders 1 and 2 .......................................105Table 6-4. Distribution Factors at the Quarter-Line of Bridge Using 2 Wheel Lines.....106Table 6-5. Results of SAP2000™ Model with Different Constraints.............................109Table 6-6. Maximum Diaphragm Strain (µe)..................................................................110Table 6-7. Flange Connection Plate Strains (µe) ............................................................113Table 6-8. Deck Girder Displacements (Inches).............................................................114Table 6-9. Displacements at Mid-Span (Inches).............................................................115Table 6-10. Impact Factors for Both East and West.......................................................116Table B-1. 7-Day Concrete Ultimate Strength.................................................................165Table B-2. 28-Day Concrete Ultimate Strength...............................................................165Table B-3. Concrete Specimen Tensile Properties...........................................................165Table B-4. Concrete Properties at Pour............................................................................165
12
1 Introduction
A current initiative by the Federal Highway Administration (FHWA), and the Innovative
Bridge Research and Construction (IBRC) Program, focuses on new materials and
technologies in bridge design and construction. Under this program, a recent project
awarded to the North Carolina Department of Transportation (NCDOT) concentrates on a
high performance concrete (HPC) deck girder system, comprising of a modified
AASHTO Type III girder with an additional flange (deck) section. The objectives of the
present research project were to review the design and detailing information, monitor the
deck girder fabrication and the bridge construction processes, and finally, to load test the
completed bridge. Finite Element (FE) models of the entire bridge and the embedded
stud connections were also created to better represent the force transmission through the
diaphragms and the steel plate connectors.
This final report summarizes the findings and conclusions obtained by documenting the
bridge project from the NCDOT design phase to the quasi-static load test on the
completed bridge. The load test values are compared to the LRFD design calculations
and predictions. The comparison of the FE model and the actual load test is presented to
determine the behavior of the components and the distribution of live load on the bridge.
A parametric study on the steel connector plates was also completed to validate the
number and spacing of the steel plate connectors. The stresses associated with the steel
diaphragms were also investigated. The embedded stud connection behavior was
discussed based on actual laboratory load tests and an FE connection model. The
connection analysis provided a more precise estimate for the shear and tensile capacity of
the connection used in the constructed deck girder bridge project. The FE model allowed
the change in loading and geometry associated with the connection.

13
1.1 Literature Review
The primary source of existing literature on deck girders was located in PCI journal
articles authored by Anderson. Other related information contained discussions about
pry-out capacity and design criteria of headed studs. An article concerning the effects of
diaphragms on live load distribution was also located in the Canadian Journal of Civil
Engineering.
Little research has been published about deck girders, and no known published research
has been found using the AASHTO LRFD Specifications for the design of deck girders
using standard AASHTO I-Beams. A PCI Journal article was published by Anderson
(1973) describing the longer span capabilities of segmental type construction using a
deck girder system with what was then known as AASHO-PCI Beams Type III and IV.
The Type III and IV beams were cast integral with the deck portion prior to post-
tensioning in the field to achieve maximum span capabilities.
Another PCI Journal article written by Anderson (CTA, 1973) describes how Mr.
Anderson and his brother, along with their two former companies developed the deck
girder system as we know it today. A technical bulletin from the Concrete Technology
Associates (CTA), one of the companies formed by the Anderson brothers, was found to
also include a design example demonstrating that long spans can be achieved with
segmental deck girders and the use of post-tensioning only (CTA, 1973).
Additional related publications include an article in the Canadian Journal of Civil
Engineering by Cheung (1986). This article describes a theoretical approach for
computing and evaluating the structural behavior of diaphragms in a beam-and-slab
system with two or more diaphragms for short to medium-span bridges. Two, more
recent PCI Journal articles were found that discuss pry-out capacities and shear capacities
of headed stud anchorages (Anderson and Meinheit, 2000 and 2005).

14
Deck bulb-tee girders using standard AASHTO I-beams based on the LRFD design
method was also reviewed in a thesis authored by Bailey (2006). The thesis discusses the
LRFD design method by exploring how deck girder spacing, AASHTO girder type,
material strength, and prestress strand pattern affect the applications of the deck girders.
1.2 Research Objectives
The primary focus of this research project was to evaluate a new deck girder bridge
system and provide the NCDOT with feedback information to aid in the design and
construction of similar bridge systems. The fabrication stage of the bridge project was
monitored to provide future fabricators with knowledge addressing common problems
and alternative methods for casting the deck girders. The transportation from the casting
yard to the bridge site was also documented to further close the gap between the
fabrication standards and the requirements for safely transporting the deck girders. The
accuracy of the LRFD design was evaluated to compare the design calculations with the
actual performance of the deck girder bridge.
The ANSYS™ FE model was created to allow a parametric study to be performed. The
influence of the steel plate connectors and the steel diaphragms were then evaluated to
provide the NCDOT with data for future deck girder designs. The actual flange
connection (as constructed) was then tested and modeled in an FE program to establish
capacities that do not exist in the current PCI Design Handbook 6th Edition (2004). It is
our hope that the research project will provide the NCDOT with a base of information
that can be used to design deck girder systems and the components associated with the
bridge systems, with a working knowledge of how well the LRFD design method applies
to this particular bridge type.

15
2 Design and Detailing
2.1 Bridge Description
The deck girder bridge was designed, using the most recent AASHTO LRFD
specifications, as a two lane bridge spanning over Long Creek (a clear water creek) in
Stanly County, North Carolina. The total bearing to bearing span is 106’ with no
intermediate supports and with integral end bents. The bridge consists of five 107’-4”
independent prestressed deck girders that were connected with steel plates spaced at 5’-0”
on center and steel diaphragms at the quarter and half points. The standard type III
AASHTO girders were cast first, then the 6’-6” deck section was cast (using the same
concrete mix as for the girder section) and allowed to cure to the release strength of
5,500psi. The prestress strands were cut only when the total section had reached the
allowable release strength. The net section was then prestressed and acted as a single
unit.
Once the girders were placed in the final positions at the construction site, the steel
diaphragms were installed and the embedded stud connections were joined by a welded
steel plate. The shear key voids between the adjacent deck girder flanges were then filled
with a non-shrink grout. The parapet walls were poured and the guardrails were installed.
The final asphalt surface was then paved and the bridge was opened to traffic.
2.2 Design Review
A design review was performed on the hand calculations for the deck girder design and
was completed in two different stages. The first stage was an initial review of the
calculations for the actual deck girders. The second stage consisted of a review of the
calculations, plus referring to the LRFD Specifications throughout each step. The girder
design hand calculations were studied to help understand the process used for the
particular project.

16
The moment and shear distribution factors for interior and exterior girders were chosen
based on the cross section and the criteria in AASHTO LRFD Table 4.6.2.2.1-1. Type
“k” describes a bridge design that contains a sufficiently connected deck to act as a unit,
such as a monolithic deck girder construction. Type “j” (for the purpose of this report)
describes a bridge that consists of individual deck girders connected with flexible
connection. The factors represent the connections’ ability to transfer load from girder to
girder. Upon reviewing the design calculations, the use of bridge type “k” for computing
distribution factors was seen, which also includes type “j” bridges appropriately with
rigid connection. However, the use of bridge type “j” (with flexible connection) is more
common for computing live load distribution factors for bulb tee sections, and it is more
appropriate for this bridge. This distribution factor was also confirmed by the bridge test
results.
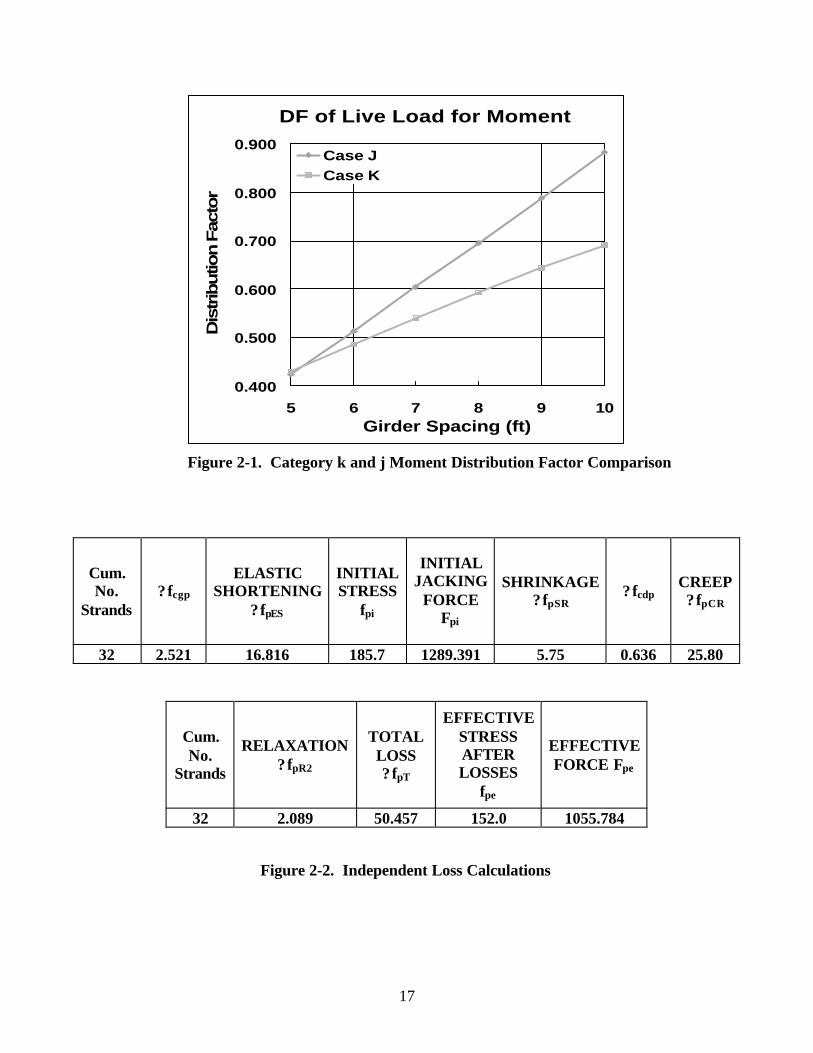
As demonstrated in Figure 2-1, the difference in distribution factors for moment is
insignificant when girder spacing is small. In this project the girder spacing of 6.5 ft. is
relatively small; therefore, the assumption will have very little effect on the design
moment (Case k = 0.513 and Case j = 0.558). However, if in the future larger girder
spacing will be desired, the connection details should be more closely investigated and
designed for a rigid connection between deck girders.
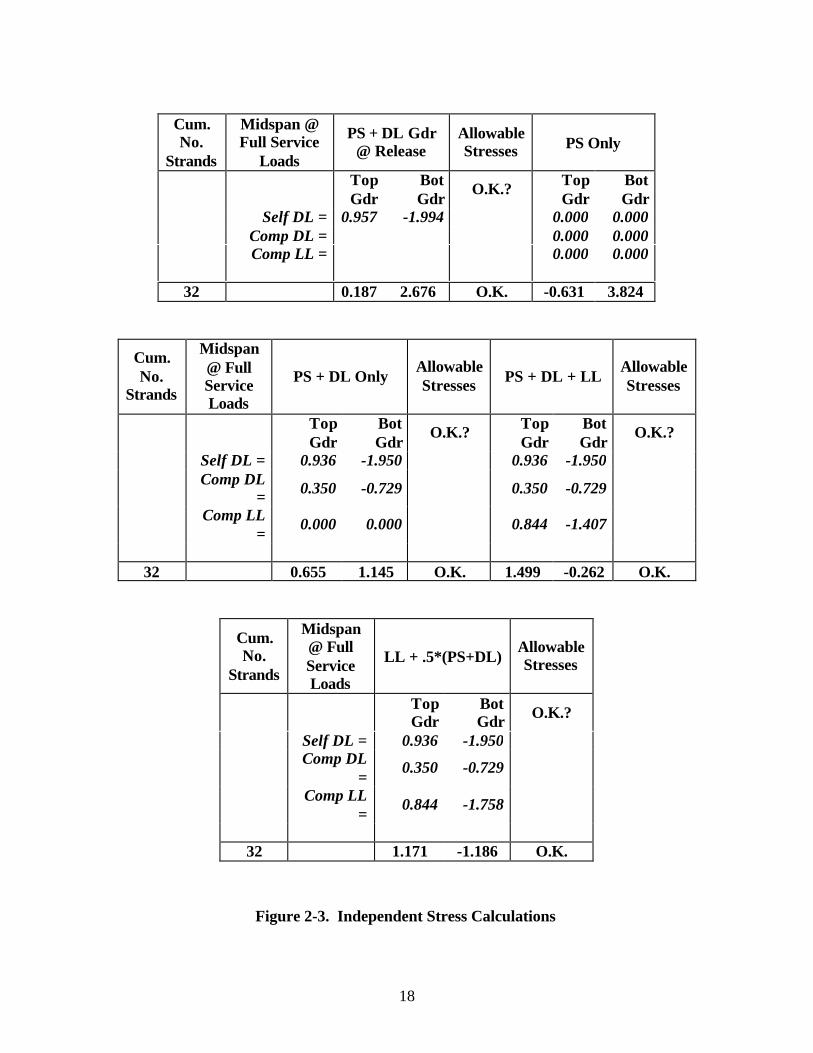
An independent evaluation of the prestress design and factored deck girder stresses using
an in-house spreadsheet program was also performed at Ralph Whitehead Associates,
Inc. (RWA) using the more conservative type “j” bridge assuming a more flexible
connection. See Figures 2-2 and 2-3 for a sample output of the independent
computations performed for this project. This program produced very similar results to
the NCDOT hand calculations throughout the computational process in accordance with
the AASHTO LRFD specifications.
17
DF of Live Load for Moment
0.400
0.500
0.600
0.700
0.800
0.900
5 6 7 8 9 10Girder Spacing (ft)
Dis
trib
utio
n F
acto
r
Case JCase K
Figure 2-1. Category k and j Moment Distribution Factor Comparison
Cum.No.
Strands?fcgp
ELASTICSHORTENING
?fpES
INITIALSTRESS
fpi
INITIALJACKING
FORCEFpi
SHRINKAGE?fpSR
?fcdpCREEP?fpCR
32 2.521 16.816 185.7 1289.391 5.75 0.636 25.80
Cum.No.
Strands
RELAXATION?fpR2
TOTALLOSS?fpT
EFFECTIVESTRESSAFTERLOSSES
fpe
EFFECTIVEFORCE Fpe
32 2.089 50.457 152.0 1055.784
Figure 2-2. Independent Loss Calculations
18
Cum.No.
Strands
Midspan @Full Service
Loads
PS + DL Gdr@ Release
AllowableStresses PS Only
Top
GdrBotGdr
O.K.? TopGdr
BotGdr
Self DL = 0.957 -1.994 0.000 0.000 Comp DL = 0.000 0.000 Comp LL = 0.000 0.000
32 0.187 2.676 O.K. -0.631 3.824
Cum.No.
Strands
Midspan@ FullServiceLoads
PS + DL OnlyAllowableStresses PS + DL + LL
AllowableStresses
Top
GdrBotGdr
O.K.? TopGdr
BotGdr
O.K.?
Self DL = 0.936 -1.950 0.936 -1.950
Comp DL
= 0.350 -0.729 0.350 -0.729
Comp LL
=0.000 0.000 0.844 -1.407
32 0.655 1.145 O.K. 1.499 -0.262 O.K.
Cum.No.
Strands
Midspan@ FullServiceLoads
LL + .5*(PS+DL)AllowableStresses
Top
GdrBotGdr O.K.?
Self DL = 0.936 -1.950
Comp DL
=0.350 -0.729
Comp LL
=0.844 -1.758
32 1.171 -1.186 O.K.
Figure 2-3. Independent Stress Calculations

19
2.3 Larsa™ Model Construction
A parametric study was conducted using Larsa™ 2000 4th Dimension for Bridges
(Larsa™, 2005), a software developed for bridge analysis and design (this software was
provided by Larsa™ Inc. free of charge for the duration of the present project). The
program allows accurate assembly of the bridge elements as they are fabricated and
constructed in the field. This feature allowed all loadings and restraints to be applied in a
staged construction order. Once completed, the program reported results (such as
member stresses, camber due to prestress, etc...) that were comparable with the design
hand calculations performed by the NCDOT. Some of the member output values from
Larsa™ were smaller than the hand calculation results, a discrepancy that can be
attributed to the fact that in the hand calculations the entire 10 feet wide lane load was
applied to a single 6’-6” wide deck girder section (which resulted in a more conservative
design).
The first step in completing the Larsa™ model was defining the six different girder cross
section types (Figure 2-4). The next step involved extruding the sections to the desired
length from bearing to bearing. Figures 2-5 through 2-7 show the connection details, as
well as the bridge superstructure model respectively. As it can be seen in Figure 2-7, in
this parametric study it was assumed that the bridge is simply supported at both ends
(pinned-roller connection). This assumption was also used in the hand calculations;
however, the integral end walls will introduce negative moments close to the supports.
The Larsa™ model used later in this report to compare with actual load test results had
fixed supports at both ends of the deck girders. The design calculations however, were
computed with simple supports as was the initial Larsa™ model. This integral end bent
contribution to stiffness was also further investigated in the ANSYS™ FE model.
Another limitation of this model was the angle-to-steel plate connections. The current
modeling techniques in Larsa™ allowed the plates to be connected to the embedded
angles only at the four corners, instead of the fillet weld connection to be performed in
the field. Furthermore, the shear keys were not filled with a grout, connecting the deck

20
girder flanges. These limitations resulted in a more flexible and weaker connection
details, causing the initial analytical study to predict higher than anticipated forces in the
connecting plates. Therefore, the Larsa™ analytical results should be viewed as a
qualitative analysis, rather than a quantitative evaluation. The main purpose of the
Larsa™ model was to aid the research team when deciding how to instrument the bridge
for the load test. The creation of a working ANSYS™ model in this time frame was not
feasible. The ANSYS™ FE model was restrained as constructed with the integral end
bent and finer connection details were created to provide a more accurate model of the
constructed bridge, this is discussed later in Chapter 3. The ANSYS™ FE model was
also calibrated to the actual load test.
Figure 2-4. Larsa™ Exterior Shear Key Girder Cross Section
Figure 2-5. Larsa™ Embedded Steel Angle Detail

21
Figure 2-6. Larsa™ Plan View of Plate and Connection Detail
Figure 2-7. Larsa™ Complete Bridge Section
After assembling the deck girders in the model, all connection plates were added at 5’-0”
on center along each span. All dead loads generated from structural and non-structural
components were applied. The lane paths, which represent the wheel lines of a truck
axle, were then generated. The HL-93 design truck and the corresponding 10’-0” wide
lane loading was placed at four strategic locations that would result in the highest stresses
in the steel plates. The lane loads and the truck wheel paths are shown in Figures 2-8
through 2-11. Additionally, tendon paths were placed at the centroid of the strand group
in each deck girder to allow loading from the prestress forces. Figure 2-8 represents the
worst case loading condition, when both lanes are loaded and maximum stresses are
recorded in the connections.

22
Figure 2-8. Truck 1 and Lane Load Layout
Figure 2-9. Truck 2 and Lane Load Layout
Figure 2-10. Truck 3 and Lane Load Layout

23
Figure 2-11. Truck 4 and Lane Load Layout
2.4 Larsa™ Model Results
The Larsa 2000™ bridge model provided very similar values for a number of different
NCDOT hand calculations presented in the design document (Hanks, 2005). The stresses
at release were found to be within 15% at the top fiber and within 2% at the bottom fiber.
Small differences, 7% maximum, in stresses at service loads were reported (see Table 2-
1). The calculated values for stresses induced under the live loading are shown for each
of the four different live load cases. Worst case girder forces were caused by loading
conditions that did not correspond with the controlling loading conditions for the plate
connectors. Therefore, several load cases were considered in addition to the more
standard loading cases performed in hand calculations.
The deflection and camber values provided by the NCDOT also provided an excellent
model check. The difference in vertical displacement in the girder at mid-span was only
0.14” (2.46” in NCDOT calculations, and 2.60” Larsa™ results). Only self weight and
prestress at release were considered in the next simple comparison (see Table 2-2). A
comparison of unfactored shear and moment values from the Larsa™ model and the
NCDOT design calculations was also performed (see Table 2-3). As it can be seen, the
Larsa™ model results closely matched the hand calculations, and an initial parametric
study followed these preliminary model calibrations. The Larsa™ model was used as a

24
preliminary indication of how to instrument the actual bridge and the deck girders were
simply supported. As it was stated earlier, due to modeling limitations, these analyses
should be viewed as a qualitative evaluation, rather than a quantitative study.
Table 2-1. Deck Girder Member Stress: Larsa 2000™ vs. NCDOT Design
Location Load CaseLarsa
Stress atTop (ksi)
NCDOTStress at Top
(ksi)
LarsaStress atBottom
(ksi)
NCDOTStress atBottom
(ksi)
mid-spanDead +
Prestress @Release 0.165 0.191 2.788 2.725
mid-spanDead +
Prestress @Service Loads 0.675 0.709 1.165 1.085
mid-spanDead +
Prestress +Live Load 1.265 1.725 0.171 0.572
mid-span0.5(Dead +Prestress) +Live Load 1.488 1.371 n/a n/a
Table 2-2. Unfactored Vertical Displacement Comparison: Larsa 2000™ vs.NCDOT Design
Vertical Displacement (in.)Location
AlongSpan
LarsaModel
(in.)
NCDOTCalculations
(in.)P/S Camber @ Release mid-span 4.62 4.48Deck Girder Self-weightDeflection mid-span -2.02 -2.02Net Camber mid-span 2.60 2.46Rail/Overlay/FWSDeflection mid-span -0.67 -0.66

25
Table 2-3. Unfactored Shear and Moment Comparison: Larsa 2000™ vs. NCDOTDesign
ForceUnfactored
AppliedLoads
LocationAlongSpan
LarsaModel
NCDOTCalculations
Total DCLoad
memberend 75.3 76.0Interior/Exterior
Beam Shear (kips) Total DWLoad
memberend 22.9 23.0
Total DCLoad mid-span 1994.4 2003.0
Interior/ExteriorBeam Moment (k- ft)
Total DWLoad mid-span 610.9 611.0
Note: DC = Dead Load of Structural Components and Non- Structural Attachments DW = Dead Load of Structural Overlay and Future Wearing Surfaces
Based on the plate stresses obtained from the Larsa™ model, a connection fatigue
analysis was performed. The welded connector plate experiences the highest fatigue
stress based on Truck 1 loading condition, and caused a maximum stress in the first plate
between girder lines 2 and 3 (see Figure 2-12 for plate numbering). The axis and plane
geometry of the plate is shown in Figure 2-13, “X” being the longitudinal axis of the
bridge.
Figure 2-12. Plate Numbering in Plan View

26
Figure 2-13. Local Plate Axis in Larsa™
For analyzing fatigue in the connector plates (1/2” x 3” x 4”), the Load-Induced Fatigue
section (6.6.1.2.2) of the LRFD specifications were considered (using Equations 2-1
through 2-3), since no other specific information was available for these connection
details. The LRFD Bridge Design Manual does not contain a method for selecting a
detail category; therefore, using Detail 17 in Figure 6.6.1.2.3-1, Detail Category “D” was
selected based on similarities with the specified field welding conditions.
The largest live load stress due to fatigue truck loading was 1.38 ksi (see Table 2-4), a
value significantly lower than the nominal fatigue resistance for the plate calculated as
3.7 ksi, as shown in the LRFD 6.6.1.2.2-1 design criteria.
( ) ( )nFf ∆≤∆γ (2-1)
where:? = load factor specified in LRFD Table 3.4.1-1 for the fatigue load combination(? f) = force effect, live load stress range due to the passage of the fatigue load as specified in LRFD Article 3.6.1.4(?F)n = nominal fatigue resistance as specified in LRFD 6.6.1.2.5 (Equation 2-2)
THn FNA
F )(21
)(3/1
∆≥
=∆ (2-2)
and

27
SLADTTnN )()75)(365(= (2-3)
where:A = constant from LRFD Table 6.6.1.2.5-1n = number of stress range cycles per truck passage (LRFD Table 6.6.1.2.5-2)(ADTT)SL = single – lane ADTT as specified in LRFD Article 3.6.1.4(?F)TH = constant – amplitude fatigue threshold (LRFD Table 6.6.1.2.5-3)
Fatigue Design Calculations:
? = 0.75(?f) = 1.38 ksiA = 22.0 x 10⁸ ksi3
n = 1.0(ADTT)SL = 0.85 x 1875(?F)TH = 7.0
=×= )187585.0)(0.1)(75)(365(N 43,628,906.3
)0.7(21
3.906,628,43100.22
)(3/18
≥
×=∆ nF
⇒≥= 5.37.3 OK use 3.7
==∆ )38.1(75.0)( fγ 1.04 ksi < 3.7 ksi ⇒ OK
Table 2-4. Maximum Plate Stresses - Truck 1 Fatigue (with Diaphragms)
Sxx Syy Sxy Principal MaxPlateId
Locationksi ksi ksi ksi
2 Top 0.446 0.289 -0.142 0.52910 Bottom 0.175 1.378 -0.120 1.39061 Bottom -0.093 -0.236 0.848 0.68610 Bottom 0.175 1.378 -0.120 1.390

28
In order to investigate the effect of diaphragms on the connection stresses, the diaphragm
members were then removed and the same loading conditions were performed to find the
effect on the plates during fatigue analysis. The results show that the diaphragm had a
considerable effect on the plate stresses, especially in the Syy (transverse) direction
(results shown in Table 2-5). These stresses are still lower than the nominal fatigue
resistance calculated above.
Table 2-5. Maximum Plate Stresses - Truck 1 Fatigue (Without Diaphragms)
Sxx Syy Sxy Principal MaxPlateId Location
ksi ksi ksi ksi56 Bottom -0.624 -1.812 0.112 -0.61310 Bottom 0.403 2.156 -0.111 2.16349 Bottom -0.226 -0.848 -0.878 0.39410 Bottom 0.382 2.132 -0.257 2.169
In addition to evaluating fatigue stresses in the connector plates, other stresses due to the
LRFD Strength I - Truck 3 loading combination were also considered. Strength I load
combination was found to produce the maximum stresses in the connector plates. These
results are shown in Tables 2-6 and 2-7. Similarly to the parametric study done for the
fatigue analysis, this strength analysis considered both the current design configuration,
as well as a bridge without diaphragms.
Table 2-6. Strength I (with Diaphragms) - Connector Plate Stresses
Sxx Syy Sxy Principal MaxPlateId Location
ksi ksi ksi ksi69 Bottom 2.777 5.595 1.456 6.21275 Bottom 2.416 13.508 1.761 13.78139 Bottom -0.280 -0.424 -4.018 3.66775 Bottom 2.416 13.508 1.761 13.781

29
Table 2-7. Strength I (Without Diaphragms)- Connector Plate Stresses
Sxx Syy Sxy Principal MaxPlateId
Locationksi ksi ksi ksi
32 Bottom - 4.854 -9.191 1.537 -4.36577 Bottom 4.515 27.131 0.490 27.14243 Bottom -0.963 -1.565 -10.115 8.85577 Bottom 4.515 27.131 0.490 27.142
The maximum principal stress in the plate connectors was determined to be 13.781ksi.
This value was heavily influenced by the Syy stress of 13.51 ksi in the transverse
direction. The maximum stress in each combination is provided in bold text. The tensile
(pull-out) force at the contact point between the welded plate and the angle was
calculated to be 24.3 kips (48.9 kips). However, as it was mentioned earlier, the Larsa™
model did not truly capture the rigidity of the bridge and the connections detail.
Therefore, the initial Larsa™ force values are believed to considerably overestimate plate
stresses.
The values from Table 2-7 prove that the absence of diaphragms considerably increases
the connection stresses, well beyond their estimated pull-out capacities. The maximum
stress in any of the diaphragms under all load conditions considered was found to occur
in Strength I Truck I load condition. The stress caused by this load combination was 6.39
ksi, which represented only 18% of the diaphragm material yield stress of 36 ksi. This
proves that the diaphragms have ample strength capacity, considering a more flexible
Larsa™ model.

30
2.5 Construction Economical Analysis
The cost for construction of the bridge in Stanly County was an aspect that needed to be
addressed for further decisions to use modified AASHTO prestress deck girders for other
bridge projects. The NCDOT provided bidding information on two other bridge projects
of different types along with the project on Austin Road. The bidding information for the
cost of the superstructure is shown in Table 2-8. Projects B-3630 and B-3376 both
required a concrete deck to be poured after the girders were placed on site.
The net cost of each project shows that the deck girder bridge was more expensive than
using bulb-T beams or steel plate girders. This could have been expected because the
AASHTO Type III prestress concrete deck girders had never been fabricated before – and
if more sections are fabricated in the future, their cost should be lower based on economy
of scale. Though this project was more expensive than similar projects, the traveling
public benefited from a significantly reduced road closure period. The construction
prices for a deck girder bridge in a more accessible area may decrease the price of the
project. However, the construction of this deck girder bridge was roughly 3-4 weeks
faster than a normal bridge project where the deck is poured on site (when bulb T or steel
girders are used). This could save a significant amount of labor and material cost.
Table 2-8. Price Comparison of NCDOT Type Bridges
Project Superstructure Net CostBearing Length
(ft.)Bearing Area
(ft.2)Net Cost/
ft.2
B-363060" Steel PlateGirder $315,375.80 120 3,730 $84.55
B-3376 63" Bulb T $360,253.36 105 3,992 $90.24
B-3700
Type III PrestressedConcrete DeckGirder $423,561.70 110 3,575 $118.48

31
3 FE Analysis
An ANSYS™ FE model of the deck girder bridge was created to facilitate a parametric
study on the steel plates and steel diaphragms. The model also allowed changes in the
material properties and live loading patterns to evaluate the effects on the bridge as a
whole. The deck girders were modeled using the ultimate concrete strengths from the
cylinders that were tested at the time of the load test. The prestress strands were given
the strain values that were present after all losses, because no time analysis was
performed in the FE program. The asphalt overlay, parapet rail, and the future wearing
surface were omitted because only the live loading effects were recorded during the
actual load test.
The use of ANSYS™ was warranted due to the program’s ability to report values of
stress and displacement at multiple locations within a member. This feature allowed
small members (steel plates) to report stress contours throughout the whole cross section,
whereas in Larsa™ the extreme fiber stresses are the only available values. The ability to
“weld” the plate connectors to the flange surfaces also captured a more accurate fixity of
the steel plates. ANSYS™ does not have a moving load option; this was amended by
placing the load test truck at mid-span to create near maximum moment and deflection
values that coincided with the actual load test stress levels. ANSYS™ also did not allow
for staged construction steps, this required fixing the girder ends that were incased by the
integral end bents before prestress effects were applied.
3.1 Model Description
The ANSYS™ deck girder bridge model was created by first modeling one deck girder
that produced comparable stress and camber values to NCDOT and Larsa™ results.
Once the completed girder was verified, the other four girders were generated. The steel
plates and diaphragms were then placed on the model, and the prestress and self-weight
loads were added. The plates and diaphragms were placed on the bridge before tendon
release, because no construction stage option was available in ANSYS™. The stresses in

32
the plates and diaphragms due to the prestress and dead load were recorded in ANSYS™
so that post-construction live load effects could be analyzed separately. The equivalent
girder cross section is shown in Figure 3-1.
Figure 3-1. Equivalent Deck Girder Cross Section
The simply supported girder was created using SOLID65 elements, which are 3-D
reinforced concrete elements with cracking and crushing capabilities. The prestress force
was induced by using axial LINK8 elements with an initial strain. The steel plates and
diaphragms were modeled using the two-node BEAM4 line elements. The deck girder
cross section was modified from the one described in Interim Report III, to allow the
plates and diaphragms to be placed between adjacent girders. The steel members were
modeled using 36 ksi steel with an elastic – perfectly plastic stress/strain relationship.
The deformed girder under the prestress and self-weight conditions is shown in Figure 3-
2.

33
Figure 3-2. Prestress + Self-Weight Normal Stress
The creation of the entire bridge in ANSYS™ proved to be a very time and disk space
consuming operation. To alleviate this problem, only half of the bridge was modeled and
a symmetry plane was placed at deck girder mid-span perpendicular to the direction of
traffic. This allowed the entire bridge to be modeled, while only using half of the
computing resources necessary. The five generated deck girders are shown in Figure 3-3.

34
Figure 3-3. Deck Girder Bridge Model
The five deck girders were first connected by the 1/2” steel plates spaced at 5’-0” centers.
A typical plate is shown in Figure 3-4 connected between adjacent deck girder flanges.
The steel angle and corresponding shear studs were omitted due to the large size contrast
and the meshing limitations of ANSYS™. The deck girders were then braced with the
line element diaphragms with fixed moment transferring connections. The diaphragms at
mid-span and the quarter points are shown in Figure 3-5.
Figure 3-4. Plate Connecting Deck Girder Flanges

35
Figure 3-5. Diaphragms on Half-Bridge Model
3.2 Model Calibration
The first step in creating a working ANSYS™ model was generating one deck girder that
produced prestress properties that matched the NCDOT and Larsa™ model values. After
the individual deck girder was deemed accurate the generation of the entire bridge was
then completed. The comparison of the normal stress at extreme fibers at mid-span and
the deflection at mid-span were used to verify that the mesh accurately captured the
behavior of the girder at the time of construction. The model was restrained with a pin
and roller connection as designed by the NCDOT. The model was later restrained by
fixing the areas that were enclosed by the integral end bent to capture the bridge behavior
at the time of the load test.

36
The equivalent deck girder normal stress comparisons are shown in Figure 3-6 (prestress
+ self-weight). The equivalent deck girder deflection and camber are shown in Figure 3-
7. It is clear that the modeled deck girder produced comparable results while containing
the necessary mesh pattern to include the plates and diaphragms. As expected, the
diaphragm and plate additions to the five independent girders resulted in an insignificant
effect on the stress and camber of the individual girders before post construction live
loads were added.
0.000.501.001.502.002.503.00
*All Values are Compression
Str
ess
(ksi
)
LARSA™ 0.1658 2.8005
ANSYS™ 0.1740 2.7830
NCDOT 0.1910 2.7250
Top of Girder Bottom of Girder
Figure 3-6. Equivalent Deck Girder Stress at Extreme Fiber Comparison

37
0.00
0.50
1.00
1.50
2.00
2.50
3.00
3.50
Dis
pla
cem
ent (
in.)
LARSA™ 1.303 2.980 1.678 0.754
ANSYS™ 1.300 2.904 1.604 0.810
NCDOT 1.300 2.889 1.589 0.749
Deflection Dead ?
Prestress ?Prestress +
Dead ?50k
Deflection ?
Figure 3-7. Equivalent Deck Girder Displacement Comparison.
The ANSYS™ model was first generated with simple supports and all load test paths
were entered into the program. The use of symmetry in the model required the creation
of an equivalent truck live load that could be reflected across the symmetry plane of the
bridge model. The equivalent truck loading per axle is shown in Figure 3-8, where the
center of the equivalent truck was placed on the longitudinal centerline of the bridge
(dashed line). This centerline is also the plane of symmetry used in the FE program.
Figure 3-8. Equivalent Truck Live Loading

38
The ANSYS™ model was then subjected to three of the five load paths that were used
when the bridge was load tested. The total amount of load paths was not used due to the
symmetry of the FE bridge model. The load paths modeled in ANSYS™ were paths 1, 2,
and 4. The quasi-static load testing procedure is discussed in greater depth in the bridge
load test section of this paper (chapter 6). The five bridge test truck paths are shown in
Figure 3-9.
Figure 3-9. Bridge Load Test Truck Paths
The calibrated ANSYS™ and Larsa™ models with simple supports proved to be more
flexible than the actual bridge. The simply supported deck girder stresses and
displacements in Larsa™ and ANSYS™ were higher than the instruments captured when
the bridge was load tested. The simply-supported deck girder model was deemed too
flexible and the fixity of the actual bridge was then modeled in the two computer
programs. The integral end bent fixity was modeled in ANSYS™ by restraining the
areas that were enclosed by the end bent. The decision was made to compare the fixed
ANSYS™ and Larsa™ models to the actual load test values. This support condition
change yielded deck girder stresses and displacements that were very comparable to the
actual load test in both computer models. These comparisons are discussed further in
chapter 7.

39
3.3 Parametric Study
After the FE model was calibrated and the girder results were comparable to the actual
load test, a parametric study was performed on the steel plates and diaphragms. The plate
stresses were obtained from the fixed-end ANSYS™ model that behaved similarly to the
actual load test. The plate spacing was specified at 5’-0” on center. The initial Larsa™
computer model showed that the maximum plate stress occurred in the transverse
direction (perpendicular to traffic). Therefore, the considered plate stress values from the
load test (later discussed in Chapter 6) and the parametric study were primarily the
transverse and principal values.
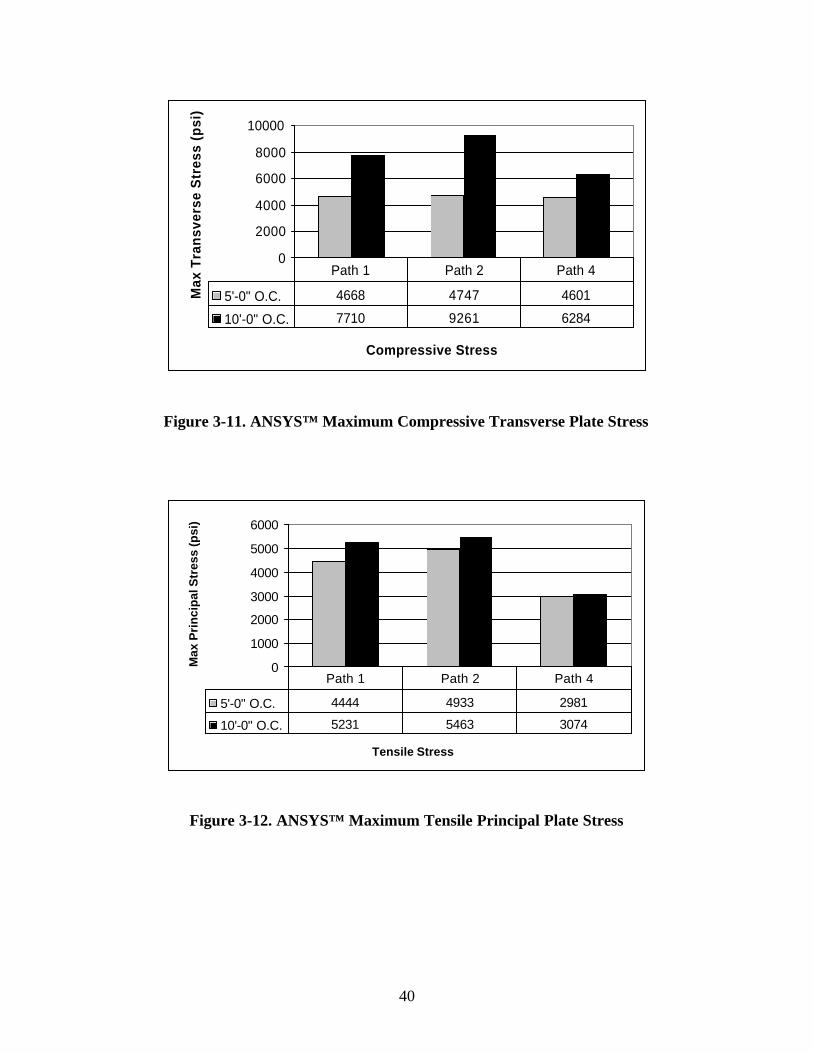
The plate spacing was increased to 10’-0” on center and the maximum tensile and
compressive transverse stress values (peak values from ANSYS not necessarily
corresponding to an actual strain gage location on the bridge) in the plates were compared
(see Figures 3-10 through 3-11). This was completed to evaluate the effect of connection
spacing on the stress in the plates and the diaphragms. The larger spacing increased the
plate stresses, and thus reduced the safety factor of these connections significantly –
therefore, this modification is not recommended without redesigning the connection
detail. The influence of the spacing on the plate principal stress (highest stress at a given
location, acting on the principal plane) is shown in Figures 3-12 through 3-13.
0
5001000
15002000
25003000
3500
Tensile Stress
Max
Tra
nsv
erse
Str
ess
(psi
)
5'-0" O.C. 1960.8 2011.4 2188.7
10'-0" O.C. 2213 2212 3117
Path 1 Path 2 Path 4
Figure 3-10. ANSYS™ Maximum Tensile Transverse Plate Stress
40
0
2000
4000
6000
8000
10000
Compressive Stress
Max
Tra
nsv
erse
Str
ess
(psi
)
5'-0" O.C. 4668 4747 4601
10'-0" O.C. 7710 9261 6284
Path 1 Path 2 Path 4
Figure 3-11. ANSYS™ Maximum Compressive Transverse Plate Stress
0
1000
2000
3000
4000
5000
6000
Tensile Stress
Max
Pri
nci
pal
Str
ess
(psi
)
5'-0" O.C. 4444 4933 2981
10'-0" O.C. 5231 5463 3074
Path 1 Path 2 Path 4
Figure 3-12. ANSYS™ Maximum Tensile Principal Plate Stress

41
0
2000
4000
6000
8000
10000
12000
Compressive Stress
Max
Pri
nci
pal
Str
ess
(psi
)
5'-0" O.C. 8245 8798 5652
10'-0" O.C. 9919 11115 5769
Path 1 Path 2 Path 4
Figure 3-13. ANSYS™ Maximum Compressive Principal Plate Stress
The effect of the diaphragms was then evaluated by running the FE model with the
diaphragms at the quarter and half points of the bridge. The diaphragms are numbered
and located according to the instrument layout included in Appendix C. The normal
stress in the diaphragms is shown in Figures 3-14 through 3-18 with all the plate
connectors as constructed in the field and with the connector plates at 10’-0” on center.

42
0
500
1000
1500
2000
2500
3000
Max
No
rmal
Str
ess
(psi
)
5'-0" O.C. 2439 514 871
10'-0" O.C. 921 337 331
Path 1 Path 2 Path 4
* (-) = Compression
(+) = Tension
Figure 3-14. ANSYS™ Maximum Normal Stress – Diaphragm D1
-500
0
500
1000
1500
2000
2500
3000
3500
4000
Max
No
rmal
Str
ess
(psi
)
5'-0" O.C. 1131 3395 -86
10'-0" O.C. 767 1615 -78
Path 1 Path 2 Path 4
* (-) = Compression
(+) = Tension
Figure 3-15. ANSYS™ Maximum Normal Stress – Diaphragm D2

43
-1500
-1000
-500
0
500
1000
1500
2000
2500
3000
Max
No
rmal
Str
ess
(psi
)
5'-0" O.C. -462 2607 -966
10'-0" O.C. -104 1303 -471
Path 1 Path 2 Path 4
* (-) = Compression
(+) = Tension
Figure 3-16. ANSYS™ Maximum Normal Stress – Diaphragm D3
0
200
400
600
800
1000
1200
1400
Max
No
rmal
Str
ess
(psi
)
5'-0" O.C. 537 184 170
10'-0" O.C. 1241 248 440
Path 1 Path 2 Path 4
* (-) = Compression
(+) = Tension
Figure 3-17. ANSYS™ Maximum Normal Stress – Diaphragm D5

44
-500
0
500
1000
1500
2000
Max
No
rmal
Str
ess
(psi
)
5'-0" O.C. 308 861 -45
10'-0" O.C. 698 1695 -42
Path 1 Path 2 Path 4
* (-) = Compression
(+) = Tension
Figure 3-18. ANSYS™ Maximum Normal Stress – Diaphragm D6
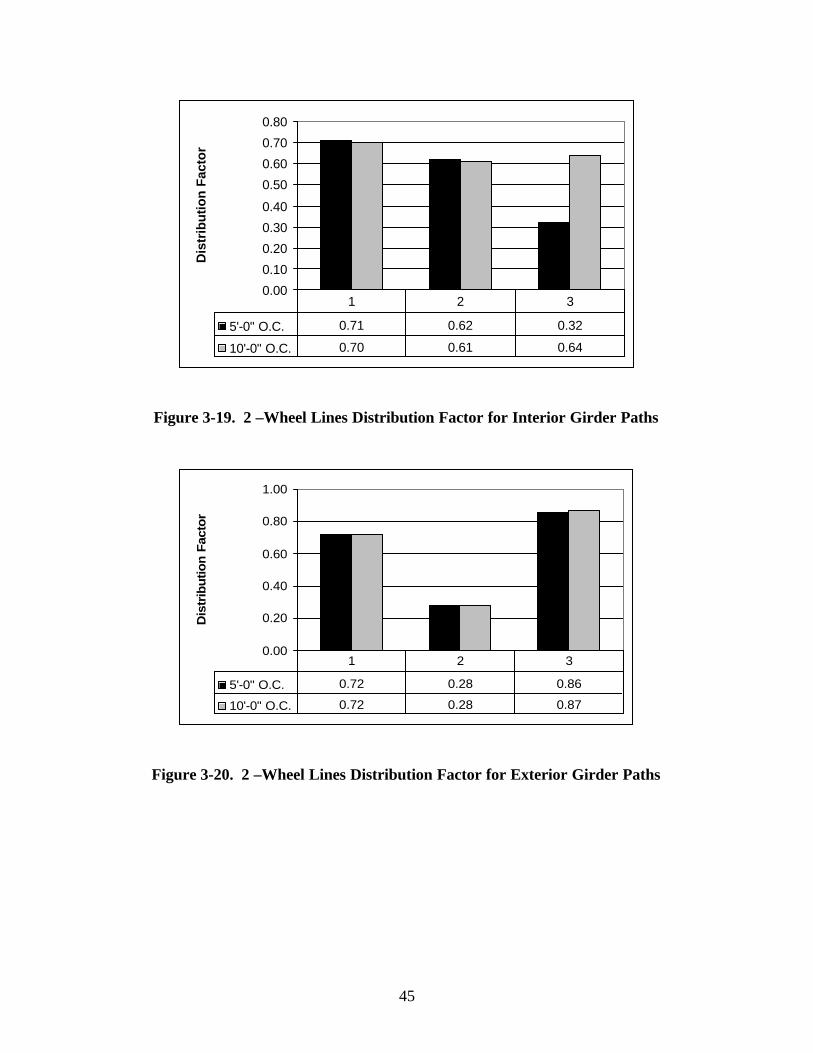
The effect of the plate spacing on the live load distribution was also investigated (see
Figures 3-19 through 3-22). The distribution factors for interior and exterior deck girders
were calculated using the 2 and 4-wheel line methods. The methodology of the
distribution factor calculations is discussed in depth later in Chapter 6.
45
0.00
0.10
0.20
0.30
0.40
0.50
0.60
0.70
0.80
Dis
trib
utio
n F
acto
r
5'-0" O.C. 0.71 0.62 0.32
10'-0" O.C. 0.70 0.61 0.64
1 2 3
Figure 3-19. 2 –Wheel Lines Distribution Factor for Interior Girder Paths
0.00
0.20
0.40
0.60
0.80
1.00
Dis
trib
utio
n F
acto
r
5'-0" O.C. 0.72 0.28 0.86
10'-0" O.C. 0.72 0.28 0.87
1 2 3
Figure 3-20. 2 –Wheel Lines Distribution Factor for Exterior Girder Paths

46
0.00
0.20
0.40
0.60
0.80
1.00
1.20
1.40
Dis
trib
utio
n F
acto
r
5'-0" O.C. 0.34 0.62 0.33
10'-0" O.C. 0.86 1.20 0.74
1 2 3
Figure 3-21. 4 –Wheel Lines Distribution Factor for Interior Girder Paths
0.00
0.20
0.40
0.60
0.80
1.00
Dis
trib
utio
n F
acto
r
5'-0" O.C. 0.87 0.50 0.93
10'-0" O.C. 0.73 0.12 0.93
1 2 3
Figure 3-22. 4 –Wheel Lines Distribution Factor for Exterior Girder Paths

47
The maximum tensile transverse plate stresses with the plates at 10’-0” on center were
found to be 200-1000psi higher than the 5’-0” on center plate spacing. The maximum
transverse compressive stress was found to be approximately twice as high with the
increased plate spacing. The maximum tensile principal stress difference was found to be
700psi. The compressive principal stress comparison resulted in a larger difference
ranging from 120-2300psi. The largest stress induced in the plates when spaced at 10’-0”
on center was 11,115psi in compression.
The maximum diaphragm normal stresses were similar with both plate spacing
arrangements in the diaphragms located at the quarter points of the bridge. However, the
diaphragms located at mid-span (D5–D6) experienced roughly twice as much stress with
the increased plate spacing. The ANSYS™ model only loaded the deck girders at the
worst case location of mid-span, resulting in lower stresses in the quarter point
diaphragms. It is apparent that the plate spacing has a significant effect on how much
load is transferred through the diaphragms at mid-span. The diaphragm normal stress
values are very low with both spacing arrangements, and were not close to the yield
strength of 36ksi.
The distribution factors for the interior and exterior deck girders, as expected, proved to
differ little when the plate spacing was increased. This would indicate that the smaller
number of plates simply transmitted an increased load. This higher load transmission is
evident in the increased maximum transverse and principal plate stress comparisons.
Finally, the integral end bent fixity contribution was modeled in ANSYS™ by fixing the
deck girder areas that were restrained by the end bent in the finished bridge. The fixity of
the model was calibrated by comparing the ANSYS™ model deck girder stresses and
displacements to the actual load test. Once the deck girder behavior matched that of the
actual bridge test data, the top fiber normal stresses were recorded. The live load stress
as a function of distance along deck girder one is shown in Figure 3-23. The stress is
graphed on half of the deck girder due to the symmetry plane at the mid-span of the
bridge. The fixity of the deck girder is clearly represented by the initial tensile stress near

48
the end bent, the compressive stress at mid-span, and the live load inflection point at
about 25’-0” from the support.
-300
-200
-100
0
100
200
300
5 15 25 35 45
Distance From Integral End bent (ft.)
Liv
e L
oad
To
p F
iber
Str
ess
(psi
)+
= T
ensi
on
-
= C
om
pre
ssio
n
Path 1
Path 2
Path 4
Figure 3-23. Top Fiber Live Load Normal Stress - Deck Girder 1
The maximum tensile stress that occurs due to the live load was found to be 200psi at
approximately 5.3 ft. from the integral end bent wall. The deformed shape of deck girder
one is shown in Figure 3-24. In this figure, the associated stress values are not adjusted
to exclude prestress and self-weight.
The stress in the top of the deck girder, resulting from prestress and self-weight, is shown
at the deck girder end and mid-span (see Table 3-1). The total tensile stress at 5’-4” from
the end bent wall was found to be 902psi. This value is higher than the 563psi design
concrete tensile stress limitation (or 862psi, using actual f’c=13,202psi measured on the
bridge test day, using cylinders made during deck girder fabrication), which is also
proven by hairline cracks present in the flanges of the bridge deck girders. The mid-span
normal stress is well within the design specified compressive stress limitations. The large
stress observed at the 5’-4” length could be slightly higher than the actual value due to

49
the debonding of strands in the actual girder fabrication process. However, the ability to
de-bond the prestressing strands was not available in the ANSYS™ FE program.
Figure 3-24. Deformed Shape and Un-adjusted Normal Stress- Deck Girder 1
Table 3-1. ANSYS™ Top Fiber Normal Stress Values – Girder 1
Girder Location(ft.)
Live Load TopFiber Stress (psi)
Self-Weight +Prestress (psi)
Overlay + ParapetWall (psi)
Total (psi)
5’-4” 200 645 57 90253’-0” -231 -174 -307 -712
+ = Tension - = Compression

50
4 Flange Connection Analysis
4.1 FE Model
As the flange connection analysis began, an FE model was used to help the research team
predetermine material and connection behavior. In order to accurately understand the
connection’s behavior, a basic model of the studded connection with the steel plate was
generated using ANSYS™. The model was a six inch piece of angle with two shear
studs attached to the back side, and a 3” x 4” x ½” steel plate welded to the top of the
angle (see Figure 4-1).
Figure 4-1. Flange Connection Un-deformed Shape
The FE model was created using SOLID45, a 4-node brick element. Simplifications
were made when generating the model such as, equating the circular areas to square areas
in order to get a simplified mesh within the FE program. The steel properties of the
connection were found in the PCI Design Handbook 6th Edition (2004), with an ultimate

51
strength of 65 ksi for tensile members. The FE model was then fixed at the base of the
stud head. An eccentric tensile load was then placed on the plate. According to the FE
program this particular connection was able to withstand approximately a 1,450 lbs
eccentric load before yielding was observed at the front of the two studs where the angle
and studs were connected. Figure 4-2 shows connection’s deformed shape at a load level
of 1,450 lbs.
Figure 4-2. Flange Connection Deformed Shape
After testing the connection specimens, the research team re-visited the FE model in
order to re-evaluate the experimental results. The laboratory testing showed that the
connection was not simply controlled by yielding at the base of the stud (where it meets
the angle). As the connection reached failure (defined as loss of at least 30% of peak
load), the deformed connection began to rotate rather than translate. Essentially, the
bottom of the angle acted as a fulcrum for the connection to pivot on as the angle and
plate rotated outward and the studs elongated. The failure was modeled more accurately
in ANSYS™ by placing a block just behind the bottom of the angle.

52
This more accurate FE model showed that the connection can take a much higher load
due to the connection of the angle and shank. The revised FE model shows that flexural
yielding occurred in the shanks of the shear studs before the load reached ultimate. The
plate never attained stresses with the magnitude of those observed in the studs. However,
when the loading conditions were at failure, the angle reached similar stresses as the
studs.
The load that the revised FE model reached was approximately four to five times what
the connection alone could hold, reaching load levels between 6,000 lbs and 7,000 lbs.
During the laboratory testing, according to all of the strain gages attached, that initial
yielding occurred in the shanks of the shear studs. Similarly, as load was applied to the
FE model the first location that yielding occurred was in the shanks of the connection,
thus confirming the FE model analysis. Figure 4-3 shows this interaction and how the
fulcrum allows for increased load to be applied to the flange connection.
Figure 4-3. Deformed Flange Connection with Pivot Surface

53
4.2 Testing Procedure
Early in the project it was clear that currently available headed stud connection design
methods do not accurately represent the details of the actual deck girder flange
connections. This would not have been critical, however, based on the bridge load test, it
was clear that most of the live load transfer from deck girder to deck girder was achieved
through the flange connections, and not the diaphragms. Therefore, additional
experimental and theoretical analyses were performed on the flange connection,
considering direct tension and longitudinal shear. The research team also made a
decision to neglect the capacity of the grouted shear key between flanges, as this
provided some resistance mostly in the out-of-plane direction of the flange only.
The specimens were designed and constructed based on the top flange connection detail
provided in the NCDOT bridge design document (Hanks, 2005). The details concerning
specimen size and shape were arranged by using a tributary method to simulate the area
of influence of one single connection on the actual bridge. The materials in deck girder
production, regarding rebar size and placement, concrete strength, and the studded
connection were as specified. Four tension and four shear (data from one shear test is
disregarded here as it did not follow the load-deformation behavior and load capacity of
the other three specimens) specimens were tested during the experimental phase of the
connection analysis.
The complete drawings of the specimen design are shown in Figure 4-4 and Figure 4-5.
Figure 4-6 is a picture of the rebar assemblies and specimen formwork. These designs
were based primarily on the exact replication of the actual NCDOT bridge documents as
well as development length of rebar, concrete strength, steel properties, and current ACI
318-05 design requirements.

54
Figure 4-4. Test Specimen Cross-Section View
Figure 4-5. Test Specimen Plan View
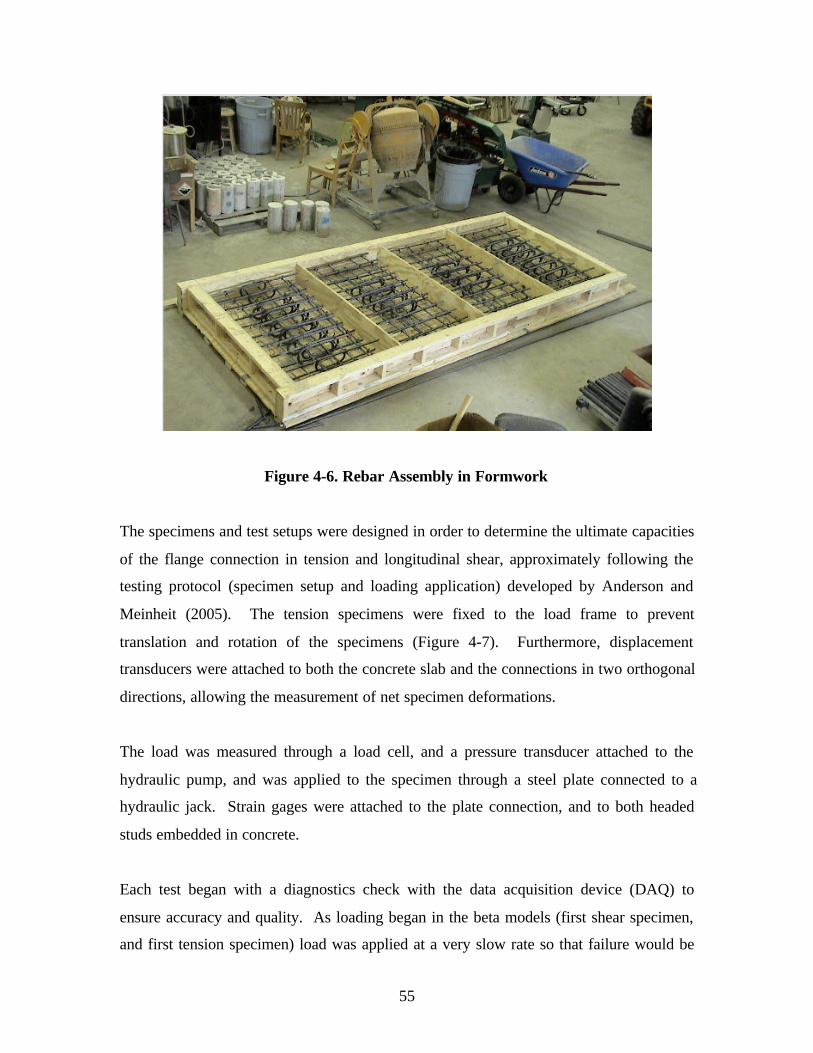
55
Figure 4-6. Rebar Assembly in Formwork
The specimens and test setups were designed in order to determine the ultimate capacities
of the flange connection in tension and longitudinal shear, approximately following the
testing protocol (specimen setup and loading application) developed by Anderson and
Meinheit (2005). The tension specimens were fixed to the load frame to prevent
translation and rotation of the specimens (Figure 4-7). Furthermore, displacement
transducers were attached to both the concrete slab and the connections in two orthogonal
directions, allowing the measurement of net specimen deformations.
The load was measured through a load cell, and a pressure transducer attached to the
hydraulic pump, and was applied to the specimen through a steel plate connected to a
hydraulic jack. Strain gages were attached to the plate connection, and to both headed
studs embedded in concrete.
Each test began with a diagnostics check with the data acquisition device (DAQ) to
ensure accuracy and quality. As loading began in the beta models (first shear specimen,
and first tension specimen) load was applied at a very slow rate so that failure would be

56
noted very precisely. In the proceeding tests, load was allowed to climb at a much higher
rate in the beginning of the test, and then decreased as the load reached the point of
failure that had been observed in previous tests. This was decided because the first
tension and shear tests approached one hour in duration. By the end of the laboratory
testing, the research team had cut the time in half, which shows that further study of
studded specimens can be completed in a timely fashion.
4.3 Experimental Results
The following are the shear and tensile loads that were applied to specimens to the point
of ultimate failure. The load versus displacement curves, and ultimate results accurately
show the uniformity within the tests as well as the specimen construction. Table 4-1 is
the ultimate log for connection tests.
Table 4-1. Experimental Results – Ultimate Values
Tension Tests Test #1 Test #2 Test #3 Test #4 AverageUltimate Failure Load (lbs) 13,150 12,700 13,160 12,100 12,778
Shear Tests Test #1 Test #2 Test #3 Test #4 AverageUltimate Failure Load (lbs) 26,970 31,470* 23,940 23,030 24,646
* Excluded from analysis
The average load versus displacement graphs for the four tensile test specimens are
shown in Figure 4-8. Figure 4-9 is a picture of the connection failure with a tensile load.
It is clear from these curves that the angle yielded (adjacent to the welded shear studs –
the location of peak bending moment from eccentric loading) and the largest deformation
occurred at an approximate load of 5,000 lbs, transferring the force mostly through
tension to the embedded studs. An average capacity of 12,778 lbs capacity was reached,
followed by large deformations, and finally, a failure due to stud/angle connection
fracture.

57
Figure 4-7. Tension Connection Test
0
2000
4000
6000
8000
10000
12000
14000
16000
0 0.2 0.4 0.6 0.8 1
Displacement (in)
Fo
rce
(lbs) Tension #1
Tension #2
Tension #3
Tension #4
Figure 4-8. Load vs. Displacement for Tension Tests
Tension Force

58
Figure 4-9. Tensile Connection Failure
The longitudinal shear test setup had the same specimen details used in the tension
testing; however, the specimens were rotated 90 degrees, and the shear force was applied
through a steel plate/channel configuration (shown in Figure 4-10). This allowed testing
of the connection with minimal eccentricity, similarly to the actual bridge details. Similar
restraints and instrumentation was applied to the shear specimens, as the ones applied to
the tensile tests.
Even though four shear tests were performed, the results of only three tests are included
in Figure 4-11. Figure 4-12 is the deformed shape of the connection after being subjected
to ultimate shear loading. One of the specimens did not produce reliable research data,
and was omitted from further common analysis. During the testing of specimen #2, the
research team noticed that all initial cracking and yielding took place similarly to the
other specimens. In researching why Test #2 had a much higher ultimate capacity than
the other specimens, primarily pointed at the construction process (in all probability
during the placement of the concrete) the rebar cage slipped under one or both of the
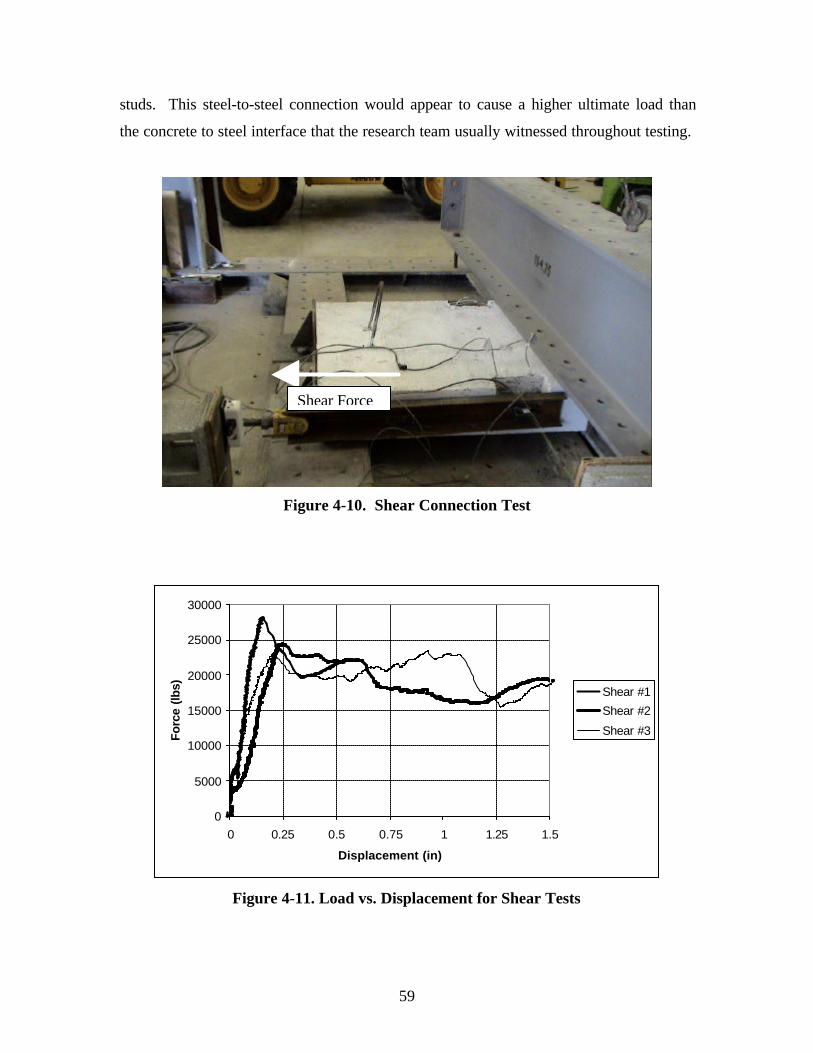
59
studs. This steel-to-steel connection would appear to cause a higher ultimate load than
the concrete to steel interface that the research team usually witnessed throughout testing.
Figure 4-10. Shear Connection Test
0
5000
10000
15000
20000
25000
30000
0 0.25 0.5 0.75 1 1.25 1.5
Displacement (in)
Forc
e (lb
s) Shear #1
Shear #2
Shear #3
Figure 4-11. Load vs. Displacement for Shear Tests
Shear Force

60
Figure 4-12. Shear Connection Failure
At approximately 5,000 lbs in Figure 4-11, shifts in the graphs indicate that some of the
connection steel members yielded. After this initial steel yielding, load redistribution
occurred, which was followed by significant rotation of the connection angle, resulting in
a failure governed by stud-to-angle connection capacity. The average ultimate value for
the shear tests was 24,646 lbs.
4.4 PCI Calculations vs. Experimental Results
In trying to analyze the loads that were predicted versus the loads achieved in testing the
connection, the research team began by reviewing “Chapter 6 Design of Connections” in
the PCI Design Handbook 6th Edition and various formulas in the AISC steel manual.
First, the steel was analyzed and ultimate values were calculated regarding capacities of
the steel plate, welds, and studded connections. The next step was to review all types of
concrete analyses provided by PCI for both the tension and shear testing procedures.
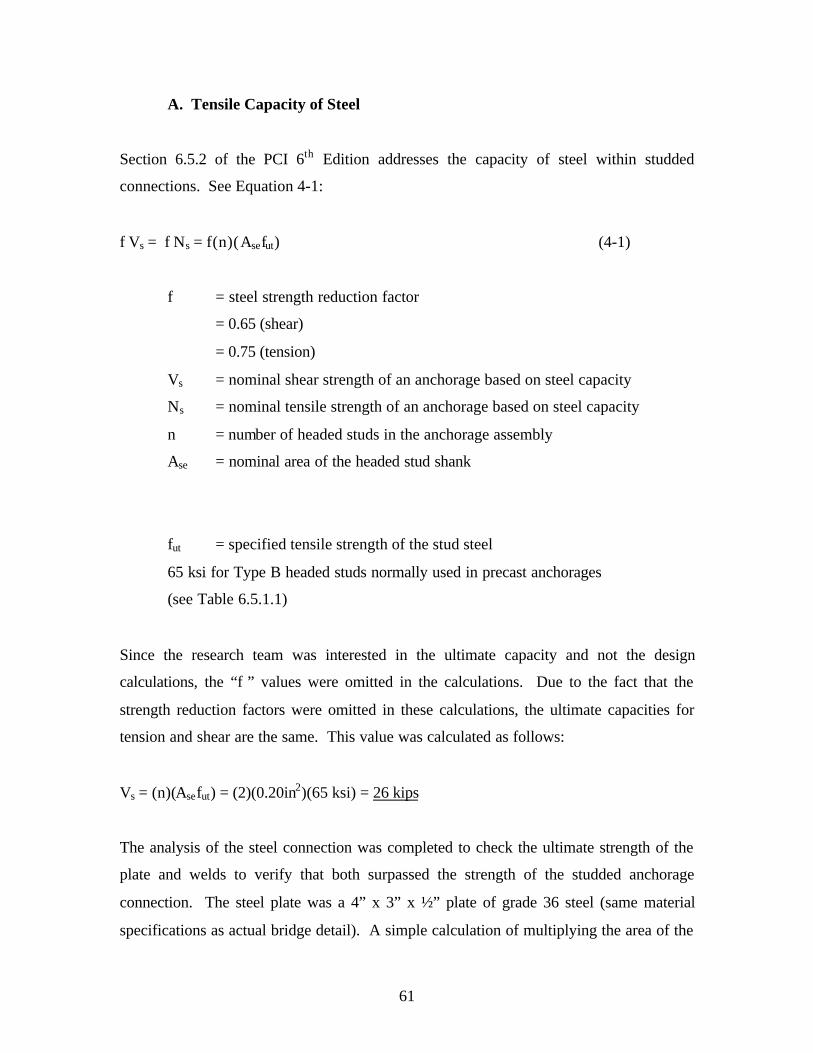
61
A. Tensile Capacity of Steel
Section 6.5.2 of the PCI 6th Edition addresses the capacity of steel within studded
connections. See Equation 4-1:
f Vs = f Ns = f(n)(Asefut) (4-1)
f = steel strength reduction factor
= 0.65 (shear)
= 0.75 (tension)
Vs = nominal shear strength of an anchorage based on steel capacity
Ns = nominal tensile strength of an anchorage based on steel capacity
n = number of headed studs in the anchorage assembly
Ase = nominal area of the headed stud shank
fut = specified tensile strength of the stud steel
65 ksi for Type B headed studs normally used in precast anchorages
(see Table 6.5.1.1)
Since the research team was interested in the ultimate capacity and not the design
calculations, the “f ” values were omitted in the calculations. Due to the fact that the
strength reduction factors were omitted in these calculations, the ultimate capacities for
tension and shear are the same. This value was calculated as follows:
Vs = (n)(Asefut) = (2)(0.20in2)(65 ksi) = 26 kips
The analysis of the steel connection was completed to check the ultimate strength of the
plate and welds to verify that both surpassed the strength of the studded anchorage
connection. The steel plate was a 4” x 3” x ½” plate of grade 36 steel (same material
specifications as actual bridge detail). A simple calculation of multiplying the area of the

62
plate oriented in the transverse direction by the strength of the steel resulted in the plate
tensile capacity (Equation 4-2).
Vs = (A)(fut) = (1.50in2)(58 ksi) = 87 kips (4-2)
This calculation shows that failure will likely occur somewhere else than in the welded
plate.
B. Weld Capacity
The weld between the angle and the steel plate were also evaluated. The research team
used the LRFD method to calculate the strength of the weld. This calculation was based
on the smaller yield of the plate and the ultimate strength of the other steel members. The
first step in this process is to calculate the gross cross section yield (Equation 4-3).
Please note that since the research team was once again looking for the ultimate strength
calculations, the f factor (steel strength reduction factor) was ignored.
f tPn = f tFyAg = (58 ksi) (3” x ½”) = 87 kips (4-3)
The net-section fracture can be calculated using Equation 4-4:
A = Ae = 3” x ½” = 1.5in2 (4-4)
The U factor is the next analysis in the steel weld calculations. The U factor is a variable
which takes into account the non-uniform stress distribution in a simple manner. For
welded sections the acceptable U is characterized by LRFD Specification B3.2 (d).
When l = 2w U = 1.0
When 2w > l = 1.5w U = 0.87
When 1.5w > l = w U = 0.75

63
In the case of the studded angle connection, the plate that was welded to the angle had
dimensions of w = 1.75in. and l = 3.0in. Therefore, 2w = 3.5in., and 1.5w = 2.625in. The
computations were then substituted back into LRFD Specification B3.2(d) in order to
determine the correct U factor. Looking at the second case reveals the following:
2w > l = 1.5w = 3.5in. > 3.0in. = 2.625in. U = 0.87
In further calculation of the net-section fracture, an effective area (Ae) must now be
derived. This is done by taking the gross section area and multiplying it by the U factor
that was previously computed (Equation 4-5).
Ae = AU = (1.5in.2)(0.87) = 1.305in2 (4-5)
This area will now provide all of the information needed to calculate the net-section
fracture of the weld holding the plate to the angle on the studded connection. This can be
obtained from the equation f tPn = f tFyAg, while disregarding the “f ” factor for steel
strength reduction (Equation 4-6).
Pn = FuAe = (58ksi)(1.305in2) = 75.69 kips (4-6)
This value, being lower than the gross-section yield, will control and be the expected
ultimate value for failure in the weld.
C. Concrete Tensile Strength
After all of the values for steel strength were calculated, computations regarding the
ultimate capacity for concrete were then analyzed. The calculations follow the guidelines
from Chapter 6 of the PCI Design Handbook 6th Edition, “Design of Connections”.
Section 6.5.3 addressed many of the situations that arose within the experimental testing
of the flange connection. These areas of ultimate tensile capacity included breakout
strength, pullout strength, and side-face blowout capacity of the high performance

64
concrete members. As Section 6.5.4 addressed the concrete capacity in tension, Section
6.5.5 evaluates the concrete shear strength. In this section the basic strength, single
anchor strength was calculated with X-spacing, thickness, eccentricity, and cracking
factors to provide more precise predictions.
The first concrete tensile strength calculation was the breakout strength computation.
The breakout strength formula for concentrically loaded studded connections is PCI
Equation 6.5.4.1 (Equation 4-7):
Ncb = Ncbg = CbsANCcrb? ec,N (4-7)
where:
hef = effective embedment length (in.). For headed studs welded to a plate flush
with the surface, it is the nominal length less the head thickness, plus the plate
thickness, deducting the stud burn off lost during the welding process (Equation
4-8)
hef = le + tp - ths – 1/8in = 6in. + 3/8in. – 5/16in. - 1/8in. = 5.9375in.(4-8)
Cbs = breakout strength coefficient (Equation 4-9)
ef
cbs h
fC
'33.3 λ= =
"89000
)0.1(33.3 = 128.48 (4-9)
AN = projected surface area for a stud or group of studs in square inches
AN = A1+2+3+4 (see Figure 4-13)
A1,2,3,4 = ½(h)(L1+L2)
A1 = ½(10.404)(½+10.41) = 56.75in2
A2 = ½(10.404)(½+10.41) = 56.75in2
A3 = ½(4.65)(4+21.05) = 58.24in2
A4 = ½(5.76)(4+21.05) = 72.14in2
AN = A1+2+3+4 = 56.75in. + 56.75in. + 58.24in. + 72.14in. = 243.88in2

65
Figure 4-13. Trapezoidal Areas
Ccrb = 1.0 for concrete assumed un-cracked
= 0.8 for locations likely to become cracked
(*please note that some specimens cracked and some did not)
? ec,N = edge modification factor (Equation 4-10)
+
=
EF
NNec
he
3'2
1
1,ψ =
+
=
)"9375.5(3)"75.1(2
1
1,Necψ = 0.8358 (4-10)
With all of the coefficients calculated the research team was now able to calculate the
breakout strength (Equation 4-11):
Ncb = Ncbg = CbsANCcrb? ec,N = (128.48)(243.88)(1.0)(0.8358) = 26.188 kips (4-11)
Ncb = Ncbg = CbsANCcrb? ec,N = (128.48)(243.88)(0.80)(0.8358) = 20.951 kips
The pullout tensile strength calculation or the bearing capacity of the stud against the
concrete is as follows (Equation 4-12):
Npn = 11.2Abrgf’cCcrp (4-12)

66
where:
Abrg = bearing area of the stud head in tension (sq. in.)
= area of the head – the area of the shank
Ccrp = cracking coefficient (pullout)
= 1.0 for concrete assumed uncracked (most common)
= 0.7 for locations likely to become cracked
Npn = 11.2Abrgf’cCcrp = (11.2)(1.18)(9000)(1.0) = 118.9 kips (no cracking)
Npn = 11.2Abrgf’cCcrp = (11.2)(1.18)(9000)(0.70) = 83.3 kips (cracking)
The last of the concrete tension calculations was the side-face blowout computation. For
additional explanation of how dimensions were derived please see Figure 4-14. The studs
analyzed were located at a perpendicular distance, de2, less than 3de1, which allows for the
side-face blowout calculation to contain a multiplier as opposed to studded heads located
closer to edges. The basic equation for side-face blowout is as follows (Equation 4-13):
cfAdN brgesb '160 1= = 900018.1)3(160 = 49.47 kips (4-13)
The strength reduction coefficient due to the location of the studded connection
positioned away from an edge (dimensions for this equation can be seen in Figure 4-10)
is obtained by (Equation 4-14):
Strength reduction coefficient = 4
11
2
+
e
e
dd
= 4
"3"5
1
+
= 0.666 (4-14)
It was now possible to compute the most accurate side-face blowout capacity by
multiplying the reduction factor by the side-face blowout capacity (Equation 4-15).
Nsb = Nsb(reduction factor) = (49.47 kips)(0.666) = 32.98 kips (4-15)
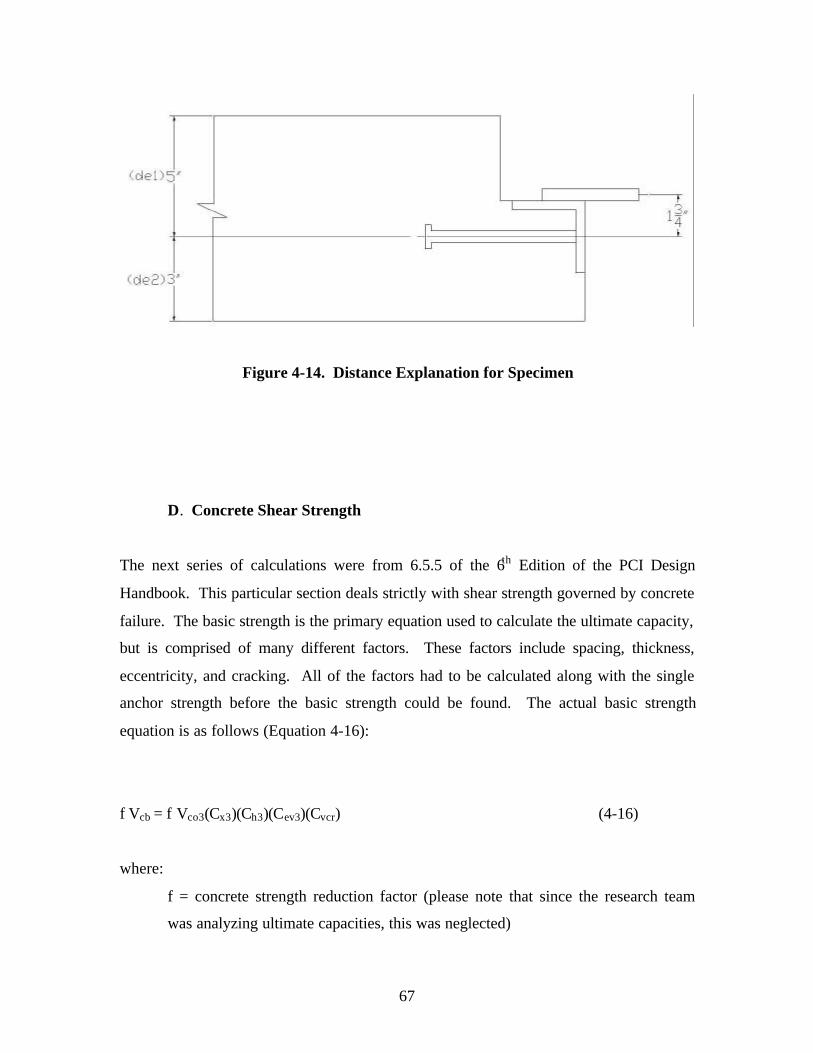
67
Figure 4-14. Distance Explanation for Specimen
D. Concrete Shear Strength
The next series of calculations were from 6.5.5 of the 6th Edition of the PCI Design
Handbook. This particular section deals strictly with shear strength governed by concrete
failure. The basic strength is the primary equation used to calculate the ultimate capacity,
but is comprised of many different factors. These factors include spacing, thickness,
eccentricity, and cracking. All of the factors had to be calculated along with the single
anchor strength before the basic strength could be found. The actual basic strength
equation is as follows (Equation 4-16):
f Vcb = f Vco3(Cx3)(Ch3)(Cev3)(Cvcr) (4-16)
where:
f = concrete strength reduction factor (please note that since the research team
was analyzing ultimate capacities, this was neglected)

68
Vc3 = nominal concrete breakout strength for a single or multiple stud connection
accounting for member and connection geometry (lbs)
Vco3 = concrete breakout strength for a single stud connection unaffected by
connection or member geometry (lbs)
Cx3 = coefficient for overall X spacing of a connection with two or more X rows
for a de3 type anchorage
Ch3 = coefficient for member thickness (h) for a de3 type anchorage
Cev3 = coefficient for eccentric shear force influences for a de3 type anchorage
Cvcr = coefficient for cracking in a member, loaded in shear
• Single Anchor Strength
( ) 33.13 '5.16 BEDfV cco λ= (4-17)
BED = de3 + Y = 6 + 3.5 = 9.5in. (4-18)
? = 1.0 because normal weight concrete was used
( ) 33.13 5.99000)0.1(5.16=coV = 31.26 kips
• X Spacing Factor
Cx3 = 1.0 when X = 0
• Thickness Factor
Ch3 = BEDhforBED
h75.175.0 ≤= (4-19)
h = member thickness (in.)

69
Ch3 = 5.9
875.0= = 0.6882
• Eccentricity Factor
2x
efor v ≤′ = 25.3
75.1 ≤ = 75.175.1 ≤
0.167.01
13 ≤
′
+=
BEDe
Cv
ev = 0.1
5.975.1
67.01
1≤
+
= 0.189.0 ≤ (4-20)
where:
e’v = eccentricity of shear force on a group of anchors; distance between point of
shear force application and geometric centroid of group of anchors resisting shear in
direction of applied shear (in.).
• Cracking Factor
Cvcr = 0.85 edge reinforcement = No. 4 bar
The research team could now revert back to PCI Eq. 6.5.5.1 in order to determine the
basic strength of the studded connection in shear (Equation 4-16):
Vcb = (Vco3)(Cx3)(Ch3)(Cev3)(Cvcr) = (31.26)(1.0)(0.6882)(0.89)(0.85) = 16.47 kips (4-16)
Experimental results were then compared against the PCI calculations, there were some
variances in the ultimate values. However, the value that was most notable was the
tensile strength comparisons that were observed in the laboratory testing. The problem
was approached using basic mechanics to determine why and where failure occurred.
Failure had been noted in all tensile specimens at the location where the stud shanks
connected to the angle. Initially, all stress, force, and basic moment calculations proved

70
ineffective until they were considered about the angle cross section. Therefore, the first
step was to determine the section modulus for this particular angle (Equation 4-21).
Z =( )
6
2bh =
( )6
)375.0)("6( 2
= 0.140625in3 (4-21)
Then multiplying the ultimate failure load average from all four of the tensile tests by the
most exact moment arm, in this case from the top of the shank weld to the bottom of the
angle, the moment applied to the connection calculated (Equation 4-22) as :
M = (P)(e) = (12780 lbs)(1.5 in) = 19170 lb-in (4-22)
Taking the ultimate moment applied to the test specimens before failure was noted and
then dividing by two in order to equate the load per shear stud, the ultimate moment load
per shear stud could be computed (Equation 4-23).
M = 2
19170 inlb − = 9585 lb-in per shear stud (4-23)
Finally, applying the bending stress formula of ZM
= s (Equation 4-24) it became clear
why failure occurred.
s = ZM
= 3140625.09585
ininlb −
= 68.1 ksi (4-24)
4.5 Connection Conclusions
In analyzing the flange connection, a comparison between the PCI design handbook and
experimental results showed how unpredictable this particular connection was. The
design values for the steel capacity were 26 kips in tension as well as shear. The weld
capacity for this particular section was roughly 76 kips. The predicted value for concrete

71
strength in tension was governed by the concrete breakout strength which was 26.19 kips.
Finally, the basic concrete strength for members in shear was nearly 16.5 kips.
Analysis of the experimental data resulted in the average ultimate values in tension and
shear of 12.8 kips and 24.6 kips, respectively. In both test setups, failure always occurred
in the steel members of the connection, and not in the concrete, as the capacity
calculations indicated, suggesting that in order to evaluate connection details not found in
current design guidelines, experimental investigation is recommended. Furthermore,
although not part of the objectives of the present report, long-term performance of these
connections must also be evaluated, focusing on fatigue, section corrosion/durability,
torsion, etc...
5 Deck Girder Fabrication
The steps used in the fabrication of the girders could be divided into two stages. The
initial stage involved the fabrication of the Type III AASHTO girder without the deck.
This was followed by the second stage, which consisted of the fabrication of the deck
portion using same concrete mix as specified for the girder, and the prestress tendon
release.
5.1 Deck Formwork
New formwork had to be designed for the fabrication of these girders because they were
the first of their kind. The special formwork for the deck was designed and fabricated by
Standard Concrete Products of Savannah, GA. The deck formwork was constructed
using a space truss support system consisting of numerous steel angles (see Figure 5-1).
The trusses were anchored down to the bed with the use of bolts. The exterior truss
supporting the formwork was constructed so that the horizontal formwork was tilted
inward. This allowed for the correct slope at the bottom of each flange.

72
Figure 5-1. Space Truss Used for Support in Deck Form Work
The new formwork was placed on the girder bed and attached to the existing steel tubing
spaced transversely along the entire length of the bed. The inner truss of the formwork
was attached to these steel tubes using a steel collar and bolt system (see Figure 5-2).
The steel collar fit around the steel tube, while the bolt was tightened at the top of the
collar to ensure a snug fit. This system allowed the deck formwork to slide out to provide
space for the girder formwork, and then returned to its original position for the pouring of
the next deck section (see Figure 5-3).

73
Figure 5-2. Bolt and Collar System for Inside Truss in Deck Formwork
Figure 5-3. Deck Form Work Slid Back for the Girder Fabrication

74
5.2 AASHTO Girder Fabrication
This phase of the deck girder fabrication is identical to the traditional Type III fabrication
process. Initially, the strands were placed in the bed. The end plate of the girder
formwork was used as a template for the layout of the strands through the bed (see Figure
5-4). Each end of the strands were then anchored into the ends of the bed using a jacking
device that pulls on each strand while an end cap, shown in Figure 5-5, was used to react
the tensioning force in the strand. The strands were then checked carefully to ensure that
none were damaged in the tensioning process.
All of the transverse reinforcement for the girder was then tied. The PVC inserts for the
diaphragms were also tied to the rebar before the placement of the girder formwork (see
Figure 5-6), securing them in the right position. The reinforcement was then checked by
NCDOT representatives, before the girder formwork was put into place.
Figure 5-4. End Plate of the Formwork for the Girder
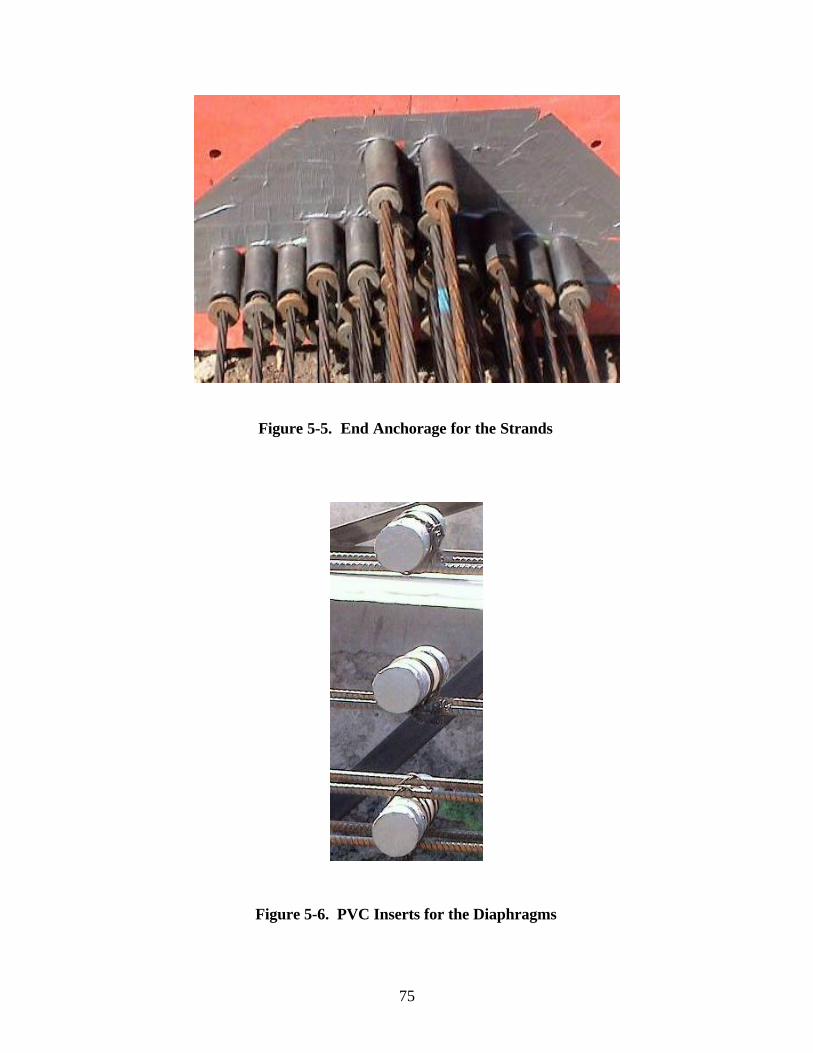
75
Figure 5-5. End Anchorage for the Strands
Figure 5-6. PVC Inserts for the Diaphragms

76
The girder formwork was then positioned into place by using a crane with two lifting
devices that picked up on the formwork at both ends. The forms were connected together
to ensure a tight fit to the two end plates (see Figure 5-7). The concrete was batched and
tested on-site. The concrete was tested for slump, air content, temperature, and cylinders
were made for compressive strength tests. The concrete contained a corrosion inhibitor
to help protect the reinforcement. Each batch was tested to ensure that the corrosion
inhibitor was added.
Once the batch was approved, the concrete was placed using a small all-terrain vehicle
with a bed and chute (see Figure 5-8). The concrete was poured in three different layers
in the girder. A vibration device that was attached to the formwork was used for the first
two layers so that the rebar would not be damaged. A square head internal vibrator
system was used to vibrate the final top layer of concrete. The girder formwork was
completely filled with concrete and then raked, so that sufficient bonding with the deck
would be achieved when later poured.
The connector ties that would connect the girder with the deck were then brushed clean
of concrete to ensure proper bonding. The concrete was left to cure for 17 to 18 hours, so
that the girder formwork could be removed. During the curing process, burlap cloth and
tarps were used to cover the concrete. A water system, which ran underneath the tarps
and burlap cloth, provided a steady mist for the duration of the curing time. The concrete
strength when the girder formwork was removed varied between 5,500psi and 8,000 psi.

77
Figure 5-7. Final Placement of Girder Formwork with Connectors
Figure 5-8. Vehicle Used to Place the Concrete into the Formwork
5.3 Deck Fabrication
The next stage of the fabrication process started with the removal of the girder formwork.
The come–alongs were then released so that the deck formwork could be bolted into

78
place. Steel channels were then welded to the top of the form work to support the
longitudinal sides of the deck (see Figure 5-9). Number six rebar lengths were also used
to help laterally support the channel on the form work. A small triangular piece of steel
was used for the chamfer on the inside of the channel. This steel strip was welded to the
formwork, before the channel was secured.
Figure 5-9. Channel Welded to the Deck Formwork
The shear keys were formed by using steel angles welded to the inside of the channel (see
Figure 5-10). Then longitudinal and transverse rebars were tied and inspected before the
concrete was poured. PVC pipe inserts were also placed according to the specifications
for the breathing of the concrete in the end walls. Similarly, special inserts were also
positioned and secured to the reinforcement, which were intended to be used during the
jacking procedure (see Figure 5-11).
The embedded angle connectors were placed according to the specifications, and tied to
the longitudinal rebars (see Figure 5-12). The block-outs for the embedded angles were
made using a piece of wood wrapped in duct tape to prevent the bonding to the concrete
(see Figure 5-13). A thin strip of liquid silicon was applied to the wood and steel channel

79
to prevent the wood block-out from floating when the concrete was poured. The concrete
was poured continually in one layer along the entire length, properly vibrated, broom
finished, and allowed to cure to the appropriate strength (minimum 5,500psi) before
cutting the strands. The concrete was then covered again with the burlap cloth and tarps.
A steady mist was also applied during the curing process of the deck.
Figure 5-10. Steel Angles Welded to Formwork to Form the Shear Key

80
Figure 5-11. Inserts in Deck for Jacking
Figure 5-12. Embedded Angle Installation Before Placing the Concrete

81
Figure 5-13. Block-out for Embedded Angle Connection
Once the concrete reached a compressive strength of 5,500psi, the strands were released.
The deck formwork was then shifted back away from the girder and the deck girder was
lifted out of the bed using two 80-ton cranes. The deck girder was then moved to the
storage area in the yard, and placed on timber supports. Each deck girder was fabricated
using the same process. The two exterior deck girders were fabricated first, then the
three interior deck girders. Once all of the deck girders were fabricated and moved to the
storage area, a dry assembly (see Figures 5-14 and 5-15) was completed. The dry
assembly was done to provide the contractor with the order of placement to ensure the
most efficient and correct layout.

82
Figure 5-14. Dry Assembly – Lateral View
Figure 5-15. Dry Assembly – Top View

83
5.4 Formwork Critique
The formwork was measured in the yard for both the deck and AASHTO girder. The
measurements were made with a standard tape measure and recorded. The measurements
were used to produce AutoCAD™ drawings of each formwork, which are shown in
Figure 5-16 through 5-18.
Figure 5-16. AASHTO Girder Formwork

84
Figure 5-17. Section of Deck Formwork
Figure 5-18. Side View of Deck Formwork
The formwork for the deck was designed efficiently and was easy to slide in and out as
needed. The only concern that was found was with the embedded plates and block-outs.
The block-outs were fabricated using a piece of wood placed on top of the embedded
angles, which were tied to the rebar. When the concrete was placed, the wood and angles
both started to float and move out of position. This caused concrete to cover the plates as
well as let the plates move out of alignment. This initial problem was quickly resolved
by using liquid silicon adhesive to keep the piece of wood in place. The embedded
angles and studs were tied onto the deck reinforcement more efficiently as well.

85
The formwork also required the girders to be poured in two separate parts. For future
use, it is suggested to allow the deck formwork to attach directly to the existing
AASHTO girder formwork. This would allow the deck girders to be poured in one day
instead of two. On the other hand, this will only make economic sense when these types
of deck girders are fabricated in larger quantities. Several ideas were considered, but
only one is presented here at a rough sketch level. No attempt was made to fully design
these possible modifications. First, two longitudinal steel plates are fabricated that are
fastened together at an angle of 90 degrees on the edge (see Figure 5-19). These two
pieces would then hook into the top outside edge of the existing Type III girder
formwork. These hooks would slide into slots on the existing formwork and hook into
place.
Figure 5-19. Formwork with Turn Buckles
The new attachment would be supported by angled arms spaced out through the entire
length of the girder. These arms would consist of two rods that are attached by a turn
buckle. The turn buckle could be used to lower or raise the attaching formwork. This
can be used to produce the designed slope for the flanges, as well as to allow for flange
vertical alignment. The bottom rod in the supporting arm system would have a clip that
would slide onto the side of the girder formwork.

86
As an alternative, the flange support could also be accomplished by the use of vertical
jacks placed along the entire length of the deck girder. These jacks, similarly to the turn
buckles, would provide support for the flange. The advantage of this system would be
quick formwork assembly, and one-step concrete placement.
5.5 Release Camber and Stress Comparison
The measurement of the camber in the deck girders was completed using two different
methods. The first method was an actual survey of the girder, and the second method
was done using a taut string.
The first camber measurement method required the use of a total station. The total
station was set up parallel to the girder being measured and then leveled off. It was
decided to measure the camber at every tenth point on the girder, so a measurement of
these points was done using a tape measure and red permanent marker. The ground was
then surveyed at the same points. Once the elevations were recorded, a simple
mathematical equation was used to find the slope of the ground between each point. The
next step in the process was to measure the distance between the bottom of the girder to
the ground. This was done using a tape measure. The camber was then found through
simple calculations.
The second method used to measure the camber was performed using a string and tape
measure. The string was tied to the tendons at one end of the girder and then stretched
extremely tight along the entire length of the girder, from girder corner to corner. Once
the string was tightened properly, a tape measure was used to measure the distance
between the bottom of the girder to the top of the string. These measurements were
recorded and compared to the camber which was calculated using the previous method.
It was found that the difference in the camber values from these two methods was very
small.

87
5.6 Actual vs. Design Camber
The measured camber from the two methods was then compared with both the design
values and the values from the Larsa™ model (see Table 5-1). The predicted camber
values, obtained from hand calculations, were updated to reflect the actual concrete
compressive strength of approximately 9,000 psi at prestress tendon release.
Furthermore, the Larsa™ camber values were recorded at slightly different positions
from the end of the deck girder; these positions, as opposed to the 10th points, matched
the location of member type changes along the length of the bridge. The results showed
that the designed/predicted and actual camber values were close. The discrepancy shown
in Figure 5-20 could be a result of differences between actual versus design concrete
strength (8,000-9,000psi as compared to the specified 5,500psi) and prestress losses,
slight deviations from prestress stress, actual versus specified tendon locations, etc...
However, the overall comparison is satisfactory.
Table 5-1. Comparison of Camber Values
Position Distancefrom End
(ft)
PredictedCamber
(in.)
ActualCamber
(in.)
LARSADistance
(ft)
LARSACamber
(in.)A 0.00 0.000 0.000 0.00 0.000B 10.77 1.475 1.578 10.67 1.040C 21.54 2.625 2.052 20.75 1.730D 32.30 3.441 2.634 30.75 2.200E 43.07 3.933 2.772 40.75 2.490F 53.84 4.100 2.892 50.75 2.600G 64.61 3.933 2.592 65.25 2.490H 75.38 3.441 2.544 75.25 2.200I 86.14 2.625 2.076 85.25 1.730J 96.91 1.475 1.260 95.33 1.040K 107.68 0.000 0.000 106.00 0.000
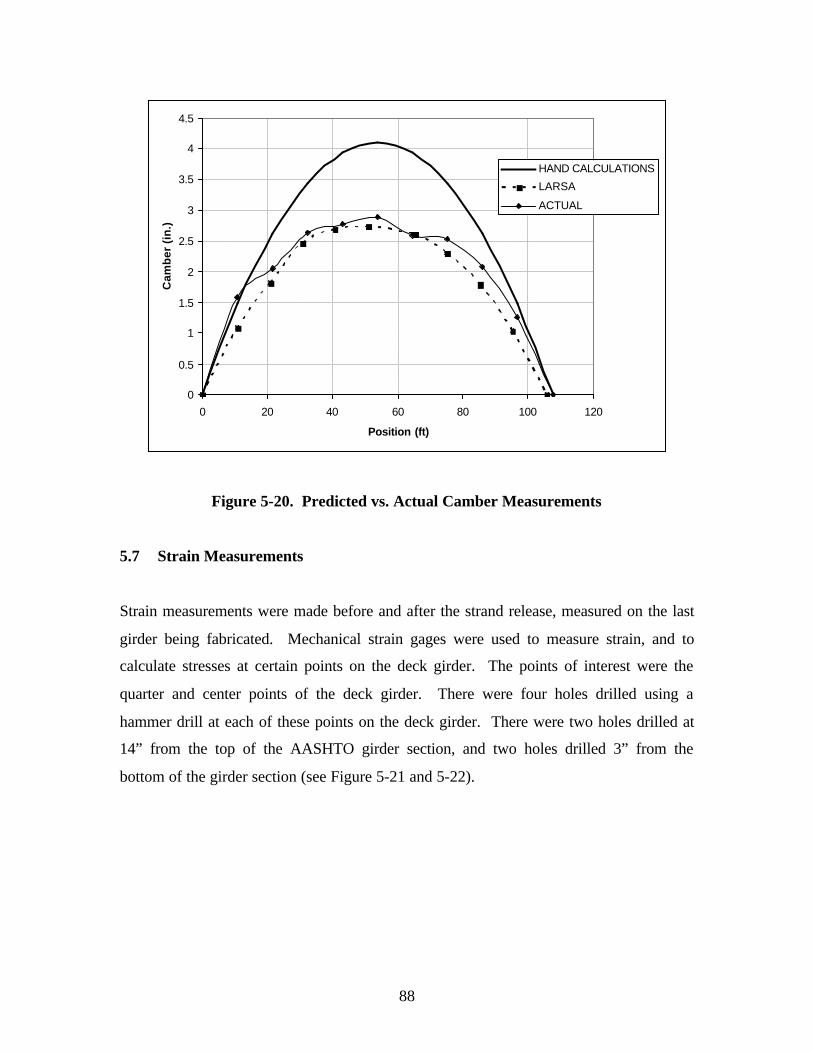
88
0
0.5
1
1.5
2
2.5
3
3.5
4
4.5
0 20 40 60 80 100 120
Position (ft)
Cam
ber
(in
.)HAND CALCULATIONS
LARSA
ACTUAL
Figure 5-20. Predicted vs. Actual Camber Measurements
5.7 Strain Measurements
Strain measurements were made before and after the strand release, measured on the last
girder being fabricated. Mechanical strain gages were used to measure strain, and to
calculate stresses at certain points on the deck girder. The points of interest were the
quarter and center points of the deck girder. There were four holes drilled using a
hammer drill at each of these points on the deck girder. There were two holes drilled at
14” from the top of the AASHTO girder section, and two holes drilled 3” from the
bottom of the girder section (see Figure 5-21 and 5-22).

89
Each set of holes were spaced 8 inches on center. The mechanical strain gage required
special brass inserts to be secured into these holes, so that measurements of strain could
be made using tabs screwed into these inserts. A template was made for the installation
of the inserts, allowing for a better insert positioning while the fast curing epoxy
hardened. A two-part epoxy was used to glue the inserts into place. Once the epoxy was
set, the template was removed from the tabs.
Figure 5-21. Location of Tab Inserts at Quarter Point on the Girder
Figure 5-22. Location of Tab Inserts at Mid-Span of the Girder
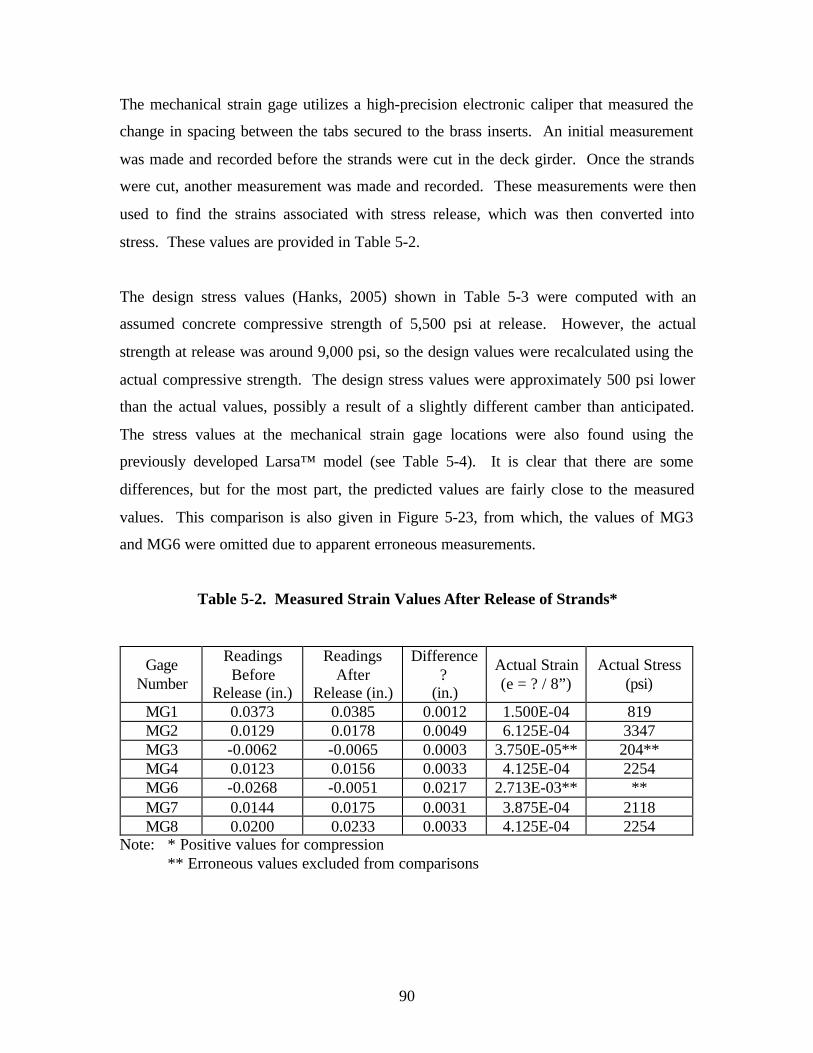
90
The mechanical strain gage utilizes a high-precision electronic caliper that measured the
change in spacing between the tabs secured to the brass inserts. An initial measurement
was made and recorded before the strands were cut in the deck girder. Once the strands
were cut, another measurement was made and recorded. These measurements were then
used to find the strains associated with stress release, which was then converted into
stress. These values are provided in Table 5-2.
The design stress values (Hanks, 2005) shown in Table 5-3 were computed with an
assumed concrete compressive strength of 5,500 psi at release. However, the actual
strength at release was around 9,000 psi, so the design values were recalculated using the
actual compressive strength. The design stress values were approximately 500 psi lower
than the actual values, possibly a result of a slightly different camber than anticipated.
The stress values at the mechanical strain gage locations were also found using the
previously developed Larsa™ model (see Table 5-4). It is clear that there are some
differences, but for the most part, the predicted values are fairly close to the measured
values. This comparison is also given in Figure 5-23, from which, the values of MG3
and MG6 were omitted due to apparent erroneous measurements.
Table 5-2. Measured Strain Values After Release of Strands*
GageNumber
ReadingsBefore
Release (in.)
ReadingsAfter
Release (in.)
Difference?
(in.)
Actual Strain(e = ? / 8”)
Actual Stress(psi)
MG1 0.0373 0.0385 0.0012 1.500E-04 819MG2 0.0129 0.0178 0.0049 6.125E-04 3347MG3 -0.0062 -0.0065 0.0003 3.750E-05** 204**MG4 0.0123 0.0156 0.0033 4.125E-04 2254MG6 -0.0268 -0.0051 0.0217 2.713E-03** **MG7 0.0144 0.0175 0.0031 3.875E-04 2118MG8 0.0200 0.0233 0.0033 4.125E-04 2254
Note: * Positive values for compression** Erroneous values excluded from comparisons
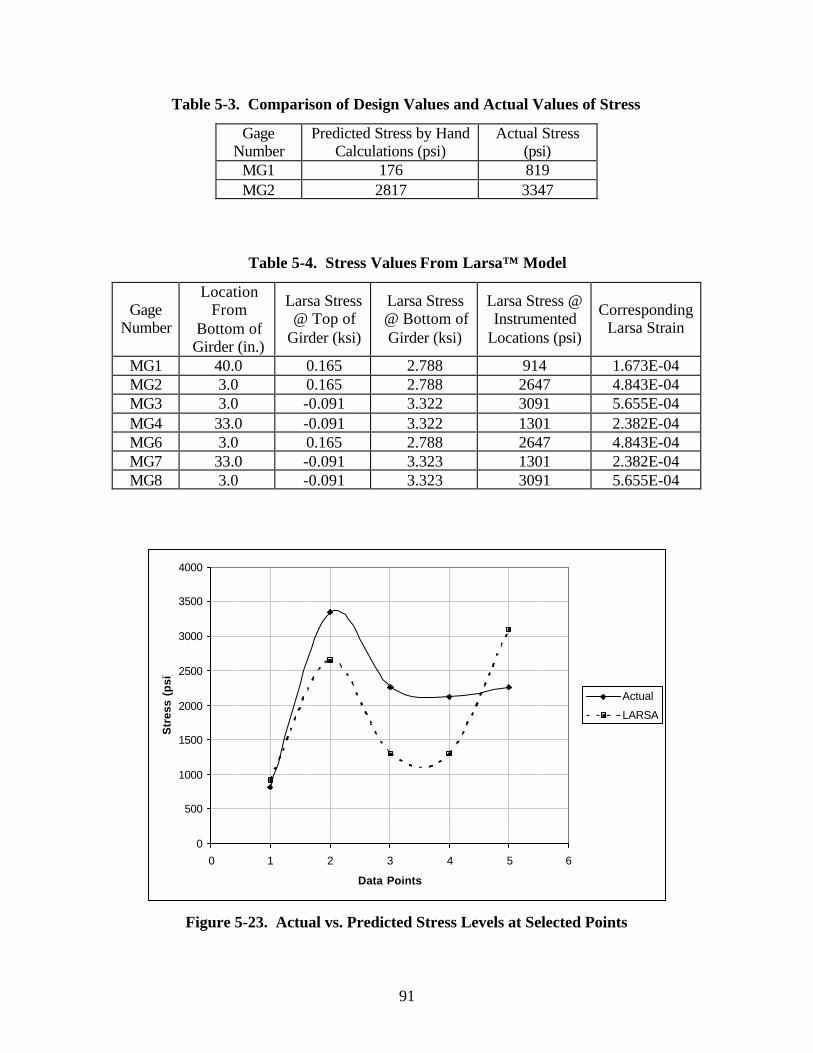
91
Table 5-3. Comparison of Design Values and Actual Values of Stress
GageNumber
Predicted Stress by HandCalculations (psi)
Actual Stress(psi)
MG1 176 819MG2 2817 3347
Table 5-4. Stress Values From Larsa™ Model
GageNumber
LocationFrom
Bottom ofGirder (in.)
Larsa Stress@ Top of
Girder (ksi)
Larsa Stress@ Bottom ofGirder (ksi)
Larsa Stress @Instrumented
Locations (psi)
CorrespondingLarsa Strain
MG1 40.0 0.165 2.788 914 1.673E-04MG2 3.0 0.165 2.788 2647 4.843E-04MG3 3.0 -0.091 3.322 3091 5.655E-04MG4 33.0 -0.091 3.322 1301 2.382E-04MG6 3.0 0.165 2.788 2647 4.843E-04MG7 33.0 -0.091 3.323 1301 2.382E-04MG8 3.0 -0.091 3.323 3091 5.655E-04
0
500
1000
1500
2000
2500
3000
3500
4000
0 1 2 3 4 5 6
Data Points
Str
ess
(psi
)
Actual
LARSA
Figure 5-23. Actual vs. Predicted Stress Levels at Selected Points

92
5.8 Transportation
Once the fabrication of the girders was completed, a compressive strength of at least
9,000psi was reached, they were prepared to be transported from Savannah, GA to Stanly
County, NC. A total of five trucks were used to transport the girders. Before the girders
were loaded onto the truck an anchor bolt was slid through inserts at opposite ends of the
girders (see Figure 5-24). A hook was then tightened onto this bolt on either side of the
girder with a nut. This device was used in route to help chain down the girders while
transporting them. Timbers were then stacked on each end of the girders to help protect
the top surface of the girders from the chains (see Figure 5-25). The girder(s) were raised
by two cranes in operation at the fabrication plant.
Figure 5-24. Hook Attached to Girder for Securing Down
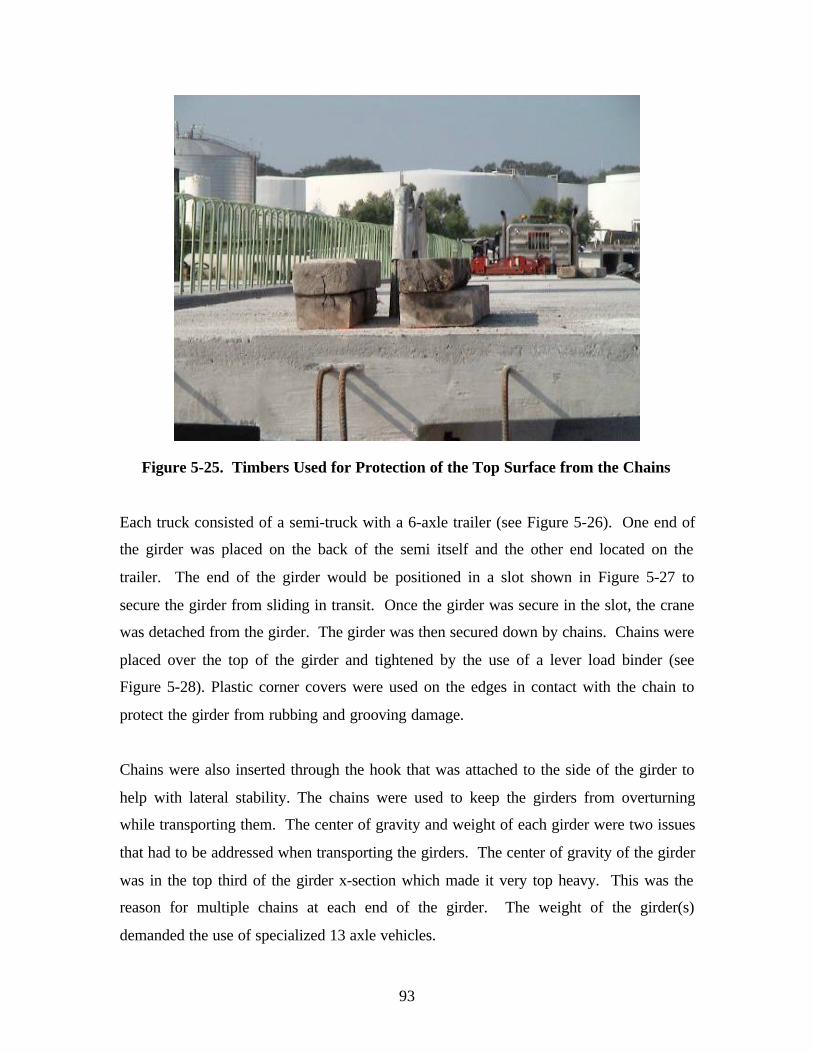
93
Figure 5-25. Timbers Used for Protection of the Top Surface from the Chains
Each truck consisted of a semi-truck with a 6-axle trailer (see Figure 5-26). One end of
the girder was placed on the back of the semi itself and the other end located on the
trailer. The end of the girder would be positioned in a slot shown in Figure 5-27 to
secure the girder from sliding in transit. Once the girder was secure in the slot, the crane
was detached from the girder. The girder was then secured down by chains. Chains were
placed over the top of the girder and tightened by the use of a lever load binder (see
Figure 5-28). Plastic corner covers were used on the edges in contact with the chain to
protect the girder from rubbing and grooving damage.
Chains were also inserted through the hook that was attached to the side of the girder to
help with lateral stability. The chains were used to keep the girders from overturning
while transporting them. The center of gravity and weight of each girder were two issues
that had to be addressed when transporting the girders. The center of gravity of the girder
was in the top third of the girder x-section which made it very top heavy. This was the
reason for multiple chains at each end of the girder. The weight of the girder(s)
demanded the use of specialized 13 axle vehicles.

94
Figure 5-26. Truck Used for Transporting Girders
Figure 5-27. Slot for Placement of the End of a Girder
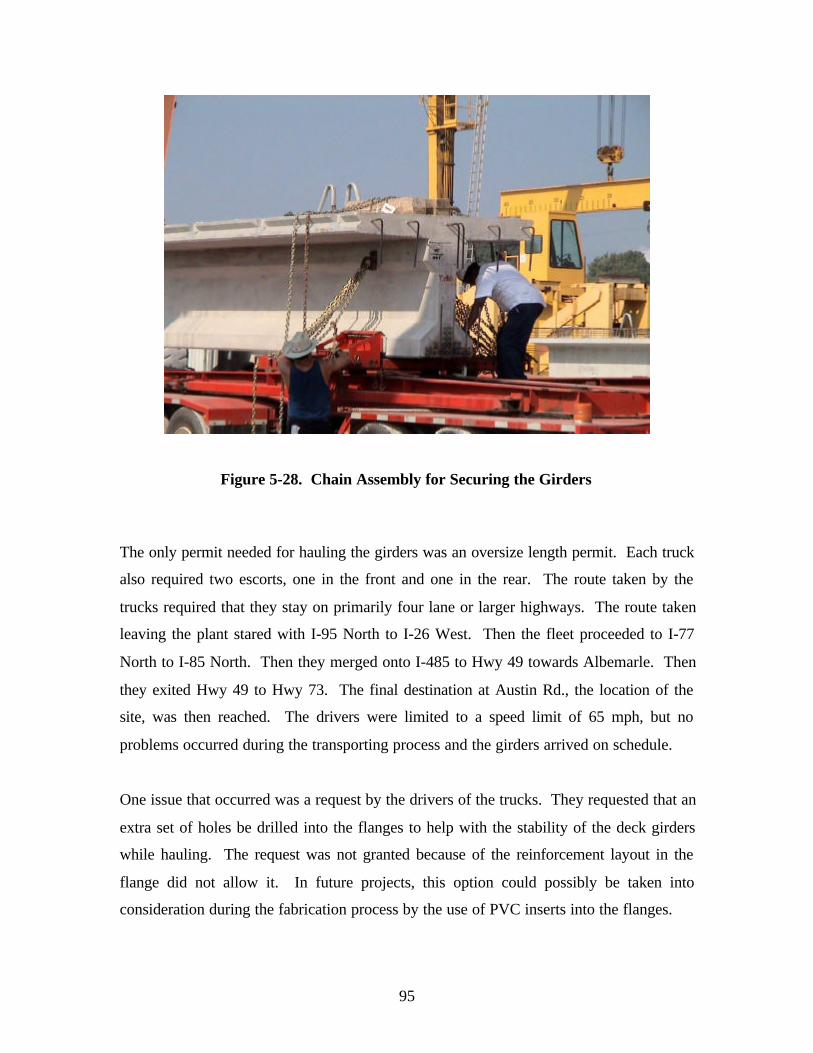
95
Figure 5-28. Chain Assembly for Securing the Girders
The only permit needed for hauling the girders was an oversize length permit. Each truck
also required two escorts, one in the front and one in the rear. The route taken by the
trucks required that they stay on primarily four lane or larger highways. The route taken
leaving the plant stared with I-95 North to I-26 West. Then the fleet proceeded to I-77
North to I-85 North. Then they merged onto I-485 to Hwy 49 towards Albemarle. Then
they exited Hwy 49 to Hwy 73. The final destination at Austin Rd., the location of the
site, was then reached. The drivers were limited to a speed limit of 65 mph, but no
problems occurred during the transporting process and the girders arrived on schedule.
One issue that occurred was a request by the drivers of the trucks. They requested that an
extra set of holes be drilled into the flanges to help with the stability of the deck girders
while hauling. The request was not granted because of the reinforcement layout in the
flange did not allow it. In future projects, this option could possibly be taken into
consideration during the fabrication process by the use of PVC inserts into the flanges.

96
5.9 Construction
The construction process is described in the construction report located in Appendix A.
A few issues and recommendations can be discussed about the construction process. The
washers on the diaphragms began to push through the holes when the nuts were being
tightened in the field. The holes in the diaphragm appeared to be too large to prevent this
from happening. A smaller hole for the bolts in the connections would be a solution for
this problem. In future projects, the use of concrete diaphragms could be another option
for this type of bridge.
Another issue brought up in many meetings had to deal with the riding surface of the
actual girders. The location of the bridge required an average of 4” of asphalt to be added
to the top of the bridge (bridge is located at the bottom of a sag curve). A surveying
study was done to address this issue. The entire bridge deck surface was surveyed using
a total station and the coordinates and elevations were recorded. A mapping program
was then used to plot these points to verify the quality of the concrete surface. The
program used was Arcview GIS 3.3®, which allows the user to import an Excel
spreadsheet with geographical data and create numerous types of maps. The type of map
created for the assessment of the riding surface was a 3-D surface map (see Figure 5-29).
This map shows how the surface changes along the bridge according to the locations and
elevations of the geographical points used. The different colors represented ranges of
elevations. The map shows that the deck girders on the west side of the bridge are
slightly higher than the ones on the east, as expected, since the bridge was sloping in that
direction.
Furthermore, when asphalt is not needed, if an extra inch of concrete would be placed on
the deck surface during fabrication, this layer can be removed by surface grinding after
the members are installed, allowing for a smoother riding surface. Finally, the use of
lightweight concrete could reduce the gross weight by 20% (and would present a few
design challenges to be considered), which would reduce the demand for both hauling
and lifting equipment, as well as the demand on the gravity load supporting system.

97
Figure 5-29. Arcview GIS 3.3® Image of Riding Surface Without Wearing Surface
6 Bridge Load Test
6.1 Instrumentation
The bridge was monitored during testing using three instruments: displacement
transducers, strain transducers, and strain gages. Displacement transducers, shown in
Figure 6-1, were used to measure vertical displacement in the bridge girders. The strain
gages were used to measure strain on the diaphragms between the girders, and the
connection plates in the deck (see Figure 6-2). The strain transducers were used to
measure strain at the bottom and top of the deck girders themselves (see Figure 6-3).
Once all of the instruments were in place, cables were attached to each device. The
cables were then attached to the Data Acquisition System (DAQ) so that the strains and
displacement could be recorded into spreadsheets during the testing. The layout of the
instruments was designed to allow the determination of distribution factors, impact
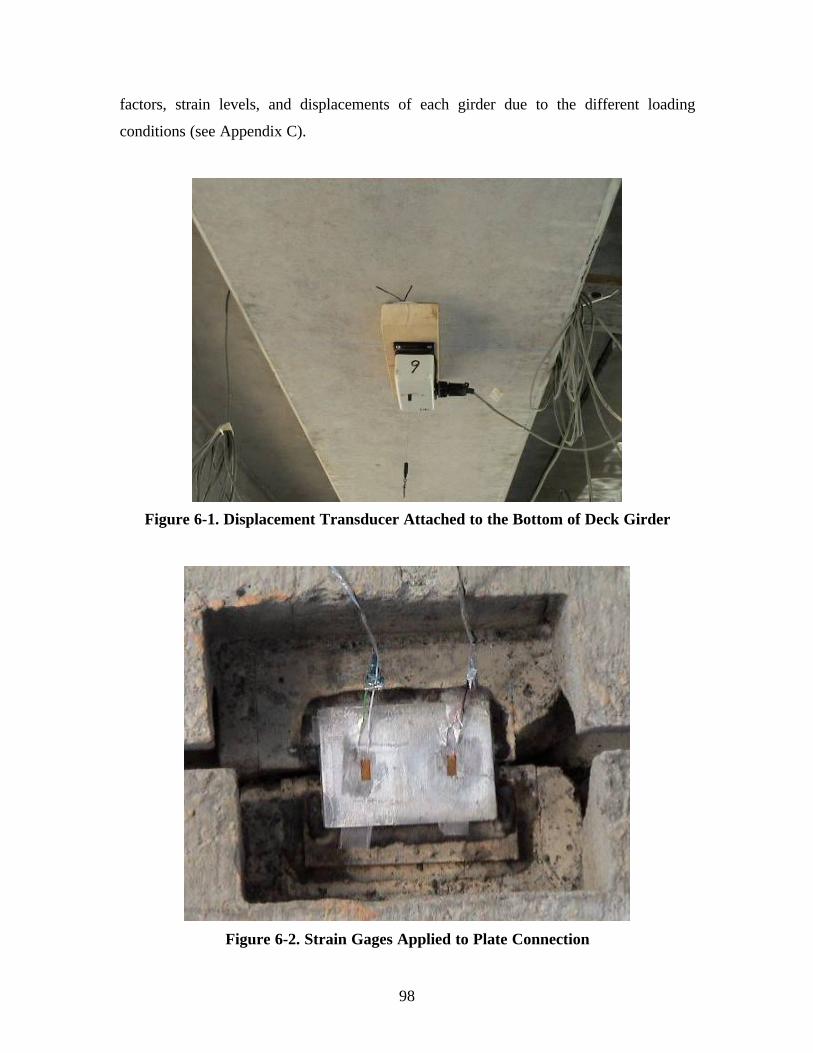
98
factors, strain levels, and displacements of each girder due to the different loading
conditions (see Appendix C).
Figure 6-1. Displacement Transducer Attached to the Bottom of Deck Girder
Figure 6-2. Strain Gages Applied to Plate Connection

99
Figure 6-3. Strain Transducer Attached to the Bottom of Deck Girder
6.2 Load Test
In this project, two types of truck loads were applied: quasi-static (slow moving) and
dynamic. The loading vehicle for the testing was determined through the use of a
SAP2000™ model. A simply supported beam was used to model the deck girder (see
Figure 6-4). An arbitrary weight was chosen for the trucks first, and then each axle
weight was determined. Each axle weight was then divided in half for one wheel line and
placed on the simply supported beam. The axles were spaced five feet apart on the beam.
The axles were then moved at one foot increments along the beam until the maximum
moment was achieved. The weights of the trucks were then adjusted to achieve a
moment that was approximately 70% of the design moment of 1,632 k-ft. The total
weight of the two trucks selected was found to be approximately 100,000 lbs.

100
Figure 6-4. SAP2000™ Model
The NCDOT Division 10 provided two tandem trucks (see Figure 6-5) that were loaded
with coarse aggregate. The trucks were weighed on the day prior to the test. Each axle
was weighed separately and recorded (see Table 6-1). The quasi - static loading required
the two trucks to be positioned one behind the other as close as possible. The trucks were
then driven across the bridge at 5 mph in both directions (EW then WE), twice for each
load path. There were five different load paths used, shown in Figure 6-6. These load
paths were chosen in order to achieve maximum stress in each girder. These paths were
also selected to investigate how each girder reacts to loading at different points in the
transverse direction of the bridge.
The dynamic testing only allowed the use of one truck. The selected truck was first
driven at 5 mph to establish a baseline reference, and then allowed to drive at the normal
speed limit across the bridge. An AutoCAD™ drawing of the North direction used for
testing is shown in Figure 6-7.
Table 6-1. Measured Weight of NCDOT Tandem Trucks
Truck Front AxleWeight (lbs.)
Middle AxleWeight (lbs.)
Back AxleWeight (lbs.)
Total Weight(lbs.)
1 12,640 18,380 17,680 48,7002 14,120 17,140 16,660 47,920
Total Wt. 96,620
Direction of Travel

101
Figure 6-5. Testing Vehicles Provided by NCDOT
Figure 6-6. Loading Paths for Testing
Figure 6-7. Top View of Deck Girder Bridge
1 2 3 4 5

102
6.3 Test Results
The bridge testing resulted in the generation of hundreds of data points that were
analyzed. Each load path was analyzed and the non-erroneous data was used. Once the
deck girder strains were graphed for each load path, the peak values for each instrument
were recorded (see Table 6-2.) The strains were then used to calculate the stress values
in the girder. The stress values were later used to compare with the results of the FE
model.
The stresses were also used to calculate moments in girder 1 and girder 2. The strain
values along deck girders 1 and 2 are shown in Figures 6-8, 6-9, and 6-10. A negative (or
compression) strain was present in one of the instruments on each deck girder. The two
instruments which contained negative strain were located on the bottom of the deck
girders which, on a simple span, should show positive strain. On these graphs, the
horizontal axis, unless labeled otherwise, represent a simple scan number assigned by the
DAQ system, and does not represent a real physical variable, unless one considers that
readings were taken every other second during slow testing.
Table 6-3 shows the calculated moments for mid-span and end of both deck girders 1 and
2. These moments were checked with an equivalent SAP2000TM model that was created
to check the amount of fixity at the integral end bents. The model results are discussed
later in this chapter. The data in Table 6-3 shows that there was some fixity in the deck
girders, as the end of each deck girder contains negative moment proved by the presence
of tensile strain values at the top of the deck girder. This demonstrates that the integral
end bent does provide the deck girders with some end fixity. Paths 1 and 4 were the only
paths that showed significant fixity, since they were positioned directly over girders 1 and
2. The strain values were also used to determine the actual distribution factors for the
interior and exterior deck girders.

103
Table 6-2. Maximum Deck Girder Strain (µe) for Load Paths (Both Directions)
Instrument* Load Path
ST 1E 1W 2E 2W 3E 3W 4E 4W 5E 5W1 5.9 5.5 4.9 4.0 2.2 1.5 4.8 5.2 1.8 0.52 -21.4 -14.1 24.8 26.4 25.3 22.4 -54.3 -47.3 22.4 19.03 -38.1 -33.5 9.4 14.3 22.5 23.0 -49.0 -45.2 22.7 21.44 61.2 5.91 7.0 6.9 4.56 4.1 3.9 4.0 3.6 2.65 -5.2 -4.4 5.7 4.1 4.8 3.0 -10.4 -8.6 4.7 2.56 -6.2 -7.7 -4.2 -4.3 2.6 2.3 9.8 11.2 3.6 2.37 28.3 23.0 8.5 6.1 3.9 1.2 32.7 33.4 2.3 0.48 19.4 22.2 19.8 17.4 7.2 5.7 17.3 18.8 4.5 3.49 13.5 16.2 25.7 25.5 25.4 23.3 10.5 12.4 18.8 16.4
10 7.5 8.3 11.3 11.9 21.4 24.4 6.0 6.6 21.3 21.811 5.6 7.0 10.9 11.7 12.7 16.6 2.3 7.5 20.6 18.512 28.6 20.9 10.7 7.7 4.7 2.3 38.1 36.9 3.2 1.313 20.1 18.9 13.1 11.1 6.7 5.4 18.3 18.8 5.0 4.014 40.7 32.2 10.5 6.6 1.2 -1.0 51.0 48.3 0.7 -1.515 -2.2 -2.8 -3.9 -3.7 -2.2 -2.7 -2.4 -2.1 -2.0 -2.216 41.0 40.3 38.1 33.7 13.2 8.3 35.6 37.0 5.5 3.917 -5.0 -4.7 -1.8 -1.9 -3.7 -4.6 -6.7 -5.5 -4.2 -5.018 20.1 22.2 40.8 40.7 45.0 41.2 19.0 19.2 35.1 30.019 8.5 10.4 16.3 17.8 27.5 28.6 6.9 7.3 28.5 27.420 6.7 7.7 8.3 12.0 21.4 16.2 2.4 3.6 21.9 26.0
(-) Compression; (+) Tension; *Refer to Figure C-1 (Appendix C) for instrument location
-4.00E-05
-3.00E-05
-2.00E-05
-1.00E-05
0.00E+00
1.00E-05
2.00E-05
3.00E-05
4.00E-05
5.00E-05
1 2 3 4 5 6 7 8 9 10 11 12Str
ain
(in
./in
.)
ST3
ST4
ST6
ST8
ST13
ST16
ST17
Figure 6-8. Deck Girder 1 Strain Values from Path 1W
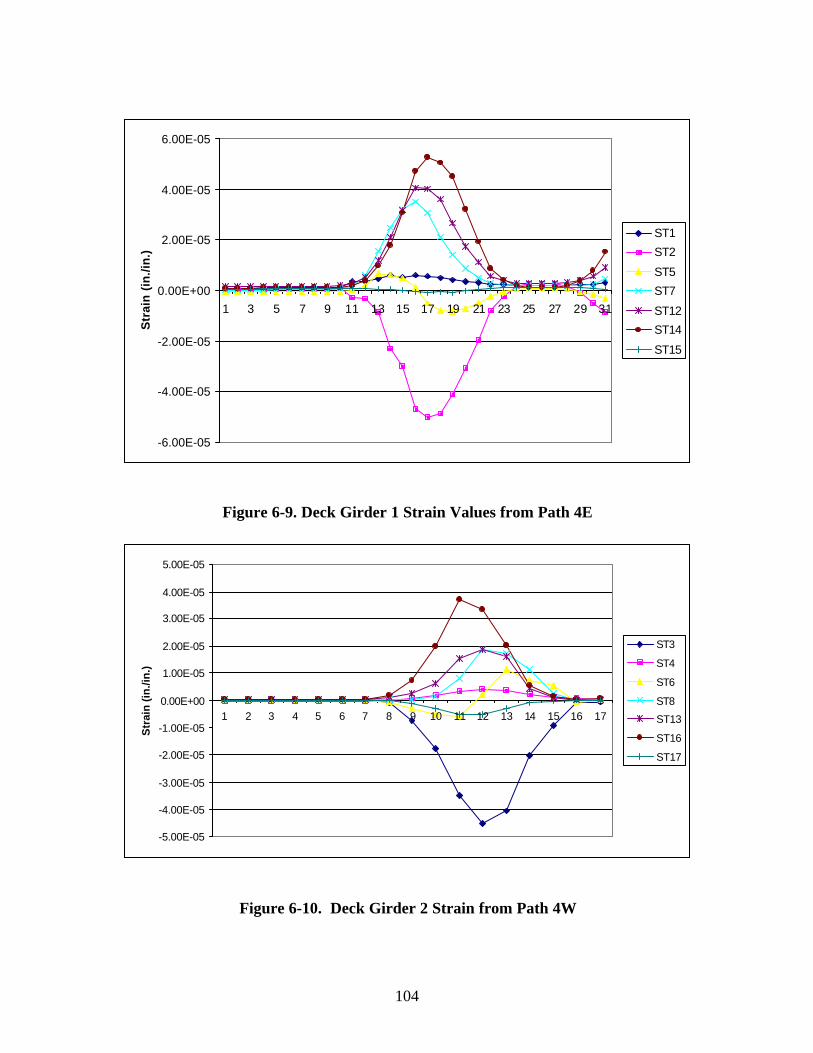
104
-6.00E-05
-4.00E-05
-2.00E-05
0.00E+00
2.00E-05
4.00E-05
6.00E-05
1 3 5 7 9 11 13 15 17 19 21 23 25 27 29 31
Str
ain
(in
./in
.)
ST1
ST2
ST5
ST7
ST12
ST14
ST15
Figure 6-9. Deck Girder 1 Strain Values from Path 4E
-5.00E-05
-4.00E-05
-3.00E-05
-2.00E-05
-1.00E-05
0.00E+00
1.00E-05
2.00E-05
3.00E-05
4.00E-05
5.00E-05
1 2 3 4 5 6 7 8 9 10 11 12 13 14 15 16 17
Str
ain
(in
./in
.)
ST3
ST4
ST6
ST8
ST13
ST16
ST17
Figure 6-10. Deck Girder 2 Strain from Path 4W

105
Table 6-3. Moment Values (in k-ft) for Deck Girders 1 and 2
Girder 1 Girder 2Load Path
EndMid-Span End
Mid-Span
1E -277.47 527.71 -494.00 531.601W -182.82 417.50 -434.35 522.524E -704.04 661.25 -635.32 461.584W -613.28 626.25 -586.05 479.73
6.4 Distribution Factors
The distribution factors of transverse load to longitudinal members are determined using
the deck girder spacing and the number of design lanes loaded. The distribution factors
shown in Tables 6-4 and 6-5 are the transverse distributions at the quarter point of the
bridge, a location used because some of the instruments at the center line produced
erroneous results for Paths 3 and 5.
The LRFD and LFD design distribution factors were calculated according to the
AASHTO specifications. The distribution factors from the test data were calculated
using the equation (Equation 6-1) developed by Stallings and Yoo. The values in Table
6-4 were calculated using 2 (n = 2) wheel lines (representing one truck loading the
bridge), to reflect the actual loading condition during the tests.
∑=
=k
jjj
ii
w
nDF
1
ε
ε (6-1)
where:
n – number of wheel lines (1 trucks x 2 wheel lines = 2 wheel lines)ei – strain at the bottom of the ith girderwj – ratio of the section modulus ratio of the jth girder to the section modulus oftypical interior girderk – number of girders

106
Table 6-4. Distribution Factors at the Quarter-Line of Bridge Using 2 Wheel Lines
Test Data LFD LRFD Interior Exterior Interior Exterior Interior Exterior
1E 0.52 0.771W 0.58 0.602E 0.78 0.262W 0.73 0.333E 0.75 0.373W 0.69 0.474E 0.50 0.954W 0.48 0.855E 0.67 0.655W 0.54 0.74
1.08 1.16 0.70 0.65
The LRFD values are much closer to the calculated values in Table 6-4, which correlates
to the LRFD method used to design this bridge, suggesting that the 2 wheel-line approach
is more accurate for newly designed bridges. The predicted values of the interior deck
girder compare very closely to the values for Path 2. The test data shows that Path 2
controls the design of the interior deck girder according to the LRFD method.
The predicted values of the exterior deck girder correlate well with the values from Paths
4 and 5 in Table 6-4. The test data shows that the design for the exterior deck girder is
controlled by load Path 4. The graph in Figure 6-11 shows that the interior deck girder
does carry a higher amount of strain (see Appendix C for instrument layout) than the
interior deck girders for Path 2. Similarly, the graph in Figure 6-12 shows that the
exterior deck girder does indeed receive higher strain values from Path 4.

107
0.00E+00
5.00E-06
1.00E-05
1.50E-05
2.00E-05
2.50E-05
3.00E-05
1 3 5 7 9 11 13 15 17 19 21 23 25 27
Str
ain
(in
./in
.) ST7
ST8
ST9
ST10
ST11
Figure 6-11. Strain Readings at the Quarter-Points on Path 2 West
-5.00E-06
0.00E+00
5.00E-06
1.00E-05
1.50E-05
2.00E-05
2.50E-05
3.00E-05
3.50E-05
4.00E-05
1 2 3 4 5 6 7 8 9 10 11 12 13 14 15 16 17
Str
ain
(in
./in
.) ST7
ST8
ST9
ST10
ST11
Figure 6-12. Strain Readings at the Quarter-Points on Path 4 West
108
6.5 End Fixity Investigation
The evidence of negative moment in the girders raised interest. This was first
investigated in Chapter 3 using ANSYS. In addition, to validate this finding, SAP2000™
was used to produce a model in order to try and determine just how much fixity was
present at the integral end bents. The SAP2000™ model was used to produce models
with three different constraints. The types of constraints used were pinned-pinned, fixed-
fixed, and the last one contained a rotational spring attached at both ends of the deck
girder. The stiffness given by the integral end bent was calculated using Equation 6-2
and used for the stiffness of the rotational springs. To calculate the moment of inertia,
the tributary width of one single deck girder was used for “b” and the depth parallel to the
deck girder length was used for “h”.
LEI
k = (6-2)
where:
k – spring constant (kip-ft)
L – height of the integral end bent (ft)
E – modulus of elasticity of the concrete (ksf)
I – moment of inertia calculated for integral end bent (ft.4)
=
12
3bhI
The same loading condition shown in Figure 6-4 was used for this model as well. The
results at mid-span of each run are shown in Table 6-5. When comparing these results to
the actual testing data, the moment values are significantly close. The SAP2000™ model
does not include all five deck girders acting together; it was run using only a single
representative deck girder. The deflections produced in SAP2000™ are greater than the
maximum deflection created during the testing. This again could be due to the use of
only a single deck girder in SAP2000™ compared to the five actual deck girders in the
field. Furthermore, the SAP2000™ model did not include the diaphragms or parapet
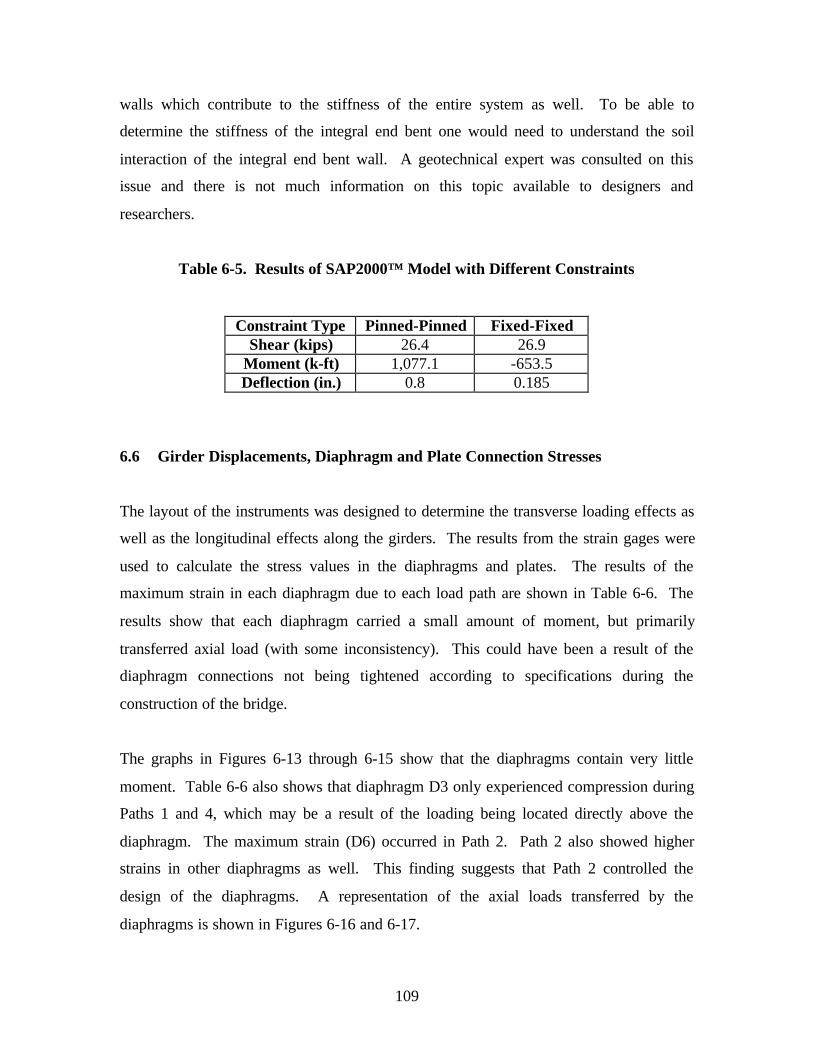
109
walls which contribute to the stiffness of the entire system as well. To be able to
determine the stiffness of the integral end bent one would need to understand the soil
interaction of the integral end bent wall. A geotechnical expert was consulted on this
issue and there is not much information on this topic available to designers and
researchers.
Table 6-5. Results of SAP2000™ Model with Different Constraints
Constraint Type Pinned-Pinned Fixed-FixedShear (kips) 26.4 26.9
Moment (k-ft) 1,077.1 -653.5Deflection (in.) 0.8 0.185
6.6 Girder Displacements, Diaphragm and Plate Connection Stresses
The layout of the instruments was designed to determine the transverse loading effects as
well as the longitudinal effects along the girders. The results from the strain gages were
used to calculate the stress values in the diaphragms and plates. The results of the
maximum strain in each diaphragm due to each load path are shown in Table 6-6. The
results show that each diaphragm carried a small amount of moment, but primarily
transferred axial load (with some inconsistency). This could have been a result of the
diaphragm connections not being tightened according to specifications during the
construction of the bridge.
The graphs in Figures 6-13 through 6-15 show that the diaphragms contain very little
moment. Table 6-6 also shows that diaphragm D3 only experienced compression during
Paths 1 and 4, which may be a result of the loading being located directly above the
diaphragm. The maximum strain (D6) occurred in Path 2. Path 2 also showed higher
strains in other diaphragms as well. This finding suggests that Path 2 controlled the
design of the diaphragms. A representation of the axial loads transferred by the
diaphragms is shown in Figures 6-16 and 6-17.

110
Table 6-6. Maximum Diaphragm Strain (µe)
Load PathDiaphragm SG 1E 1W 2E 2W 3E 3W 4E 4W 5E 5W
5 25.5 23.0 42.4 -3.7 -5.0 -4.9 13.3 13.5 -6.0 2.5D110 22.6 35.2 -2.4 37.1 -13.6 -16.1 4.4 7.4 -18.2 21.811 22.1 29.3 34.9 30.7 -10.1 -13.9 8.8 5.5 -14.1 -16.012 36.7 28.9 37.1 33.7 -10.9 -13.7 6.8 4.3 -13.6 -15.1D214 -18.5 22.1 31.5 33.6 40.8 37.3 -21.0 -21.8 19.7 17.715 -18.7 -16.8 23.0 30.2 38.6 38.0 -18.6 -16.2 18.0 17.016 -20.0 -17.2 24.4 31.6 43.3 41.5 -18.6 -19.1 21.7 20.6D318 -73.0 -69.5 19.2 28.4 26.8 26.6 -53.6 -56.8 23.8 23.225 31.6 31.0 1.3 -2.8 -5.4 -6.3 21.1 20.9 -4.9 -5.027 28.9 26.7 -3.3 -6.5 -9.0 -9.5 19.3 19.5 -8.1 -7.0D528 34.6 31.1 -3.2 -7.7 -14.0 -15.5 20.9 24.5 -11.4 -12.629 40.3 50.6 60.1 55.7 -19.4 -28.1 8.1 12.4 -36.5 -33.531 21.5 34.1 35.8 29.8 -8.5 -10.3 5.0 6.1 -14.4 -11.7D632 46.3 61.6 76.2 71.8 -17.3 -28.6 5.9 8.9 -40.0 -38.6
-5.00E-06
0.00E+00
5.00E-06
1.00E-05
1.50E-05
2.00E-05
2.50E-05
3.00E-05
3.50E-05
4.00E-05
1 3 5 7 9 11 13 15 17 19 21 23 25 27
Str
ain
(in
./in
.)
SG11
SG12
SG14
Figure 6-13. Strains in D2 for Path 2 East

111
-5.00E-06
0.00E+00
5.00E-06
1.00E-05
1.50E-05
2.00E-05
2.50E-05
3.00E-05
3.50E-05
4.00E-05
4.50E-05
1 3 5 7 9 11 13 15 17 19
Str
ain
(in
./in
.)
SG15
SG16
SG18
Figure 6-14. Strains in D3 for Path 3 West
-1.00E-05
0.00E+00
1.00E-05
2.00E-05
3.00E-05
4.00E-05
5.00E-05
6.00E-05
7.00E-05
8.00E-05
1 2 3 4 5 6 7 8 9 10 11 12 13 14 15 16 17 18 19
Str
ain
(in
./in
.)
SG29
SG31
SG32
Figure 6-15. Strains in D6 for Path 2 West

112
Figure 6-16. Diagram of Axial Forces in Diaphragms (kips) for Path 1 West
Figure 6-17. Diagram of Axial Forces in Diaphragms (kips) for Path 2 West
The plate connections were instrumented in order to measure transverse strain (see
Appendix C). Each plate instrumented had two strain gages as shown in Figure 6-2. The
strains due to each load path are shown in Table 6-7. The graph in Figure 6-18 shows the
strain values for the two plates, P4 and P8. Values for plates P4 and P8 show that one
side of the plate is in compression and the opposite side is in tension. This suggests that
there was some moment occurring in the plates, in addition to an axial force.
Plate P8 experiences moment in Paths 1, 2, and 4, while plate P4 experiences moment
from Paths 2, 3, and 5. Values from Path 2 produced moment throughout the load
duration in the two plates in question. Path 1 generated the highest strain in Plate P4
because the wheels were located directly above this line of plates for this particular
loading path. Plate P8 experienced higher strain in Path 2 because it was located closer
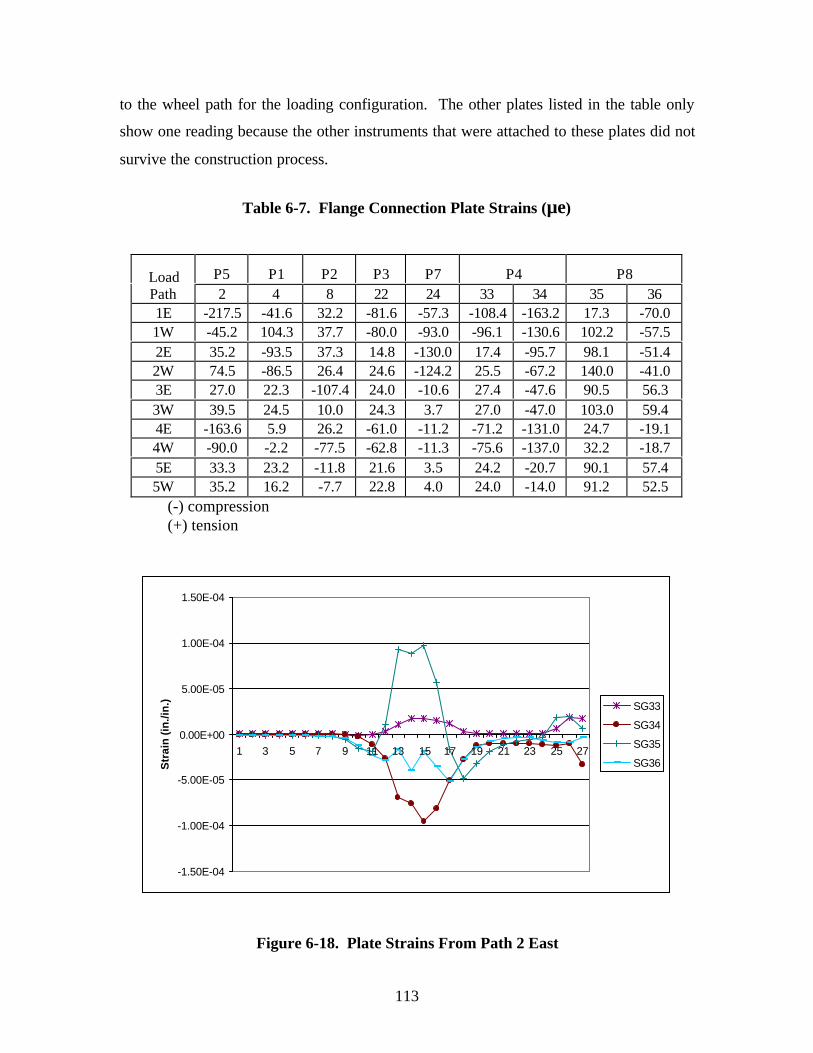
113
to the wheel path for the loading configuration. The other plates listed in the table only
show one reading because the other instruments that were attached to these plates did not
survive the construction process.
Table 6-7. Flange Connection Plate Strains (µe)
P5 P1 P2 P3 P7 P4 P8LoadPath 2 4 8 22 24 33 34 35 361E -217.5 -41.6 32.2 -81.6 -57.3 -108.4 -163.2 17.3 -70.01W -45.2 104.3 37.7 -80.0 -93.0 -96.1 -130.6 102.2 -57.52E 35.2 -93.5 37.3 14.8 -130.0 17.4 -95.7 98.1 -51.42W 74.5 -86.5 26.4 24.6 -124.2 25.5 -67.2 140.0 -41.03E 27.0 22.3 -107.4 24.0 -10.6 27.4 -47.6 90.5 56.33W 39.5 24.5 10.0 24.3 3.7 27.0 -47.0 103.0 59.44E -163.6 5.9 26.2 -61.0 -11.2 -71.2 -131.0 24.7 -19.14W -90.0 -2.2 -77.5 -62.8 -11.3 -75.6 -137.0 32.2 -18.75E 33.3 23.2 -11.8 21.6 3.5 24.2 -20.7 90.1 57.45W 35.2 16.2 -7.7 22.8 4.0 24.0 -14.0 91.2 52.5
(-) compression (+) tension
-1.50E-04
-1.00E-04
-5.00E-05
0.00E+00
5.00E-05
1.00E-04
1.50E-04
1 3 5 7 9 11 13 15 17 19 21 23 25 27
Str
ain
(in
./in
.) SG33
SG34
SG35
SG36
Figure 6-18. Plate Strains From Path 2 East

114
The maximum displacements from each load path are shown in Table 6-8. The
deflections from the load testing are very small compared to the deflection limit of L/800
used in the design calculations. This could be a result of the deck girders having a higher
stiffness than designed due to the integral end bent, asphalt overlay, and concrete parapet
wall. The displacements at mid-span are shown in Table 6-9. The instrument for deck
girder 1 was omitted because it produced erroneous data. This table shows that, as
expected, each deck girder that was located beneath the corresponding load deflected
more than the other girders away from the loaded area. The graph in Figure 6-19 shows
the deflections along deck girder 2 for Path 1 East. The overall maximum deck girder
deflection of 1/8” is well below the design limits.
Table 6-8. Deck Girder Displacements (Inches)
PathDT # 1E 1W 2E 2W 3E 3W 4E 4W 5E 5W
1 0.026 0.020 0.002 0.001 0.007 0.003 0.035 0.037 0.006 0.0033 0.060 0.060 0.014 0.006 0.002 0.001 0.094 0.098 0.002 0.0024 0.050 0.050 0.040 0.024 0.001 0.000 0.045 0.032 0.000 0.0005 0.040 0.050 0.073 0.078 0.057 0.057 0.029 0.030 0.040 0.0396 0.001 0.016 0.000 0.050 0.009 0.020 0.000 0.004 0.009 0.0137 0.007 0.010 0.002 0.024 0.012 0.021 0.024 0.001 0.049 0.0418 0.005 0.015 0.001 0.002 0.002 0.004 0.029 0.053 0.000 0.0019 0.080 0.090 0.066 0.067 0.004 0.005 0.080 0.083 0.005 0.00211 0.124 0.110 0.085 0.074 0.004 0.009 0.105 0.108 0.003 0.00212 0.033 0.040 0.050 0.050 0.040 0.039 0.004 0.007 0.009 0.03313 0.002 0.017 0.035 0.074 0.078 0.080 0.000 0.002 0.079 0.07914 0.000 0.002 0.000 0.053 0.006 0.019 0.000 0.006 0.033 0.02716 0.074 0.072 0.050 0.050 0.009 0.009 0.071 0.072 0.000 0.000

115
Table 6-9. Displacements at Mid-Span (inches)
Load PathGirder # 1E 1W 2E 2W 4E 4W
2 0.124 0.110 0.085 0.074 0.105 0.1083 0.033 0.040 0.050 0.050 0.004 0.0074 0.002 0.017 0.035 0.074 0.001 0.0025 0.001 0.002 0.001 0.053 0.001 0.006
-1.20E-01
-1.00E-01
-8.00E-02
-6.00E-02
-4.00E-02
-2.00E-02
0.00E+00
2.00E-02
1 3 5 7 9 11 13 15 17 19 21
Def
lect
ion
(in
.)
DT4
DT9
DT11
DT16
Figure 6-19. Deflections in Deck Girder 2 from Load Path 1 East
6.7 Impact Factors
For design purposes, AASHTO specifies an impact factor. This factor is applied to
increase the live load effects on the bridge, by including dynamic and vibratory impact
effects. In this research, the results from the dynamic loading condition produced
information that was later used to calculate the impact factor for the bridge. The results
summarized in Table 6-11 are the impact factors calculated from Paths 1, 2, and 3 in both
directions, using a single loading vehicle. The impact factors were calculated using
Equation 6-3. The table also shows that the actual impact factors are close to the

116
calculated AASHTO values. The graphs associated with the results in Table 6-10 for the
East direction are shown in Figures 6-20 through 6-25, where the horizontal axis is a
DAQ generated reference number. It is clear from these figures that during the dynamic
testing, a significantly larger amount of strain data was needed to capture peak strain
readings.
N
nnn
slowdynamic∑∞
=
÷1
)( εε (6-3)
where:
n dynamicε – strain reading from the nth instrument of the dynamic loading
n slowε – strain reading from the nth instrument of the baseline reference loading
n – instrument numberN – total number of instruments used
Table 6-10. Impact Factors for Both East and West
Load Path Test Data LRFD1E 0.731W 1.132E 1.102W 1.033E 1.303W 1.02
1.30

117
-0.000005
0
0.000005
0.00001
0.000015
0.00002
1 10 19 28 37 46 55 64 73 82 91 100 109 118
Str
ain
(in
./in
.)
ST1
ST2
ST3
ST4
ST5
ST6
ST7
Figure 6-20. One Truck (Slow) Loading Strains for Path 1E
-5.00E-06
0.00E+00
5.00E-06
1.00E-05
1.50E-05
2.00E-05
2.50E-05
3.00E-05
1 10 19 28 37 46 55 64 73 82 91 100 109
Str
ain
(in
./in
.)
ST1
ST2
ST3
ST4
ST5
ST6
ST7
Figure 6-21. One Truck (Slow) Loading Strains for Path 2E
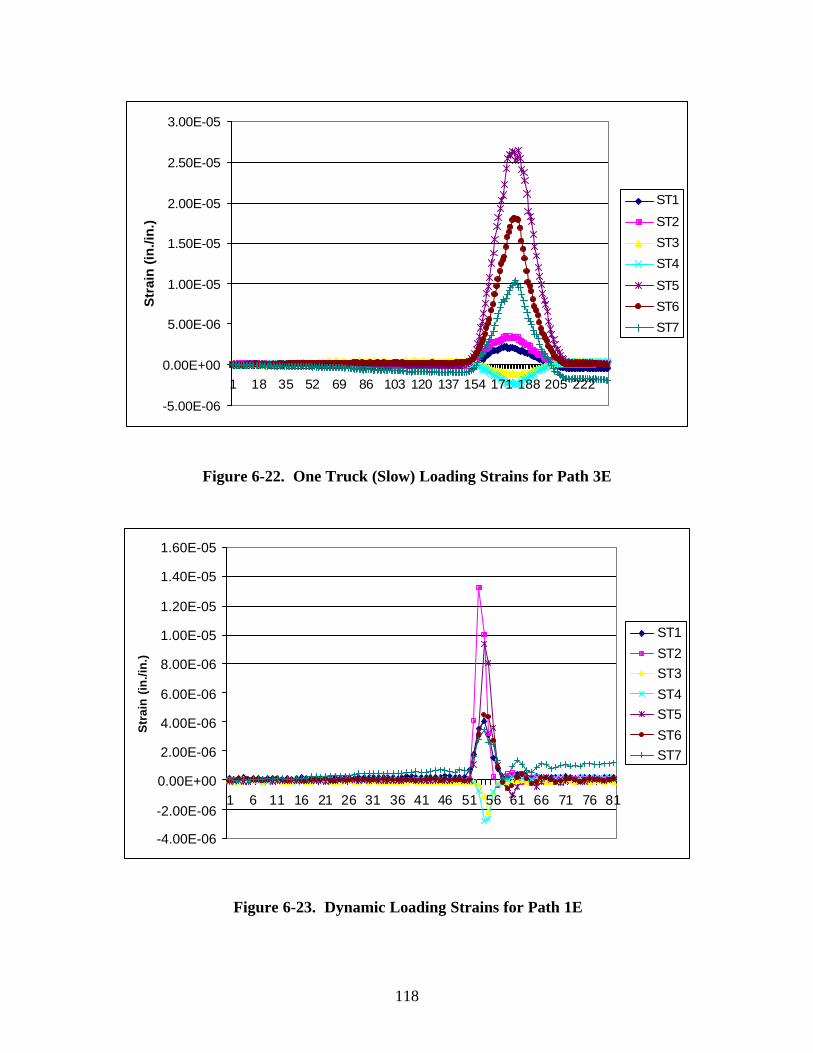
118
-5.00E-06
0.00E+00
5.00E-06
1.00E-05
1.50E-05
2.00E-05
2.50E-05
3.00E-05
1 18 35 52 69 86 103 120 137 154 171 188 205 222
Str
ain
(in
./in
.)
ST1
ST2
ST3
ST4
ST5
ST6
ST7
Figure 6-22. One Truck (Slow) Loading Strains for Path 3E
-4.00E-06
-2.00E-06
0.00E+00
2.00E-06
4.00E-06
6.00E-06
8.00E-06
1.00E-05
1.20E-05
1.40E-05
1.60E-05
1 6 11 16 21 26 31 36 41 46 51 56 61 66 71 76 81
Str
ain
(in
./in
.)
ST1
ST2ST3
ST4ST5
ST6ST7
Figure 6-23. Dynamic Loading Strains for Path 1E
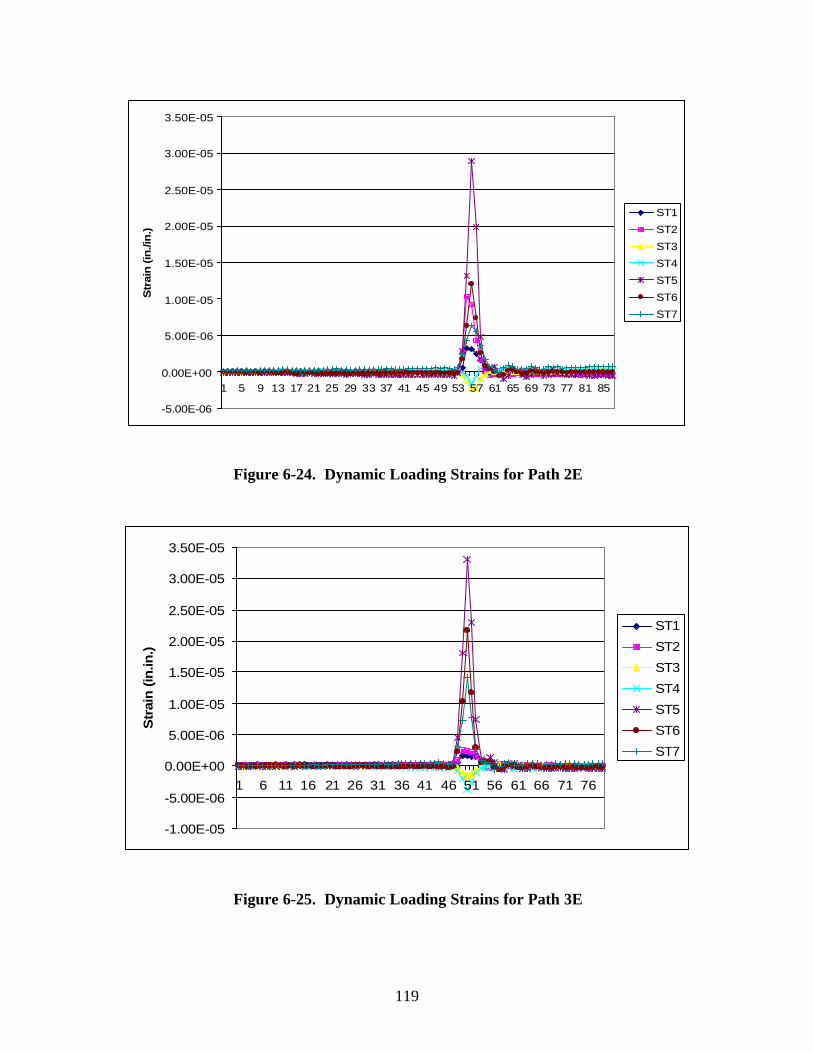
119
-5.00E-06
0.00E+00
5.00E-06
1.00E-05
1.50E-05
2.00E-05
2.50E-05
3.00E-05
3.50E-05
1 5 9 13 17 21 25 29 33 37 41 45 49 53 57 61 65 69 73 77 81 85
Str
ain
(in
./in
.)
ST1
ST2
ST3
ST4
ST5
ST6
ST7
Figure 6-24. Dynamic Loading Strains for Path 2E
-1.00E-05
-5.00E-06
0.00E+00
5.00E-06
1.00E-05
1.50E-05
2.00E-05
2.50E-05
3.00E-05
3.50E-05
1 6 11 16 21 26 31 36 41 46 51 56 61 66 71 76
Str
ain
(in
.in.)
ST1
ST2
ST3
ST4
ST5
ST6
ST7
Figure 6-25. Dynamic Loading Strains for Path 3E

120
7 Comparison of Analytical and Experimental Studies
7.1 Girder Stresses and Deformation
The deck girder normal stress values that were recorded during the load test were
compared to the values obtained from the ANSYS™ and Larsa™ models. The stress
values were taken at mid-span on the bottom extreme fiber of each of the five fixed-end
deck girders. These values were found to be very similar. The FE and Larsa™ models
consistently predicted slightly larger stress values on all three load paths. This difference
could be attributed to the parapet wall or imperfections in the path that the truck traveled
as the load test was being conducted. The asphalt overlay also provides slightly more
distribution of the tire load on the actual bridge surface. The comparisons from all three
load paths are shown in Figures 7-1 through 7-3.
0.0
100.0
200.0
300.0
400.0
No
rmal
Str
ess
(psi
)
LARSA™ 311.0 281.0 202.0 110.0 20.0
ANSYS™ 349.0 344.0 189.0 77.0 11.0
Load Test 270.0 267.0 147.0 69.0 51.0
Girder 1 Girder 2 Girder 3 Girder 4 Girder 5
Figure 7-1. Normal Stress at Mid-Span Path 1
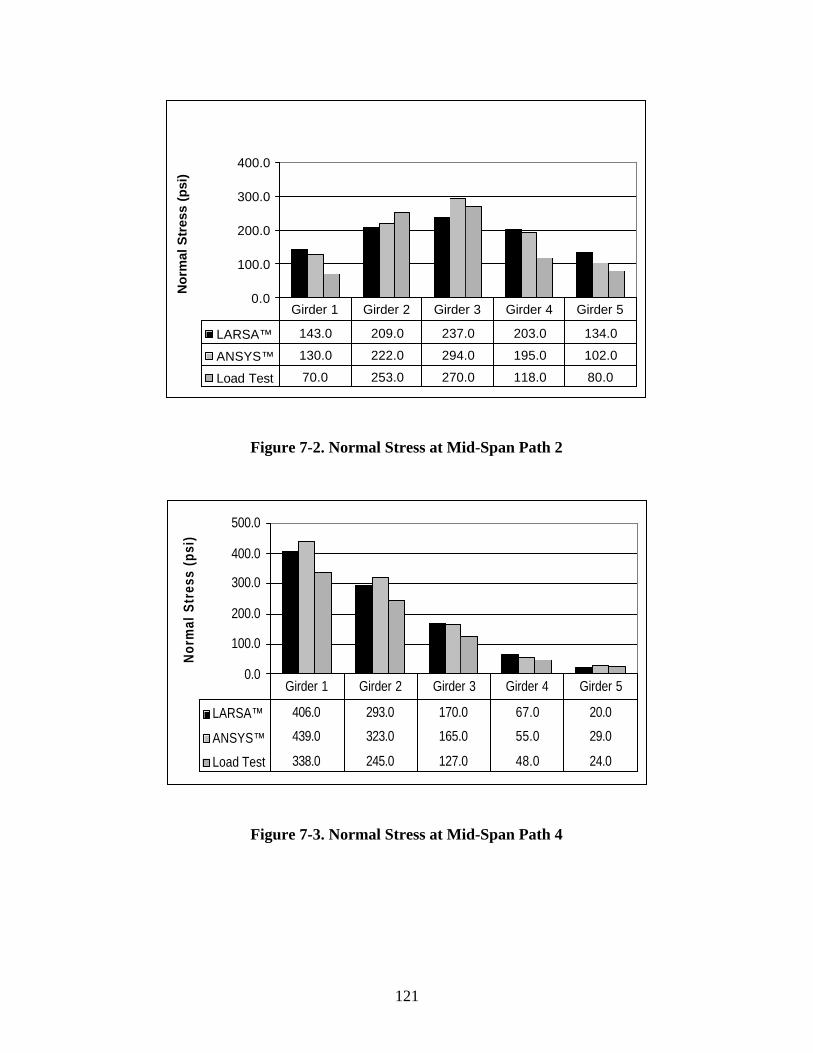
121
0.0
100.0
200.0
300.0
400.0N
orm
al S
tres
s (p
si)
LARSA™ 143.0 209.0 237.0 203.0 134.0
ANSYS™ 130.0 222.0 294.0 195.0 102.0
Load Test 70.0 253.0 270.0 118.0 80.0
Girder 1 Girder 2 Girder 3 Girder 4 Girder 5
Figure 7-2. Normal Stress at Mid-Span Path 2
0.0
100.0
200.0
300.0
400.0
500.0
Nor
mal
Str
ess
(psi
)
LARSA™ 406.0 293.0 170.0 67.0 20.0
ANSYS™ 439.0 323.0 165.0 55.0 29.0
Load Test 338.0 245.0 127.0 48.0 24.0
Girder 1 Girder 2 Girder 3 Girder 4 Girder 5
Figure 7-3. Normal Stress at Mid-Span Path 4

122
The value of the vertical displacement at mid-span of the five deck girders was also
compared (see Figures 7-4 to 7-6). Deck girder one is omitted due to an instrument error.
The simply supported FE model resulted in very large displacements, but the fixed area
ANSYS™ model and the fixed node Larsa™ model calculated the values within one
tenth of an inch on average. The Larsa™ model generally predicted the displacement
with a higher degree of accuracy than the ANSYS™ model. The small difference can
probably be attributed to the moving load feature in the Larsa™ program. The
ANSYS™ FE program does not have this feature, thus the truck can only be centered
about the mid-point of the deck girder. This difference could cause a small variance in
the maximum displacement at mid-span.
0.0000
0.0500
0.1000
0.1500
0.2000
Dis
plac
emen
t (i
n.)
LARSA™ 0.0900 0.0630 0.0340 0.0070
ANSYS™ 0.1430 0.0867 0.0360 0.0050
Load Test 0.1250 0.0400 0.0200 0.0060
Girder 2 Girder 3 Girder 4 Girder 5
Figure 7-4. Vertical Displacement at Mid-Span Path 1
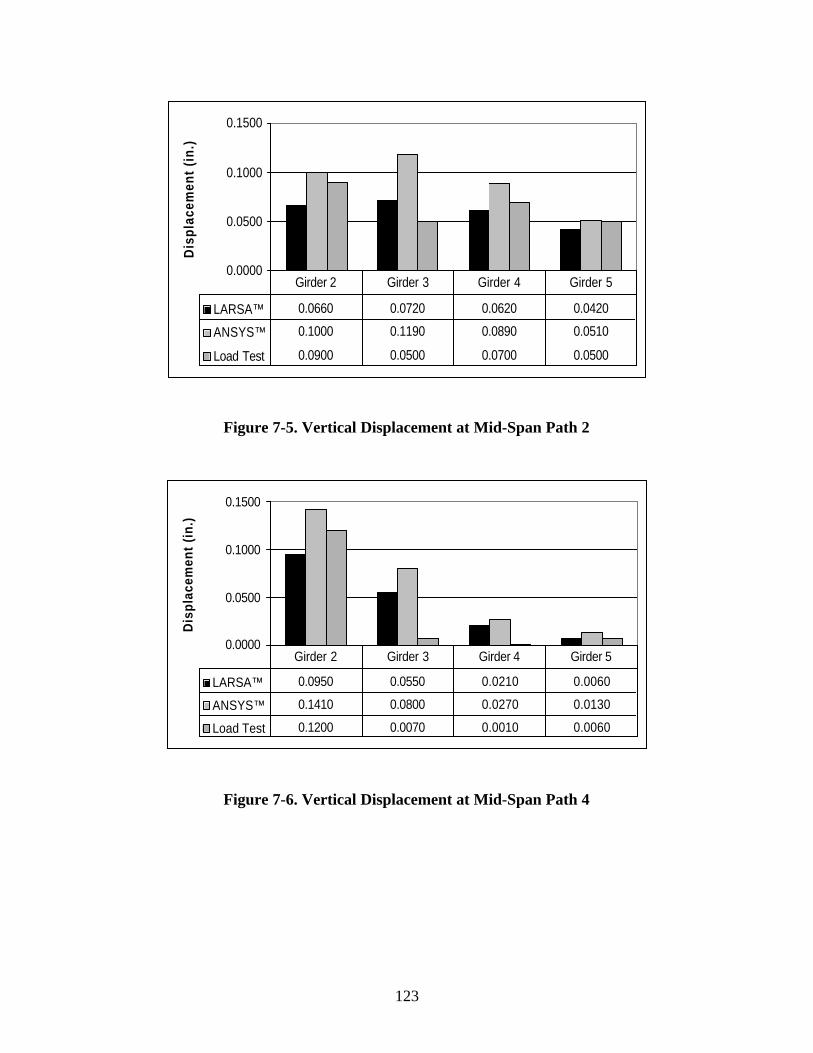
123
0.0000
0.0500
0.1000
0.1500
Dis
plac
emen
t (i
n.)
LARSA™ 0.0660 0.0720 0.0620 0.0420
ANSYS™ 0.1000 0.1190 0.0890 0.0510
Load Test 0.0900 0.0500 0.0700 0.0500
Girder 2 Girder 3 Girder 4 Girder 5
Figure 7-5. Vertical Displacement at Mid-Span Path 2
0.0000
0.0500
0.1000
0.1500
Dis
plac
emen
t (i
n.)
LARSA™ 0.0950 0.0550 0.0210 0.0060
ANSYS™ 0.1410 0.0800 0.0270 0.0130
Load Test 0.1200 0.0070 0.0010 0.0060
Girder 2 Girder 3 Girder 4 Girder 5
Figure 7-6. Vertical Displacement at Mid-Span Path 4

124
The deck girder stresses were also used to find the distribution factors for the interior and
exterior girders. The distribution factors from the load test portion of this paper were
computed using the same truck path in two opposite directions. These two values were
averaged and compared to the three ANSYS™ truck paths (see Figures 7-7 through 7-
10). The ANSYS™ model distribution was found to be very similar to the actual load
test when the two wheel line method was used. The four wheel line method proved to
have a larger difference in distribution. The difference in distribution could be caused by
the slope of the bridge or the higher stiffness that was apparent in the displacement and
stress comparisons discussed earlier in this chapter.
0.00
0.10
0.20
0.30
0.40
0.50
0.60
0.70
0.80
Dis
trib
utio
n F
acto
r
ANSYS™ 0.71 0.62 0.32
Load Test 0.55 0.76 0.49
Path 1 Path 2 Path 4
Figure 7-7. 2 –Wheel Lines Distribution Factor for Interior Deck Girder Paths

125
0.00
0.20
0.40
0.60
0.80
1.00
Dis
trib
utio
n F
acto
r
ANSYS™ 0.72 0.28 0.86
Load Test 0.69 0.30 0.90
Path 1 Path 2 Path 4
Figure 7-8. 2 –Wheel Lines Distribution Factor for Exterior Deck Girder Paths
0.00
0.20
0.40
0.60
0.80
1.00
Dis
trib
utio
n F
acto
r
ANSYS™ 0.34 0.62 0.33
Load Test 0.79 0.76 0.67
Path 1 Path 2 Path 4
Figure 7-9. 4 –Wheel Lines Distribution Factor for Interior Deck Girder Paths

126
0.00
0.20
0.40
0.60
0.80
1.00
1.20
Dis
trib
utio
n F
acto
r
ANSYS™ 0.87 0.50 0.93
Load Test 0.85 0.21 1.03
Path 1 Path 2 Path 4
Figure 7-10. 4 –Wheel Lines Distribution Factor for Exterior Deck Girder Paths
7.2 Plate Stresses
The plates that were instrumented during the actual load test were mainly in one quadrant
of the bridge. The maximum plate stresses that were obtained were the maximum
transverse stress value as the truck crossed the entire bridge. The ANSYS™ model plate
stress values were observed when the truck caused near maximum displacement and
stress values in the deck girders. The maximum plate stress in the transverse direction
(perpendicular to traffic) that was computed by ANSYS™ versus the maximum load test
stress value is shown in Figures 7-11 and 7-12.

127
0
1000
2000
3000
4000
5000
Ten
sile
Str
ess
Syy
(p
si)
Ansys 1960.8 2011.4 2188.7
Load Test 2964 4060 933.8
Path 1 Path 2 Path 4
Figure 7-11. Maximum Transverse Tensile Plate Stress
0
1000
2000
3000
4000
5000
6000
7000
Com
p. S
tres
s S
yy (p
si)
Ansys 4668 4747 4601
Load Test 6307 3602 4744
Path 1 Path 2 Path 4
Figure 7-12. Maximum Transverse Compressive Plate Stress

128
The maximum principal stress that occurred in any plate, when the deck girder stress was
largest, is shown in Figure 7-13. The principal stress was not measured in the actual load
test but was computed in the ANSYS™ model.
0
1000
2000
3000
4000
5000
6000
7000
8000
9000
10000
Max
Pri
nci
ple
Str
ess
(psi
)
Tensile 4444 4933 2981
Compressive 8245 8798 5652
Path 1 Path 2 Path 4
Figure 7-13. Maximum Principal Plate Stress
The load test resulted in higher transverse plate stresses than the ANSYS™ model
computed. The highest tensile transverse stress observed in the load test was found to be
approximately 4,000psi. The largest corresponding stress computed in ANSYS™ was
approximately 3,000psi. This difference is probably attributed to the fact that the
ANSYS™ model was only loaded at mid-span to maximize deck girder effects. The
maximum plate stress may not occur when the truck load is at this location. The
diaphragms in the ANSYS™ model were also attached to the deck girders with a rigid
connection that was not entirely achieved in the actual bridge construction. This implies
that the diaphragms may have transmitted more of the live load in the ANSYS™ model
when the truck was in the position that caused the maximum plate stress.

129
The maximum transverse compressive stress was found to be larger in the actual load
test. The difference in the maximum compressive stress was found to be 1,600psi. This
difference could also be contributed to the position of the FE model truck load versus the
moving readings that the load test recorded. The maximum plate stresses were found to
be half of the ultimate stress that would cause failure in the connection. As shown in the
following paragraphs, the steel plate connections were deemed adequate when compared
to the ultimate values observed when the connections were tested in the laboratory.
7.3 Connection
The maximum tensile stress that occurred in a plate connector in the transverse direction
in the actual load test was 4,060psi. The maximum tensile transverse stress that occurred
in any plate in the ANSYS™ model was 2,189psi. According to the experimental
laboratory test the maximum stress that the plate obtained at the failure of the connection
was 8,533psi. This results in a safety factor of approximately 2.1.
The maximum transverse tensile stress that occurred in the ANSYS™ model when the
plate spacing was increased to 10’-0” on center was found to be 3,117psi. This value
gives the connection a safety factor of approximately 2.7.
7.4 Diaphragm Stresses
The diaphragms were instrumented at both ends during the actual load test. The
ANSYS™ diaphragms allow the maximum normal stress values to be reported at the end
(connection to the girder web) of each member. The maximum stress in each of the five
instrumented diaphragms is shown in Figures 7-14 through 7-18.
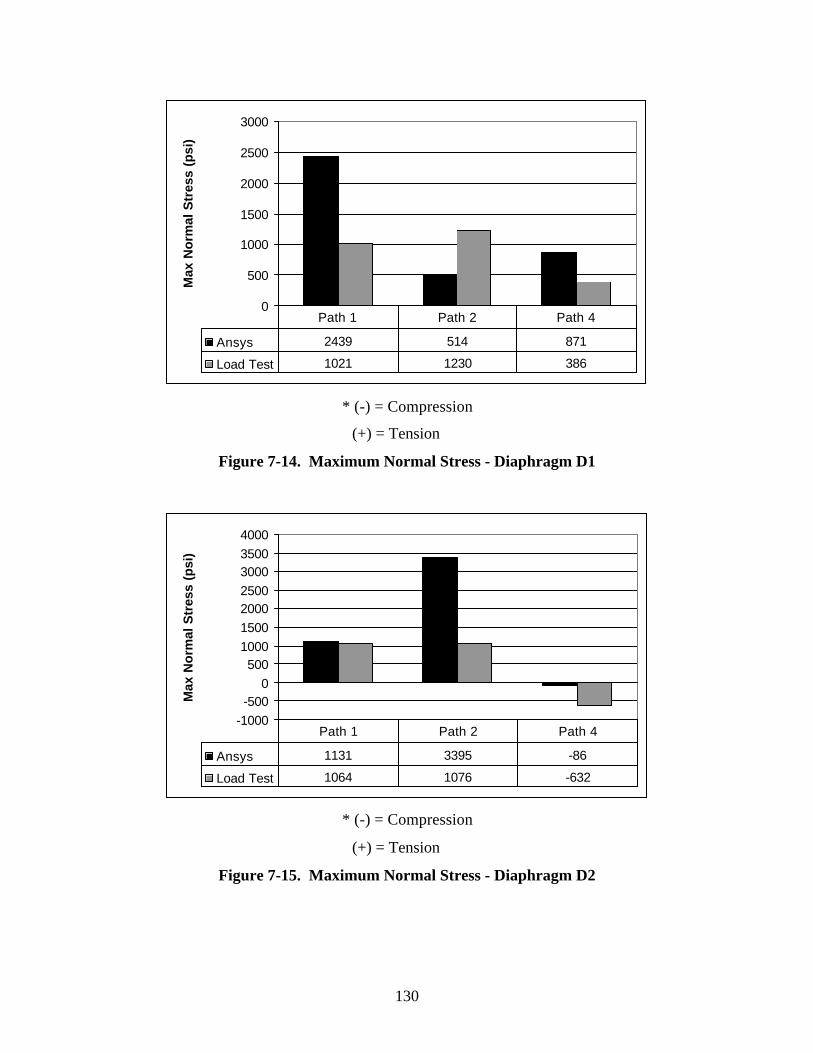
130
0
500
1000
1500
2000
2500
3000
Max
No
rmal
Str
ess
(psi
)
Ansys 2439 514 871
Load Test 1021 1230 386
Path 1 Path 2 Path 4
* (-) = Compression
(+) = Tension
Figure 7-14. Maximum Normal Stress - Diaphragm D1
-1000-500
0500
1000150020002500300035004000
Max
No
rmal
Str
ess
(psi
)
Ansys 1131 3395 -86
Load Test 1064 1076 -632
Path 1 Path 2 Path 4
* (-) = Compression
(+) = Tension
Figure 7-15. Maximum Normal Stress - Diaphragm D2

131
-3000
-2000
-1000
0
1000
2000
3000
Max
No
rmal
Str
ess
(psi
)
Ansys -462 2607 -966
Load Test -2217 916 -1647
Path 1 Path 2 Path 4
* (-) = Compression
(+) = Tension
Figure 7-16. Maximum Normal Stress - Diaphragm D3
-400
-200
0
200
400
600
800
1000
1200
Max
No
rmal
Str
ess
(psi
)
Ansys 537 184 170
Load Test 1003 -222 711
Path 1 Path 2 Path 4
* (-) = Compression
(+) = Tension
Figure 7-17. Maximum Normal Stress - Diaphragm D5

132
-500
0
500
1000
1500
2000
2500
Max
No
rmal
Str
ess
(psi
)
Ansys 308 861 -45
Load Test 1786 2210 360
Path 1 Path 2 Path 4
* (-) = Compression
(+) = Tension
Figure 7-18. Maximum Normal Stress - Diaphragm D6
The instrumented diaphragms were primarily in one quadrant of the bridge. The
ANSYS™ model was only loaded to produce maximum effects on the five deck girders
at mid-span. The diaphragms at the mid-points in the actual load test showed larger
stresses. The quarter point diaphragms had larger stress values in the ANSYS™ model.
The largest stress in any plate was computed by the ANSYS™ model, it was found to be
3,400psi in tension. This value is significantly less than the diaphragm yield strength of
36ksi. It is evident that the steel plates transmit the majority of the live load forces.

133
8 Conclusions and Recommendations
The present study focused on a new bridge deck girder obtained from a typical AASHTO
Type III girder in the following areas: (1) fabrication and transportation of a new deck
girder type: (2) the bridge construction, instrumentation and in-situ load testing of the
finished bridge; (3) the design and FE analysis of the bridge behavior; and finally, (4) on
the flange connection shear and tensile capacities and failure modes. Based on this 13-
month investigation, the following conclusions and recommendations can be made:
§ The fabrication of the deck girders was completed according to design specifications
and few problems were encountered. The development of a new formwork that
would allow the deck and the AASHTO Type III girder to be cast in one pour will
expedite the fabrication and bridge construction process. The addition of more inserts
to allow additional securing chains during transportation would also be beneficial.
§ The construction of the bridge was completed without any major problems. The
diaphragm holes proved to be too large for the collapsible washers used for the
connections. A decrease in hole diameter could be a solution to this problem.
Another solution could be the use of concrete diaphragms.
§ Although the deck girders were installed with an acceptable tolerance with respect to
vertical tolerance, in order to eliminate the need for the asphalt topping in future
projects, an extra inch of concrete could be added on the top of the deck girders
during fabrication, which could be ground off prior to the opening of the bridge. This
would cut down on construction time, which would in turn save money.
§ The bridge test was completed before the opening of the bridge, and a large number
of test results were recorded. The data was analyzed and compared to the FE
analysis. As expected, the girder stresses were not distributed evenly but rather
distributed according to the location of the loading path. The girders that were
located underneath the loading vehicle received much higher stresses than the ones
away from the loading.
§ During the load tests, the instruments on the plates recorded higher stresses than the
diaphragms, which could be a result of the diaphragms not being tightened according

134
to specifications (due to oversized holes in the concrete members). The
displacements recorded were very small compared to the design criteria of L/800
given by AASHTO. The end bent provided the deck girders with a fixed constraint
which was the cause of the negative moment found in the girders. The impact factors
were calculated using the dynamic test results. The values were proven to be fairly
close to the design impact factors given by AASHTO.
§ The use of Larsa 2000™ as an analysis program proved to be very precise when
considering the effects (prestress, dead, and live loading) on the deck girders and
analyzing multiple moving loads with multiple lane paths at any point along the
bridge length. The accuracy of the program, when compared to the NCDOT design
calculations, was very comparable. The construction stage option allowed a timely
and accurate assessment of deck girder camber and stress values at different
construction steps. The limitations of the program were encountered when the steel
plate connectors were considered. The use of a more sophisticated FE program was
required to analyze the smaller bridge components with more precision.
§ The ANSYS™ FE model resulted in plate stress values that were comparable to the
actual load test results. The load test and ANSYS™ model maximum tensile stress
values were found to be approximately half of the stress that would result in a
connection failure. The spacing of the plates was increased to 10’-0” on center and a
noticeable increase in plate stress occurred. The diaphragm members in both the FE
model and the actual load test were found to be very small compared to the
diaphragm yield strength of 36ksi. The diaphragms’ stresses were relatively small
with both plate spacing increments. The plate spacing increase to 10”-0” appears to
be viable design alternative based on the ANSYS™ model results, but only with a
redesigned connection detail, and considering connection long-term performance.
§ The flange connection analysis shows that the PCI handbook 6th Edition does not
accurately assess all types of connections. Therefore, either different equations or
analysis need to be derived, or additional experimental investigations performed. The
ultimate experimental capacities for shear and tension are respectively 24.65 kips and
12.78 kips. These values vary drastically from the predicted values from the PCI
Design Handbook 6th Edition.

135
9 Implementation and Technology Transfer
Research product: deck girder bridge fabrication/construction reports
Suggested User: Materials and Tests, and Structure Design Units
Recommended Use: to develop faster, safer, and more efficient methods to complete
future deck girder bridge system projects.
Recommended Training: none
Research product: integral end-bent moment restraint
Suggested User: Structure Design Units
Recommended Use: the deck’s negative reinforcement and connection detailing to the
integral end bent provided a significant moment restraint at the end of the deck girders, a
detail which must be designed accordingly, in order to avoid deck cracking
Recommended Training: minimal
Research product: deck girder bridge ANSYS™ and LARSA finite element (FE)
models
Suggested User: Structure Design Unit
Recommended Use: to find the forces and behavior of components not covered in the
current LRFD Bridge Design Manual and to analyze the behavior of the deck girder
bridge as a whole.
Recommended Training: minimal training, operating the FE software
Research product: embedded stud connection laboratory testing
Suggested User: Materials and Tests, and Structure Design Units
Recommended Use: to find the capacity of headed stud connections not currently
presented in the PCI Design Handbook 6th Edition.
Recommended Training: none

136
10 References
1. AASHTO LRFD Bridge Design Specifications, American Association of StateHighway Transportation Officials (2002).
2. ACI 318-05, Building Code Requirements for Structural Concrete and Commentary(2005).
3. AISC Manual of Steel Construction, American Institute of Steel Construction (2001).
4. Anderson, Art, “Stretched – Out AASHTO – PCI Beams Types III and IV for LongerSpan Highway Bridges,” PCI Journal, V. 18, No. 5, September – October 1973.
5. Anderson, Neal S., and Meinheit, Donald F., “Pry out Capacity of Cast-In HeadedStud Anchors,” PCI Journal, V.50, No. 2, March – April 2005.
6. Anderson, Neal S., and Meinheit, Donald F., “Design Criteria for Headed StudGroups in Shear: Part 1 – Steel Capacity and Back Edge Effects,” PCI Journal, V.45,No. 5, September – October 2000.
7. ANSYS™ Product Launcher Release 10.0, Copyright 1994-2000 SAS IP.
8. Arcview, “Arcview GIS 3.3®,” software developed by Environmental SystemsResearch Institute, 1995.
9. Bailey, Kevin G., “Deck Bulb Tees Using Standard AASHTO I-Beams andAASHTO LRFD Specifications,” Thesis Document, UNC-Charlotte, 2006.
10. Cheung, M. S., Jategaonkar, R., and Jaeger, Leslie G., “Effects of intermediatediaphragms in distributing live loads in beam-and-slab bridges,” Canadian Journal ofCivil Engineering, V. 13, No. 3, June 1986.
11. Concrete Technology Associates, “Segmental Construction,” Technical Bulletin 73 –B12, December 1973.
12. Gergely, J., Lawrence, T.O., Prado, C.I., Ritter, C.T., Stiller, W.B. North CarolinaDepartment of Transportation Research Project No. HWY – 2002 – 12: Evaluation ofBridge Analysis Vis – á – vis Performance (2004).
13. Hanks, B. C., “Hand Calculations for Pre-stressed Deck Girders,” NCDOT, March2005.
14. Larsa™, “Larsa™ 2000 4th Dimension for Bridges,” software developed by Larsa™,Inc., 2005.

137
15. PCI Design Handbook: Precast and Prestressed Concrete (5th Edition),Precast/Prestressed Concrete Institute (1999).
16. PCI Design Handbook: Precast and Prestressed Concrete (6th Edition),Precast/Prestressed Concrete Institute (2004).
17. PCI Bridge Design Manual: Chapter 9, Section 9.4, Precast/Prestressed ConcreteInstitute (2003).
18. Prestressed Concrete Institute, “The Reflections of the Beginnings of PrestressedConcrete in America,” PCI Journal, V. 23, No. 3, May – June 1978 through V. 25,No. 3, May – June 1980.
19. Stallings JM, Yoo CH. Tests and Ratings of Short Span Steel Bridges. Journal ofStructural Engineering. ASCE; 119.

138
Appendix
A- Construction Report
A.1 Site Preparation
Once the decision was made to replace the existing bridge on Austin Road in Stanley
County, site preparation began to demolish the existing bridge. The surrounding
residents were notified and signs for detours were posted for the traffic on Austin Road.
A detour route was created on both sides of Long Creek. Several steps were taken to
keep the surrounding environment safe from the debris created during the demolition and
construction of the bridge. Erosion control measures were installed to prevent
contamination of Long Creek (see Figure A-1). The creek is labeled as a clean water
creek; requiring no creek disturbance by the contractor.
Figure A-1. Erosion Control Measures
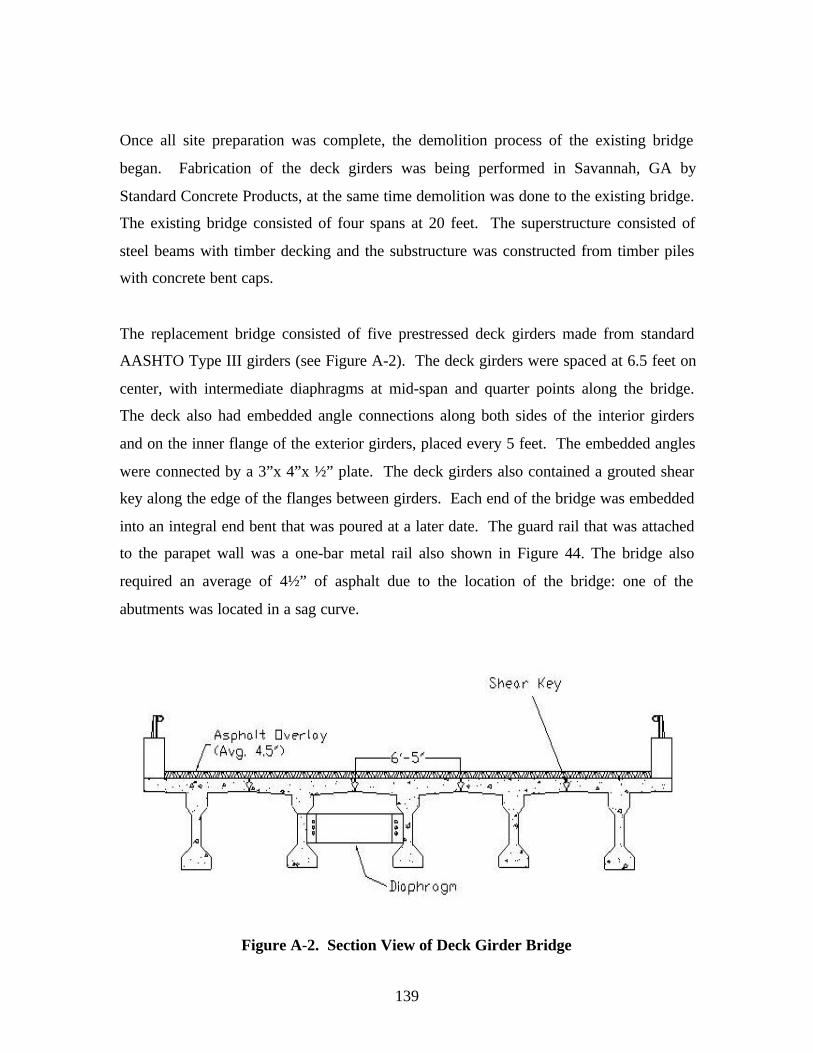
139
Once all site preparation was complete, the demolition process of the existing bridge
began. Fabrication of the deck girders was being performed in Savannah, GA by
Standard Concrete Products, at the same time demolition was done to the existing bridge.
The existing bridge consisted of four spans at 20 feet. The superstructure consisted of
steel beams with timber decking and the substructure was constructed from timber piles
with concrete bent caps.
The replacement bridge consisted of five prestressed deck girders made from standard
AASHTO Type III girders (see Figure A-2). The deck girders were spaced at 6.5 feet on
center, with intermediate diaphragms at mid-span and quarter points along the bridge.
The deck also had embedded angle connections along both sides of the interior girders
and on the inner flange of the exterior girders, placed every 5 feet. The embedded angles
were connected by a 3”x 4”x ½” plate. The deck girders also contained a grouted shear
key along the edge of the flanges between girders. Each end of the bridge was embedded
into an integral end bent that was poured at a later date. The guard rail that was attached
to the parapet wall was a one-bar metal rail also shown in Figure 44. The bridge also
required an average of 4½” of asphalt due to the location of the bridge: one of the
abutments was located in a sag curve.
Figure A-2. Section View of Deck Girder Bridge
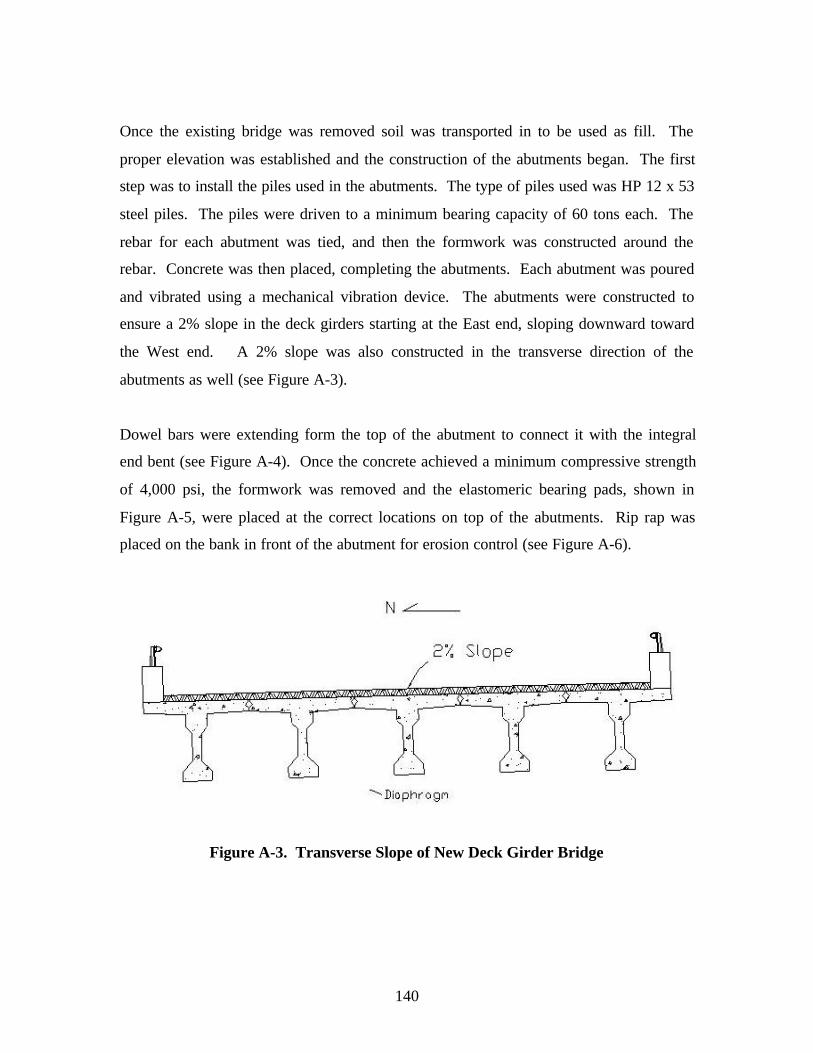
140
Once the existing bridge was removed soil was transported in to be used as fill. The
proper elevation was established and the construction of the abutments began. The first
step was to install the piles used in the abutments. The type of piles used was HP 12 x 53
steel piles. The piles were driven to a minimum bearing capacity of 60 tons each. The
rebar for each abutment was tied, and then the formwork was constructed around the
rebar. Concrete was then placed, completing the abutments. Each abutment was poured
and vibrated using a mechanical vibration device. The abutments were constructed to
ensure a 2% slope in the deck girders starting at the East end, sloping downward toward
the West end. A 2% slope was also constructed in the transverse direction of the
abutments as well (see Figure A-3).
Dowel bars were extending form the top of the abutment to connect it with the integral
end bent (see Figure A-4). Once the concrete achieved a minimum compressive strength
of 4,000 psi, the formwork was removed and the elastomeric bearing pads, shown in
Figure A-5, were placed at the correct locations on top of the abutments. Rip rap was
placed on the bank in front of the abutment for erosion control (see Figure A-6).
Figure A-3. Transverse Slope of New Deck Girder Bridge

141
Figure A-4. Vertical Rebar Protruding Out of Abutment
Figure A-5. Elastomeric Bearing Pad
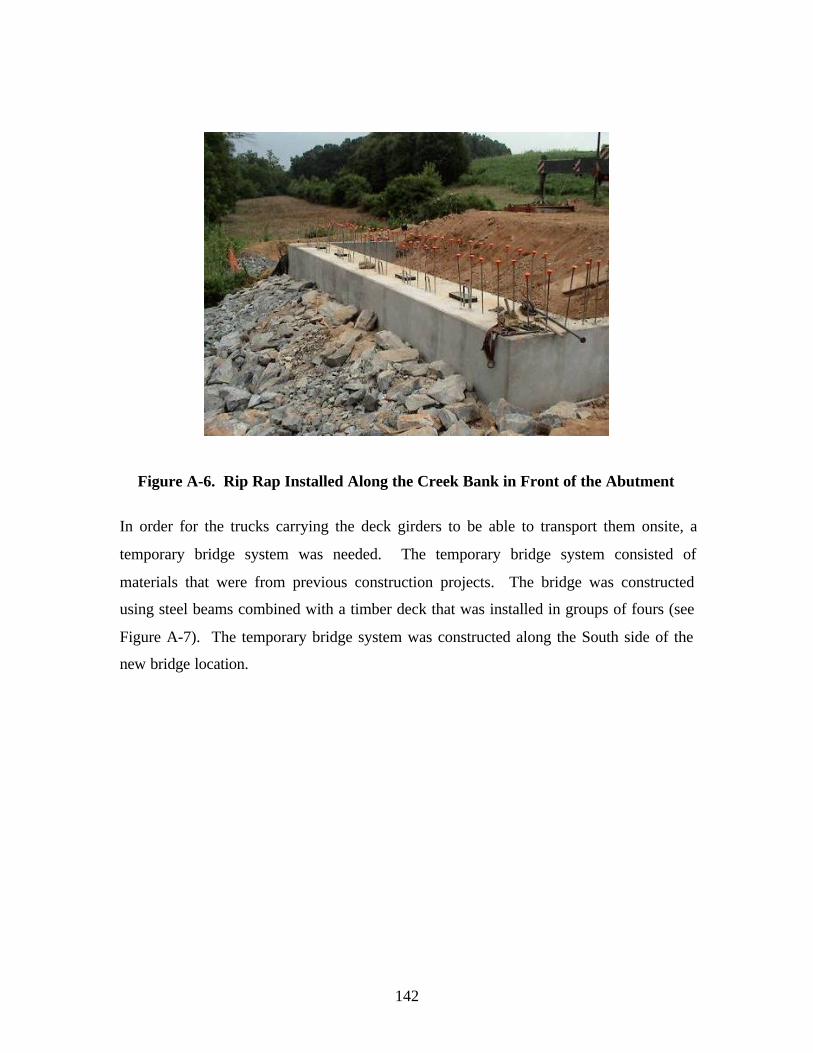
142
Figure A-6. Rip Rap Installed Along the Creek Bank in Front of the Abutment
In order for the trucks carrying the deck girders to be able to transport them onsite, a
temporary bridge system was needed. The temporary bridge system consisted of
materials that were from previous construction projects. The bridge was constructed
using steel beams combined with a timber deck that was installed in groups of fours (see
Figure A-7). The temporary bridge system was constructed along the South side of the
new bridge location.

143
Figure A-7. Installation of Temporary Bridge System
Once the temporary bridge system was finished, safety lines were added to provide a safe
environment for the construction workers (see Figure A-8). Cranes were ordered and
positioned on the site one day before the arrival of the deck girders. The contractor
selected two 240 ton cranes, shown in Figure A-9, for the installation of the deck girders.
The cranes were stationed at the East and West ends of the proposed bridge location.
Steel beams and scaffolding were placed across Long Creek located where the bridge was
going to be constructed (see Figure A-10). This provided the workers a working pad for
the installation of the steel diaphragms on the bridge. The next step was installing the
deck girders.

144
Figure A-8. Finished Temporary Bridge with Safety Lines

145
Figure A-9. 240 Ton Crane Used for Deck Girder Installation

146
Figure A-10. Steel Beam and Scaffolding for Diaphragm Installation
A.2 Girder Installation
The installation of the deck girders was a rapid, but delicate process. Each deck girder
was carefully backed down onto the temporary bridge system by the trucks. The crane
lines were then attached to lifting loops cast during fabrication in the deck girders shown
in Figure A-11. The crane used two heavy-duty shackles to lift the deck girders off the
truck.
Prior to lifting, the angles for the steel diaphragms were attached at the proper locations
on the deck girder. The steel angles were only hand tightened during this initial phase
(see Figure A-12). They were tightened in accordance with the plan specifications, once
all the deck girders were in final position. Once the two cranes were attached and the
steel angles tightened, the deck girder was lifted off of the truck in unison. The cranes
then slowly rotated the deck girder above the abutments. Once the deck girder was in the
correct location above the abutments, each crane slowly lowered the deck girder down
(see Figure A-13). The deck girder was carefully placed onto the bearing pads.

147
Figure A-11. Lifting Loops Used for Deck Girder Installation
Figure A-12. Hand Tightening of the Angles Before Deck Girder Placement

148
The deck girder was then temporarily stabilized until the next deck girder was placed and
the diaphragms were installed. This was achieved using a cable and ratchet lock system.
Each end of the cable had a hook attached to it. One hook was attached to the
longitudinal rebar anchored in the deck, and the other hook was attached to the rebar in
the abutment as shown in Figure A-14. This additional lateral support was a
precautionary measure due to the high deck girder center of gravity, as well as the 2%
transverse slope of the abutment.
Figure A-13. Installation of Deck Girder

149
Figure A-14. Stabilizing System for Deck Girders
A.3 Superstructure Construction
Once the five deck girders were in final position, the construction for the final
components of the superstructure began. The next step was to install the diaphragms
between the deck girders. There were a total of twelve diaphragms used at mid-span and
at quarter points along the bridge. The diaphragm installation began with the center
diaphragms, then the diaphragms at the quarter and three-quarter points on the bridge.
The diaphragms were placed onto the temporary work platform that was constructed
underneath the bridge prior to the installation of the deck girders. The diaphragms were
lifted into place using a small crane system consisting of two pulleys and a crank attached
to a metal rolling frame (see Figure A-15). Next, the bolts securing the diaphragms were
tightened, and the flange connector plates were welded to the embedded angles. The
bolts were tightened according to the specifications using a torque wrench. Collapsible
washers, shown in Figure A-16, were used to help provide assurance of the proper torque.
However, the holes in the angles were too large, and the washers started to push through
before the proper torque was achieved.
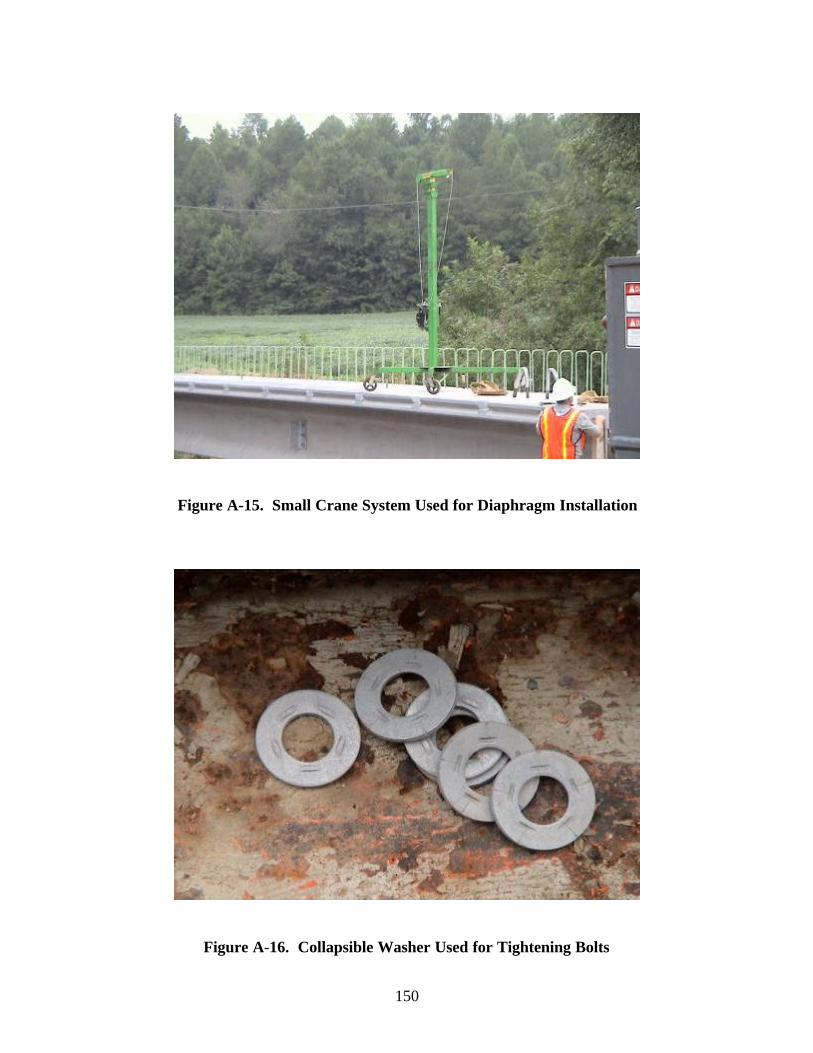
150
Figure A-15. Small Crane System Used for Diaphragm Installation
Figure A-16. Collapsible Washer Used for Tightening Bolts

151
The welding of the flange connections in the deck girder was performed during the same
time as the tightening of the bolts (see Figure A-17). Each connection consisted of an
angle embedded into the flange of each parallel deck girder and a galvanized plate. The
plate was completely welded along the three edges (see Figure A-18). Once each
connection was welded, the shear key was prepared for grouting. The end of each shear
key was blocked out by a square piece of plywood (see Figure A-19). The bottom of the
shear key was stuffed with backer rod to prevent the grout from flowing through. Some
of the deck girders fit tight enough together, that the backer rod was not able to be placed.
Great Stuff® Insulating Foam Sealant was used in place of the backer rod at these
locations to prevent the grout from escaping through the gap in between the girders (see
Figure A-20).
Figure A-17. Welding of Flange Connections

152
Figure A-18. Welded Flange Connections
Figure A-19. Plywood Used to Form the Shear Key

153
Figure A-20. Insulating Foam Used in Place of Backer Rod
Once completed, the grout was then mixed using a small gasoline powered rotary mixer
(see Figure A-21). A gallon of water for every 50 lbs. of grout was the mixing ratio used.
The grout was mixed for about 5 to 10 minutes and then poured into a wheel barrow.
The wheel barrow was then transported to the West end of the bridge. At the location of
the first connection the grout was poured into the connection opening. The slope of the
bridge allowed the grout to flow towards the East side of the bridge. Once a connection
opening was full, a trowel was used to smooth out the grout (see Figure A-22). This was
performed for each line of connections. The connections were then covered with damp
burlap to provide proper curing conditions for the grout (see Figure A-23).

154
Figure A-21. Gasoline Powered Rotary Mixer
Figure A-22. Trowel Used to Smooth Out Flange Connection Pocket

155
Figure A-23. Damp Burlap Used to Cover the Grouted Connections
A.4 Integral End Bent
During the grouting of the shear key, the integral end bent construction began as well.
The East bent was constructed first, and then the West would follow. Rebar was tied
according to the plans, and then the formwork was fabricated using plywood (see Figure
A-24). The East facing of the formwork was braced using 2x4’s stabilized into the fill
soil. Then, the concrete was ordered and transported to the site. The concrete was
poured directly from the truck into a concrete bucket. The bucket was lifted by a crane
on site from the truck to the end bent location. Once the bucket was above the proper
location, the release lever was pulled and the concrete was dumped into the formwork
(see Figure A-25). A mechanical vibration device was used to remove any voids in the
concrete (see Figure A-26). Once the concrete reached the desired elevation a trowel was
used to smooth it. The same process was repeated for the West bent.

156
Figure A-24. Integral End Bent Rebar and Formwork
Figure A-25. Concrete Used to Pour the Integral End Bent

157
Figure A-26. Mechanical Vibration Device Used to Vibrate Concrete
A.5 Parapet and Guardrail
Once the construction of the integral end bents was completed, back fill was placed. Soil
was delivered and compacted according to plan specifications. The construction of the
parapet walls was then started. The epoxy coated reinforcement for each wall was added
during the fabrication process of the deck girders. The longitudinal rebars were first tied
and then the formwork was constructed. The contractor chose to use wooden formwork
instead of slip forms to save money. The formwork was constructed using plywood
nailed together. The drainage holes for the parapet were made using wooden box block
outs (see Figure A-27). There were six total on the parapet.
Once the formwork was complete, then the concrete was ordered and placed. Once the
concrete was poured, inserts were placed into the concrete to provide a template for the
installation of the guardrail (see Figure A-28). Then the formwork was removed and the
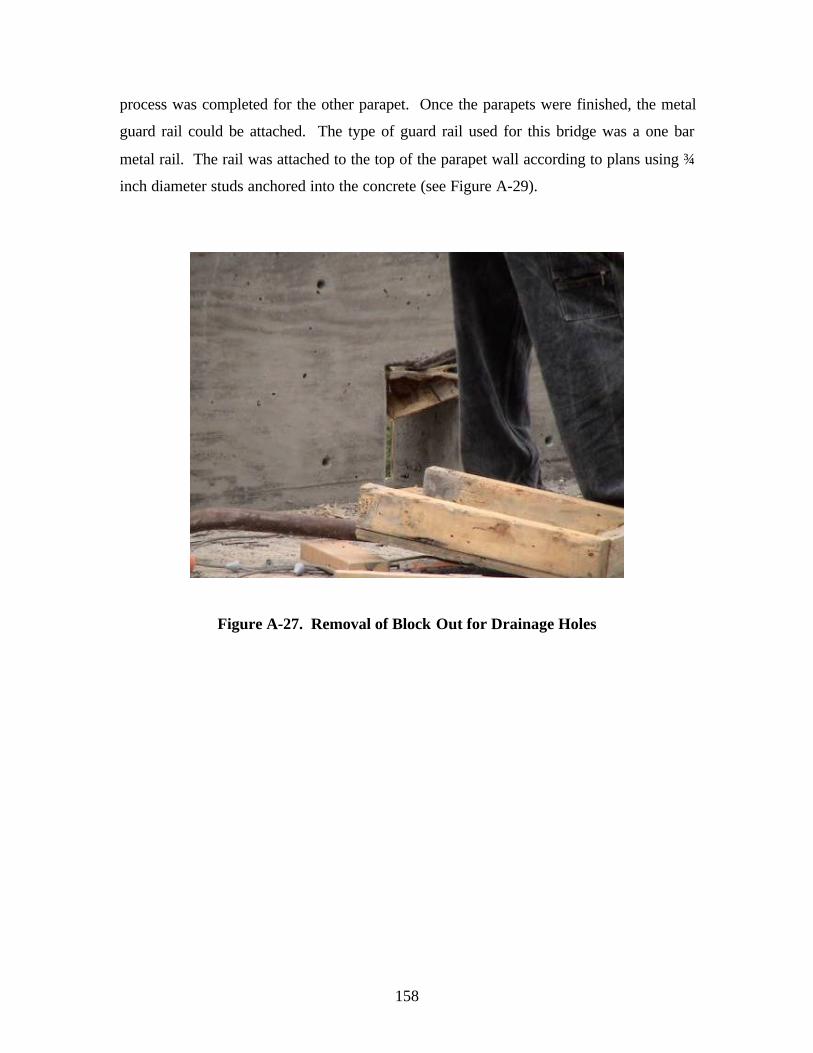
158
process was completed for the other parapet. Once the parapets were finished, the metal
guard rail could be attached. The type of guard rail used for this bridge was a one bar
metal rail. The rail was attached to the top of the parapet wall according to plans using ¾
inch diameter studs anchored into the concrete (see Figure A-29).
Figure A-27. Removal of Block Out for Drainage Holes

159
Figure A-28. Concrete Insert Placed Into the Parapet
Figure A-29. One-Bar Metal Railing

160
A.6 Approach Slab and Wearing Surface
The approach slab construction began during the construction of the parapets. The bridge
system required an approach slab at each end of the bridge. The construction of the
approach slab began by compaction of a 6 inch layer of ABC stone base. A geo-
membrane, shown in Figure A-30, was then installed on top of the base to provide an
impermeable surface and prevent any water from washing away the underlying soil. The
rebar for the slab was then tied. The approach slab required the rebar to be epoxy coated
to prevent corrosion (see Figure A-31). The rebar was supported on high chairs locating
the rebar at the correct height in the slab. The formwork was then constructed around the
outside edges of the rebar. The formwork consisted of 2x4s and plywood nailed together.
The concrete was then ordered and delivered to the site. Each slab was poured directly
from the truck and a mechanical vibration device was used to eliminate voids in the
concrete. Once the desired elevation was reached, a trowel was used to smooth the
concrete. The surface was then given a raked finish (see Figure A-32).
Figure A-30. Geo-Membrane Installed Underneath Approach Slab

161
Figure A-31. Epoxy Coated Rebar for Approach Slab
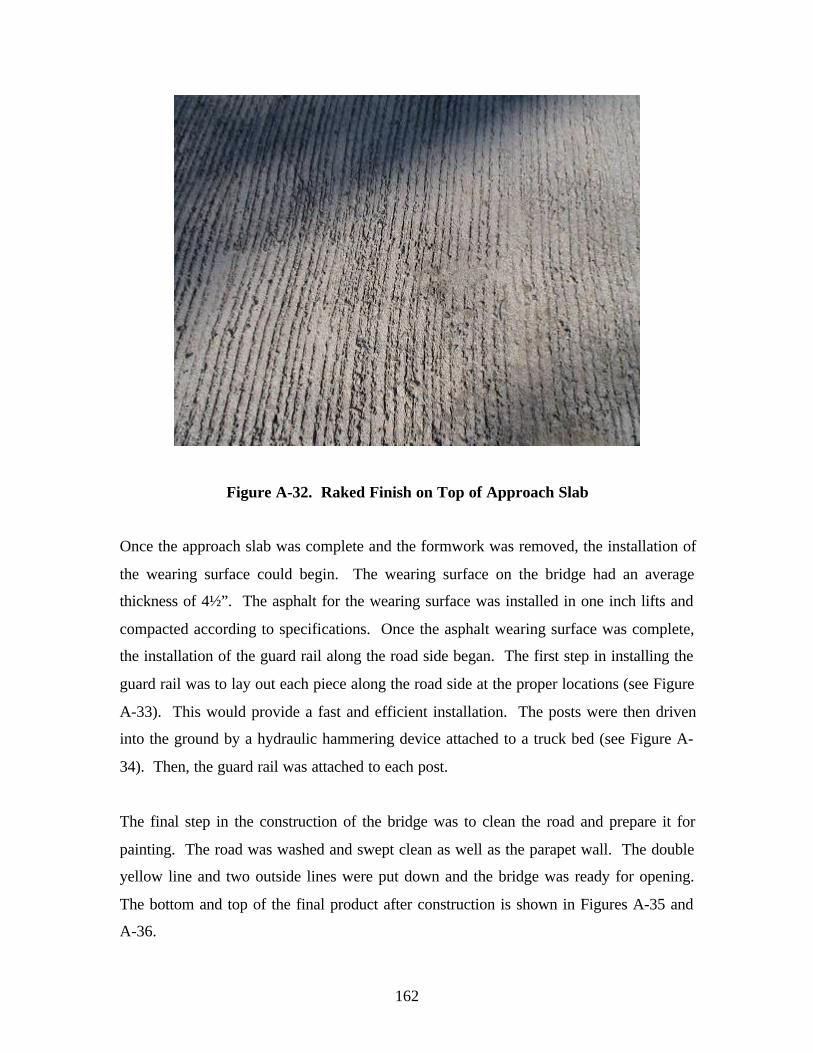
162
Figure A-32. Raked Finish on Top of Approach Slab
Once the approach slab was complete and the formwork was removed, the installation of
the wearing surface could begin. The wearing surface on the bridge had an average
thickness of 4½”. The asphalt for the wearing surface was installed in one inch lifts and
compacted according to specifications. Once the asphalt wearing surface was complete,
the installation of the guard rail along the road side began. The first step in installing the
guard rail was to lay out each piece along the road side at the proper locations (see Figure
A-33). This would provide a fast and efficient installation. The posts were then driven
into the ground by a hydraulic hammering device attached to a truck bed (see Figure A-
34). Then, the guard rail was attached to each post.
The final step in the construction of the bridge was to clean the road and prepare it for
painting. The road was washed and swept clean as well as the parapet wall. The double
yellow line and two outside lines were put down and the bridge was ready for opening.
The bottom and top of the final product after construction is shown in Figures A-35 and
A-36.
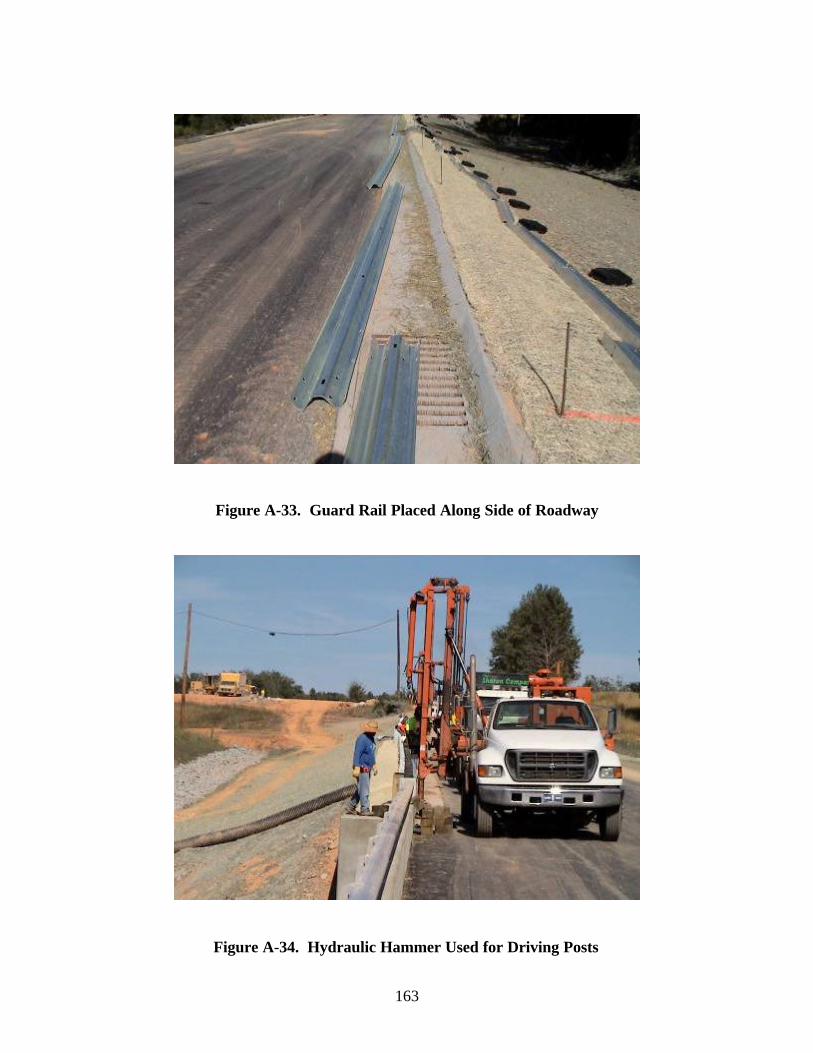
163
Figure A-33. Guard Rail Placed Along Side of Roadway
Figure A-34. Hydraulic Hammer Used for Driving Posts

164
Figure A-35. Underside of Deck Girder Bridge
Figure A-36. Deck Girder Bridge on Austin Rd. in Stanly Co., NC

165
B- Connection Test Details
B.1 Concrete Specimen Log
Table B-1. 7-Day Concrete Ultimate Strength
7 - Day Strength Test #1 Test #2 Test #3
Load (lb) 94668 94062 92398
Pressure (psi) 7537 7489 7356
Table B-2. 28-Day Concrete Ultimate Strength
28 - Day Strength Test #1 Test #2 Test #3Load (lb) 119200 119110 122460
Pressure (psi) 9486 9478.4 9745
Table B-3. Concrete Specimen Tensile Properties
Tensile Strength Test #1 Test #2 Test #3Load (lb) 31653 30900 27583
Broken Aggregate 24 18 18UnbrokenAggregate
5 7 7
Table B-4. Concrete Properties at Pour
Slump 4"Air
Content3.90%
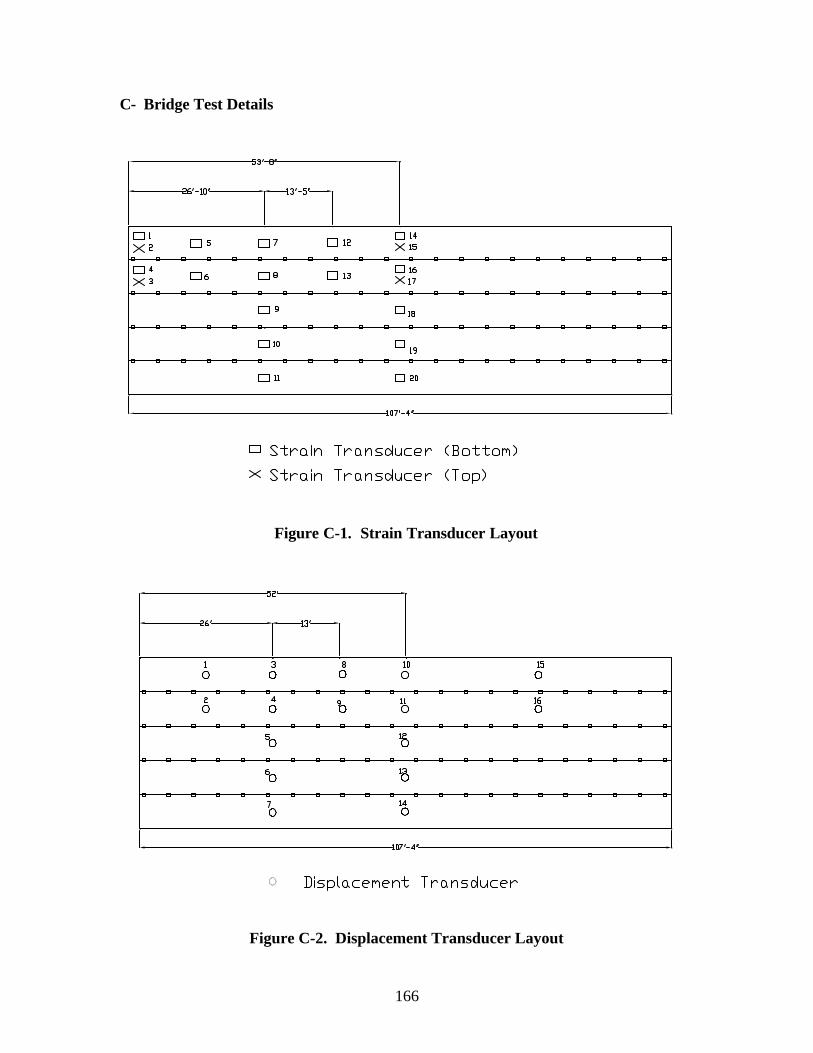
166
C- Bridge Test Details
Figure C-1. Strain Transducer Layout
Figure C-2. Displacement Transducer Layout

167
Figure C-3. Plate Connection Strain Gage Layout
Figure C-4. Diaphragm Strain Gage Layout

168
D- ANSYS™ Batch Input File
/TITLE, Deck Girder Bridge Stanly County, NC!/PREP7!ANTYPE,STATIC,NEW!ET,1,SOLID65 ! 3-D Reinforced Concrete SolidKEYOPT,1,1,0KEYOPT,1,5,1KEYOPT,1,6,3KEYOPT,1,7,1!ET,2,LINK8 ! Prestress Cable!ET,3,SOLID45 ! Steel Plate!ET,4,BEAM4 ! Steel DiaphragmsKEYOPT,4,6,1KEYOPT,4,9,3!! ! Girder and Deck High-Strength Concrete PropertiesMPTEMP,1,0MPDATA,EX,1,,6620862.588MPDATA,PRXY,1,,.2MP,DENS,1,.0868055TB,MISO,1,1,6,TBTEMP,0TBPT,,.0005982,3960.6TBPT,,.00126,7585.305TBPT,,.00192,10321.261TBPT,,.00259,12063.723TBPT,,.00326,12942.623TBPT,,.00399,13202TB,CONC,1,1,9,TBTEMP,0TBDATA,,.25,.25,-1,-1,,! ! Prestress Cable Material PropertiesMPTEMP,1,0MPDATA,EX,2,,29000000MPDATA,PRXY,2,,.3TB,BISO,2,1,2,TBTEMP,0TBDATA,,270000,,,,,

169
! ! Steel Reinforcement Material PropertiesMPTEMP,1,0MPDATA,EX,3,,29000000MPDATA,PRXY,3,,.3TB,BISO,3,1,2,TBTEMP,0TBDATA,,60000,,,,,! ! Steel Plate and Diaphragm Material PropertiesMPTEMP,1,0MPDATA,EX,4,,29000000MPDATA,PRXY,4,,.3TB,BISO,4,1,2,TBTEMP,0TBDATA,,36000,,,,,!R,1,3,.025,,90,2,.025, ! Real Constant Non-Reinforced Concrete!R,2,3,.03,,90,2,.031 ! Real Constant Integral Deck Concrete Top!R,3,.3307,.00715 ! Real Constant Prestress Strand!R,4,.1653,.00715 ! Real Constant Prestress Strand!R,5 ! Real Plates!R,6,6.3,7.15,243,18,.225 ! Real Constant End Diaphragms!R,7,12.6,14.3,554,18,.45 ! Real Constant Middle Diaphragms!!K,1,0,0,0, ! Center-line Key PointsK,2,-3.5,0,0K,3,-6.5,0,0K,4,-9.5,0,0K,5,-11,0,0KSEL,ALLKGEN,2,ALL,,,,1.875KSEL,S,KP,,6,10,1KGEN,2,ALL,,,,3KSEL,S,KP,,11,15,1KGEN,2,ALL,,,,3KSEL,S,KP,,16,20,1KGEN,2,ALL,,,,2.875K,26,0,19.85,0K,27,0,23.75,0K,28,0,27.65,0

170
K,29,0,35.75,0KSEL,S,KP,,26,29,1KGEN,2,ALL,,,-3.5K,34,-8,35.75,0K,35,0,47,0K,36,0,51.5,0K,37,0,55,0KSEL,S,KP,,35,37,1KGEN,2,ALL,,,-3.5KSEL,S,KP,,38,40,1KGEN,2,ALL,,,-4.5KSEL,S,KP,,41,43,1KGEN,2,ALL,,,-6KSEL,S,KP,,44,46,1KGEN,2,ALL,,,-6KSEL,S,KP,,47,49,1KGEN,2,ALL,,,-6KSEL,S,KP,,50,52,1KGEN,2,ALL,,,-6KSEL,S,KP,,53,55,1KGEN,2,ALL,,,-3.25KSEL,S,KP,,56,57,1KGEN,2,ALL,,,-2.25KSEL,S,KP,,59,60,1KGEN,2,ALL,,,-1.25!KSEL,ALL!A,2,1,6,7A,3,2,7,8A,4,3,8,9A,5,4,9,10A,7,6,11,12A,8,7,12,13A,9,8,13,14A,10,9,14,15A,12,11,16,17A,13,12,17,18A,14,13,18,19A,15,14,19,20A,17,16,21,22A,18,17,22,23A,19,18,23,24A,20,19,24,25A,22,21,26,30A,30,26,27,31

171
A,31,27,28,32A,32,28,29,33A,33,29,35,38A,34,33,38,41A,38,35,36,39A,41,38,39,42A,39,36,37,40A,42,39,40,43A,44,41,42,45A,45,42,43,46A,47,44,45,48A,48,45,46,49A,50,47,48,51A,51,48,49,52A,53,50,51,54A,54,51,52,55A,57,54,55,58A,59,56,57,60A,56,53,54,57A,61,59,60,62!!ASEL,ALL ! Girder Volume Creation and ExtrusionVEXT,ALL,,,,,3!ASEL,S,LOC,Z,3VEXT,ALL,,,,,4!ASEL,S,LOC,Z,7VEXT,ALL,,,,,14!VSEL,S,LOC,Z,14VGEN,4,ALL,,,,,14!VSEL,ALLVSEL,U,LOC,Z,1.5VGEN,11,ALL,,,,,60!VSEL,S,LOC,Z,656VSEL,A,LOC,Z,642VSEL,A,LOC,Z,628VDELE,ALL,,,1!ASEL,S,LOC,Z,621VEXT,ALL,,,,,8!

172
ASEL,S,LOC,Z,629VEXT,ALL,,,,,7!!VSEL,S,LOC,Y,53 ! Top of Deck ReinforcementVATT,1,2,1,!VSEL,ALL ! Middle of Deck no ReinforcementVSEL,U,REAL,,2,VATT,1,1,1!!LSEL,S,LOC,X,-3.5, ! Prestress Strand Real Constant AssignmentLSEL,R,LOC,Y,1.875,LATT,2,3,2,!LSEL,S,LOC,X,-6.5,LSEL,R,LOC,Y,1.875,LATT,2,3,2,!LSEL,S,LOC,X,-9.5,LSEL,R,LOC,Y,1.875,LATT,2,3,2,!LSEL,S,LOC,X,-3.5,LSEL,R,LOC,Y,4.875,LATT,2,3,2,!LSEL,S,LOC,X,-6.5,LSEL,R,LOC,Y,4.875,LATT,2,3,2,!LSEL,S,LOC,X,-9.5,LSEL,R,LOC,Y,4.875,LATT,2,3,2,!LSEL,S,LOC,X,-3.5,LSEL,R,LOC,Y,7.875,LATT,2,3,2,!LSEL,S,LOC,X,-6.5,LSEL,R,LOC,Y,7.875,LATT,2,3,2,!LSEL,S,LOC,X,-9.5,LSEL,R,LOC,Y,7.875,

173
LATT,2,3,2,!LSEL,S,LOC,X,0,LSEL,R,LOC,Y,1.875,LATT,2,4,2,!LSEL,S,LOC,X,0,LSEL,R,LOC,Y,4.875,LATT,2,4,2,!LSEL,S,LOC,X,0,LSEL,R,LOC,Y,7.875,LATT,2,4,2,!!VSEL,ALL ! Symmetry to Create One-GirderVSYMM,X,ALLASEL,S,AREA,,9404VEXT,ALL,,,,.5!ASEL,S,AREA,,18190VEXT,ALL,,,.5!ASEL,S,AREA,,18192VEXT,ALL,,,1.25!VSEL,S,VOLU,,4181,4183,1 ! Plate GenerationVATT,4,5,3!VSEL,S,REAL,,5VGEN,11,ALL,,,,,60!VSEL,S,REAL,,5VGEN,4,ALL,,,78!!VSEL,ALLVSEL,U,REAL,,5VGEN,5,ALL,,,78!!VSEL,ALLLSEL,ALL!!L,8957,15609 ! Lines for Diaphragm Elements

174
L,21561,27513L,33465,39417L,45369,51321L,11809,18461L,24413,30365L,36317,42269L,48221,54173!!LSEL,S,LINE,,130372 ! Real Constant and Element Type for DiaphragmsassignedLSEL,A,LINE,,130371LSEL,A,LINE,,130370LSEL,A,LINE,,130369LATT,4,7,4!!LSEL,S,LINE,,130373LSEL,A,LINE,,130374LSEL,A,LINE,,130375LSEL,A,LINE,,130376LATT,4,6,4!LSEL,ALLASEL,ALLVSEL,ALLKSEL,ALLNUMMRG,ALL,,,,LOW ! Re-number and Compress all EntitiesNUMCMP,ALL!LESIZE,ALL,,,1,1,1,OFF,, ! Mesh all Volumes as One ElementVSEL,ALLMSHAPE,0,3DMSHKEY,1VMESH,ALL!LSEL,ALL!LSEL,S,REAL,,3,4,1 ! Mesh Lines that Represent Diaphragms and Prestress StrandsLSEL,A,REAL,,6,7,1LMESH,ALL,LSEL,ALL,!!ASEL,S,LOC,Z,1.5 ! Fix Areas Inside Integral End-BentASEL,A,LOC,Z,5

175
ASEL,A,LOC,Z,14ASEL,A,LOC,Z,0DA,ALL,UX,0DA,ALL,UY,0DA,ALL,ROTZ,0DA,ALL,ROTY,0DA,ALL,ROTX,0NSEL,ALL!!LSEL,ALL ! Reflect Entire Model about Mid-Span in the Longitudinal DirectionASEL,ALLASEL,S,LOC,Z,636DA,ALL,SYMMASEL,ALL!!ALLSEL,ALL,ALL!!ACEL,,1!LSWRITE,1 ! DEAD + PRESTRESS STRENGTH 1!! ! TRUCK PATH 4!ASEL,ALLNSEL,ALLNSEL,S,NODE,,10215NSEL,A,NODE,,6153F,ALL,FY,-8050!ASEL,ALLNSEL,ALLNSEL,S,NODE,,5703NSEL,A,NODE,,9665F,ALL,FY,-8050!!ASEL,ALLNSEL,ALLNSEL,S,NODE,,9053NSEL,A,NODE,,5203F,ALL,FY,-8050!!

176
!ASEL,ALLNSEL,ALLESEL,ALLALLSEL,ALL,ALLSFTRANSBCTRANLSWRITE,2!! ! TRUCK PATH 2!ASEL,ALLNSEL,ALLNSEL,S,NODE,,10215NSEL,A,NODE,,6153NSEL,A,NODE,,9665NSEL,A,NODE,,5703NSEL,A,NODE,,9053NSEL,A,NODE,,5203FDELE,ALL,ALL!!!ASEL,ALLNSEL,ALLNSEL,S,NODE,,19187NSEL,A,NODE,,16415F,ALL,FY,-8050!ASEL,ALLNSEL,ALLNSEL,S,NODE,,15865NSEL,A,NODE,,18745F,ALL,FY,-8050!!ASEL,ALLNSEL,ALLNSEL,S,NODE,,15253NSEL,A,NODE,,18253F,ALL,FY,-8050!!ASEL,ALLNSEL,ALLESEL,ALL

177
ALLSEL,ALL,ALLSFTRANSBCTRANLSWRITE,3!! ! TRUCK PATH 1!ASEL,ALLNSEL,ALLNSEL,S,NODE,,19187NSEL,A,NODE,,16415NSEL,A,NODE,,15865NSEL,A,NODE,,18745NSEL,A,NODE,,15253NSEL,A,NODE,,18253FDELE,ALL,ALL!ASEL,ALLNSEL,ALLNSEL,S,NODE,,10229NSEL,A,NODE,,12996F,ALL,FY,-8050!ASEL,ALLNSEL,ALLNSEL,S,NODE,,9679NSEL,A,NODE,,12554F,ALL,FY,-8050!!ASEL,ALLNSEL,ALLNSEL,S,NODE,,9067NSEL,A,NODE,,12062F,ALL,FY,-8050!!ASEL,ALLNSEL,ALLESEL,ALLALLSEL,ALL,ALLSFTRANSBCTRANLSWRITE,4!!

178
ASEL,ALLNSEL,ALLESEL,ALLALLSEL,ALL,ALL!SFTRANSBCTRAN!FINISH!SAVE!/SOLULSSOLVE,1,4,1ANTYPE,STATICOUTPR,ALL,8OUTRES,ALL,8!AUTOTS,ONNSUBST,50,SOLCONTROL,1.0,INCPNCNV,0SOLVE!FINISH