evaluation of distributed electric energy storage and ... (titled “evaluation of distributed...
TRANSCRIPT
Evaluation of Distributed ElectricEnergy Storage and Generation
Final Project Report
Power Systems Engineering Research Center
A National Science FoundationIndustry/University Cooperative Research Center
since 1996
PSERC
Power Systems Engineering Research Center
Evaluation of Distributed Electric Energy Storage and Generation
Final Project Report
Project Team
Ward Jewell, Project Leader Phanikrishna Gomatom
Lokendra Bam Rudra Kharel
Wichita State University
PSERC Publication 04-25
July 2004

Information about this project For information about this project contact: Ward Jewell, Ph.D. Wichita State University Department of Electrical and Computer Engineering Wichita, Kansas 67220-0044 Tel: 316-978-6340 Fax: 316-978-5408 Email: [email protected] Power Systems Engineering Research Center This is a project report from the Power Systems Engineering Research Center (PSERC). PSERC is a multi-university Center conducting research on challenges facing a restructuring electric power industry and educating the next generation of power engineers. More information about PSERC can be found at the Center’s website: http://www.pserc.wisc.edu. For additional information, contact: Power Systems Engineering Research Center Cornell University 428 Phillips Hall Ithaca, New York 14853 Phone: 607-255-5601 Fax: 607-255-8871 Notice Concerning Copyright Material PSERC members are given permission to copy without fee all or part of this publication for internal use if appropriate attribution is given to this document as the source material. This report is available for downloading from the PSERC website.
© 2004 Wichita State University. All rights reserved.

Acknowledgements
The work described in this report was sponsored by the Power Systems Engineering Research Center (PSERC). We express our appreciation for the support provided by PSERC’s industrial members and by the National Science Foundation under grant NSF EEC-0114370 (titled “Evaluation of Distributed Electric Energy Storage and Generation.”), received under the EPSCoR program, and the Industry / University Cooperative Research Center program. This is the final project report.
We wish to thank Tennessee Valley Authority, in particular Dale Bradshaw, Mike Ingram, and. James Cowart, for their assistance in this project.
i
Executive Summary This report summarizes the present state of distributed energy resources (DER), including distributed generation (DG) and distributed energy storage (DES). It identifies issues that should be considered by a distribution utility in connecting DER to the grid today and in planning for the future. The report consists of a literature search, a list of available test and operating data, and a summary of manufacturers’ data for available DER equipment.
The manufacturers’ data is presented in a Microsoft Access database. There are approximately 580 entries in the database. They include manufacturers, developers, and vendors of DER technologies, including generation and storage. The data is searchable by category, company name, and product. Contact information for each company is presented. The database is available to any interested party by contacting the investigators.
Also included in the report is our economic evaluation framework. In addition, we provide an analysis of the effects of variations in natural gas quality on the operation of some DG units.
This project addresses only interconnection of commercial DER with conventional distribution systems. Not addressed in the project are new distribution system designs and operating methods, such as microgrids, and DER in the form of renewable resources.
The DG technologies generally considered to be commercial technologies by electric utilities and their customers are microturbines, small gas turbines, internal combustion engine/generator sets, and combine heating and power, or cogeneration. These technologies have sufficient test data and operating experience for predictable and successful use. Fuel cells are still in the research and development phase; their installations today should be considered experimental.
Reliable and well-understood commercial low-energy DES units, mostly for power quality enhancement, are available in battery, flywheel, superconducting magnetic energy storage, and written pole motor/generator technologies. Electrochemical capacitors and advanced battery technologies may be available in the future. Pumped hydro and compressed air energy storage are available as high-energy storage units, although use of both is constrained by limited site availability. In the future, flow batteries and advanced battery technologies may be available.
DES costs are still high, but energy stored on the distribution system, whether it is generated by DG or central-station units, has high value to utilities. When the cost of DES is reduced sufficiently, its use will increase dramatically, probably beyond any levels that DG will ever experience.
A number of techniques have been proposed for evaluating the effects of DER on a utility system. None, however, have been accepted as standard. Commercial distribution analysis software packages have only recently begun to include DER. More research is needed to refine analysis techniques.
There are a number of significant issues regarding DER that have not been sufficiently addressed. These issues, outlined in the conclusions to this report, are very important for utilities, and must be addressed before widespread use of DER will be feasible, and
ii

before the economic risk for most investors will be acceptable. Answers to these questions will determine whether DER becomes widely used.
DER is being connected to distribution systems throughout the U.S. and the world. This is occurring even though there are deployment questions that make the eventual DER penetration levels uncertain. In fact, some of the initial enthusiasm for DER may have faded over the past few years due in part to those unanswered questions. Even so, utilities should plan for DER technologies, evaluating their potential system benefits both technically and economically.
iii

Table of Contents
1. Introduction................................................................................................................. 1 2. Review of Literature ................................................................................................... 1
2.1 DER Summaries...................................................................................................... 1 2.2 Distribution Planning with DER............................................................................. 2 2.3 Operations and Optimal DER Capacity.................................................................. 2 2.4 System Protection ................................................................................................... 3 2.5 Power Quality and Reliability................................................................................. 3 2.6 Distributed Energy Storage..................................................................................... 3 2.7 Standby Generation Interconnection....................................................................... 5 2.8 Transmission Issues ................................................................................................ 5
3. Test and Operating Data ............................................................................................. 5 3.1 EPRI-PEAC Corporation ........................................................................................ 6 3.2 Future Energy Electronics Center........................................................................... 6 3.3 National Electric Energy Testing Research and Applications
Center (NEETRAC)................................................................................................ 7 3.4 American Electric Power (AEP) Dolan Technology Center .................................. 7 3.5 University of California at Irvine............................................................................ 7 3.6 Sandia National Laboratories.................................................................................. 8 3.7 National Renewable Energy Laboratory (NREL)................................................... 8 3.8 Chugach Electric Association ................................................................................. 8 3.9 Oak Ridge National Laboratory.............................................................................. 9 3.10 Pacific Gas and Electric Technical and Ecological Services Distributed
Generation Test Facility.......................................................................................... 9 4. Survey of Manufacturers............................................................................................. 9 5. Economic Evaluation Framework for DES .............................................................. 10 6. Affects of Fuel Quality on Fuel Cells and Microturbines......................................... 10 7. Conclusions and Recommendations ......................................................................... 10 8. References................................................................................................................. 12
APPENDIX A: Feasibility Evaluation of Distributed Energy Generation and Storage for Cost and Reliability Using the ‘Worth-Factor’ Criterion ...............................17
APPENDIX B: Fuel Parameter and Quality Constraints for Fuel Cell DG Units.............23
APPENDIX C: Fuel Parameter and Quality Constraints for Microturbine DG Units ......27
iv
1. Introduction
Distributed energy resources (DER) include both distributed generation (DG) and distributed energy storage (DES) connected to the medium- or low-voltage distribution systems. DER may be owned by utility customers or by independent generation companies. Regulations vary by state, but some utilities are required to connect DER now, and more will be in the future [1]. Both DG and DES are now operating on distribution systems [2].
DER may also be owned by the utility. It has been suggested that DER can help utilities address various power system issues, including reliability, power quality, peak energy costs, emission controls, spinning reserves, and difficulty in siting central station generation. Before installing and operating DER, a utility must understand the reality of these issues, and the effects on their distribution system, and on overall power system operations and economics.
During the late 1990s and the early part of this decade electric power industry interest in DER increased significantly [3, 4]. Utilities are now being called on regularly to connect new DER units. An IEEE standard provides guidelines for interconnecting such units [5], but there are many other considerations as well. This report presents a summary of the present state of DER technologies and the issues a utility must consider in connecting DER today and in planning for the future. It addresses only interconnection of commercial DER with conventional distribution systems. New distribution system designs and operating methods, such as microgrids [6], are not addressed in this report.
DER in the form of renewable resources, particularly wind and solar generation, are also becoming more common, but are not addressed in this report. The intermittent nature of these resources presents unique issues that have been addressed in many publications over the years, but are not addressed in this report.
2. Review of Literature
Research has been underway on DER since at least the 1980s. A survey of peer-reviewed literature begins with some general papers that summarize issues of interconnected DER.
2.1 DER Summaries
DG in the form of backup or standby generation, usually driven by diesel internal combustion engines, is quite common on commercial and industrial customers’ systems. Such units almost exclusively operate only when the utility supply fails, thus improving overall reliability for the DG owner. Extending this concept, then, by operating DG units in parallel with the utility distribution system might similarly improve system reliability.
One DG summary [7] addresses the reliability issue, and includes discussions of distribution overcurrent protection, instantaneous reclosing, ferroresonance, insulation, and ground faults on systems with ungrounded transformers. The authors conclude that, as expected, installation of DG may significantly increase reliability for an individual customer because the DG can supply the owner when the utility service fails. Interconnected DG may, however, actually degrade reliability and power quality for other
1

customers on the feeder. For example, DG may decrease the reach of protective relays and reclosers on a feeder, causing high impedance faults to go undetected until they become larger faults, thus increasing system damage and outage times. Special engineering may thus be required for DER interconnection; most applications, however can be done successfully.
Another summary paper [8] addresses voltage regulation, losses, flicker, harmonic distortion, short circuit currents, grounding and transformers, and islanding on radial systems. The authors present a screening process for distribution planning with DER that will allow, based on system and DER characteristics, connection of some units with little study, some with moderate study, and require detailed studies of others.
Operation and security aspects of DER, including protection, optimal operation and planning through choice of DER type and location, security and stability issues, and control center issues, are addressed in [9]. A summary report on DER was published in 2002 by the International Energy Agency [10], and a review of regulations and standards in the US and EEC is contained in [11].
One conversion technology, the fuel cell, has received a significant amount of attention as a potential DG resource. Fuel cell limitations are discussed later in this report, in the testing and operations and survey sections. Two papers are recommended for a good summary of types of fuel cells, their performance, and fuel processing [12], and for obstacles to their widespread introduction [13].
The literature search for this report focuses on peer-reviewed journal articles, but also includes books and a few relevant conference publications that add information not addressed in the journals. There have been numerous books published on DER, but one in particular [14] is quite useful for the utility engineer facing DER installations. The book covers the types of DER available, and addresses many issues in how they interact and operate with an electric utility system.
2.2 Distribution Planning with DER Regardless of existing or expected levels of DER on their systems, utilities should be considering DER in their distribution and system planning activities. An optimal distribution planning methodology is presented in [15]. The methodology includes DG and its associated costs and benefits, while at the same time considering generation capacity expansion constraints and risk. A method has also been developed [16] to include reliability effects of DER in distribution system planning.
Another planning framework was developed [17] that includes electricity markets, utility finances, and power system effects. The results demonstrate significant effects on each area that must be considered by the utility in planning for DER. The framework is further developed into a strategic analysis technique [18] that includes a financial model of DG in a utility distribution system.
2.3 Operations and Optimal DER Capacity Utility operations change as DER penetrations increase. Optimal operating strategies for DG units (and specifically in this paper, microturbines) will affect the economic viability of the units [19]. This paper considers the important issue of rates charged to a DG owner
2
for standby power when the DG capacity is not enough to meet the customer’s load. To meet their fixed costs, utilities charge more for energy to customers who require only standby service than to those who buy all their electricity from the utility. Charges for standby power are compared with the cost of increased microturbine capacity to estimate an optimal DG size. This technique could be applied to DES as well.
Another paper [20] addresses operation of utility-owned DG. Optimal operation is discussed relative to DG operating cost, the value of energy generated by the DG unit, and the value of DG standby capacity. Again, this technique could also include DES.
2.4 System Protection As previously mentioned, DER changes feeder fault current levels. Traditional radial coordination techniques do not address the presence of energy sources on the distribution system. This issue is addressed in [21], which presents a technique for calculating protective relay settings in the presence of DER. Protection is also addressed in [22], along with power quality. This paper discusses coordination of overcurrent protection to limit voltage sags on feeders with DER.
2.5 Power Quality and Reliability Like coordination techniques, traditional control methods for load tap-changing transformers do not consider the presence of energy sources on a radial feeder. A new control method to provide voltage regulation for feeders with DER is proposed in [23].
Power quality is addressed in several other papers as well. Voltage harmonics may increase with DER penetrations. Allowable DER penetrations are estimated in [24] based on voltage harmonic limits.
According to [25], properly installed and maintained DG should improve reliability for the DG owner, a conclusion previously discussed [7]. Such an improvement in one customer’s reliability, however, will have an insignificant effect on the utility’s reliability indices. Indices may, in fact, degrade because the fuse-saving instantaneous recloser operation cannot be used when DER is present on a feeder. If islanding or DG-supported alternate feeds are allowed, however, outage duration indices can improve. Improved reliability through islanding is also addressed in [26], with an optimal switch placement methodology for determining the islands.
2.6 Distributed Energy Storage Energy storage in interconnected power systems has been studied for many years and the benefits are well-known and generally understood [27-43]. Much less has been done specifically on distributed energy storage, but most of the same benefits apply. In both cases, storage costs, limited siting opportunities (e.g., pumped hydro storage), and technology limitations have limited the use of storage.
Many of the benefits of energy storage are summarized in [27]. Many are further discussed in other references, also provided in the list below.
3
Load leveling: storage units are charged during light load periods, using low-cost energy from base-load plants, and discharged during high load times, when the energy value is higher [28-30].
Load following: storage units with power electronic interfaces, that is, superconducting magnetic energy storage (SMES), battery energy storage (BES), and flywheel energy storage, can follow load changes very rapidly, reducing the need for generating units to follow load [31].
System stability: power and frequency oscillations can be damped by rapidly varying the real and reactive output of storage units [32-38].
Automatic generation control, including storage in AGC systems, can aid in minimizing area control error.
Spinning reserve: because of their ability to rapidly increase output, storage units with power electronic interfaces can act as spinning reserve, reducing the need for conventional spinning reserve units [28, 33].
VAR control and power factor correction: power electronic interfaces provide the ability to rapidly vary reactive as well as real power.
Black start capability: stored energy can be used to start an isolated generating unit.
Bulk energy management: bulk power transfers can be delayed by storing the energy until it is needed, or until its value increases.
Reduced fuel use: use of less-efficient peaking units is reduced by charging storage with energy from more-efficient base load generating units. Because peaking units often burn natural gas, this also offers natural gas conservation benefits [32].
Environmental benefits: reduced fuel use results in reduced emissions and natural gas conservation [32].
Increased efficiency and reduced maintenance of generating units: load following by storage units allows generators to be operated at more constant and efficient set points, increasing their efficiency, maintenance intervals and useful life [32].
Deferral of new generating capacity: fewer peaking units are needed when storage reduces peak demand.
Deferral of new transmission capacity: properly located storage units can be charged during off-peak times, reducing peak loading of transmission lines and effectively increasing transmission capacity [32, 39, 40].
Increased availability of generating units: during peak periods, charged energy storage added to available generation increases total system capacity.
These characteristics of energy storage offer great potential in improving system reliability, security, and power quality from relatively small amounts of energy storage on the power system [28]. “Among the potential performance benefits produced by advanced energy storage applications are improved system reliability, dynamic stability, enhanced power quality, transmission capacity enhancement, and area protection. An energy storage device can also have a positive cost and environmental impact by reducing fuel consumption and emissions through reduced line losses and reduced generation availability for frequency stabilization [28].”
4
In 2001, “target costs for a basic energy storage system on a per kilowatt basis [were] less than the costs on a per kilowatt basis of the lowest cost generation units [28].” If storage is cheaper or the same cost as generation, then high penetrations are in order. Technology limitations hold storage back, however, and economics – how to profit financially from building energy storage – are similar to transmission construction. Existing markets and rate structures may not be favorable to energy storage.
DES shares the same benefits as central-station storage, with greatly increased siting potential. DES may have special benefits in distribution power quality, including voltage sag [41] and short-term outage [42] mitigation. In addition, the load-following capability of DES will reduce the needed installed capacity of an associated DG unit [43].
2.7 Standby Generation Interconnection As previously mentioned in this report, the most common type of DG now in service is standby power generation in the form of diesel motor/generator sets. Many MW are already installed in customer facilities. With proper control systems, these can be connected to run in parallel with the utility. A thorough summary of the issues involved in such a conversion, specifically for peak shaving and reducing peak energy costs or blackouts is presented in [44]. A companion paper [45] describes experiments in which backup generation is converted to interconnected DG. The authors conclude that this is a significant and viable resource for customers and utilities.
2.8 Transmission Issues DER devices connected to the distribution system may also affect the transmission grid. A general discussion of interactions between distribution DER and the transmission grid is presented in [46]. Grid stability is addressed in [47] with an analysis of the effect of increasing DER inertia. The authors conclude that increasing DER inertia tends to destabilize the transmission grid, possibly because of the high impedance separating the DER from the transmission system.
3. Test and Operating Data
Another part of understanding interconnected operation of DER comes from controlled experiments, and still another comes from actual DER operating experience. This section presents a list of publicly-available data and results. Sources of the information are provided.
An excellent listing of test facilities for distributed resources was published in 2002 [48]. All the facilities listed in that document were contacted for this report with a request for publicly-available data on commercial DER units. Discussions with those facilities produced additional leads, which were also contacted. The following is the list of the data located in the survey.
5

3.1 EPRI-PEAC Corporation Knoxville, Tennessee http://www.epri-peac.com/
EPRI PEAC appears to have tested more DER devices than anyone else, but the results are not available publicly. They are available only to the project sponsors. A list of the devices tested so far, however, is provided here.
DG: Capstone Model 330 microturbine generator Elliott Energy Systems TA-80 microturbine generator Ingersoll-Rand 70L microturbine generator 225 kW Caterpillar diesel generator set 255 kW Caterpillar natural gas generator set STM PowerUnit piston stirling engine Trace SW4048 inverter Sunnyboy 2500U inverter Encorp ATS 400 automatic transfer switch Several makes and models of multifunction interconnection protection relays Enable/DCH 3-kW PEM fuel cell Hpower EPAC-500 PEM fuel cell Avista SR-72 PEM fuel cell Dais-Analytic PEM fuel cell
DES: Metallic Power Backup Power Source ESMA, Elit, and NESS electrochemical capacitors Beacon Power 20C1000 Series Flywheel System Urenco PQ Flywheel Energy Storage System
3.2 Future Energy Electronics Center Virginia Polytechnic Institute and State University Blacksburg, Virginia http://www.feec.ece.vt.edu/
While Virginia Tech’s focus is on power electronics development, the Future Energy Electronics Center has tested one commercial fuel cell, and is preparing to test two more.
DG: Enable Fuel Cell (3-kW) Avista fuel cell (3-kW) (scheduled) Ballard fuel cell (1-kW) (scheduled)
6

3.3 National Electric Energy Testing Research and Applications Center (NEETRAC)
Forest Park, Georgia http://www.neetrac.gatech.edu/
NEETRAC has tested some DER devices, but the list of devices tested and the results are all proprietary, available only to sponsors.
3.4 American Electric Power (AEP) Dolan Technology Center Columbus, Ohio http://www.aeptechcentral.com/dolan.htm
The AEP Dolan Technology Center has tested several DER units. Selected results from the sodium sulfur battery test are available. Others are the property of test sponsors and are not publicly available.
DG: Gas powered-microturbines (3) - up to 70 kW Gas powered 1.6 MW synchronous generator Stirling engine, 1.2 kW. 50 Hz (demonstration only) Fuel cells (PEM) (demonstration only) DES: Sodium Sulfur storage battery, 500 kW/100kW Lithium-ion battery UPS, 100 kW (test underway) Capacitive Energy Storage
3.5 University of California at Irvine Irvine, California http://www.apep.uci.edu/
The Advanced Power and Energy Program at UC Irvine has tested microturbines and fuel cells. Some papers and reports on the results are available, along with general information and answers to specific questions.
DG Capstone C-60 natural-gas-fired microturbine generators (three units tested) Takuma TCP-30 microturbine generator Capstone C-60 with integrated heat exchanger (underway) Capstone Model 330 natural-gas-fired microturbine generator Plug Power Gensys5 fuel cell (scheduled)
7
3.6 Sandia National Laboratories Albuquerque, New Mexico http://www.sandia.gov/E&E/aep.html
Sandia has complete test results available for one microturbine generator.
DG: Capstone microturbine generators (one 30kW, one 60kW) (Report available at http://www.project-power.org/reference/reference.htm.)
Sandia has tested other DER units but no list is available and results are proprietary.
3.7 National Renewable Energy Laboratory (NREL) Golden, Colorado http://www.eere.energy.gov/distributedpower/research/testing.html
NREL operates two relatively new test facilities that are dedicated to DER:
Distributed Energy Resources Test Facility Golden, Colorado http://www.eere.energy.gov/distributedpower/research/nrel_dstributed.html Nevada Test Site Las Vegas, Nevada http://www.eere.energy.gov/distributedpower/research/nrel_dstributed.html
Test results are available for one unit, and results for three more tests now underway will be available in the future.
DG: Capstone 330 microturbine generator
3.8 Chugach Electric Association Anchorage, Alaska http://www.chugachelectric.com/
Chugach Electric Association is a Rural Electric Cooperative in Alaska with 527 MW of installed capacity. Chugach has several years of operating experience, for which detailed data is available, on fuel cells and microturbine generators. These devices are installed and operating in customer facilities on the Chugach system; Chugach operates and maintains the devices. The Chugach data appears to be unique in its detail and availability.
DG: Eight 200 kW fuel cells 28-kw natural gas-fired microturbine generator
8
3.9 Oak Ridge National Laboratory Oak Ridge, Tennessee http://www.ornl.gov/ORNL/Energy_Eff/distributedenergy.html
Oak Ridge National Laboratory operates the Cooling, Heating, and Power (CHP) Integration Laboratory and the Buildings Technology Center for the US Department of Energy, Energy Efficiency and Renewable Energy Program.
DG: 5 kW Plug Power Fuel Cell (demonstration unit; not commercial) Capstone microturbine generator
3.10 Pacific Gas and Electric Technical and Ecological Services Distributed Generation Test Facility
San Ramon, California http://www.pge.com/
Pacific Gas and Electric operates its Distributed Generation Test Facility in San Ramon, California. A number of tests have been run and are listed here, but availability of data is not known at the time this report was published.
DG: 70 kW molten carbonate fuel cell system Natural-gas-fired engine-driven generators DES: 250 kW modular energy storage system (AC battery) 2 MW x 10 second off-line UPS (PQ2000) Batteries: various manufacturers Superconducting Magnetic Energy Storage
4. Survey of Manufacturers
The literature survey and the test and operating data presented in this report are considered by the authors to be sound, verified information, that can be reliably used by anyone considering DER. The third part of the data surveyed for this report comes from manufacturers. The data provided by manufacturers was gathered from websites and publications provided by the manufacturers on request. Much of it appears to be marketing literature, and is difficult or impossible to independently verify.
The manufacturers’ data is presented in a database, assembled in Microsoft Access software. There are approximately 580 entries in the database. They include manufacturers, developers, and vendors of DER technologies, including generation and storage. The data is searchable by category, company name, and product. Contact information for each company is presented.
The database is available to any interested party by contacting the investigators.
9

5. Economic Evaluation Framework for DES
The future levels of DER penetration on utility distribution systems will depend on the economics of DER vs. central-station generating options. The economics are complex and depend on many factors such as those addressed in the literature review, and on many others not yet addressed. These factors are detailed, and a methodology for considering them is addressed in one publication, included in this report as Appendix A, that resulted from this project [49].
“The research presented in this paper shows that the economic evaluation of DG and distributed energy storage involves many subtle, seemingly insignificant but interdependent parameters that cannot be modeled using existing economic and reliability models. In order to evaluate the feasibility of implementation and ownership of these upcoming technologies as realistically as possible, extensive research and value-estimation tools need to be used. The worth-factor criterion presented in this paper provides an insight into some of the value-based aspects that influence implementation and ownership of DG and distributed energy storage from both the utility and consumer perspectives. Value-based planning and modeling of DG and distributed energy storage is easier and more practical using the worth-factor criterion. Feasibility evaluation of the economics and reliability of DG and distributed energy storage, and value-based planning, are possible using the worth-factor criterion if the relevant data is available.” [49].
6. Affects of Fuel Quality on Fuel Cells and Microturbines
An important consideration in the evaluation of fuel cell and microturbine generators is how changes in natural gas quality affect DG units operation. This issue is analyzed in detail in two papers that resulted from this project [50, 51]. These papers are given in Appendices C and D. The authors conclude that significant analysis and testing of DER units is needed in this area.
7. Conclusions and Recommendations
The future of DER depends first on the continued development of technologies, and their future availability at costs that make them economically feasible. Beyond this, institutional issues will have a significant effect on penetration levels of DER. These issues include rate structures and markets, and how they include both DG and DES. For example, standby energy costs for DG owners will greatly affect the feasibility of DG. Also, extremely important will be central-station generation siting, environmental, and public acceptance issues.
The DG technologies now generally considered by electric utilities and their customers are:
Internal combustion engine/generator sets Combined Heating and Power/Cogeneration Microturbines and small gas turbines
10
Fuel cells
Of these, all but fuel cells can be considered commercially-available technologies, with sufficient test data and operating experience for predictable and successful use. Fuel cells are still in the research and development phase, and the technology is undergoing significant changes that will continue into the foreseeable future. There are still significant unknowns about their long-term operation, and insufficient available test data and operating experience. Fuel cell installations today should still be considered experimental.
DES technologies fall into two groups: low-energy, for power quality mitigation of voltage sags and short-term outages, and high-energy, for load leveling, spinning reserve, and other applications. Commercially-available low-energy devices, mostly uninterruptible power supply technologies, are:
Batteries Flywheels Superconducting magnetic energy storage (SMES) Written Pole Motor/Generators
Other low-energy devices that will probably be available in the future, but that cannot yet be considered commercial devices, are:
Electrochemical (super or ultra) capacitors Advanced battery technologies [52].
Two commercial high energy storage devices are now available:
pumped hydro compressed air energy storage
Both are limited by available sites. Battery storage is now only available for low-energy applications, but is approaching high energy levels, and are now large enough to contribute to system stability. The largest battery energy storage system is a 46 MW system of nickel-cadmium cells with storage of 18.4 MWh at Golden Valley Electric Association in Alaska [52].
Other technologies that may be available in the future, but that are in research and development phases, are
Flow batteries Advanced battery technologies.
The cost of DES is still high, but energy stored on the distribution system, whether it is generated by DG or central-station, has very high value. When the cost of DES is reduced sufficiently, its use will increase dramatically, probably beyond any levels that DG will ever see.
For utility engineers, a number of techniques, both engineering analyses and economic models, have been proposed for evaluating the effects of DER on the utility system. None of the techniques, however, have been accepted by the power engineering community as standard, and commercial distribution analysis software packages have only recently
11
begun to include DER. More research to further refine these techniques is needed before DER goes into widespread use.
There are a number of significant issues regarding DER that have not been sufficiently addressed. Some are very important for utilities as they consider DER on their systems.
How will DG emissions be considered in future environmental regulations? While DG emissions, like the generating capacity, are distributed throughout a service area, they will still be included in emissions regulations when DG reaches significant penetrations.
How do the performance, efficiency, emissions, and economics of DER units change as they age?
How much maintenance is required by DER units that are now proposed for residential and small commercial customers, and who will perform that maintenance?
How large a penetration of microturbine, small gas turbine, and fuel cell DG units can the existing natural gas production and distribution systems supply?
Will hydrogen be available for fuel cell use in significant quantities in the future? How will it be produced, stored, and distributed?
How reliable are DER units in long-term use? What are the power quality effects of DER in long-term use? Will DER owners be required to provide or pay for ancillary services? For a utility customer with DER, how much will the utility charge for standby
energy? How will government policies, including possible subsidies, affect the growth of
DER?
These questions must be addressed and answered before widespread use of DER will be feasible, and before the economic risk for most investors will be acceptable. Answers to these questions will be a significant factor in determining whether or not DER becomes widely used. But while the remaining questions make uncertain the eventual levels of penetration of DER, and while some of the initial enthusiasm for DER may have faded over the past few years, DER is being connected to distribution systems in all areas, and utilities must plan for it.
8. References
1. Distributed Generation Regulations, Resource Dynamics Corporation, 2004, http://www.distributed-generation.com/regulations.htm
2. Ward Jewell, “Availability of Test and Operation Data for Distributed Energy Resources.” Frontiers of Power Conference Proceedings, Oklahoma State University, October 2003, pp. I-1–I-6.
3. William Sweet, “Networking Assests”, IEEE Spectrum, vol. Jan. 2001. 4. Markus Bayegan, “A vision of the future grid”, IEEE Power Engineering Review, pp.
10-12, Dec. 2001. 5. IEEE Std. 1547, “IEEE standard for interconnecting distributed resources with
electric power systems” IEEE, July 2003.
12

6. Lasseter, R. H., “Microgrids,” IEEE Power Engineering Society 2002 Winter Meeting, vol.1, pp. 305–308. Jan. 2002.
7. R. C. Dugan and T. E. McDermott, “Distributed Generation”, IEEE Industry Applications Magazine, vol. 8, issue 2, pp. 19-25, March-April 2002.
8. Philip P. Barker and Robert W. de Mello, “Determining the impact of distributed generation on power systems: Part 1 – Radial distribution system”, IEEE Power Engineering Society Summer Meeting 2000, vol 3, pp. 1645-1656, July 2000.
9. N. Hadjsaid, J. F. Canard, and F. Dumas, “Dispersed generation impact on distribution networks”, IEEE Computer Applications in Power, vol. 12, n 2, pp. 22-28, April 1999.
10. International Energy Agency, “Distributed generation in liberalised electricity market,” OECD/IEA, 2002.
11. Dondi, P., Bayoumi, D., Haederli, C., Julian, D., And Suter, M., Network integration of distributed power generation, Journal of Power Sources, vol. 106, p. 1-9, 2002.
12. M. A. Laughton, “Fuel Cell”, Power Engineering Journal, vol. 9, no. 6, pp. 125-132, June 1995.
13. B. Crook, “Introduction to fuel cells and hydrogen technology”, Engineering Science and Education Journal, vol. 11, issue 6 pp. 205-216, Dec. 2002.
14. H. Lee Willis and Walter G. Scott, Distributed Power Generation Planning and Evaluation, Marcel Dekker, 2000.
15. R. C. Dugan, T. E. McDermott, and G. J. Ball “Planning for distributed generation”, IEEE Industry Applications Magazine, vol. 7, issue 2, pp. 80-88, March-April 2001.
16. A. A. Chowdhury, S. K. Agrawal,and D. O. Koval, “Reliability modelling of distributed generation in conventional distribution systems planning and analysis”, IEEE Transactions on Industry Applications, vol. 39, Issue 5 pp. 1493-1498, Sept. – Oct. 2003.
17. G. W. Ault, A. Cruden, and J. R. McDonald, “Specification and testing of a comprehensive strategic analysis framework for distributed generation”, IEEE Power Engineering Society Summer Meeting, vol. 3, pp. 1817-1822, July 2000.
18. G. W. Ault, J. R. McDonald, and G. M. Burt, “Strategic analysis framework for evaluating distributed generation and utility stragegies”, IEE Proceedings on Generation, Transmission and Distribution, vol. 150, issue 4, July 2003.
19. M. W. Davis, A. H. Gifford, and T. J. Krupa, “Microturbines – an economic and reliabilitiy evaluation for commercial, resedential, and remote load applications”, IEEE Trans. on Power Syst., vol. 14, issue 4, pp. 1556-1562, Nov. 1999.
20. In-Su Bae, Jin-O Kim, Jae-Chul Kim and C. Singh, “Optimal opeating strategy for distributed generation considering hourly Reliability worth”, IEEE Trans. on Power Syst., vol. 19, n 1, pp. 287-292, Feb. 2004.
21. S. K. Salman and I. M. Rida, “Investigating the impact of embedded generation on relay settings of utilities”, IEEE Transactions on Power Delivery, vol. 16, n 2, pp. 246-251, April, 2001.
22. J. C. Gomez and M. M. Morcos, “Coordinating overcurrent protection and voltage sag in distributed generation systems,” IEEE Power Engineering Review, pp. 16-19, Febr. 2002.
23. Joon-Ho Choi and Jae-Chul Kim, “Advance voltage regulation method of power distribution systems interconnected with dispersed storage and generation systems
13
(Revised), IEEE Transaction on Power Delivery, vol. 16, n 2, pp. 329-334, April 2001.
24. A. Bhowmik, A. Maitra, S. M. Halpin, and J. E. Schatz, “Determination of allowable penetration levels of distributed generation resources based on harmonic limit considerations”, IEEE Trans. on Power Delivery, vol. 18, issue 2, pp. 619-624, April 2003.
25. T. E. McDermott and R. C. Dugan, “PQ reliabiltiy and DG”, IEEE Industry Applications Magazine, vol. 9, issue 5, pp. 17-23, Sep.-Oct. 2003.
26. Yiming Mao, and K. N Miu, “Switch placement in system reliability for radial distribution systems with distributed generation”, IEEE Trans. On Power Syst., Vol. 18, Issue 4, pp. 1346-1352, Nov. 2003.
27. P. D. Baumann, “Energy conservation and environmental benefits that may be realized from superconducting magnetic energy storage,” IEEE Trans. Energy Conversion, vol. 7, June 1992.
28. J. T. Alt, M. D. Anderson, and R. G. Jungst, “Assessment of utility side cost savings from battery energy storage,” IEEE Trans. Power Syst., vol. 12, pp. 1112–1120, Aug. 1997.
29. Lo, C.H., Anderson, M.D., “Economic dispatch and optimal sizing of battery energy storage systems in utility load-leveling operations.” IEEE Transactions on Energy Conversion, Vol. 14 , No. 3, Sept. 1999, pp. 824-829.
30. K.H. Jung, H. Kim, and D. Rho, “Determination of the installation site and optimal capacity of the battery energy storage system for load leveling,” IEEE Trans. Energy Conversion, vol. 11, pp. 162–167, Mar. 1996.
31. Walker, L.N., and Graham, H.L., “Effects of Battery Storage Devices on Power Systems Dispatch,” IEEE Transactions on Power Apparatus and Systems, Vol. PAS-100, No. 1, pp. 375-383, January 1981.
32. Ribeiro, P.F.; Johnson, B.K.; Crow, M.L.; Arsoy, A.; Liu, Y.; “Energy storage systems for advanced power applications.” Proceedings of the IEEE, Vol. 89 , no. 12, Dec. 2001, pp. 1744 – 1756.
33. C. Rehtanz, “Systemic use of multifunctional SMES in electric power systems,” IEEE Trans. Power Syst., vol. 14, pp. 1422–1427, Nov. 1999.
34. Coles, L.R.; Chapel, S.W.; Iamucci, J.J.; “Valuation of modular generation, storage, and targeted demand-side management.” IEEE Transactions on Energy Conversion, Vol. 10, no. 1, March 1995, pp. 182–187.
35. J. D. Rogers, R. I. Schermer, B. L. Miller, and J. F. Hauer, “30-MJ superconducting magnetic energy storage system for electric utility transmission stabilization,” Proc. IEEE, vol. 71, pp. 1099–1109, Sept. 1983.
36. Y. Mitani, K. Tsuji, and Y. Murakami, “Application of superconducting magnet energy storage to improve power system dynamic performance,” IEEE Trans. Power Systems, vol. 3, pp. 1418–1425, Nov. 1988.
37. Feak, S.D., “Superconducting magnetic energy storage (SMES) utility application studies.” IEEE Transactions on Power Systems, Vol. 12, no. 3, Aug. 1997, pp. 1094 – 1102.
38. S. Banerjee, J. K. Chatterjee, and S. C. Tripathy, “Application of magnetic energy storage unit as load–frequency stabilizer,” IEEE Trans. Energy Conversion, vol. 5, pp. 46–51, Mar. 1990.
14
39. Kandil, M.S.; Farghal, S.A.; Hasanin, N.E.; “Economic assessment of energy storage options in generation expansion planning.” IEE Proceedings-Generation, Transmission and Distribution, Vol. 137, no. 4, July 1990, pp. 298 – 306.
40. Schoenung, S.M.; Burns, C.; “Utility energy storage applications studies.” IEEE Transactions on Energy Conversion, Vol. 11, no. 3, Sept. 1996, pp. 658 – 665.
41. R. S. Weissbach, G. G. Karady, and R. G. Farmer, “Dynamic voltage compensation on distribution feeders using flywheel energy storage,” IEEE Trans. Power Delivery, vol. 14, pp. 465–71, Apr. 1999.
42. M. Parizh, A. K. Kalafala, and R. Wilcox, “Superconducting magnetic energy storage for substation applications,” IEEE Trans. Appl. Superconduct., vol. 7, pp. 849–852, June 1997.
43. Willis, H.L.; “Energy storage opportunities related to distributed generation.”IEEE Power Engineering Society Summer Meeting, 2000. Vol. 3, pp. 1517-1518, July 2000.
44. J. M. Daley and R. L. Siciliano, “Application of energency and standby generation for distributed generation. I. Concept and hypthesis”, IEEE Transaction on Industry Applications, vol. 39, issue 4, pp. 1214-1225, July-Aug 2003.
45. J. M. Daley and R. L. Siciliano, “Application of energency and standby generation for distributed generation. II. Experimental evaluation”, IEEE Transaction on Industry Applications, vol. 39, issue 4, pp. 1226-1233, July-Aug 2003.
46. L. Dale, “Distributed generation and transmission”, IEEE Power Engineering Summer Meeting, vol. 1, 27-31, pp. 132-134, Jan. 2002.
47. R. T. Guttromson, “Modelling distributed energy resources dyanamics on the transmission system”, IEEE Trans. on Power Syst. , vol. 17, issue 4, pp. 1148-1153, Nov. 2002.
48. Review of Test Facilities for Distributed Energy Resources, Sandia National Laboratories, October 2002, SAND2003-1602, http://certs.lbl.gov/pdf/TestFacilitiesDER.pdf.
49. Phanikrishna Gomatom and Ward Jewell, “Feasibility Evaluation of Distributed Energy Generation and Storage for Cost and Reliability Using the ‘Worth-Factor’ Criterion,” Proceedings of the 35th Frontiers of Power Conference, Oklahoma State University, October 2002.
50. Phanikrishna Gomatom and Ward Jewell,” Fuel Parameter and Quality Constraints for Fuel Cell DG Units”, IEEE Power Engineering Society, T & D Conference, Dallas, September 2003.
51. Phanikrishna Gomatom and Ward Jewell, “Fuel Parameter and Quality Constraints for Microturbine DG Units”, Proceedings of the Power systems Conference: Distributed Generation and Advanced Metering, Clemson University, March 2003.
52. Electricity Storage Association, http://www.electricitystorage.org/tech/technologies_technologies.htm.
15

16
APPENDIX A: Feasibility Evaluation of Distributed Energy Generation and Storage
for Cost and Reliability Using the ‘Worth-Factor’ Criterion
Phanikrishna Gomatom Ward Jewell [email protected] [email protected]
Center for Energy Studies Wichita State University
ABSTRACT
The unprecedented growth in the electronic and semiconductor industries, process controlled industries like automobile, textile and paper, in addition to the growing domestic load over the past three decades has imposed severe operational, economic and maintenance constraints on the power utility companies. Service reliability and power quality are the key contributing factors imposing these constraints. Distributed technologies are a potential solution for the current problem but may not be the optimum solution when specific characteristics like the nature of load, desired level of performance, geographical location and the available energy resources at the time instance of operation are considered. This paper describes the feasibility of distributed resources in terms of the ‘worth-factor,’ a criterion that incorporates intangible benefits and translates them in terms of cost.
INTRODUCTION
DG (DG) has many benefits over central station power plants. Some of the principal benefits that are of interest to this paper are: [1,2]
1. Size and scale of operation Central station power plants require large areas
owing to their size and scale of operation thus making site selection and land procurement a challenging and expensive process. DG plants are easier to build and commission.
2. Overall efficiency per unit size DG technologies incorporate advanced design
technologies yielding improved process-cycle and overall efficiency. In addition, cutting-edge technologies in the areas of unit miniaturization, electrical insulation, heat conversion and computer/digital automation and control technologies have helped enhance the overall efficiency of the DG plants.
3. T&D , substation & feeder costs DG is located at the load-demand center or close to
the epicenter of the load, hence offering huge capital investment benefits for transmission lines, towers and
auxiliaries, transmission substations, distribution substations, service and distribution transformers and feeders.
4. Operating and maintenance costs The cost of operation and maintenance of the above
mentioned equipment is avoided due to the proportional amount of reduction in electrical usage of this equipment. The frequency of faults owing to over-loading, temperature rise and heterogeneity of load are reduced provided external factors like ambient-temperature variations, weather changes and man-made errors occurring at the same instance of load-demand cause minimal detrimental impact.
5. Electric and magnetic losses Transformers at different voltage levels from
generation through distribution have inherent copper and core losses, in addition to the load-related losses. Similarly transmission lines, circuit-breakers, switches, isolators, control equipment, distribution feeders and associated auxiliary equipment add to the electrical losses. These losses and their related effects like magnetic interference, corona discharge and insulator flashover are minimized in terms of the occurrences and recovery time.
6. Reliability and power quality DG with energy storage offers a high degree of
reliability and power quality against grid-supplied power owing to better design and controllability with minimal losses. The power utility may be able to operate with a lower installed capacity and spinning reserves even under peak-load conditions and even during load-demand with low diversity factor.
7. Expansion, modularity and environmental concerns
DG avoids expansion costs of transmission and distribution networks owing to proximity to the load and ease of installation. DG units can be built and operated in clusters or modules providing the benefit of standard configuration and ease of maintenance with better reliability. DG technologies are not without environmental concerns but low emissions are achievable with minimal control and monitoring equipment.
17
ECONOMIC ANALYSIS
Literature surveys have shown that the opinion about the economic benefits of distributed resources has varied considerably among industry, utility and potential DG consumers/owners.
Central Power generating stations
The size range of most central power generation
plants varies from 100-800 MW. With an overall plant efficiency of 35-40%, a thermal efficiency of 32-35%, and average nominal heat-rate of 3500 kcal/kWh, the generation cost is estimated at $450-$600 per kW. With annual operation and maintenance (O&M) costs of 20%, and a capacity factor of 5% the fixed costs for operation would be $205- $275 per MWh [3].
The transmission costs depend on cost per mile, topological conditions and the line termination cost associated with the substation at the other end. Costs range from $60,000/mile for a 46kV wooden pole sub-transmission line of 50 MVA capacity ($1.2 per kVA-mile) to over $1,000,000 per mile for a 500 kV double-circuit construction with 2000 MVA capacity ($.5/ kVA-mile) [4].
The substation costs depend on the type, capacity and local land costs. In rural areas, one a 69 kV substation with a 50 MVA transformer and a single incoming feeder could cost $90,000. If the substation serves a load of 4 MW, total substation cost would be $23/kW. The costs could go up to $33/kW in a suburban setting with two 40 MVA, 138/12.47 kV transformers fed by two incoming 138 kV feeders and four outgoing distribution feeders of 9 MVA capacity each.
The primary voltage feeder system and distribution costs vary from $10 to $15 per kW-mile for overhead to $30 to $100 per kW-mile for underground.
The service level costs depend on the pole-mounted service transformer cost and the number of households being fed by one service transformer. This cost is approximately $350 per customer household or $70 /kW of coincident load [5].
Distributed Technologies
The size range of distributed generators commercially available varies over a wide range depending on the type of the technology.
Microturbines: Non-recuperative and recuperative
microturbines capacities range from 25-200 kW. With an average overall efficiency of 60-70% the total cost including that of the prime mover, generator, inverter and ancillary equipment is $700-$1000 per kW for non-recuperative and $900-$1300 per kW for recuperative versions. The installation costs vary from $200-$600 per
kW. The cost per unit energy generated without cogeneration is estimated at 10-22 cents per kWh.
Fuel cells: Proton exchange membrane (PEM) fuel
cells vary in size from 5-14 kW, while phosphoric acid fuel cells can vary in range from 150-200 kW. At an operating overall efficiency of 36-40%, the overall cost varies from $4000-$5000 per kW for PEM and $3000-$4000 per kW for phosphoric acid fuel cells. The installation costs for fuel cells are about $400 per kW. The cost per unit energy generated without cogeneration is estimated at 18.5-30 cents per kWh.
Photovoltaic: The size range commercially available is from 5 kW to 5 MW. The total overall cost is estimated at $4500-$11000 per kW, though the exact value depends on the configuration and the geographic location. Installation costs vary from $200-$350 per kW. The cost per unit energy generated varies from 17-38.6 cents per kWh [6, 7].
Wind turbine generators: Wind generator costs are highly variable based on the design, speed-reduction and auxiliary equipment needed, owing to varying wind velocities from place to place and time to time. The size ranges are from 5 kW-1 MW. The overall system costs are estimated as $1200-$3900 per kW, while the installation costs vary from $400-$5000 per kW. The cost per unit energy generated varies from 6-30 cents per kWh.
The total overall cost of every DG technology discussed above includes cost of the prime mover, cost of the generator and inverter and costs of ancillary equipment. However, these costs can vary based on size, duty-cycle and fuel.
Installation costs mentioned above can vary with utility interconnection requirements, labor rates, ease of installation and site-specific factors.
The cost per unit energy generated is calculated based on an average annual load-factor of 50%. This includes the average cost of fuel, O&M expenses and amortized capital charges.
DEFINITION OF THE PROBLEM
Economic analysis of distributed resources in most cases is based on total fixed system cost, installation cost, O&M expenses and cost of auxiliary equipment needed for reliability, power quality and emission control. This is not always true because the cost of a distributed source can increase or decrease based on the value of the energy generated for a specific application at a specific instance of time. The value benefit or loss offered by a standalone or grid-connected distributed generator with or without energy storage, for the
18

application/process in question, cannot be modeled as a constant factor because the value factor is itself variable based on market prices, locally varying fuel prices, time instance of load-demand and available reliability of grid-supplied power.
CONCEPT OF WORTH-FACTOR
The worth-factor criterion is a simple and logical method to determine the cost-to-performance ratio. In order to apply the worth-factor criterion extensive research is needed on identifying the static and dynamic costs that are not tangible and have not been included in the economic analysis. This method enables interpretation of performance in terms of cost and explores the economic worthiness of a DG technology by qualitatively incorporating the intangible costs. Intangible costs are value-based expenditures based on the offered/desired performance level and the available resources at that particular point of time in the region or state under consideration. FEASIBILITY ANALYSIS USING THE WORTH-
FACTOR
The overall cost of a distributed generator unit with energy storage can change if one or more conditions exist at the time instance or during the operation of the unit. The following are some of the identified conditions that could possibly add or lower the overall cost of energy generated, based on the value of these conditions for cost-effective and qualitative operation of the application consuming the generated electric power.
Time Instance of Load Demand on the Hourly Load Duration Curve
Utility Perspective: DG is beneficial in peak-
shaving applications as utilities need not install additional capacity to supply peak-loads or utilize spinning-reserves during peak-load conditions. Figure 1 shows a typical load duration curve for a residential area. The load-demand curve for an individual household shows brief, high, needle peak-loads. Refer to Figure 2 for the load distribution of one household.
For coincident loads the total peak load is less than the sum of the individual peak loads. With DG the peak loads can be further reduced, resulting in cost savings to the utility. The worth-factor of DG for the utility is hence an incremental reduction in the overall cost of generated power, enabling the energy rate to stay competitive, in addition to the increase in the available hours of operation of the generating reserves and a higher degree of reliability because of a slight increase in the redundancy factor.
Figure 1. Hourly load duration curve for a residential area.
Figure 2.Load-duration curve for one household.
Consumer/Owner Perspective: There are two
important categories of consumers and owners of DG, which will be called “A” and “B.”
Category A: Consumers needing high reliability and
better quality of power supply, like manufacturing industries, process industries and the services industries, may be candidates for DG because the grid-supplied power under peak-load conditions is susceptible to momentary, instantaneous and/or temporary interruptions, and because of the potential risk of under-voltages, under-frequency events, and reactive power flows. In addition, the consumer may have to pay more for energy during peak-load hours, depending on the utility and the local rate structure. Hence the worth factor for this category of consumers is a combination of various factors and is appreciably higher.
Category B: Residential and some commercial
customers can use grid-supplied power even under peak-load conditions because their operating processes can tolerate the risk of slightly lower reliability and reasonable contaminations in power supply. Worth-factor of DG for this category is zero.
Limiting conditions: a. The consumer categories A and B do not need
DG resources (even under peak-load) if there is surplus grid power resources and industrial loads are well-
19
diversified, such as in states like Kansas, Missouri or Alabama.
b. The consumer category A needs DG and energy storage in spite of a excess grid resources because of a more erratic load demand pattern, such as in states like New York, Ohio, Illinois, Massachusetts or New Jersey.
c. The Consumer categories A and B both need DG and application-specific energy storage when the grid is impoverished and supplies a dense industrial load, such as in California, Washington and some parts of Arizona.
Markets and Deregulated Market conditions
The selection of a DG source is dependent on the wholesale and retail market structure in the region under consideration. A deregulated market adds to the complexity of decision-making about selection of DG with energy storage. Sustained demand and optimum supply volumes dictate the market prices at a given time. Under conditions when the wholesale and thus retail electricity prices are higher, DG offers a cost-effective alternative to consumers and owners. On the other hand, utilities suffer losses because if DG were not to be in place, economic gain margins would be higher.
This conclusion may not be justified in a deregulated market, because of the competitive pricing and the flexibility offered to the consumer in finding a utility allowing him to pay lesser per KWh than the overall cost per kWh from his own DG. Under such conditions, the economic value of DG can be assessed only from the market conditions, and the value is a dynamic variable, totally dependent on the market trends and indicators.
Desired Reliability
The degree of reliability desired by a consumer, as discussed earlier, is a dependent variable expressed as a function of the power supply requirement of the application/process [8]. Outages and interruptions are the main criteria for reliability evaluation. The frequency (how often occurring) and the duration (how long it lasts) both together or individually decide the extent of the outages’ or the interruptions’ impact on the application/process.
DG system design is particularly adaptive to reducing the frequency and duration of interruptions. Energy storage systems need to be selected and designed considering various factors like response time, fault-sensing and protection, rapid recovery and restoration and high reliability indices of the storage devices themselves.
Utility Perspective: Higher reliability requires more
generating capacity, more redundancy in transmission and distribution equipment, and hence higher costs. The
ability to incorporate higher reliability of power generated, transmitted and distributed depends mainly on one or more of the following prevalent conditions:
Type and size of connected-load: The nature of the
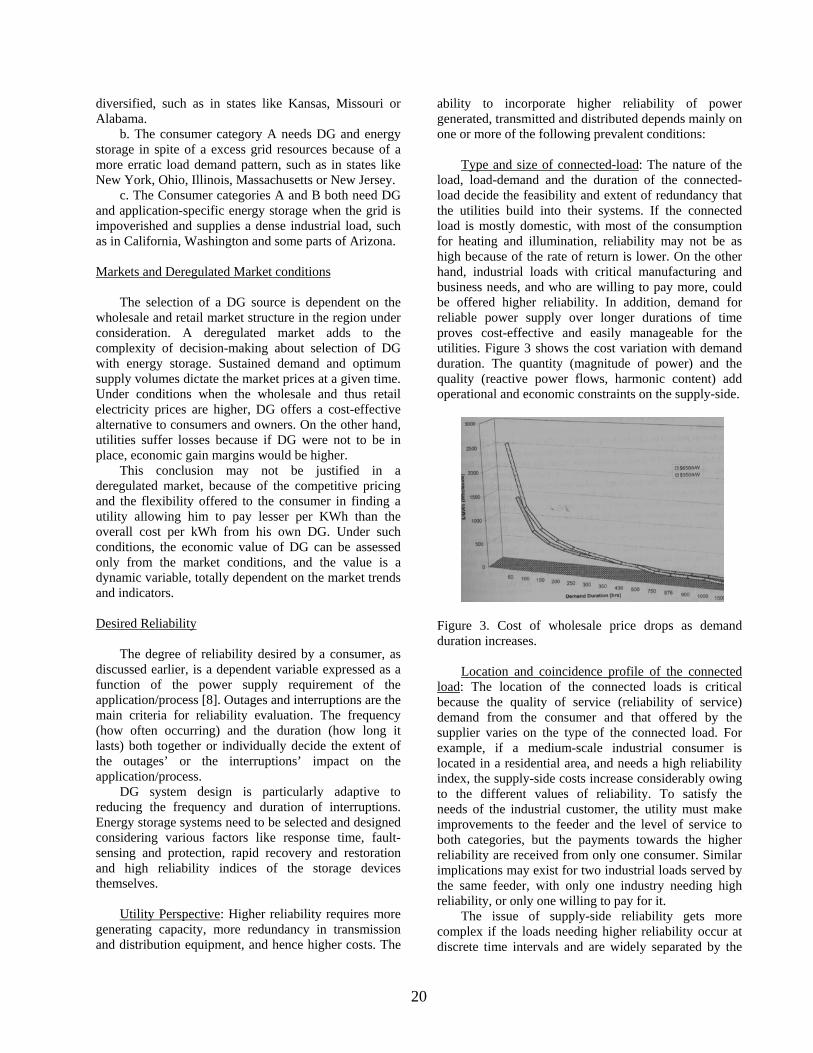
load, load-demand and the duration of the connected-load decide the feasibility and extent of redundancy that the utilities build into their systems. If the connected load is mostly domestic, with most of the consumption for heating and illumination, reliability may not be as high because of the rate of return is lower. On the other hand, industrial loads with critical manufacturing and business needs, and who are willing to pay more, could be offered higher reliability. In addition, demand for reliable power supply over longer durations of time proves cost-effective and easily manageable for the utilities. Figure 3 shows the cost variation with demand duration. The quantity (magnitude of power) and the quality (reactive power flows, harmonic content) add operational and economic constraints on the supply-side.
Figure 3. Cost of wholesale price drops as demand duration increases.
Location and coincidence profile of the connected
load: The location of the connected loads is critical because the quality of service (reliability of service) demand from the consumer and that offered by the supplier varies on the type of the connected load. For example, if a medium-scale industrial consumer is located in a residential area, and needs a high reliability index, the supply-side costs increase considerably owing to the different values of reliability. To satisfy the needs of the industrial customer, the utility must make improvements to the feeder and the level of service to both categories, but the payments towards the higher reliability are received from only one consumer. Similar implications may exist for two industrial loads served by the same feeder, with only one industry needing high reliability, or only one willing to pay for it.
The issue of supply-side reliability gets more complex if the loads needing higher reliability occur at discrete time intervals and are widely separated by the
20
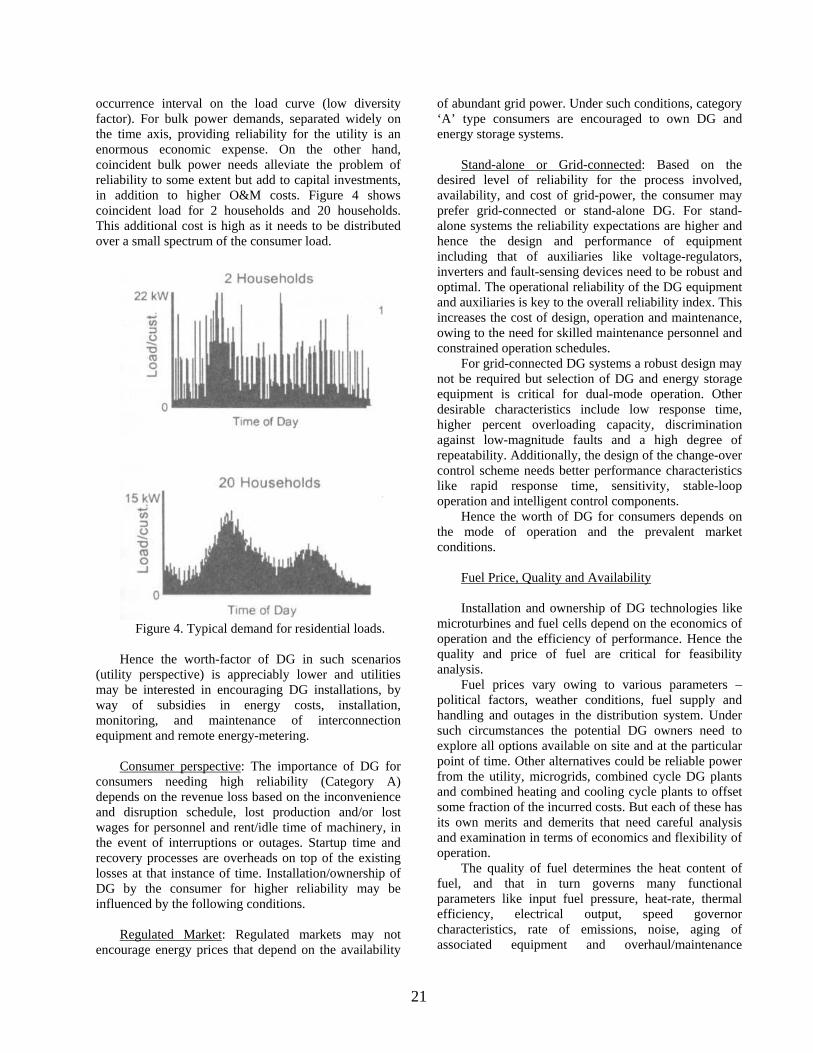
occurrence interval on the load curve (low diversity factor). For bulk power demands, separated widely on the time axis, providing reliability for the utility is an enormous economic expense. On the other hand, coincident bulk power needs alleviate the problem of reliability to some extent but add to capital investments, in addition to higher O&M costs. Figure 4 shows coincident load for 2 households and 20 households. This additional cost is high as it needs to be distributed over a small spectrum of the consumer load.
Figure 4. Typical demand for residential loads.
Hence the worth-factor of DG in such scenarios
(utility perspective) is appreciably lower and utilities may be interested in encouraging DG installations, by way of subsidies in energy costs, installation, monitoring, and maintenance of interconnection equipment and remote energy-metering.
Consumer perspective: The importance of DG for
consumers needing high reliability (Category A) depends on the revenue loss based on the inconvenience and disruption schedule, lost production and/or lost wages for personnel and rent/idle time of machinery, in the event of interruptions or outages. Startup time and recovery processes are overheads on top of the existing losses at that instance of time. Installation/ownership of DG by the consumer for higher reliability may be influenced by the following conditions.
Regulated Market: Regulated markets may not
encourage energy prices that depend on the availability
of abundant grid power. Under such conditions, category ‘A’ type consumers are encouraged to own DG and energy storage systems.
Stand-alone or Grid-connected: Based on the
desired level of reliability for the process involved, availability, and cost of grid-power, the consumer may prefer grid-connected or stand-alone DG. For stand-alone systems the reliability expectations are higher and hence the design and performance of equipment including that of auxiliaries like voltage-regulators, inverters and fault-sensing devices need to be robust and optimal. The operational reliability of the DG equipment and auxiliaries is key to the overall reliability index. This increases the cost of design, operation and maintenance, owing to the need for skilled maintenance personnel and constrained operation schedules.
For grid-connected DG systems a robust design may not be required but selection of DG and energy storage equipment is critical for dual-mode operation. Other desirable characteristics include low response time, higher percent overloading capacity, discrimination against low-magnitude faults and a high degree of repeatability. Additionally, the design of the change-over control scheme needs better performance characteristics like rapid response time, sensitivity, stable-loop operation and intelligent control components.
Hence the worth of DG for consumers depends on the mode of operation and the prevalent market conditions.
Fuel Price, Quality and Availability Installation and ownership of DG technologies like
microturbines and fuel cells depend on the economics of operation and the efficiency of performance. Hence the quality and price of fuel are critical for feasibility analysis.
Fuel prices vary owing to various parameters – political factors, weather conditions, fuel supply and handling and outages in the distribution system. Under such circumstances the potential DG owners need to explore all options available on site and at the particular point of time. Other alternatives could be reliable power from the utility, microgrids, combined cycle DG plants and combined heating and cooling cycle plants to offset some fraction of the incurred costs. But each of these has its own merits and demerits that need careful analysis and examination in terms of economics and flexibility of operation.
The quality of fuel determines the heat content of fuel, and that in turn governs many functional parameters like input fuel pressure, heat-rate, thermal efficiency, electrical output, speed governor characteristics, rate of emissions, noise, aging of associated equipment and overhaul/maintenance
21

requirements. With all the above parameters dependent on fuel quality the overall efficiency of a DG unit may not be the rated value and may vary from time to time, affecting economic calculations to an appreciable extent.
Thus to maintain a certain level of efficiency and thus a certain minimum cost of O&M, contractual agreements need to be made, so that the gas distribution and handling companies are made accountable to the quality of fuel they handle and supply. Tri-partite agreements between the DG owner, consumer and the fuel supply company, under the supervision and with the agreement of the appropriate governmental agencies, may be very useful.
Availability of fuel for 100% of the operation time is the primary requirement for any DG utilizing fossil fuels. Unlike domestic gas supplies for heating and cooking purposes, which can tolerate unavailability to some extent, DG requires uninterrupted fuel supply with the required flow rate and input pressure.
If microturbine and fuel cell generators using natural gas are installed at many locations or points within the gas distribution network, fuel supply requirements and input fuel pressure values may not be optimal, owing to the existing load on the gas distribution network. To alleviate this, existing capacities of the gas distribution lines may need upgrading, expanding the gas distribution network in all dimensions. The capacity upgrade of the existing fuel distribution network is very expensive and moreover dependent on local site factors.
The worth factor for the DG owner in this regard (fuel parameters) can be evaluated after extensive surveys and research on the long-term oil-pool prices nationally and internationally, on the existing gas supply network in the location of interest, the upgrade costs for the existing network, and the costs of procurement and maintenance associated with the auxiliary fuel handling, fuel regulating and fuel distribution equipment.
CONCLUSIONS
The research presented in this paper shows that the economic evaluation of DG and distributed energy storage involves many subtle, seemingly insignificant but interdependent parameters that cannot be modeled using existing economic and reliability models. In order to evaluate the feasibility of implementation and ownership of these upcoming technologies as realistically as possible, extensive research and value-estimation tools need to be used. The worth-factor criterion presented in this paper provides an insight into some of the value-based aspects that influence implementation and ownership of DG and distributed energy storage from both the utility and consumer perspectives. Value-based planning and modeling of DG and distributed energy storage is easier and more
practical using the worth-factor criterion. Feasibility evaluation of the economics and reliability of DG and distributed energy storage, and value-based planning, are possible using the worth-factor criterion if the relevant data is available.
REFERENCES
[1] Anne-Marie Borbely and Jan F Kreider, DG: The Power Paradigm for the New Millennium, CRC Press, 2001. pp.53-184 [2] Resources Dynamics Corporation, Assessment of DG Technology Applications, prepared for Maine Public Utilities Commission, Feb 2001, pp.5-12 [3] H Lee Willis, Walter G Scott, Distributed Power Generation, Planning and Evaluation, Marcel Dekker Inc, 2000, pp12-56 [4] Roger C Dugan and Thomas E McDermott, Planning for DG, IEEE Rural Electric Power Conference, March/April 2001
[5] EIA, Energy Review, published in monthly and annual editions by the Energy Information Administration, U.S. Department of Energy, Washington, D.C, 2000. [6] Dickinson, W.C. and Brown, K.C., Economic Analysis for Solar Industrial Process Heat, Report UCRL-52814, Lawrence Livermore Laboratory, Livermore, CA, 1979. [7] D.S. Shugar, Photovoltaics in the Utility Distribution System: The Evaluation of System and Distribution Benefits, Proceeding of the 21st IEEE PV Specialists Conference, Kissimmee, Florida, May 1990 [8] Arthur D Little, Reliability and DG White Paper, 2000
22

APPENDIX B: Fuel Parameter and Quality Constraints
for Fuel Cell Distributed Generators Phanikrishna Gomatom, Student Member, IEEE, and Ward Jewell, Fellow, IEEE
Abstract--Distributed generation (DG) technologies are being
discussed as the new paradigm for the electricity infrastructure, owing to growth in electric loads, deregulated markets, reliability constraints, emission control limitations, and the huge capital investments with minimal rates of return associated with central station generation. Some DG technologies are critically dependent on the fuel quality and supply parameters for optimal power delivery and overall economic operation. Currently, most DG technologies are expensive to install, operate and maintain. One of the factors that will affect feasibility and economic viability of fuel cells is the supply of fuel with the characteristics appropriate to fuel cell designs [1]. This paper deals with fuel performance indices for fuel cell DG units and analyzes their dependency on fuel characteristics for economical and optimal performance.
Index Terms-- Distributed Generation, Distributed Resources, Fuel Cells, Fuels, Natural Gas.
I. INTRODUCTION Fuel cell Generators are stacks of fuel cells, each cell
capable of producing a low electric DC voltage. Fuel cells consume hydrogen extracted from a hydrogen-rich fossil fuel (e.g., natural gas) and draw oxygen from air. In the fuel cell, oxygen and hydrogen combine at the molecular level, in the presence of a catalyst but under controlled temperature and pressure. This results in the oxidation of hydrogen, sometimes referred to as “no flame combustion.” The by-product of this “combustion-like” phenomenon is H2O at high temperature, generally in the form of steam. The oxidation of hydrogen, carried out in the presence of the electrolyte, produces a charge that drives a direct current flow from the cell’s anode to its cathode. Depending on the electrolyte, a single fuel cell can generate about 1-1.5 V, and the magnitude of current depends predominantly on the surface area of the plates exposed to the electrolyte.
Based on the design, fuel cells can be external–reforming or self-reforming. External-reforming fuel cells run on pure hydrogen and hence require an external reformer that is fed with hydrogen-rich fuel. The reformer strips off the hydrogen
This work was supported by the National Science Foundation through the
Power Systems Engineering Research Center. Phanikrishna Gomatom is with Wichita State University, Wichita, KS
67260-0044 USA (e-mail: [email protected]). Ward Jewell is with Wichita State University, Wichita, KS 67260-0044
USA (e-mail: [email protected]).
molecules from the fuel, and the pure hydrogen is admitted into the fuel cell after contaminants and other fuel contents are filtered out. . The self-reforming fuel cells are designed with a built-in catalytic converter and a catalytic oxidizer, combined together into one single unit that enables fuel to be pumped directly into the fuel cell. In spite of the complicated design, self-reforming fuel cells are expected to find a prominent place in most commercial applications in the future. Based on the electrolytic material and the type of chemical operation involved, fuel cells are broadly classified into five types: Alkaline, Proton-exchange Membrane, Phosphoric acid, Molten Carbonate and Solid oxide fuel cells [2].
II. ADVANTAGES AND DISADVANTAGES OF FUEL CELLS
A. Advantages • Higher efficiency than any other fossil fuel based DG
technology. • Modular and easy to install. • Portable and consume less surface area per unit power
produced. • In most cases fuel cells are zero-emission devices. • Appreciable amount of useful exhaust heat, thus fuel cells
are well adapted for CHP operation. • Zero or very low noise except for occasional vibrations. • Fuel cell stacks can be connected in parallel with batteries,
enabling fuel cells to operate as base-load generators, under varying load conditions.
B. Disadvantages • Highly expensive due to exotic materials, and complicated
design and assembly. • Highly sensitive to fuel contamination. Mandatory
additional expense for procurement and maintenance of effective filters and cleaners.
• Skilled personnel needed for maintenance and overhaul. • Fuel cell technology has an unproven record, though cost-
effective and reliable materials/technologies are under research and development for commercial power generation applications [3, 4].
III. FUEL CONSTRAINTS ON FUEL CELL OPERATION While fuel cells are one of the most promising DG
technologies, they are today too expensive for extensive
23

installation in most domestic and commercial applications. One of the primary constraints is the efficiency, cost, size and maintenance of auxiliary equipment to maintain the desired physical properties of fuels. These costs are in addition to costs incurred due to possible chemical and particulate contamination of fuel.
Fuel cell performance and emissions are dependent on fuel properties and fuel composition, although efforts are underway to build fuel cells that are less sensitive to fuel parameter deviations. If achieved, however, these will increase design costs.
These problems are reduced if the fuel supply and distribution systems deliver the right kind and the right quality of fuel. With existing constraints and a wide range of safety norms already in place for the fuel distribution infrastructure, it may not be feasible to provide the quality of fuel needed by fuel cells.
This paper deals with the analysis of some of the critical fuel cell performance indices that are directly or indirectly dependent on fuel characteristics. The analysis relates performance and economics of fuel cell DG to variations in fuel characteristics and chemistry.
IV. ANALYSIS The functional diagram and basic components of a fuel cell
are shown in Fig. 1 and Fig. 2, respectively. These will be used in the development of the analysis and performance indices for hydrogen fuel cells.
Fig. 1. Magnetization Functional Diagram of a Basic Fuel [3].
Fig. 2. Basic Components in a Fuel cell [5].
A. Open Circuit Voltage (EOC) The ideal (reversible) open circuit voltage for a fuel cell is
the electrical work done in moving charge through the fuel cell circuit, and is equal to the electrical work done per unit charge on one mole of electrons.
EOC = (Electrical work) / 2F (1)
where F is the Faraday constant, 96,485 C. The “2” in the denominator represents the number of electrons that flow for one mole of Hydrogen.
For an ideal system the electrical work is equal to the Molar Gibbs free energy released, -∆gF, during the reaction. Hence
EOC = -∆ gF / 2F (2)
The negative sign is due to Gibbs free energy that is liberated. When fuel is burned, the energy released is the change in
the molar enthalpy of formation (∆hF), sometimes called the “calorific value” of the fuel. Because the thermal energy in the fuel is converted to electrical energy in the fuel cell, ∆hF can be substituted for the Molar Gibbs free energy in the open circuit voltage equation:
EOC = -∆hF / 2F (3)
Typical values for EOC are 1.25 V to 1.48 V. The higher value uses the high heating value (HHV) for oxidation of hydrogen, 285.84 kJ/mole, which includes the molar enthalpy of vaporization of water. The lower value uses the low heating value (LHV), 241.83 kJ/mole, which does not include the vaporization of water.
B. Fuel Utilization Coefficient (µF) In practical situations not all the hydrogen that enters the
fuel cell is used in the electrochemical reaction. The fuel utilization coefficient, µF, is hence defined as
µF = Mass of fuel reacted in cell (4) Mass of fuel input to cell
The mass of fuel reacted in the fuel cell is improved with fuel containing a high percentage of hydrogen [11].
C. Fuel cell Efficiency (η): The fuel cell efficiency depends on the actual voltage
generated in the fuel cell. VC, the actual fuel cell output voltage, can be written as
Vc = EOC - Vdrop (5)
where Vdrop is the voltage drop within the fuel cell. The cell efficiency η is then
η = (µF VC) / EOC (6)
The voltage drop in the fuel cell is mostly due to polarization losses, which include concentration polarization, activation polarization and ohmic polarization losses [5].
D. Hydrogen Consumption The hydrogen consumption in a fuel cell depends on the
type of fuel cell and the concentration of hydrogen at standard temperature and pressure (STP).
24
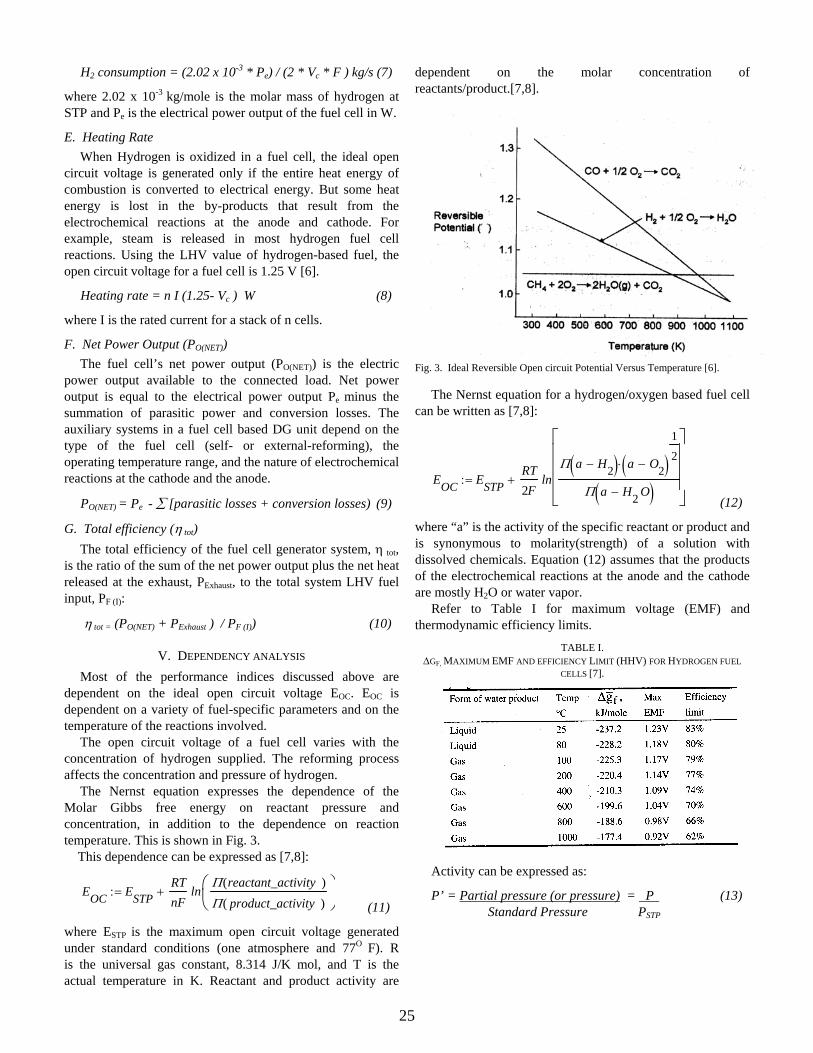
H2 consumption = (2.02 x 10⁻³ * Pe) / (2 * Vc * F ) kg/s (7)
where 2.02 x 10⁻³ kg/mole is the molar mass of hydrogen at STP and Pe is the electrical power output of the fuel cell in W.
E. Heating Rate When Hydrogen is oxidized in a fuel cell, the ideal open
circuit voltage is generated only if the entire heat energy of combustion is converted to electrical energy. But some heat energy is lost in the by-products that result from the electrochemical reactions at the anode and cathode. For example, steam is released in most hydrogen fuel cell reactions. Using the LHV value of hydrogen-based fuel, the open circuit voltage for a fuel cell is 1.25 V [6].
Heating rate = n I (1.25- Vc ) W (8)
where I is the rated current for a stack of n cells.
F. Net Power Output (PO(NET)) The fuel cell’s net power output (PO(NET)) is the electric
power output available to the connected load. Net power output is equal to the electrical power output Pe minus the summation of parasitic power and conversion losses. The auxiliary systems in a fuel cell based DG unit depend on the type of the fuel cell (self- or external-reforming), the operating temperature range, and the nature of electrochemical reactions at the cathode and the anode.
PO(NET) = Pe - ∑ [parasitic losses + conversion losses) (9)
G. Total efficiency (η tot) The total efficiency of the fuel cell generator system, η tot,
is the ratio of the sum of the net power output plus the net heat released at the exhaust, PExhaust, to the total system LHV fuel input, PF (I):
η tot = (PO(NET) + PExhaust ) / PF (I)) (10)
V. DEPENDENCY ANALYSIS Most of the performance indices discussed above are
dependent on the ideal open circuit voltage EOC. EOC is dependent on a variety of fuel-specific parameters and on the temperature of the reactions involved.
The open circuit voltage of a fuel cell varies with the concentration of hydrogen supplied. The reforming process affects the concentration and pressure of hydrogen.
The Nernst equation expresses the dependence of the Molar Gibbs free energy on reactant pressure and concentration, in addition to the dependence on reaction temperature. This is shown in Fig. 3. This dependence can be expressed as [7,8]:
EOC ESTPRTnF
lnΠ reactant_activity( )Π product_activity( )
⎛⎜⎝
⎞⎠
+:= (11)
where ESTP is the maximum open circuit voltage generated under standard conditions (one atmosphere and 77O F). R is the universal gas constant, 8.314 J/K mol, and T is the actual temperature in K. Reactant and product activity are
dependent on the molar concentration of reactants/product.[7,8].
Fig. 3. Ideal Reversible Open circuit Potential Versus Temperature [6].
The Nernst equation for a hydrogen/oxygen based fuel cell can be written as [7,8]:
EOC ESTPRT2F
lnΠ a H2−( ) a O2−( )
1
2⋅
Π a H2 O−( )
⎡⎢⎢⎢⎣
⎤⎥⎥⎥⎦
+:=
(12)
where “a” is the activity of the specific reactant or product and is synonymous to molarity(strength) of a solution with dissolved chemicals. Equation (12) assumes that the products of the electrochemical reactions at the anode and the cathode are mostly H2O or water vapor.
Refer to Table I for maximum voltage (EMF) and thermodynamic efficiency limits.
TABLE I. ∆GF, MAXIMUM EMF AND EFFICIENCY LIMIT (HHV) FOR HYDROGEN FUEL
CELLS [7].
Activity can be expressed as:
P’ = Partial pressure (or pressure) = P (13) Standard Pressure PSTP
25
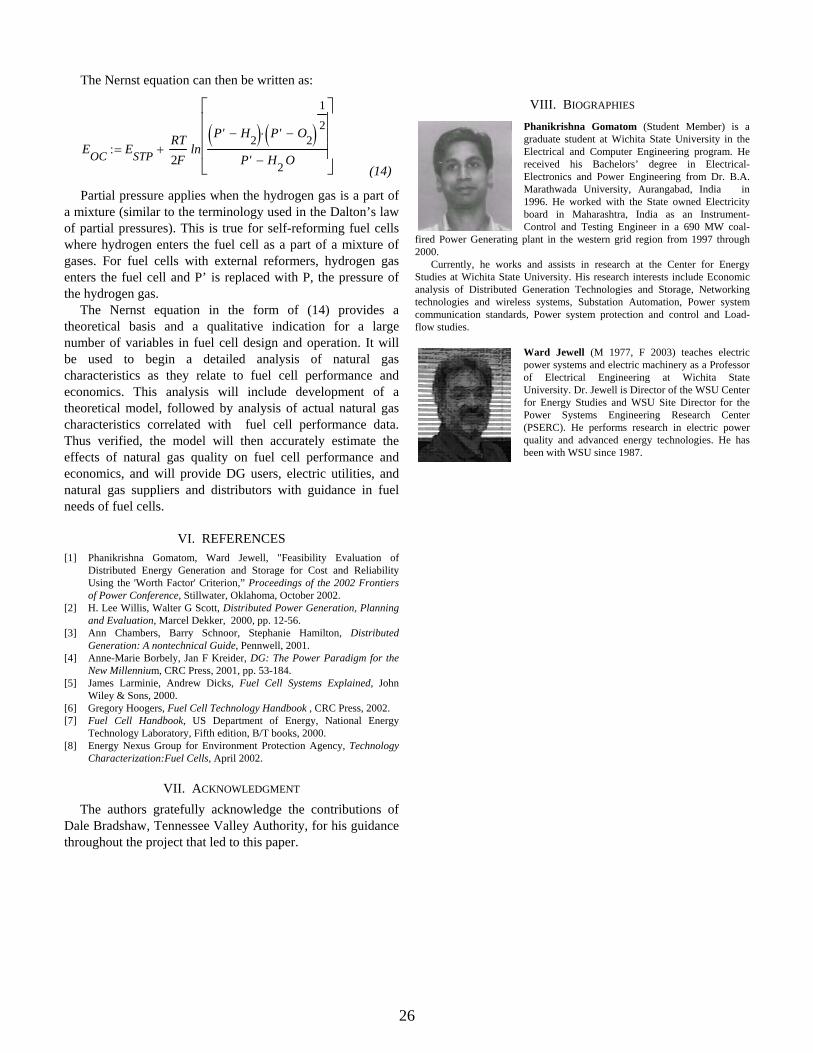
The Nernst equation can then be written as:
EOC ESTPRT2F
lnP' H2−( ) P' O2−( )
1
2⋅
P' H2 O−
⎡⎢⎢⎢⎣
⎤⎥⎥⎥⎦
+:=
(14)
Partial pressure applies when the hydrogen gas is a part of a mixture (similar to the terminology used in the Dalton’s law of partial pressures). This is true for self-reforming fuel cells where hydrogen enters the fuel cell as a part of a mixture of gases. For fuel cells with external reformers, hydrogen gas enters the fuel cell and P’ is replaced with P, the pressure of the hydrogen gas.
The Nernst equation in the form of (14) provides a theoretical basis and a qualitative indication for a large number of variables in fuel cell design and operation. It will be used to begin a detailed analysis of natural gas characteristics as they relate to fuel cell performance and economics. This analysis will include development of a theoretical model, followed by analysis of actual natural gas characteristics correlated with fuel cell performance data. Thus verified, the model will then accurately estimate the effects of natural gas quality on fuel cell performance and economics, and will provide DG users, electric utilities, and natural gas suppliers and distributors with guidance in fuel needs of fuel cells.
VI. REFERENCES [1] Phanikrishna Gomatom, Ward Jewell, "Feasibility Evaluation of
Distributed Energy Generation and Storage for Cost and Reliability Using the 'Worth Factor' Criterion,” Proceedings of the 2002 Frontiers of Power Conference, Stillwater, Oklahoma, October 2002.
[2] H. Lee Willis, Walter G Scott, Distributed Power Generation, Planning and Evaluation, Marcel Dekker, 2000, pp. 12-56.
[3] Ann Chambers, Barry Schnoor, Stephanie Hamilton, Distributed Generation: A nontechnical Guide, Pennwell, 2001.
[4] Anne-Marie Borbely, Jan F Kreider, DG: The Power Paradigm for the New Millennium, CRC Press, 2001, pp. 53-184.
[5] James Larminie, Andrew Dicks, Fuel Cell Systems Explained, John Wiley & Sons, 2000.
[6] Gregory Hoogers, Fuel Cell Technology Handbook , CRC Press, 2002. [7] Fuel Cell Handbook, US Department of Energy, National Energy
Technology Laboratory, Fifth edition, B/T books, 2000. [8] Energy Nexus Group for Environment Protection Agency, Technology
Characterization:Fuel Cells, April 2002.
VII. ACKNOWLEDGMENT The authors gratefully acknowledge the contributions of
Dale Bradshaw, Tennessee Valley Authority, for his guidance throughout the project that led to this paper.
VIII. BIOGRAPHIES Phanikrishna Gomatom (Student Member) is a graduate student at Wichita State University in the Electrical and Computer Engineering program. He received his Bachelors’ degree in Electrical-Electronics and Power Engineering from Dr. B.A. Marathwada University, Aurangabad, India in 1996. He worked with the State owned Electricity board in Maharashtra, India as an Instrument-Control and Testing Engineer in a 690 MW coal-
fired Power Generating plant in the western grid region from 1997 through 2000.
Currently, he works and assists in research at the Center for Energy Studies at Wichita State University. His research interests include Economic analysis of Distributed Generation Technologies and Storage, Networking technologies and wireless systems, Substation Automation, Power system communication standards, Power system protection and control and Load-flow studies.
Ward Jewell (M 1977, F 2003) teaches electric power systems and electric machinery as a Professor of Electrical Engineering at Wichita State University. Dr. Jewell is Director of the WSU Center for Energy Studies and WSU Site Director for the Power Systems Engineering Research Center (PSERC). He performs research in electric power quality and advanced energy technologies. He has been with WSU since 1987.
26

Proceedings of Power Systems 03: Distributed Generation and Advanced Metering
APPENDIX C:
Fuel Parameter and Quality Constraints For Microturbine Distributed Generators
PHANIKRISHNA GOMATOM WARD JEWELL
[email protected] [email protected] Wichita State University
Center for Energy Studies Wichita, Kansas, USA
ABSTRACT Distributed generation (DG) technologies are currently being discussed as the new paradigm for the electricity infrastructure, owing to growth in electric loads, de-regulated markets, and reliability constraints, emission control limitations , and the huge capital investments with minimal rates of return associated with central station generation. Some DG technologies are critically dependent on the fuel quality and supply parameters for optimal power delivery and overall economic operation. Currently, most DG technologies are expensive to install, operate and maintain. One of the factors that could enable feasible and economic viability for installation of microturbines is the supply of fuel with the characteristics appropriate to DG designs [1]. This paper deals with the performance indices of Microturbine DG units and analyzes their dependency on fuel characteristics for economical and optimal performance.
KEYWORDS Microturbines, microturbine performance, microturbine economics, fuel characteristics.
NOMENCLATURE AUL Average Useful life (Hours) PONET Net Power Output (kW) PT Turbine Power output (kW) PC Power Input to the Compressor (kW) PFC Power Input to the Fuel Compressor (kW) Pfric Total System Friction Losses (kW) PBearing Total System Bearing Losses (kW) PCon Electrical Conversion Losses (kW) ηis Efficiency of Isentropic Compression η tot Total efficiency (LHV) PExht Exhaust Thermal Power (kW) PF (I) Fuel Power Input (Btu/hr or equivalent kW) mCP Mass flow of Combustion Products (kg/sec) mA Mass flow of Air (kg/sec) mF Mass flow of fuel (kg/sec) EHR Electric Heat Rate (Btu/kWhr) SFC Specific Fuel Consumption ($/kWhr) HRR Heat Release Rate (kJ/m3) FFR Fuel Flow Rate (kJ/hr or Btu/hr) FHC Fuel Heat content (Btu/ ft3 or MJ/m3) IFP Inlet Fuel Pressure (psig)
KS Distribution System Fuel Pressure (psig) ZFC Pressure Ratio of the Fuel Compressor DP Pressure loss in the Fuel Compressor (psig) XV Volume rate of fuel flow (m3/hr) FQI Fuel Quality Index F Faraday Constant (Coulombs) Cp Specific Heat at Constant Pressure (J/kg K) T Temperature (K) ϒ Ratio of Specific Heats R Universal Gas constant (J/kg K) ∆ gF Change in Molar Gibbs free energy (kJ/mole) ∆ hF Molar enthalpy of formation (kJ/mole) µF Fuel Utilization Coefficient Pe Electrical Power rating (VA) I Current (Amperes) Krpm Kilo Revolutions per Minute Psig Pound per square Inch gauge Psia Pound per square Inch absolute DC/AC Direct /Alternating Current LPNG Low Pressure Natural Gas CNG Compressed Natural Gas L/HHV Low /High Heating Value SCFM Standard Cubic Feet per Minute STP Standard Temperature Pressure MTG Microturbine Generator
INTRODUCTION In a microturbine generator, a rotating electric machine is driven by a small gas turbine, called a microturbine. The turbine operates on the Brayton (constant pressure) cycle. Microturbine generators are high-speed machines, commonly single-shaft in design and typically consisting of a single-stage, radial flow compressor, a combustor, a power turbine (expander) and a recuperator. The turbo-compressor assembly runs at about 100 krpm. Air at atmospheric pressure and temperature is compressed to about 50 to 75 Psig in the compressor. The compressed air at around 350oF is preheated in the recuperator (carrying hot turbine exhaust gas at around 1200oF) and burned with a controlled amount of high-pressure fuel in the combustor. The combustion products at high temperature (about 1700oF) and high pressure are expanded over the turbine blades to produce shaft horsepower. In systems with Combined Heating and
27
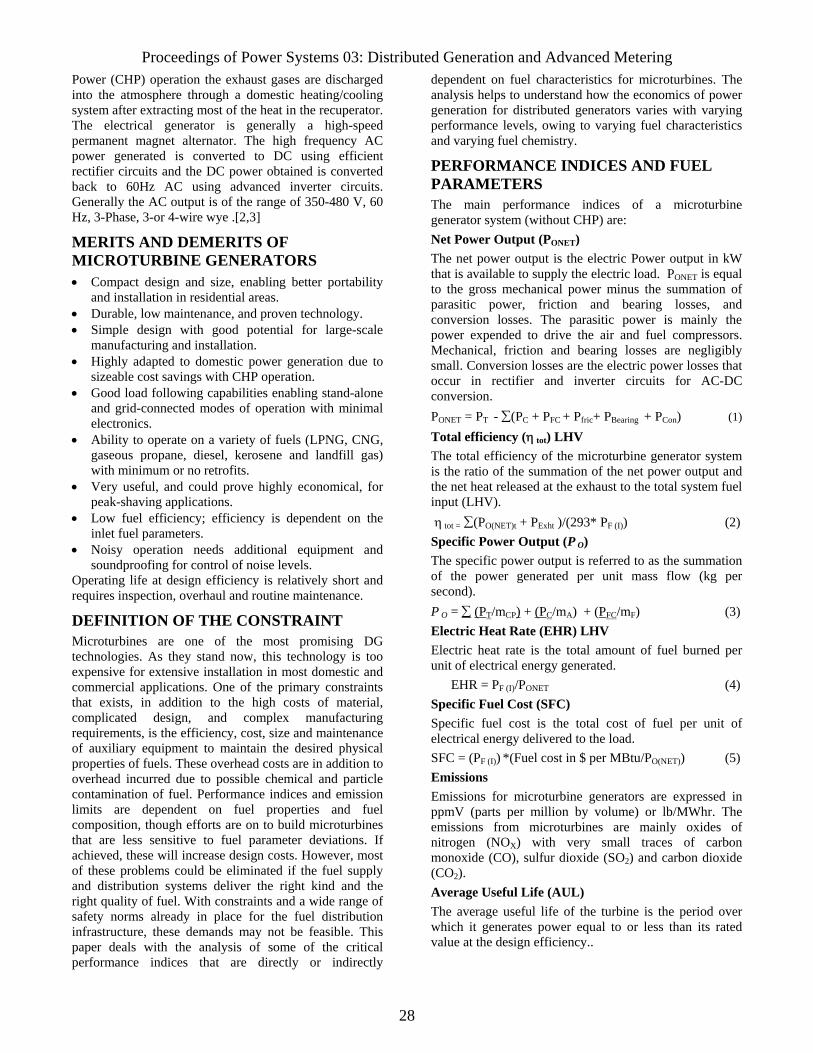
Proceedings of Power Systems 03: Distributed Generation and Advanced Metering Power (CHP) operation the exhaust gases are discharged into the atmosphere through a domestic heating/cooling system after extracting most of the heat in the recuperator. The electrical generator is generally a high-speed permanent magnet alternator. The high frequency AC power generated is converted to DC using efficient rectifier circuits and the DC power obtained is converted back to 60Hz AC using advanced inverter circuits. Generally the AC output is of the range of 350-480 V, 60 Hz, 3-Phase, 3-or 4-wire wye .[2,3]
MERITS AND DEMERITS OF MICROTURBINE GENERATORS • Compact design and size, enabling better portability
and installation in residential areas. • Durable, low maintenance, and proven technology. • Simple design with good potential for large-scale
manufacturing and installation. • Highly adapted to domestic power generation due to
sizeable cost savings with CHP operation. • Good load following capabilities enabling stand-alone
and grid-connected modes of operation with minimal electronics.
• Ability to operate on a variety of fuels (LPNG, CNG, gaseous propane, diesel, kerosene and landfill gas) with minimum or no retrofits.
• Very useful, and could prove highly economical, for peak-shaving applications.
• Low fuel efficiency; efficiency is dependent on the inlet fuel parameters.
• Noisy operation needs additional equipment and soundproofing for control of noise levels.
Operating life at design efficiency is relatively short and requires inspection, overhaul and routine maintenance.
DEFINITION OF THE CONSTRAINT Microturbines are one of the most promising DG technologies. As they stand now, this technology is too expensive for extensive installation in most domestic and commercial applications. One of the primary constraints that exists, in addition to the high costs of material, complicated design, and complex manufacturing requirements, is the efficiency, cost, size and maintenance of auxiliary equipment to maintain the desired physical properties of fuels. These overhead costs are in addition to overhead incurred due to possible chemical and particle contamination of fuel. Performance indices and emission limits are dependent on fuel properties and fuel composition, though efforts are on to build microturbines that are less sensitive to fuel parameter deviations. If achieved, these will increase design costs. However, most of these problems could be eliminated if the fuel supply and distribution systems deliver the right kind and the right quality of fuel. With constraints and a wide range of safety norms already in place for the fuel distribution infrastructure, these demands may not be feasible. This paper deals with the analysis of some of the critical performance indices that are directly or indirectly
dependent on fuel characteristics for microturbines. The analysis helps to understand how the economics of power generation for distributed generators varies with varying performance levels, owing to varying fuel characteristics and varying fuel chemistry.
PERFORMANCE INDICES AND FUEL PARAMETERS The main performance indices of a microturbine generator system (without CHP) are: Net Power Output (PONET) The net power output is the electric Power output in kW that is available to supply the electric load. PONET is equal to the gross mechanical power minus the summation of parasitic power, friction and bearing losses, and conversion losses. The parasitic power is mainly the power expended to drive the air and fuel compressors. Mechanical, friction and bearing losses are negligibly small. Conversion losses are the electric power losses that occur in rectifier and inverter circuits for AC-DC conversion. PONET = PT - ∑(PC + PFC + Pfric+ PBearing + PCon) (1) Total efficiency (η tot) LHV The total efficiency of the microturbine generator system is the ratio of the summation of the net power output and the net heat released at the exhaust to the total system fuel input (LHV). η tot = ∑(PO(NET)t + PExht )/(293* PF (I)) (2) Specific Power Output (P O) The specific power output is referred to as the summation of the power generated per unit mass flow (kg per second). P O = ∑ (PT/mCP) + (PC/mA) + (PFC/mF) (3) Electric Heat Rate (EHR) LHV Electric heat rate is the total amount of fuel burned per unit of electrical energy generated. EHR = PF (I)/PONET (4) Specific Fuel Cost (SFC) Specific fuel cost is the total cost of fuel per unit of electrical energy delivered to the load. SFC = (PF (I)) *(Fuel cost in $ per MBtu/PO(NET)) (5) Emissions Emissions for microturbine generators are expressed in ppmV (parts per million by volume) or lb/MWhr. The emissions from microturbines are mainly oxides of nitrogen (NOX) with very small traces of carbon monoxide (CO), sulfur dioxide (SO2) and carbon dioxide (CO2). Average Useful Life (AUL) The average useful life of the turbine is the period over which it generates power equal to or less than its rated value at the design efficiency..
28
Proceedings of Power Systems 03: Distributed Generation and Advanced Metering Heat Release Rate (HRR) The amount of heat released by the combustion of fuel in the combustion chamber (combustor) is a vital factor for the efficiency and the net power output for the microturbine HRR = (FFR*FHC)/(Primary Volume* Pressure ratio) (6) FHC in the above equation is the lower heating value of fuel. Pressure-ratio is the ratio of the pressure of the combustion products to that of the fuel-to-air mixture [4]. In the actual Brayton cycle, (or the non-ideal Brayton Cycle) pressure drops due to heat addition in the combustor. Thus pressure-ratio is always lower than one, contributing to higher HRR values per unit fuel consumption. The performances indices mentioned above are dependent on fuel parameters, fuel quality, ambient conditions and electrical/thermal loads. Fuel parameters are: Inlet Fuel Pressure (IFP) IFP is the pressure of the fuel at the point of injection into the combustor. IFP is dependent on the supply line pressure, measured in the local fuel distribution lines. Typical values of supply line fuel pressure are 0.5-1.5 psig. Most microturbine systems require a fuel compressor to obtain an IFP that is slightly greater than the pressure of air at the compressor outlet. Hence IFP is a function of the pressure of pressure in the fuel distribution system (KS) and the pressure ratio of the fuel compressor (ZFC) or the gain function for a pressure controller. IFP = (ZFC * KS) - DP (7) DP is the pressure loss in the fuel compressor, or the difference in set point pressure and the actual regulated pressure. ZFC ≥ KS at all times at ISO conditions (59OF @ sea level) Fuel Flow Rate (FFR) HHV value The FRR is the higher heating value per hour of fuel flow from the fuel distribution system. FRR is expressed in terms of kJ/hr or in terms of Btu/hr. FRR is a function of fuel heat content (FHC), volume rate of fuel flow (XV, m3/hr or SCFM) and the fuel quality index (FQI). FRR = FHC [HHV] *XV (8) at ISO conditions (59OF @ sea level). Fuel Quality Index (FQI) Owing to low emission characteristics and easy availability, most commercial microturbine systems operate on natural gas (NG). The analysis presented in this paper is based on natural gas fired microturbine generators. The fuel quality index is a function of chemical composition of the fuel and fuel heat content (HHV). Chemical composition The chemical composition by volume of natural gas is never constant. For reasons of simplicity, the average
chemical composition of natural gas by volume, is used in this paper: Methane (CH4): 95.52%; Ethane (C2H6): 2.627 % Propane (C3H8):0.441 %; Butane (C4H10):0.136 % Carbon Dioxide (CO2):0.40%; Nitrogen (N2): 0.74 % Specific Gravity (rel. air =1): 0.580 [5,6] Fuel Heat Content (FHC) or Heating Value HHV The higher (gross) heating value of fuel is the quantity of heat produced by the combustion of a unit volume of gas in air under constant pressure, after cooling the combustion products to the initial temperature of air and gas (typically 77oF) and after condensing the water vapor to liquid state. In other words HHV includes the latent heat of condensation of water vapor to water. HHV or gross heating value ranges between 1000-1050 Btu/ ft3 and 37.50-39.25 MJ/m3. The lower (net) heating value of fuel (LHV) is equal to the gross heating value (HHV) minus the latent heat of vaporization of the water vapor formed by the combustion of hydrogen in the fuel. For all calculations in this paper unless otherwise mentioned, HHV= 1.11 * LHV. Ambient Conditions: Ambient Temperature: The performance of microturbines depends on ambient temperature. At increased air temperatures, the workload on the compressor increases due to reduced airflow mass rate (due to decline in density of air), resulting in lower net power output (PONET) and a lower total efficiency (η tot). Altitude: The efficiency (η tot) also reduces with increased altitude. At higher altitudes, atmospheric pressure reduces and the compressor needs more power to compress the air to the rated value. Thus, at higher altitudes, the performance of microturbine generators drops below rated values. Electrical Load: Microturbine generators are designed to operate at full rated efficiency only under full load conditions. The fractional load performance of microturbines is lower than full load performance because the mechanical power output is reduced proportionally with the decrease in electric load demand. The decrease in mechanical power is due to the combined effect of reduced mass flow and lower turbine air inlet temperatures.
DEPENDENCY ANALYSIS To understand the dependency of the performance indices on fuel parameters and fuel quality the following basic analysis of an ideal open Brayton thermodynamic cycle is presented. Most modern commercial microturbines operate on the non-ideal open Brayton cycle with recuperation. The functional block diagram of an open cycle Microturbine system is shown in Figure 1.
29
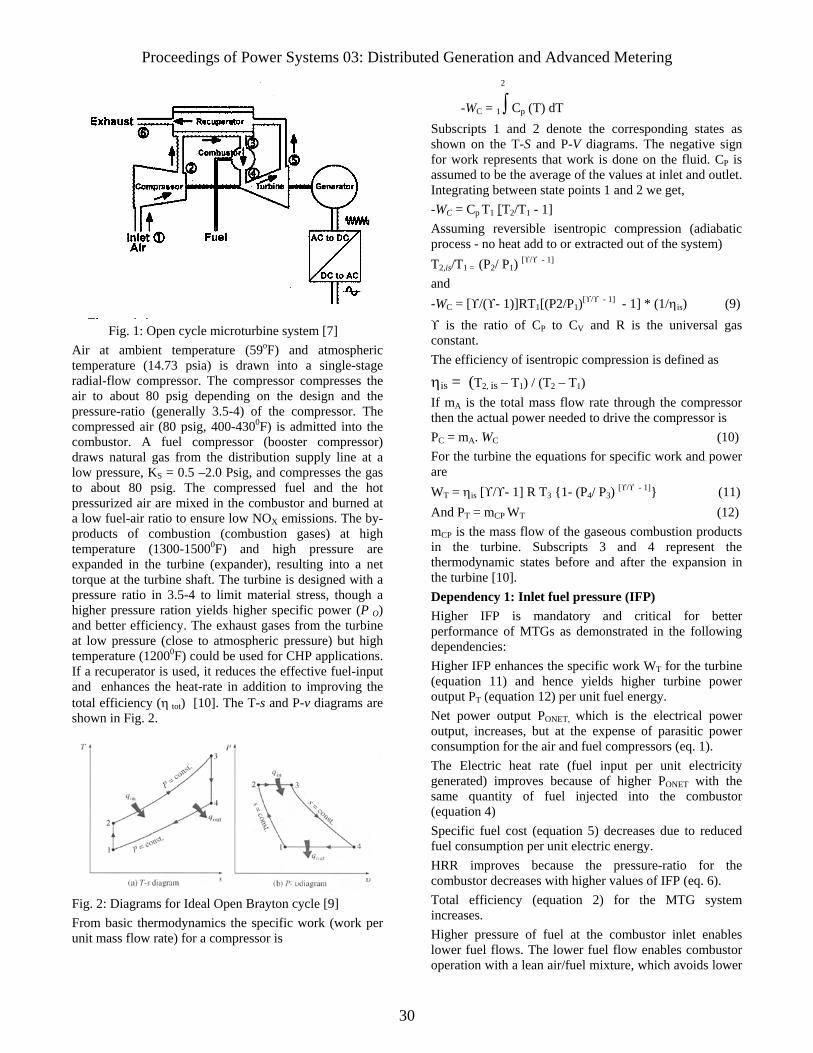
Proceedings of Power Systems 03: Distributed Generation and Advanced Metering
Fig. 1: Open cycle microturbine system [7] Air at ambient temperature (59oF) and atmospheric temperature (14.73 psia) is drawn into a single-stage radial-flow compressor. The compressor compresses the air to about 80 psig depending on the design and the pressure-ratio (generally 3.5-4) of the compressor. The compressed air (80 psig, 400-4300F) is admitted into the combustor. A fuel compressor (booster compressor) draws natural gas from the distribution supply line at a low pressure, KS = 0.5 –2.0 Psig, and compresses the gas to about 80 psig. The compressed fuel and the hot pressurized air are mixed in the combustor and burned at a low fuel-air ratio to ensure low NOX emissions. The by-products of combustion (combustion gases) at high temperature (1300-15000F) and high pressure are expanded in the turbine (expander), resulting into a net torque at the turbine shaft. The turbine is designed with a pressure ratio in 3.5-4 to limit material stress, though a higher pressure ration yields higher specific power (P O) and better efficiency. The exhaust gases from the turbine at low pressure (close to atmospheric pressure) but high temperature (12000F) could be used for CHP applications. If a recuperator is used, it reduces the effective fuel-input and enhances the heat-rate in addition to improving the total efficiency (η tot) [10]. The T-s and P-v diagrams are shown in Fig. 2.
Fig. 2: Diagrams for Ideal Open Brayton cycle [9] From basic thermodynamics the specific work (work per unit mass flow rate) for a compressor is
2
-WC = 1∫ Cp (T) dT Subscripts 1 and 2 denote the corresponding states as shown on the T-S and P-V diagrams. The negative sign for work represents that work is done on the fluid. CP is assumed to be the average of the values at inlet and outlet. Integrating between state points 1 and 2 we get, -WC = Cp T1 [T2/T1 - 1] Assuming reversible isentropic compression (adiabatic process - no heat add to or extracted out of the system) T2,is/T1 = (P2/ P1) [ϒ/ϒ - 1]
and -WC = [ϒ/(ϒ- 1)]RT1[(P2/P1)[ϒ/ϒ - 1] - 1] * (1/ηis) (9) ϒ is the ratio of CP to CV and R is the universal gas constant. The efficiency of isentropic compression is defined as
ηis = (T2, is – T1) / (T2 – T1) If mA is the total mass flow rate through the compressor then the actual power needed to drive the compressor is PC = mA. WC (10) For the turbine the equations for specific work and power are WT = ηis [ϒ/ϒ- 1] R T3 {1- (P4/ P3) [ϒ/ϒ - 1]} (11) And PT = mCP WT (12) mCP is the mass flow of the gaseous combustion products in the turbine. Subscripts 3 and 4 represent the thermodynamic states before and after the expansion in the turbine [10]. Dependency 1: Inlet fuel pressure (IFP) Higher IFP is mandatory and critical for better performance of MTGs as demonstrated in the following dependencies: Higher IFP enhances the specific work WT for the turbine (equation 11) and hence yields higher turbine power output PT (equation 12) per unit fuel energy. Net power output PONET, which is the electrical power output, increases, but at the expense of parasitic power consumption for the air and fuel compressors (eq. 1). The Electric heat rate (fuel input per unit electricity generated) improves because of higher PONET with the same quantity of fuel injected into the combustor (equation 4) Specific fuel cost (equation 5) decreases due to reduced fuel consumption per unit electric energy. HRR improves because the pressure-ratio for the combustor decreases with higher values of IFP (eq. 6). Total efficiency (equation 2) for the MTG system increases. Higher pressure of fuel at the combustor inlet enables lower fuel flows. The lower fuel flow enables combustor operation with a lean air/fuel mixture, which avoids lower
30

Proceedings of Power Systems 03: Distributed Generation and Advanced Metering flame local hot spots, as the peak flame temperature is less than the stoichiometric adiabatic flame temperature. The elimination of hot spots in the lower flame region suppresses thermal NOX formation. The above-mentioned dependencies improve the performance of the MTG and also effect cost savings owing to better utilization of fuel. However, higher IFP values cause more power to be spent to drive the air and fuel compressors. This is clear from equations (9), (10) and (1). Typically the air compressor utilizes as much as two-thirds and the fuel compressor uses one-seventeenth of the power generated by the turbine at full-load [7]. In addition to the need for more parasitic power, higher values of IFP impose the need for better materials capable of sustaining thermal stresses at high pressure flows, and critical designs for the compressor and the turbine. The design of the compressor and the turbine are crucial for the AUL of the microturbine generator system. The power consumption by the fuel compressor can be reduced if the fuel supplied by the gas distribution system is at higher pressure than the current pressure values measured in most commercial and residential areas. The implicit conclusion from equation (7) is that the fuel compressor design could be simplified if the value of KS tends to approach the value of IFP. A simpler design implies lower ZFC without or with a negligible value error correction function represented by DP. Dependency 2: Fuel Flow Rate (FFR) and Fuel Heat Content (FHC) The FFR represents the average quantity of heat added into the system. FFR (Btu/hr) depends on the heat content of the fuel (equation 8). A higher value of FFR adds a higher amount of heat for the same volume of fuel flowing into the combustor. The dependencies are: Higher FFR yields higher temperature per unit fuel consumption at the turbine inlet (T3), which improves the specific work output and the turbine output (eqs. 11, 12). Enhanced turbine power output increase the net gross power output and the total efficiency of the system (equations 1, 2) Specific power output and the electric heat rate vary in proportion to variation in FFR. Higher values of FFR improve specific power output and the electric heat rate of the MTG system (equations 3, 4). Higher values of FFR improve the efficiency of the combustor because of higher HRR (equation 6). Specific fuel cost decreases with higher values of FFR because the fuel requirement per unit of heat energy released during combustion reduces for the same value of net power output delivered (equation 5). Dependency 3: Chemical Composition of Fuel The chemical composition of fuel (natural gas) affects the heating value of fuel and results in higher fuel consumption for low quality fuel. The average chemical composition of natural gas fuel-air ratio, flame temperature and the combustor design are
critical for low NOX and low CO emissions by volume. NOX emissions for well-designed MTGs are typically of the order of less than 8-9 ppmV at 15% O2 because NOX emissions for natural gas driven engines and turbines depend mainly on thermal NOX formation rather than chemically bound nitrogen. Natural gas has very low chemically bound nitrogen. The amount of CO2 emitted is a function of the carbon percentage in the fuel. The average carbon content of natural gas is 34 lbs/MMBtu. Dependency 4: Ambient Temperature, Altitude and the Electrical Load Figures 3, 4 and 5 show the microturbine performance for varying temperature, altitude and electrical load.[8,10]
Fig. 3: Microturbine Performance and Ambient Temperature [10]
Fig. 4 : Microturbine Performance and Altitude [10]
Fig. 5: Microturbine Performance with Electrical Load [10]
31
Proceedings of Power Systems 03: Distributed Generation and Advanced Metering CONCLUSIONS Fuel quality and supply parameters that affect the performance of a microturbine electric generator have been summarized in this paper. This is one of the issues that must be evaluated to determine the economic feasibility of microturbines [1]. Similar work is needed on the other issues. The authors are collecting data from commercially available microturbine generators. These generators will then be analyzed for the effects of variations in fuel quality and supply. Fuel quality and supply issues also affect any other distributed generation technology relying on natural gas. The most notable such technology is fuel cells. The authors are doing an analysis for fuel cells similar to that presented in this paper. Commercial fuel cells will then be analyzed.
REFERENCES 1. Phanikrishna Gomatom, Ward Jewell, "Feasibility
Evaluation of Distributed Energy Generation and Storage for Cost and Reliability Using the 'Worth Factor' Criterion,” Proceedings of the 2002 Frontiers of Power Conference, Stillwater, Oklahoma, October 2002.
2. H. Lee Willis, Walter G Scott, Distributed Power Generation, Planning and Evaluation, Marcel Dekker, 2000, pp. 12-56
3. Ann Chambers, Barry Schnoor, Stephanie Hamilton, Distributed Generation: A nontechnical Guide, Pennwell, 2001.
4. Anne-Marie Borbely, Jan F Kreider, DG: The Power Paradigm for the New Millennium, CRC Press, 2001, pp. 53-184.
5. Natural Gas Properties, http://www.technocarb.com/natgasproperties.htm
6. Alternate Energy Systems, Inc., Technical data for Propane, Butane, and LPG mixtures, http://www.altenergy.com
7. MTG Field Test Program Interim Results, Electric Power Research Institute, November 2002, www.energy.ca.gov/ portsre
8. Staffan Haugwitz, Modeling of Microturbine Systems, Department of Automatic Control, Lund Institute of Technology, May 2002.
9. Y.A. Cengel, M.A. Boles, "Thermodynamics: an Engineering Approach," WCB/McGraw-Hill, 3rd Edition, 1998.
10. Energy Nexus Group for Environment Protection Agency, Technology Characterization :Microturbines, March 2002.
32