evaluation of duty cycles for heavy-duty urban vehicles ... · chassis dynamometer measurements, as...
TRANSCRIPT

VTT R
ESEAR
CH
NO
TES 2396 Evaluation of duty cycles for heavyduty urban vehicles. Final report of IEA A
MF A
nnex XX
IX
ESPOO 2007 VTT RESEARCH NOTES 2396
Three laboratories, VTT, Environment Canada and West Virginia Universitymeasured standard size urban buses driving various duty cycles on chassisdynamometers. The number of test cycles per laboratory varied from 6 to16. Included in the vehicle matrix were European and North Americandiesel, dieselhybrid and natural gas vehicles.
The main objective of the project was to evaluate how various dutycycles affect fuel consumption and exhaust emission figures. As could beexpected, the results vary significantly not only by test cycle, but alsoby vehicle technology.
An Annex to evaluate different chassis dynamometer test cycles andthe response of various vehicles to these test cycles was carried out withinthe IEA Implementing Agreement on Advanced Motor Fuels.
NilsOlof Nylund, Kimmo Erkkilä,Nigel Clark & Greg Rideout
Evaluation of duty cycles forheavyduty urban vehicles
Final report of IEA AMF Annex XXIX
ISBN 9789513869410 (URL: http://www.vtt.fi/publications/index.jsp)ISSN 14550865 (URL: http://www.vtt.fi/publications/index.jsp)
Euro 3 Diesel, BR vs. NYBUSfull load
0
200
400
600
800
1000
1200
0 500 1000 1500 2000 2500
Engine Speed [rpm]
Engi
ne T
orqu
e [N
m]
BraunschweigNyBus
VTT VTT VTTPL 1000 PB 1000 P.O. Box 1000
02044 VTT 02044 VTT FI02044 VTT, FinlandPuh. 020 722 4404 Tel. 020 722 4404 Phone internat. + 358 20 722 4404Faksi 020 722 4374 Fax 020 722 4374 Fax + 358 20 722 4374


VTT TIEDOTTEITA � RESEARCH NOTES 2396
Evaluation of duty cycles for heavy-duty urban vehicles
Final report of IEA AMF Annex XXIX
Nils-Olof Nylund & Kimmo Erkkilä VTT Technical Research Centre of Finland
Nigel Clark West Virginia University
Greg Rideout Environment Canada
ISBN 978-951-38-6941-0 (URL: http://www.vtt.fi/publications/index.jsp) ISSN 1455-0865 (URL: http://www.vtt.fi/publications/index.jsp) Copyright © VTT 2007
JULKAISIJA � UTGIVARE � PUBLISHER
VTT, Vuorimiehentie 3, PL 1000, 02044 VTT puh. vaihde 020 722 111, faksi 020 722 4374
VTT, Bergsmansvägen 3, PB 1000, 02044 VTT tel. växel 020 722 111, fax 020 722 4374
VTT Technical Research Centre of Finland, Vuorimiehentie 3, P.O. Box 1000, FI-02044 VTT, Finland phone internat. +358 20 722 111, fax +358 20 722 4374
VTT, Biologinkuja 5, PL 1000, 02044 VTT puh. vaihde 020 722 111, faksi 020 722 7048
VTT, Biologgränden 5, PB 1000, 02044 VTT tel. växel 020 722 111, fax 020 722 7048
VTT Technical Research Centre of Finland, Biologinkuja 5, P.O. Box 1000, FI-02044 VTT, Finland phone internat. +358 20 722 111, fax +358 20 722 7048
Language reviewed by Ralph McGill Technical editing Leena Ukskoski Text preparing Tarja Haapalainen

3
Nylund, Nils-Olof, Erkkilä, Kimmo, Clark, Nigel & Rideout, Greg. Evaluation of duty cycles for heavy-duty urban vehicles. Final report of IEA AMF Annex XXIX. Espoo 2007. VTT Tiedotteita � Research Notes 2396. 82 p. + app. 10 p.
Keywords duty cycles, heavy-duty vehicles, urban vehicles, fuel consumption, diesel engines, exhaust emissions, NOx-emissions, particulate emissions, CO2-emissions, engine load patterns
Abstract Three laboratories, VTT, Environment Canada and West Virginia University measured standard size urban buses driving various duty cycles on chassis dynamometers. The number of transient test cycles per laboratory varied from 6 to 16. Included in the vehicle matrix were European and North American diesel and natural gas vehicles. Environment Canada performed a comparison of a conventional diesel vehicle and a diesel-electric hybrid vehicle. Fuel consumption as well as exhaust emissions were measured.
The main objective of the project was to evaluate how various duty cycles affect fuel consumption and exhaust emission figures. As could be expected, the results vary significantly not only by test cycle, but also by vehicle technology. In some cases increased fuel consumption or load results in increased emissions, in other cases reduced emissions. However, for most, vehicles emissions can be directly proportioned to the amount of fuel consumed. In this respect NOx-emissions from SCR-vehicles form an exception, as well as particle emissions from vehicles producing very low absolute particle emission levels. Scaling factors to be used for comparing emission results generated with different duty cycles were developed.
Most of the evaluated test cycles provide coherent fuel consumption and emission results. Some specific test cycles result in abnormalities, and must therefore not be considered representative for buses.
All three laboratories performed measurements on three common cycles, the ADEME-RATP Paris bus cycle, the Orange County Transport Authority cycle and the Braunschweig bus -cycle. This made it possible to also compare European vehicles and North American vehicles with each other. However, such a comparison is only indicative, as there are differences in vehicle specifications, testing equipment and also in test procedures and testing conditions.

4
Preface
Urban buses form the backbone of many public transport systems. Diesel technology, common to most urban buses, is undergoing major changes, as the emission regulations become increasingly stringent. Natural gas buses are rather common in city fleets, and natural gas technology provides an interesting combination of an alternative fuel and very low particulate emissions.
Both in Europe and North America emission certification for heavy-duty vehicles is done by running stand-alone engines in engine test stands. Currently, no legal requirements to carry out chassis dynamometer exist. However, chassis dynamometer testing of heavy-duty vehicles is of interest, as this methodology makes it possible, e.g., to account for the properties of the total vehicle, to evaluate the effects of varying driving patterns and to carry out measurements of in-use vehicles.
An Annex to evaluate different chassis dynamometer test cycles and the response of various vehicles to these test cycles was carried out within the IEA Implementing Agreement on Advanced Motor Fuels. Three laboratories, VTT, Environment Canada and West Virginia University measured standard size urban buses driving various duty cycles on chassis dynamometers.
The task combined both task and cost sharing. Task sharing took place in such a way that the activities in all three participating laboratories were connected to national research activities on heavy-duty vehicles. Four countries participated in sharing the additional costs of the project: Canada, Finland, France and USA.
VTT, who is responsible for compiling this summary report, wishes to thank all involved parties for good cooperation. For this report, VTT is also responsible for the conclusions.
This report adds to the long list of original and unique data on vehicle emissions that has been generated within the Implementing Agreement on Advanced Motor Fuels.
Espoo 28.3.2007
Nils-Olof Nylund & Kimmo Erkkilä Nigel Clark Greg Rideout

5
Contents
Abstract..............................................................................................................................3
Preface ...............................................................................................................................4
1. Background..................................................................................................................7
2. Objective ....................................................................................................................10
3. Partners and sponsors.................................................................................................11
4. Test plan and test set-up.............................................................................................13 4.1 General .............................................................................................................13 4.2 VTT ..................................................................................................................17 4.3 Environment Canada ........................................................................................19 4.4 West Virginia University..................................................................................20 4.5 Presentation of results ......................................................................................22
5. VTT results ................................................................................................................24 5.1 General .............................................................................................................24 5.2 Regulated emissions, CO2 and fuel consumption ............................................25 5.3 Engine load patterns and accumulated work ....................................................36 5.4 Unregulated emissions......................................................................................44
6. Environment Canada results ......................................................................................47 6.1 General .............................................................................................................47 6.2 Regulated emissions, CO2 and fuel consumption............................................48
7. West Virginia University results................................................................................54 7.1 General .............................................................................................................54 7.2 Regulated emissions, CO2 and fuel consumption ............................................54 7.3 Effects of load on emissions and fuel economy ...............................................63 7.4 Continuous emission data.................................................................................65 7.5 Unregulated emissions......................................................................................69
8. Discussion and conclusions .......................................................................................71 8.1 General .............................................................................................................71 8.2 Characteristics of test cycles ............................................................................71 8.3 Vehicle to vehicle comparisons........................................................................78 8.4 Final conclusions ..............................................................................................80

6
Acknowledgements .........................................................................................................81
References .......................................................................................................................82
Appendix 1

7
1. Background
The years between 2005 and 2010 will bring significant emission reductions to heavy-duty vehicles, both in Europe and in North America. To meet the ever tightening emission requirements, the vehicle manufacturers will have to implement either in-cylinder measures or exhaust gas after-treatment technology to control emissions, or a combination of both measures. Alternatively, the manufacturers can opt for clean-burning alternative fuels such as natural gas.
Figure 1.1 depicts the development of emission regulations in Europe and in the US. The US is, for the time being, ahead of Europe regarding heavy-duty emission regulations In Europe, Euro 6 -requirements to be implemented around 2012 are being discussed.
Figure 1.1. Development of European and US heavy-duty emission regulations (STT Emtech).
Standardized emission certification methods for heavy-duty applications are based on stand-alone engine tests on engine dynamometers. However, this method has several limitations.

8
Firstly, engine testing does not account the properties of the vehicle itself (vehicle weight, drive train, body structure, cooling system arrangement etc.). Moreover, engine testing is very impractical when evaluating in-service vehicles. Removing the engine from a vehicle is very laborious, and because late model year engines are coupled with forever more complex electrical systems in the complete vehicle, even more work is needed to make the engine run as a stand-alone unit.
Testing complete vehicles on a chassis dynamometer resolves many problems and overcomes the barriers mentioned above. Additionally, complete vehicle testing generates truthful specific emissions in grams per kilometer or mile instead of per kilowatt-hour, a term that is difficult to relate to in the real world.
Moreover, possible in-use compliance requirements can be verified only by running vehicles on a chassis dynamometer or using on-board measuring equipment. Chassis dynamometer work will also be needed for the On-Board Diagnostic (OBD) system development work for heavy-duty vehicles.
Several heavy-duty vehicle driving cycles are utilized around the world. Some of them are used mostly in the US (Central Business District, Orange County etc.) and others mostly in Europe (Dutch urban bus driving cycle, Braunschweig-cycle etc.). In Asia, e.g., Hong Kong approves several cycle options (e.g. Braunschweig) for validation of retrofit exhaust after -treatment systems. It is relatively easy to vary driving cycle in chassis dynamometer measurements, as the driving cycle is defined as a speed versus time profile. Speed profiles can easily be record from real driving conditions, and then be transferred to laboratory conditions.
At present, there are no international standards for heavy-duty vehicle chassis dynamometer testing. In order to harmonize chassis dynamometer testing, SAE has published a document named �Recommended Practice for Measuring Fuel Economy and Emissions of Hybrid-Electric and Conventional Heavy-Duty Vehicles� (SAE J2711). This document covers several duty cycles, including the Orange County cycle developed by West Virginia University.
Conventional diesel engines without exhaust gas after-treatment have brake-specific emissions that are relatively insensitive to load, and emissions can, with rather good accuracy, be correlated to the amount of fuel consumed. In some cases, depending on the sophistication level of the engine, the connection between particulate emission and fuel consumed may be disturbed when the engine approaches full load.
However, some new diesel engine emission reduction technologies, such as particle filters and urea SCR (selective catalyst reduction) -catalysts, are sensitive to exhaust

9
temperature and thus, driving cycle. If exhaust temperature is too low, particle filters with passive regeneration will not regenerate, with clogging as a possible consequence. Urea-SCR-systems cannot function if exhaust temperature is below 200 oC. Therefore, testing vehicles using representative duty cycles is becoming increasingly important. Engines that work well in standardized engine test cycles do not necessarily perform well in real-life driving situations. This is especially true for bus services with low average speed and low average load. We can expect that relative variations from vehicle type to vehicle type will increase as absolute emission levels are going down.
Transit agencies across North America operate bus fleets powered primarily by diesel engines, although transit buses fueled with compressed natural gas (CNG), liquefied natural gas (LNG), and hybrid-electric drive systems have made significant penetration in recent years. A recent survey by the American Public Transportation Association (APTA) revealed that natural gas was the second-most used power source after diesel, fueling approximately 7.5% of the transit buses in the United States while LNG was employed to power approximately 1.5% of transit buses (APTA 2006). About 23% of transit agencies in United States have natural gas fueled buses in their fleet, the survey found. The survey also revealed that demand for alternative fueled bus fleets had increased significantly in recent years.
In Europe, diesel is dominating bus fleets, although many cities have CNG-buses. LNG is not used in buses, and hybrid buses are still very rare.
Regarding diesel technology, there is a basic difference between Europe and North America. Most European manufacturers have opted for urea SCR-technology to control NOx-emissions, whereas the North American manufacturers are currently using EGR (exhaust gas recirculation) technology for NOx-control. To meet the emission requirements of 2010 and beyond, some experts predict that systems combining EGR, SCR as well as particle filters will be needed (Puetz 2005, Johnson 2006). In North America, NOx adsorber technology is also being considered for NOx-reduction.
10
2. Objective
The IEA Implementing Agreements, in this case Advanced Motor Fuels, offer excellent platforms for international collaborative research. Harmonization of test methods for vehicles and fuels is one important task.
Although there is no universal methodology for chassis dynamometer measurements of heavy-duty vehicles, several laboratories around the world are producing emission results for complete heavy-duty vehicles. In general, measurements are focused on new types of vehicles, i.e. vehicles using newest exhaust clean-up technology, advanced power-trains and/or alternative fuels. Advanced Vehicle Testing Activity (AVTA), which supports the US DOE�s FreedomCAR & Vehicle Technologies Program, is an example of such an activity (Chandler et al. 2006).
Consequently there is a clear need to be able to compare emission results from various activities at different laboratories, and in the end, a need for international harmonization of emission test methods.
The main objective of this project is to demonstrate how the driving cycle affects the emission performance of conventional and advanced urban buses. In a collaborative effort of three vehicle laboratories, a number of driving cycles are run with several vehicles aiming at the following goals:
• to generate understanding of the characteristics of different duty cycles
• to produce a key for cross-interpretation of emission results generated with different cycles
• to study the interaction between vehicle, exhaust after-treatment and fuel technologies and test procedures
• to pin-point the need for international harmonization in emission testing.
In this phase, activities were limited to examination of urban buses. Future correlation work should cover also other types of heavy-duty vehicles.
11
3. Partners and sponsors
The project was carried out within IEA Advanced Motor Fuels using a combination of cost and task sharing. Three laboratories conducted actual chassis dynamometer measurements on buses (contact persons in brackets):
• Technical Research Centre of Finland, VTT, Finland (Nils-Olof Nylund & Kimmo Erkkilä)
• Environment Canada, Environmental Technology Centre, Emissions Research and Measurement Division, EC, Canada (Greg Rideout)
• West Virginia University, WVU, USA (Nigel Clark).
VTT acted as Operating Agent and coordinator for the project. VTT was also responsible for compiling the summary report at hand. Dr. Ralph McGill served as North American liaison officer in the project.
Four countries supported the project financially:
• Canada o Natural Resources Canada
• France o the French Energy Agency ADEME
• Finland o Tekes � Finnish Funding Agency for Technology and Innovation o Helsinki City Transport o Helsinki Metropolitan Area Council
• US o US Department of Energy.
Both Environment Canada and VTT supported the project with work contribution. In addition the following organizations contributed resources to the project:
• Allison Electric Drives � General Motors • Southeastern Pennsylvania Transportation Authority • Washington Metropolitan Area Transit Authority (WMATA).
At VTT, the testing for the IEA project was carried out back to back with the Finnish national bus programme (Nylund & Erkkilä 2005).

12
The Environment Canada Emission Research and Measurement Division (ERMD) has undertaken the emissions measurements that have accompanied the evaluation of natural gas, hybrid-electrics, and clean diesel technologies for a number of transit bus technology programs. The linkage to the IEA project made it possible to include additional duty cycles, to enable comparison with VTT and West Virginia University results for the diesel electric hybrid system from Allison-GM.
The Center for Alternative Fuels, Engines, and Emissions (CAFEE) of West Virginia University (WVU) recently conducted bus emissions testing program in cooperation with Washington Metropolitan Area Transit Authority (WMATA). With support from US Department of Energy, Office of FreedomCar and Vehicle Technologies, the program was set up so that it also served the IEA project on bus cycle evaluation.

13
4. Test plan and test set-up
4.1 General
Three common transient-type driving cycles to be used by all laboratories were selected:
• The Braunschweig bus cycle (DieselNet) • The Orange County Transit Authority cycle OCTA (SAE J 2711) • The ADEME-RATP Paris bus cycle (Coroller & Plassat 2003).
These driving cycles are presented in Figures 4.1 (Braunschweig), 4.2 (OCTA) and 4.3 (ADEME-RATP). All these cycles are derived from real bus operating data and reflect a wide variety of accelerations, decelerations and cruise operations.
Each laboratory then added driving cycles of special interest, so that the total number of driving cycles per laboratory was 6�16. Data on all test cycles is given in Table 4.1. Some of the cycles are �artificial�, e.g., Central Business District CBD, Commuter and ECE R15. The ECE R15 -cycle is shown in Figure 4.4. All cycles are presented in graphic form in Appendix 1.
Braunschweig
0
10
20
30
40
50
60
70
0 500 1000 1500Time (s)
Spee
d (k
m/h
)
Figure 4.1. The Braunschweig bus cycle (DieselNet).

14
Orange County
0
10
20
30
40
50
60
70
0 500 1000 1500Time (s)
Spee
d (k
m/h
)
Figure 4.2. The Orange County Transit Authority OCTA bus cycle (SAE J2711).
Parisian ADEME - RATP Bus Cycle
0
10
20
30
40
50
60
0 500 1000 1500 2000Time (s)
Spee
d (k
m/h
)
Figure 4.3. The ADEME-RATP Paris bus cycle (Coroller & Plassat 2003).

15
ECE15
0
10
20
30
40
50
60
0 200 400 600 800Time (s)
Spee
d (k
m/h
)
Figure 4.4. The ECE R15 -cycle (DieselNet).
Regarding test vehicles, the objective was to cover European and North American diesel and natural gas technology, as well as hybrid technology. The participating laboratories were responsible for the selection of test vehicles. Testing was carried out using approximately 12 meter long two-axle urban buses.
The outcome of the vehicle matrix was as follows:
• VTT o baseline European diesel technology (Euro 3, MY 2004) o European SCR-technology (Euro 4, MY 2006) o European natural gas technology, stoichiometric (EEV1-certification,
MY 2005)
• Environment Canada (EC) o North American diesel technology (MY 2005) o North American parallel hybrid technology (MY 2005)
• West Virginia University (WVU) o North American diesel technology (MY 2003 -engines retrofitted in
MY 1992 -buses) o North American natural gas technology, lean-burn, two different makes
(MY 2004 and 2005).
1 Enhanced Environmentally Friendly Vehicle, Directive 1999/96/EC/2005/55EC.
16
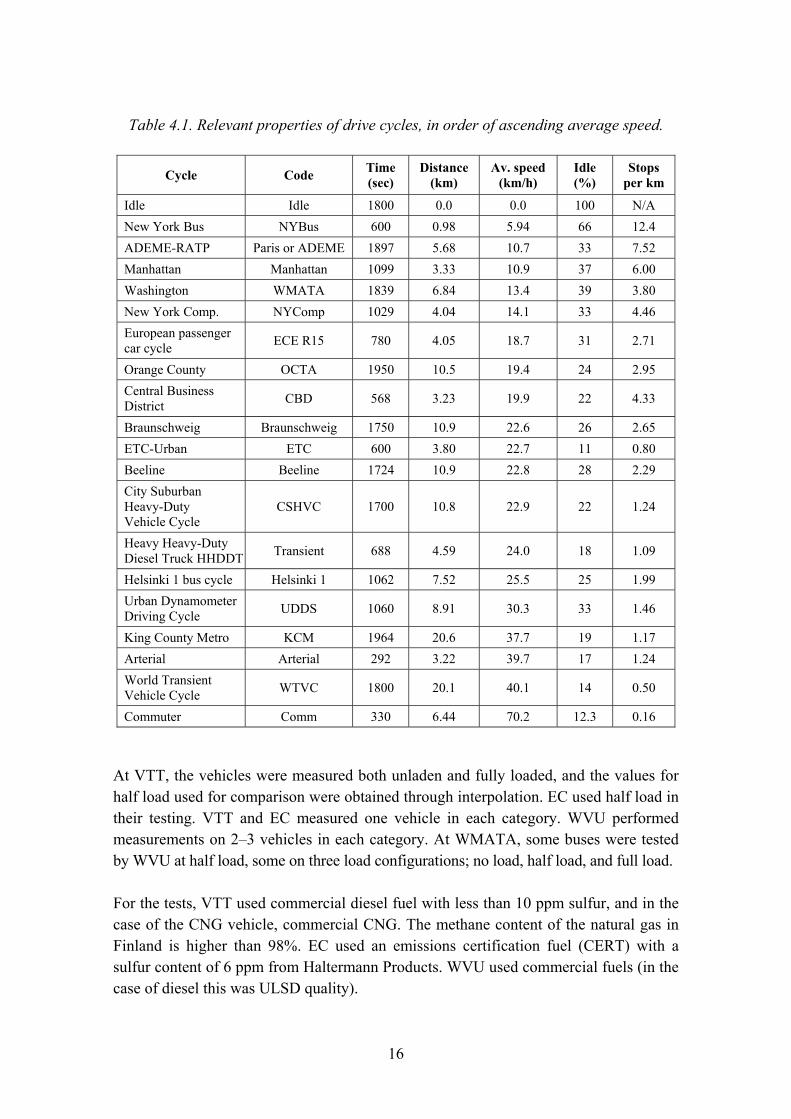
Table 4.1. Relevant properties of drive cycles, in order of ascending average speed.
Cycle Code Time (sec)
Distance(km)
Av. speed(km/h)
Idle (%)
Stops per km
Idle Idle 1800 0.0 0.0 100 N/A New York Bus NYBus 600 0.98 5.94 66 12.4 ADEME-RATP Paris or ADEME 1897 5.68 10.7 33 7.52 Manhattan Manhattan 1099 3.33 10.9 37 6.00 Washington WMATA 1839 6.84 13.4 39 3.80 New York Comp. NYComp 1029 4.04 14.1 33 4.46 European passenger car cycle ECE R15 780 4.05 18.7 31 2.71
Orange County OCTA 1950 10.5 19.4 24 2.95 Central Business District CBD 568 3.23 19.9 22 4.33
Braunschweig Braunschweig 1750 10.9 22.6 26 2.65 ETC-Urban ETC 600 3.80 22.7 11 0.80 Beeline Beeline 1724 10.9 22.8 28 2.29 City Suburban Heavy-Duty Vehicle Cycle
CSHVC 1700 10.8 22.9 22 1.24
Heavy Heavy-Duty Diesel Truck HHDDT Transient 688 4.59 24.0 18 1.09
Helsinki 1 bus cycle Helsinki 1 1062 7.52 25.5 25 1.99 Urban Dynamometer Driving Cycle UDDS 1060 8.91 30.3 33 1.46
King County Metro KCM 1964 20.6 37.7 19 1.17 Arterial Arterial 292 3.22 39.7 17 1.24 World Transient Vehicle Cycle WTVC 1800 20.1 40.1 14 0.50
Commuter Comm 330 6.44 70.2 12.3 0.16
At VTT, the vehicles were measured both unladen and fully loaded, and the values for half load used for comparison were obtained through interpolation. EC used half load in their testing. VTT and EC measured one vehicle in each category. WVU performed measurements on 2�3 vehicles in each category. At WMATA, some buses were tested by WVU at half load, some on three load configurations; no load, half load, and full load.
For the tests, VTT used commercial diesel fuel with less than 10 ppm sulfur, and in the case of the CNG vehicle, commercial CNG. The methane content of the natural gas in Finland is higher than 98%. EC used an emissions certification fuel (CERT) with a sulfur content of 6 ppm from Haltermann Products. WVU used commercial fuels (in the case of diesel this was ULSD quality).

17
For emission measurements, all laboratories used full-flow CVS dilution systems. In the case of VTT, the analytical equipment is compliant with Directive 1999/96/EC. In the case of EC and WVU, the instrumentation conforms with United States Code of Federal Regulations (CFR) Title 40, Subpart B & N of Part 86. For the measurements, the laboratories followed the practices and recommendations of SAE J2711.
When comparing vehicle-to-vehicle results, it should be noted that all three laboratories used different types of chassis dynamometers. Therefore, the results should first and foremost be used to compare duty cycles and their effects on fuel economy with different vehicle technology, not primarily to direct vehicle-to-vehicle comparisons.
In addition to regulated emission components (carbon monoxide CO, total hydrocarbons THC or non-methane hydrocarbons NMHC, nitrogen oxides NOx and particulate matter PM), VTT and West Virginia University also measured some unregulated exhaust components.
Environment Canada and West Virginia University calculated fuel consumption from the carbon balance of the exhaust gases. VTT used this method for the natural gas bus, but measured fuel consumption gravimetrically for the diesel buses.
4.2 VTT
For measurements of heavy-duty vehicles, VTT uses a single-roller, 2.5 meter diameter chassis dynamometer with electric inertia simulation. The system has the capability of testing vehicles from 2,500 to 60,000 kilograms. Maximum power absorbed power (continuous) is 300 kW. Figure 4.5 presents a view from the VTT test facility.
The vehicles tested at VTT were:
• Scania L94 UB4 x 2LB 230 diesel o mileage 84 000 km o curb weight (unloaded) 12,100 kg, gross weight (full load) 18,000 kg
displacement 8.97 liter o power 169 kW o no EGR, no exhaust gas after-treatment o Euro 3 -emission certification (5 g NOx/kWh, 0.10 g PM/kWh)
• Volvo 7700 B9L diesel o mileage 6 500 km o curb weight (unloaded) 11,780 kg, gross weight (full load) 18,000 kg o displacement 9.4 liter

18
o power 228 kW o urea SCR-catalyst o Euro 4 -emission certification (3.5 g NOx/kWh, 0.03 g PM/kWh)
• MAN NL243CNG/3T natural gas o mileage 1 500 km o curb weight (unloaded) 12,800 kg, gross weight (full load) 18,000 kg o displacement 12.0 liter o power 180 kW o stoichiometric combustion, naturally aspirated, three-way catalysts o EEV-emission certification (2 g NOx/kWh, 0.02 g PM/kWh).
Figure 4.5. Emission testing on VTT�s chassis dynamometer.
The Volvo SCR -bus was certified for Euro 4, but was in fact Euro 5 -compliant, featuring, e.g., closed-loop urea dosing control. The bus had a side-mounted engine and a portal rear axle to provide full-length low floor. Such a design increases losses in the drive line by some 3�5%, and this has to be taken into account evaluating fuel consumption.
At VTT, seven driving cycles were evaluated:
• Braunschweig bus cycle • Orange County Transit Authority cycle OCTA • ADEME-RATP Paris bus cycle

19
• Helsinki 1 -bus cycle (developed by VTT) • New York -bus cycle • World Transient Vehicle cycle (WTVC) • ECE 15 -cycle (passenger car certification cycle).
4.3 Environment Canada
A heavy-duty dual axle dynamometer system designed and assembled by the Emissions Research and Measurement Division was used in this project. The system consists of two sets of rolls, one per axle (dual axle vehicles), which have a diameter of 60 cm. The distance between the centers of these rolls may be adjusted from 122 to 183 centimeters. However in this project only a single roll was necessary as this vehicle had just the one driven axle. The inertia weight and road load are simulated during testing using two 400 horsepower General Electric direct current motors, one per axle. The system has the capability of testing vehicles from 7,700 to 35,000 kilograms. Figure 4.6 shows a hybrid bus on Environment Canada�s chassis dynamometer.
Figure 4.6. A hybrid bus on Environment Canada�s chassis dynamometer.
20
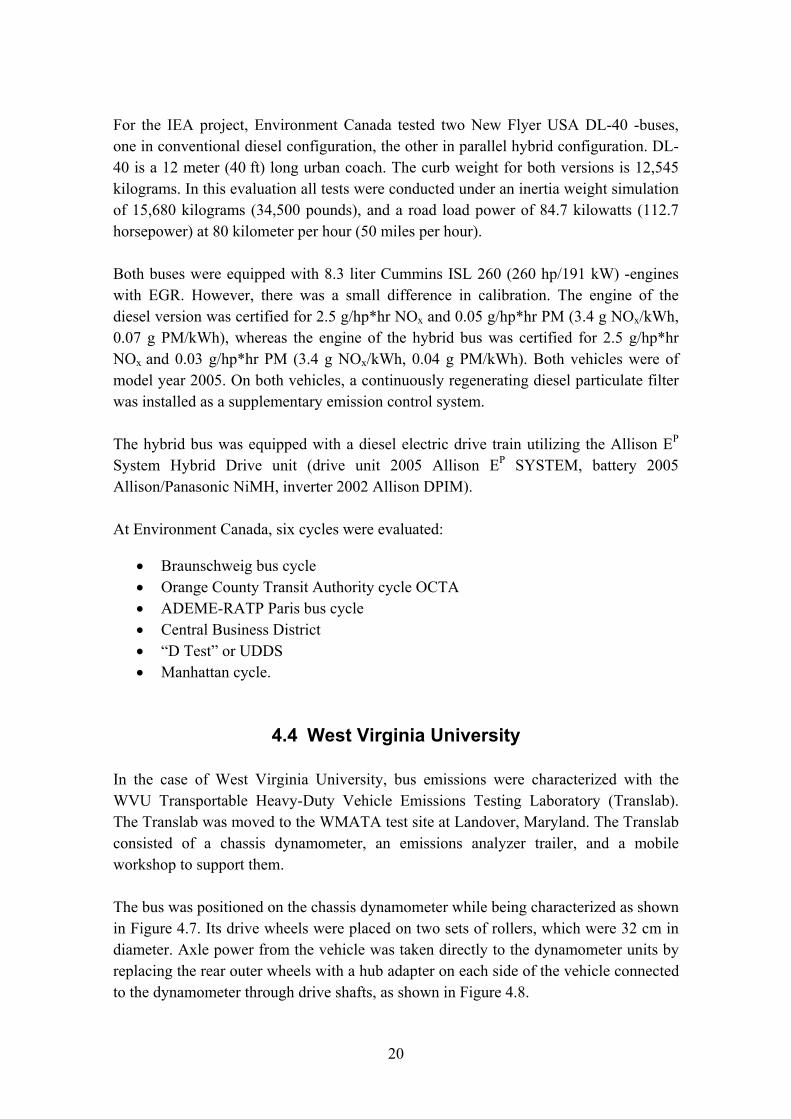
For the IEA project, Environment Canada tested two New Flyer USA DL-40 -buses, one in conventional diesel configuration, the other in parallel hybrid configuration. DL-40 is a 12 meter (40 ft) long urban coach. The curb weight for both versions is 12,545 kilograms. In this evaluation all tests were conducted under an inertia weight simulation of 15,680 kilograms (34,500 pounds), and a road load power of 84.7 kilowatts (112.7 horsepower) at 80 kilometer per hour (50 miles per hour).
Both buses were equipped with 8.3 liter Cummins ISL 260 (260 hp/191 kW) -engines with EGR. However, there was a small difference in calibration. The engine of the diesel version was certified for 2.5 g/hp*hr NOx and 0.05 g/hp*hr PM (3.4 g NOx/kWh, 0.07 g PM/kWh), whereas the engine of the hybrid bus was certified for 2.5 g/hp*hr NOx and 0.03 g/hp*hr PM (3.4 g NOx/kWh, 0.04 g PM/kWh). Both vehicles were of model year 2005. On both vehicles, a continuously regenerating diesel particulate filter was installed as a supplementary emission control system.
The hybrid bus was equipped with a diesel electric drive train utilizing the Allison EP System Hybrid Drive unit (drive unit 2005 Allison EP SYSTEM, battery 2005 Allison/Panasonic NiMH, inverter 2002 Allison DPIM).
At Environment Canada, six cycles were evaluated:
• Braunschweig bus cycle • Orange County Transit Authority cycle OCTA • ADEME-RATP Paris bus cycle • Central Business District • �D Test� or UDDS • Manhattan cycle.
4.4 West Virginia University
In the case of West Virginia University, bus emissions were characterized with the WVU Transportable Heavy-Duty Vehicle Emissions Testing Laboratory (Translab). The Translab was moved to the WMATA test site at Landover, Maryland. The Translab consisted of a chassis dynamometer, an emissions analyzer trailer, and a mobile workshop to support them.
The bus was positioned on the chassis dynamometer while being characterized as shown in Figure 4.7. Its drive wheels were placed on two sets of rollers, which were 32 cm in diameter. Axle power from the vehicle was taken directly to the dynamometer units by replacing the rear outer wheels with a hub adapter on each side of the vehicle connected to the dynamometer through drive shafts, as shown in Figure 4.8.

21
Each dynamometer unit consisted of a flywheel assembly, an eddy current power absorber, and a Lebow torque transducer. Flywheel sets consisted of a series of selectable discs that allowed simulation of inertial load.
West Virginia University carried out the most comprehensive test matrix, with a total of 16 duty cycles plus idle. WVU ran all the cycles listed in Table 4.1 with the exception of ECE R15, Helsinki and WTVC.
Figure 4.7. View of a John Deere powered natural gas bus placed on the dynamometer.
Figure 4.8. Hub adapters connect vehicle�s drive axle directly to the power absorber unit.
A total of eight Orion buses representing conventional diesel and CNG were tested with varying weights and after-treatment configurations. The test matrices involved three CNG-buses powered by John Deere RG6081 lean-burn natural gas engines, three CNG-buses powered by Cummins CG-280 closed loop lean-burn natural gas engines, and two diesel buses powered by Detroit Diesel Corporation (DDC) 2003 model year Series 50, 275 hp (202 kW) engines. All buses were equipped with exhaust gas after-treatment, the diesel buses with particle filters (Table 4.2).

22
Table 4.2. Vehicle details of the buses tested by WVU.
Bus ID WMATABus No.
Bus Type
& MY
Engine Type & MY
GVW
(kg)
After- treatment
Curb Wt. (kg)
Odometer Mileage
(km)
JD#1 2639 Catalytic Converters 14,567 6764
JD#2 2621 14,389 5040
JD#3 2640
Orion 2005
RG6081 280 hp/206 kW, 2005
19,334
14,689 12 355
Cummins#1 2501 Cummins CG- 280 hp, 206 kW, 2004
Catalytic Converters 14,617 29 767
Cummins#2 2502 14,799 43 000
Cummins#3 2503
Orion 2005 Cummins
CG- 280 hp, 206 kW, 2005
19,334
14,680 7555
Diesel#1 9643 Engelhard DPX 13,553 815 013,
newer engine
Diesel#2 9654
Orion 1992 (2003
engines)
DDC S50 275 hp/202 kW,2003
17,896 Johnson-Matthey CCRT
13,480 938 919, newer engine
4.5 Presentation of results
Each laboratory reports distance-specific emission figures and fuel consumption. The template for reporting was not rigidly fixed, and therefore the format for reporting varies from laboratory to laboratory. In the next Chapters, the results from the individual laboratories are presented. In Chapter 8, a comparison of the results generated using the three common duty cycles is presented.
Environment Canada and West Virginia University produced reports of their own measurements, reports which were incorporated in this summary report compiled by VTT. The Environment Canada and West Virginia reports are:
• Regulated Emissions and Fuel Economy Results of a Conventional Urban Bus. Cummins ISL 8.3L Model Year 2005. Allison Electric Drives Conventional Transmission Test Program. ERMD Report 05-24-03. Prepared by Greg Rideout. Environment Canada, Environmental Technology Centre, Emissions Research and Measurement Division.
• Allison EP System Electric Hybrid Test Program. Regulated Emissions and Fuel Economy Results. Cummins ISL 8.3L Bus Configuration. ERMD Report 05-24-01. Prepared by Greg Rideout. Environment Canada, Environmental Technology Centre, Emissions Research and Measurement Division.

23
• Emissions and Fuel Economy from Diesel and Natural Gas Transit Buses. Prepared by Center for Alternative Fuels, Engines, and Emissions. West Virginia University, Morgantown, WV 26506-6106. Draft Report, October 2006.
For this report, VTT converted Environment Canada and West Virginia University results into metric units, and metric units are used throughout the report.

24
5. VTT results
5.1 General
At VTT, the vehicles were measured unladen and fully loaded, and the values for half load used for comparison were obtained through interpolation. The results for regulated emissions, CO2 and fuel consumption are presented in the form of graphs, one for the fully loaded vehicle and one for the unladen vehicle. The duty cycles are sequenced based on fuel consumption of the Euro 3 -diesel bus (i.e. NYBus giving the highest fuel consumption) is presented first. Special emission measurements (ammonia, particle size number distribution) as well as analysis of the actual engine load pattern were carried out using the NYBus and Braunschweig-cycles.
Figure 5.1 shows the effect of load and duty cycle on the NOx-emission of the Euro 3 -diesel bus. One of the cycles, Braunschweig, was run on four different loads. The Figure shows very well that in this case, emissions increase linearly with weight. Therefore it was decided that interpolated values can be used for comparison.
NOx emissions vs. vehicle weight
0
2
4
6
8
10
12
14
16
11000 12000 13000 14000 15000 16000 17000 18000 19000
Weight kg
NO
x em
issi
ons
g/km
ADEME
ORANGE CBC
BRAUNSCHWEIG
HELSINKI 1
ECE
WTVC
Figure 5.1. Effect of load and duty cycle on the NOx-emission of the Euro 3 -diesel bus.

25
5.2 Regulated emissions, CO2 and fuel consumption
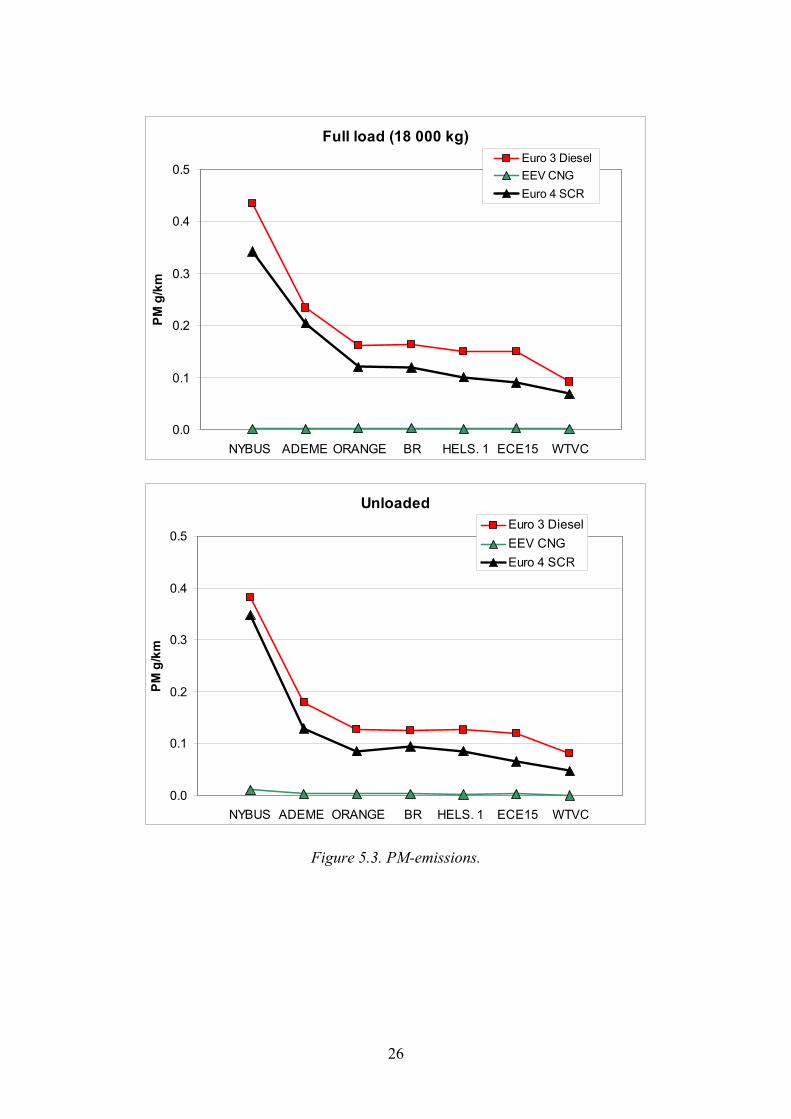
The results for regulated emissions (NOx, PM, CO, THC) are presented in Figures 5.2 to 5.5, carbon dioxide (CO2) in Figure 5.6, and finally fuel and energy consumption in Figures 5.7 and 5.8.
Full load (18 000 kg)
NYBUS ADEME ORANGE BR HELS. 1 ECE15 WTVC0
5
10
15
20
25
30
35
NO
x g/
km
Euro 3 DieselEEV CNGEuro 4 SCR
Unloaded
NYBUS ADEME ORANGE BR HELS. 1 ECE15 WTVC0
5
10
15
20
25
30
35
NO
x g/
km
Euro 3 DieselEEV CNGEuro 4 SCR
Figure 5.2. NOx-emissions.
26
Full load (18 000 kg)
NYBUS ADEME ORANGE BR HELS. 1 ECE15 WTVC0.0
0.1
0.2
0.3
0.4
0.5PM
g/k
mEuro 3 DieselEEV CNGEuro 4 SCR
Unloaded
NYBUS ADEME ORANGE BR HELS. 1 ECE15 WTVC0.0
0.1
0.2
0.3
0.4
0.5
PM g
/km
Euro 3 DieselEEV CNGEuro 4 SCR
Figure 5.3. PM-emissions.

27
Full load (18 000 kg)
WTVCECE15HELS. 1BRORANGEADEMENYBUS0
10
20
30
40
50C
O g
/km
Euro 3 DieselEEV CNGEuro 4 SCR
Unloaded
WTVCECE15HELS. 1BRORANGEADEMENYBUS0
10
20
30
40
50
CO
g/k
m
Euro 3 DieselEEV CNGEuro 4 SCR
Figure 5.4. CO-emissions.

28
Full load (18 000 kg)
WTVCECE15HELS. 1BRORANGEADEMENYBUS0.0
1.0
2.0
3.0
4.0
5.0TH
C g
/km
Euro 3 DieselEEV CNGEuro 4 SCR
Unloaded
WTVCECE15HELS. 1BRORANGEADEMENYBUS0.0
1.0
2.0
3.0
4.0
5.0
THC
g/k
m
Euro 3 DieselEEV CNGEuro 4 SCR
Figure 5.5. THC-emissions.

29
Full load (18 000 kg)
NYBUS ADEME ORANGE BR HELS. 1 ECE15 WTVC0
500
1000
1500
2000
2500
3000
3500C
O2
g/km
Euro 3 DieselEEV CNGEuro 4 SCR
Unloaded
NYBUS ADEME ORANGE BR HELS. 1 ECE15 WTVC0
500
1000
1500
2000
2500
3000
3500
CO
2 g/
km
Euro 3 DieselEEV CNGEuro 4 SCR
Figure 5.6. CO2-emissions.

30
Full load (18 000 kg)
NYBUS ADEME ORANGE BR HELS. 1 ECE15 WTVC0
20
40
60
80
100
120FC
kg/
100k
mEuro 3 DieselEEV CNGEuro 4 SCR
Unloaded
NYBUS ADEME ORANGE BR HELS. 1 ECE15 WTVC0
20
40
60
80
100
120
FC k
g/10
0km
Euro 3 DieselEEV CNGEuro 4 SCR
Figure 5.7. Fuel consumption.

31
Full load (18 000 kg)
WTVCECE15HELS. 1BRORANGEADEMENYBUS0
10
20
30
40
50
60EC
MJ/
kmEuro 3 DieselEEV CNGEuro 4 SCR
Unloaded
NYBUS ADEME ORANGE BR HELS. 1 ECE15 WTVC0
10
20
30
40
50
60
EC M
J/km
Euro 3 DieselEEV CNGEuro 4 SCR
Figure 5.8. Energy consumption.

32
The results show that distance-specific emissions and fuel consumption vary with duty cycle, load and vehicle technology. The biggest differences between vehicles can be found in particulate emissions. Independent of cycle and load, the natural gas provides by far the lowest particulate emissions.
In the case of diesel vehicles the Euro 4 -vehicle is better than the Euro 3 -regarding particulate emissions, but not so much better than the difference in emission limit values would suggest. For the diesel vehicles, particulate emissions increase with increasing fuel consumption.
NOx-emissions are highly dependent on both duty cycle and load. The stoichiometric natural gas vehicle provides good NOx-emission performance independent of cycle or load. As can be expected, the NOx-emissions of the SCR diesel vehicle varies significantly. At its best, the SCR-vehicle gives NOx-emissions comparable to those of the stoichiometric natural gas vehicle, in fact, much lower than required for Euro 4. In the Braunschweig-cycle with full load, the NOx-level corresponds to less than 1 g NOx/kWh at the engine crankshaft (see 5.3).
However, in cycles with low average speed (e.g. NYBus, Paris) or alternative low load (ECE R15), exhaust temperature is too low for the SCR-system to work properly. Figure 5.9 shows the amount of urea injected relative to fuel consumption. On full load, the Euro 4 SCR -vehicle gives lower NOx-emissions in all cycles compared with the Euro 3 -vehicle. When empty, the SCR-vehicle has higher NOx-emissions than the Euro 3 -vehicle in NYBus-, Paris- and ECE R15 -cycles.
Urea consumption
0.0 %
1.0 %
2.0 %
3.0 %
4.0 %
5.0 %
6.0 %
7.0 %
8.0 %
9.0 %
10.0 %
NYBUS
ADEME
ORANGE
BRAUNSCHWEIG
HELS.1
ECE15
WTVC
Ure
a C
onsu
mpt
ion
%-v
ol
Euro 4 SCR FullLoadEuro 4 SCRUnloaded
Figure 5.9. Urea consumption of the SCR-vehicle relative to fuel consumption.

33
Figure 5.10 demonstrates the effect of load on the NOx-emissions of the SCR-vehicle. When load increases, NOx-emissions go down in all cycles.
Effect of load on NOx emissions
0
5
10
15
20
25
30
35
NYBUS
ADEME
ORANGE CBC
BRAUNSCHWEIG
HELSIN
KI 1
ECE15
WTVC
g/km
FullUnladen
Figure 5.10. The effect of load on NOx-emissions of the SCR-vehicle.
CO-emissions are in general well below 10 g/km. In the NYBus cycle, however, the SCR-bus produces high CO-emissions, in the order of 40 g/km. THC-emissions do not provide any surprises. THC-values are below 1 g/km, with the exception of the natural gas vehicle, which gives values around 3 g/km in the NYBus cycle.
In all cycles, the Euro 3 -diesel was the most fuel efficient vehicle. However, the fuel consumption values are not fully comparable, as the layout of the drive line differs from vehicle to vehicle. The Euro 4 SCR -diesel vehicle consumes, on an average, some 10�15% more fuel compared with the Euro 3 -diesel vehicle. CO2-emissions are consequently higher in the same proportion. Part of this difference is explained by the full low-floor design and the portal axle of the Euro 4 SCR -vehicle. The relative difference is at maximum with unloaded vehicles, as light load accentuates the effects of additional power-train losses.
On full load, the natural gas bus is, on an average, marginally better than the Euro 3 -diesel bus for CO2-emissions, whereas without load, the CO2-emissions of the natural gas bus are close to those of the unladen SCR-bus.
The specific CO2-emission (in g/MJ) of methane is some 25% lower compared with diesel. Therefore the natural gas vehicle gives roughly equivalent tailpipe CO2-emissions

34
compared with diesel, despite of higher energy consumption. Compared with the Euro 3 -diesel vehicle, the natural bus consumes on an average 30% more energy when fully loaded and some 45% more when empty. The highest difference in energy consumption, 65% addition for the natural gas over the Euro 3 -diesel, can be found for unladen vehicles in the NYBus-cycle.
For fully loaded vehicles, the ratio between highest (NYBus) and lowest (WTVC) fuel consumption value is around 3.5 for the diesel vehicles and 3.75 for the natural gas vehicle. Corresponding values for unladen vehicles are a constant 3.5 for the diesel vehicles and 4.0 for the natural gas vehicle. This means that the fuel efficiency of the natural gas vehicle goes down with falling load.
NOx- and PM-emissions proportioned to fuel (g/l of fuel for the diesel vehicles and g/kg of fuel for the natural gas vehicle) are shown in Figures 5.11 (NOx) and 5.12 (PM).
In this comparison the Euro 3 -diesel vehicle is rather stable. NOx-emissions are 18�25 g NOx per liter of fuel, and PM-emissions 0.30�0.45 g/l. NYBus gives the highest values, WTVC the lowest values.
The situation is different in the case of the SCR-vehicle. Here exhaust gas temperature is decisive for SCR-catalyst performance and thus NOx-emissions. The NOx-emission varies on a wide range, from 2 to 30 g NOx per liter of fuel. The SCR system is at its best in the Braunschweig- and Helsinki 1 -cycles with the vehicle fully loaded, whereas the NYBus-cycle and the Paris-cycle produce equally high NOx-values for the unladen vehicle. When unladen, NOx-range is 6�30 g/l, with full load 2�17 g/l (on an average 2.4-times higher value for the unladen vehicle).
The variation in PM-emissions of the SCR-vehicle is much smaller, 0.16�0.33 g/l.
With the exception of the NYBus-cycle, the NOx-emission for the natural gas bus varies from 4 to 6 g per kg of fuel. NOx-emission for the NYBus-cycle is 7�8 g/kg. The variation in PM-emissions is rather high, but absolute PM-emissions are very low, 0.002 to 0.01 g/kg. Highest PM-value is for the NYBus-cycle with unladen vehicle.
The results for the various cycles are rather coherent for all vehicles. However, one duty cycle sticks out, and this is the artificial ECE R15 -cycle. This cycle forms a discontinuity for NOx in the case of the SCR diesel vehicle (see e.g. Figure 5.11) and fuel consumption of the natural gas vehicle. This indicates that, in order to achieve representative emission results, vehicles should be tested using cycles depicting actual load patterns (see also Chapter 8).

35
NOx emissions in proportion to fuel
0
5
10
15
20
25
30
35
NYBUS
ADEME
ORANGE CBC
BRAUNSCHWEIG
HELSIN
KI 1
ECE15
WTVC
g/l,
NG g
/kg
Euro 3 unladenEuro 3 fullEuro 4 SCR unladenEuro 4 SCR fullEEV NG unladenEEV NG full
Figure 5.11. NOx-emissions proportioned to fuel.
PM emissions in proportion to fuel
0
0.05
0.1
0.15
0.2
0.25
0.3
0.35
0.4
0.45
0.5
NYBUS
ADEME
ORANGE CBC
BRAUNSCHWEIG
HELSIN
KI 1
ECE15
WTVC
g/l,
NG g
/kg
Euro 3 unladenEuro 3 fullEuro 4 SCR unladenEuro 4 SCR fullEEV NG unladenEEV NG full
Figure 5.12. PM-emissions proportioned to fuel.

36
5.3 Engine load patterns and accumulated work
VTT evaluated the actual load profiles of the engines by collecting data from the CAN data bus on the control system of the engines. The CAN-data contains information on, among other things, instantaneous engine speed and torque. The analysis was performed for the Euro 3 -diesel bus and the natural gas bus in the Braunschweig- and NYBus-cycles.
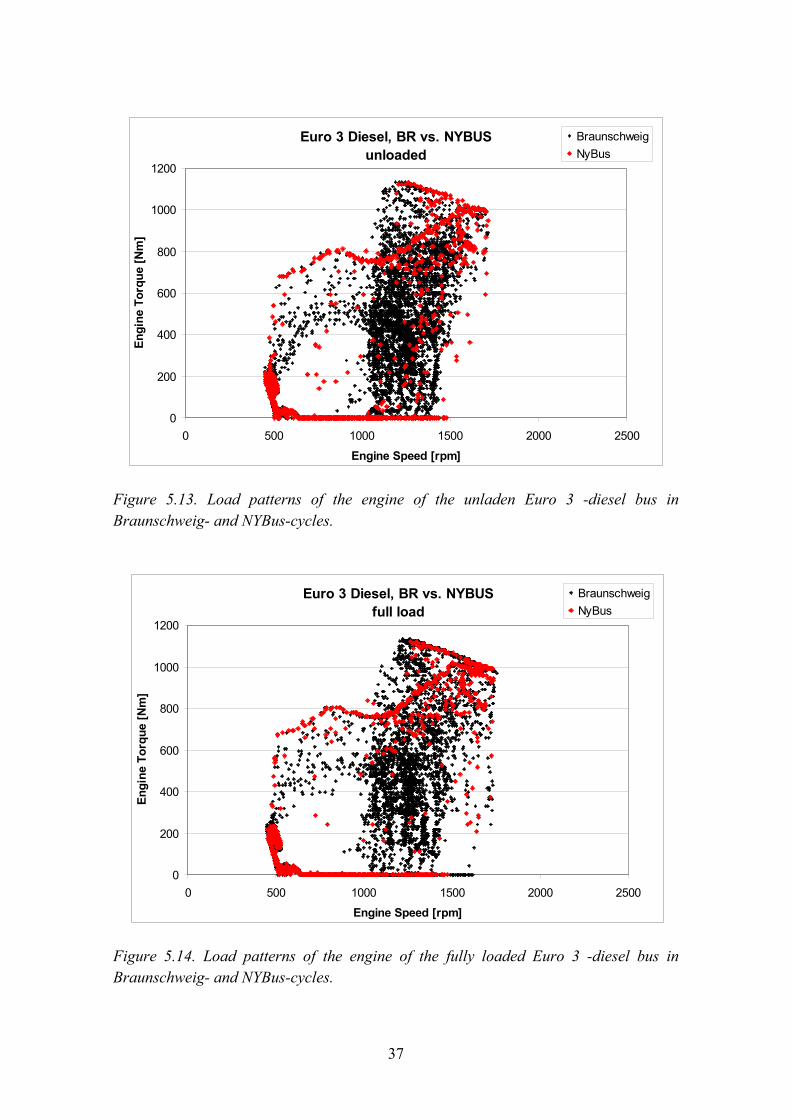
Figures 5.13 (unladen) and 5.14 (fully loaded) demonstrate the differences between these two cycles. The Figures are for the Euro 3 -diesel bus.
For the NYBus-cycle, idle dominates the load pattern. The idle periods are followed by short accelerations with full load. In the Figures these acceleration phases can be seen as a wavy trace starting at idle speed and a torque of some 700 Nm. Torque increases with engine rpm, reaching full torque at some 1,600 rpm. When starting up from standstill, vehicle controls limits engine torque, allowing full torque only at higher speeds and higher gears. When acceleration continues, torque fluctuates along the maximum torque curve, according to engine speed governed by gear shifting.
In the case of the Braunschweig-cycle, the acceleration phase is often followed by a phase of partial load, in which torque is 0�100% and engine speed is governed by the transmission. This area of partial load can be seen in the middle of Figures 5.9 and 5.10. This part load area does not exist in practice in the NYBus-cycle, in which short accelerations are almost immediately followed by braking.
Consequently, the various duty cycles emphasize the various part of the engine map differently. In principle, this makes it difficult to create fixed factors to be used for comparing emission and fuel consumption data from very different duty cycles. However, if a greater part of the work is done running on high torque, a scaling is possible (see Chapter 8).
Figure 5.15 shows the load patterns of the Euro 3 -diesel vehicle in the Braunschweig-cycle, vehicle fully loaded and unladen. The load patterns are almost identical, and it is difficult to distinguish differences in load. In reality, the share of full torque operation is slightly less with the unladen vehicle compared with the fully loaded vehicle.
37
Euro 3 Diesel, BR vs. NYBUSunloaded
0
200
400
600
800
1000
1200
0 500 1000 1500 2000 2500
Engine Speed [rpm]
Engi
ne T
orqu
e [N
m]
BraunschweigNyBus
Figure 5.13. Load patterns of the engine of the unladen Euro 3 -diesel bus in Braunschweig- and NYBus-cycles.
Euro 3 Diesel, BR vs. NYBUSfull load
0
200
400
600
800
1000
1200
0 500 1000 1500 2000 2500
Engine Speed [rpm]
Engi
ne T
orqu
e [N
m]
BraunschweigNyBus
Figure 5.14. Load patterns of the engine of the fully loaded Euro 3 -diesel bus in Braunschweig- and NYBus-cycles.

38
Euro 3 Diesel, Braunschweigunloaded vs. full load
0
200
400
600
800
1000
1200
0 500 1000 1500 2000 2500
Engine Speed [rpm]
Engi
ne T
orqu
e [N
m]
Full loadUnloaded
Figure 5.15 Load patterns of the Euro 3 -diesel vehicle in the Braunschweig-cycle, vehicle fully loaded and unladen.
Figures 5.16 (unladen) and 5.17 (fully loaded) shows load patterns for the engine of the natural gas bus. This vehicle is equipped with a naturally aspirated, 12 liter stoichiometric engine. In this case there is no need to limit torque when taking off, as maximum torque for this engine is significantly lower than for the turbocharged diesel engine. Compared with the diesel, the natural gas bus uses higher engine speeds, up to 2,000 rpm, to provide adequate power output. Also, in the case of the natural gas bus, the partial load area is almost non-existent for the NYBus-cycle.
As in the case of the diesel engine, for the Braunschweig-cycle, the unladen vehicle and fully loaded vehicle result in almost identical load patterns (Figure 5.18).

39
EEV CNG, BR vs. NYBUSunloaded
0
200
400
600
800
1000
1200
0 500 1000 1500 2000 2500Engine Speed [rpm]
Engi
ne T
orqu
e [N
m]
BraunschweigNyBus
Figure 5.16. Load patterns of the engine of the unladen EEV natural gas bus in Braunschweig- and NYBus-cycles.
EEV CNG, BR vs. NYBUSfull load
0
200
400
600
800
1000
1200
0 500 1000 1500 2000 2500Engine Speed [rpm]
Engi
ne T
orqu
e [N
m]
BraunschweigNyBus
Figure 5.17. Load patterns of the engine of the fully loaded EEV natural gas bus in Braunschweig- and NYBus-cycles.

40
EEV CNG, Braunschweigunloaded vs. full load
0
200
400
600
800
1000
1200
0 500 1000 1500 2000 2500Engine Speed [rpm]
Engi
ne T
orqu
e [N
m]
Full loadUnloaded
Figure 5.18. Load patterns of the EEV natural gas vehicle in the Braunschweig-cycle, vehicle fully loaded and unladen.
Figures 5.19 (Braunschweig) and 5.20 (NYBus) show load patterns of both buses when fully loaded.
This comparison clearly shows how the natural gas bus compensates lower torque with higher engine speeds. On partial load, the transmissions govern both engines to operate between 1,000 and 1,500 rpm. In some situations the engine of the natural gas bus operates on high engine speed, 1,500 to 1,700 rpm, for extended periods, whereas the diesel uses higher engine speeds only momentarily in full-throttle accelerations, resuming low-speed operation when power demand drops.

41
Braunschweig Euro 3 Diesel vs. EEV CNGfull load
0
200
400
600
800
1000
1200
0 500 1000 1500 2000 2500
Engine Speed [rpm]
Engi
ne T
orqu
e [N
m]
Euro 3 DieselEEV CNG
Figure 5.19. Load patterns in the Braunschweig-cycle for the Euro 3 -diesel bus and the EEV natural gas bus when fully loaded.
NyBus Euro 3 Diesel vs. EEV CNGfull load
0
200
400
600
800
1000
1200
0 500 1000 1500 2000 2500
Engine Speed [rpm]
Engi
ne T
orqu
e [N
m]
Euro 3 DieselEEV CNG
Figure 5.20. Load patterns in the NYBus-cycle for the Euro 3 -diesel bus and the EEV natural gas bus when fully loaded.
42
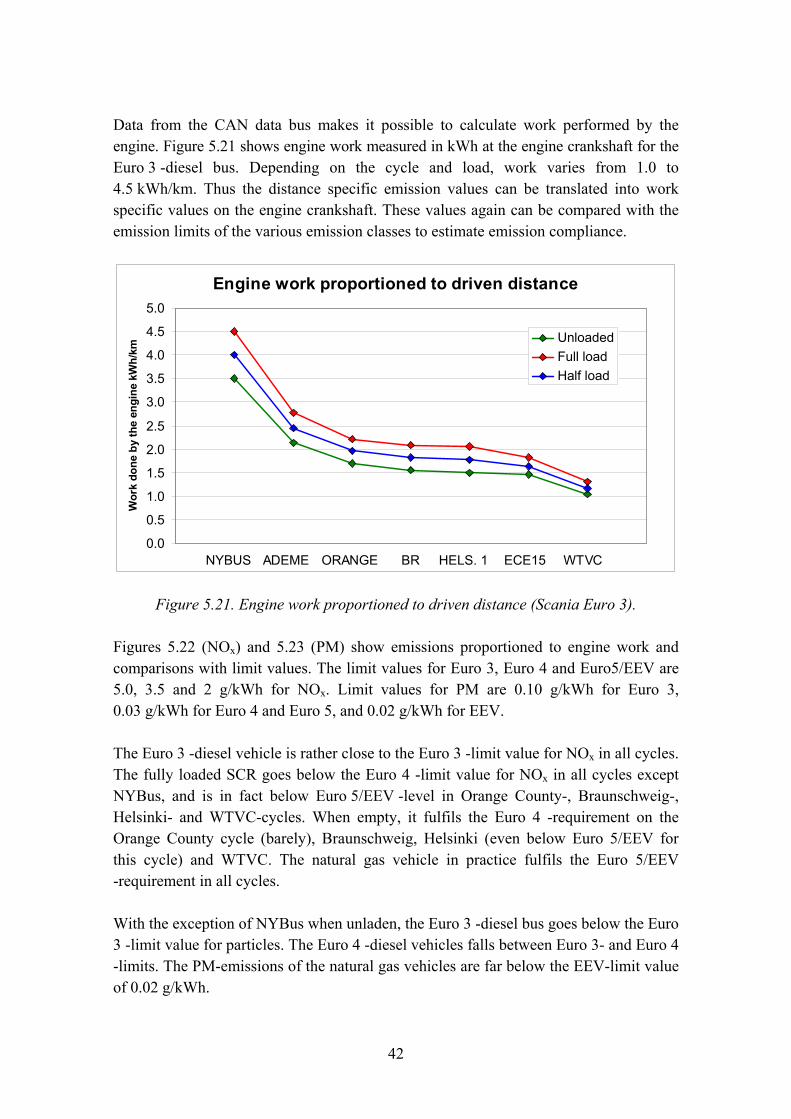
Data from the CAN data bus makes it possible to calculate work performed by the engine. Figure 5.21 shows engine work measured in kWh at the engine crankshaft for the Euro 3 -diesel bus. Depending on the cycle and load, work varies from 1.0 to 4.5 kWh/km. Thus the distance specific emission values can be translated into work specific values on the engine crankshaft. These values again can be compared with the emission limits of the various emission classes to estimate emission compliance.
Engine work proportioned to driven distance
WTVCECE15HELS. 1BRORANGEADEMENYBUS0.0
0.5
1.0
1.5
2.0
2.5
3.0
3.5
4.0
4.5
5.0
Wor
k do
ne b
y th
e en
gine
kW
h/km
UnloadedFull loadHalf load
Figure 5.21. Engine work proportioned to driven distance (Scania Euro 3).
Figures 5.22 (NOx) and 5.23 (PM) show emissions proportioned to engine work and comparisons with limit values. The limit values for Euro 3, Euro 4 and Euro5/EEV are 5.0, 3.5 and 2 g/kWh for NOx. Limit values for PM are 0.10 g/kWh for Euro 3, 0.03 g/kWh for Euro 4 and Euro 5, and 0.02 g/kWh for EEV.
The Euro 3 -diesel vehicle is rather close to the Euro 3 -limit value for NOx in all cycles. The fully loaded SCR goes below the Euro 4 -limit value for NOx in all cycles except NYBus, and is in fact below Euro 5/EEV -level in Orange County-, Braunschweig-, Helsinki- and WTVC-cycles. When empty, it fulfils the Euro 4 -requirement on the Orange County cycle (barely), Braunschweig, Helsinki (even below Euro 5/EEV for this cycle) and WTVC. The natural gas vehicle in practice fulfils the Euro 5/EEV -requirement in all cycles.
With the exception of NYBus when unladen, the Euro 3 -diesel bus goes below the Euro 3 -limit value for particles. The Euro 4 -diesel vehicles falls between Euro 3- and Euro 4 -limits. The PM-emissions of the natural gas vehicles are far below the EEV-limit value of 0.02 g/kWh.

43
Figures 5.22 and 5.23 to a high degree resemble Figures 5.11 and 5.12 (emissions proportioned to fuel).
NOx emission in proportion to engine work
01
23
45
67
89
NYBUS
ADEME
ORANGE
BRAUNSCHWEIG
HELSIN
KI 1
ECE15
WTVC
g/kW
h
Euro 3 fullEuro 3 unladenEuro 4 SCR fullEuro 4 SCR unladenEEV NG fullEEV NG unladen
Euro 3
Euro 4
Euro 5/EEV
NOx emission in proportion to engine work
01
23
45
67
89
NYBUS
ADEME
ORANGE
BRAUNSCHWEIG
HELSIN
KI 1
ECE15
WTVC
g/kW
h
Euro 3 fullEuro 3 unladenEuro 4 SCR fullEuro 4 SCR unladenEEV NG fullEEV NG unladen
Euro 3
Euro 4
Euro 5/EEV
Figure 5.22. NOx-emission in proportion to engine work.
PM emission in proportion to engine work
0
0.02
0.04
0.06
0.08
0.1
0.12
NYBUS
ADEME
ORANGE
BRAUNSCHWEIG
HELSIN
KI 1
ECE15
WTVC
g/kW
h
Euro 3 fullEuro 3 unladenEuro 4 SCR fullEuro 4 SCR unladenEEV NG fullEEV NG unladen
Euro 3
Euro 4/5EEV
PM emission in proportion to engine work
0
0.02
0.04
0.06
0.08
0.1
0.12
NYBUS
ADEME
ORANGE
BRAUNSCHWEIG
HELSIN
KI 1
ECE15
WTVC
g/kW
h
Euro 3 fullEuro 3 unladenEuro 4 SCR fullEuro 4 SCR unladenEEV NG fullEEV NG unladen
Euro 3
Euro 4/5EEV
Figure 5.23. PM-emission in proportion to engine work.

44
5.4 Unregulated emissions
VTT also performed analyses of some unregulated emission components, i.e. ammonia (NH3) and particle number size distribution. The measurements were done for the Braunschweig- and the NYBus-cycles.
The results for ammonia are presented as concentration in undiluted exhaust. Figures 5.24 (Euro 3 diesel), 5.25 (Euro 4 SCR diesel) and 5.26 (EEV natural gas) show the ammonia traces in the Braunschweig-cycle for fully loaded vehicles. Average ammonia concentration for the Euro 3 -diesel bus was below 1 ppm in all cases (fully loaded and unladen). In the case of the Euro 4 SCR -vehicle, ammonia concentration was also very low, below 3 ppm, and no signs of ammonia slip were detected. The ammonia concentration for the natural gas vehicle was equivalent to the one of the SCR diesel vehicle. Occasionally some spikes of ammonia could be seen in the exhaust of the natural gas vehicle. These spikes were, however, irregular.
NH3 Scania Euro 3, Braunschweig, Full load
0
5
10
15
20
25
30
0 200 400 600 800 1000 1200 1400 1600
s
ppm ka 0,6 ppm
Figure 5.24. Ammonia trace for the Euro 3 -diesel vehicle (Braunschweig, full load).

45
NH3 Volvo Euro 4 SCR, Braunschweig, Full load
0
5
10
15
20
25
30
0 200 400 600 800 1000 1200 1400 1600
s
ppm ka 1,9 ppm
Figure 5.25. Ammonia trace for the Euro 4 SCR -diesel vehicle (Braunschweig, full load).
NH3 MAN EEV CNG, Braunschweig, Full load
0
5
10
15
20
25
30
0 200 400 600 800 1000 1200 1400 1600
s
ppm ka 2,4 ppm
Figure 5.26. Ammonia trace for the EEV natural gas vehicle (Braunschweig, full load).

46
Figure 5.27 shows the particle number size distribution for the three vehicle technologies. The results are presented using logarithmic scales. The results are averages calculated from four runs, two with fully loaded vehicles and two with unladen vehicles.
The Figure shows two things. Firstly, the Euro 3 -diesel and the Euro 4 SCR -diesel produce roughly equivalent particle numbers, with only slightly less particles for the Euro 4 SCR -vehicle. The difference compared with the natural gas vehicle is very clear, three orders of magnitude at maximum.
Secondly, duty cycle affects particle numbers. This is true for all vehicles. However, the effect is not as dramatic for the diesel vehicles as for the natural gas vehicles. In the case of the natural gas vehicles, going from Braunschweig to NYBus, particle numbers increase with up to two orders of magnitude. The share of idle is very high in the NYBus-cycle. When running on idle, the throttled gas engine most probably draws some oil through the valve guides, oil which then increases, to a certain extent, particle mass, but most of all, particle numbers.
1.E+07
1.E+08
1.E+09
1.E+10
1.E+11
1.E+12
1.E+13
1.E+14
1.E+15
0.01 0.10 1.00 10.00
Particle diameter Da [µm]
Parti
cle
num
ber
dN/d
logD
p [#
km]
DI Euro 3 Br
DI Euro 3 NY
DI Euro 4 Br
DI Euro 4 NY
CNV EEV Br
CNV EEV NY
Figure 5.27. Particle number size distribution for the three vehicle technologies. Braunschweig- and NYBus-cycles, Logarithmic scales.

47
6. Environment Canada results
6.1 General
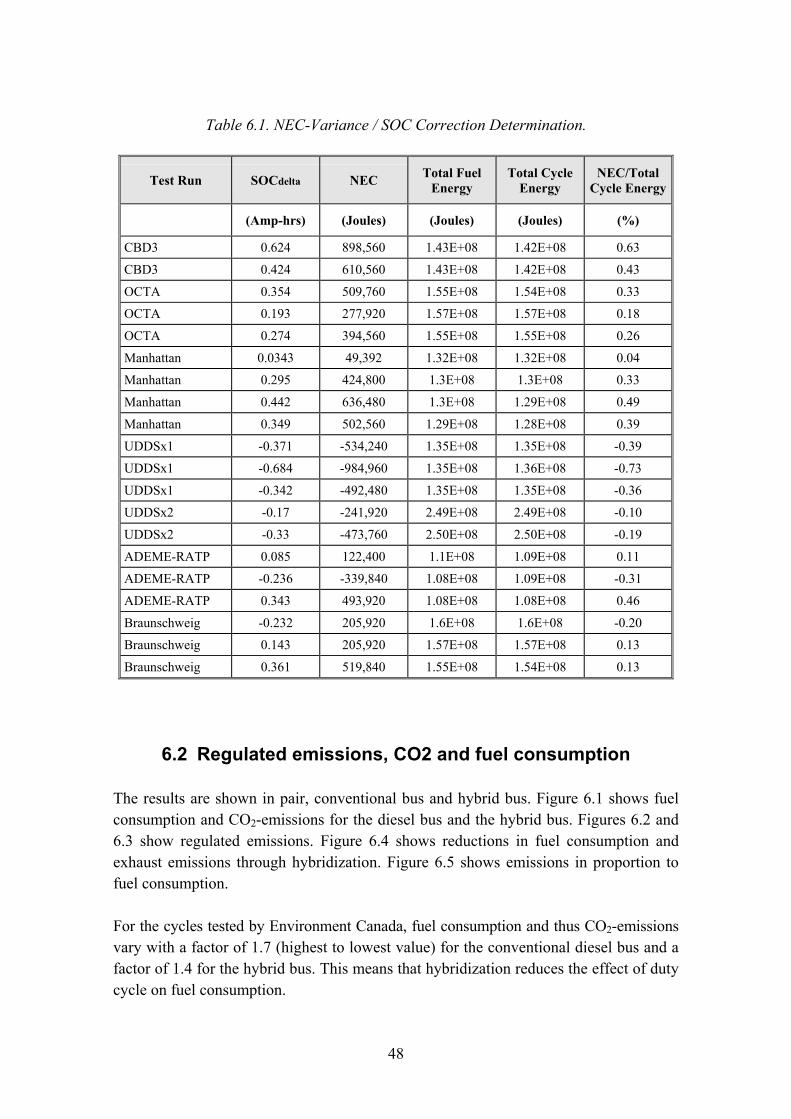
Environment Canada presented their results in two separate reports, one for the conventional diesel and one for the hybrid-electric vehicle. Results were presented primarily in the form of tables. For this summary report, the results are presented in graphic form. Environment Canada reports regulated emissions and fuel consumption for the two vehicles. In this case the cycles are also sequenced based on fuel consumption.
For a hybrid-electric vehicle (HEV), as opposed to a conventional vehicle, it is necessary to determine if any energy was added to or removed from the system by the Rechargeable Energy Storage System (RESS). If the State of Charge (SOC) changes sufficiently over the total length of a test run it may impact the Net Energy Change (NEC) to a great enough extent to necessitate correction of the data. This is known as SOC correction. This procedure is necessary in order to compare the emission results of an HEV to a conventional vehicle.
In the case of a system such as the one present on the Allison hybrid bus the following equation is used to determine if a test run has acceptable Net Energy Change (NEC):
NEC Total cycle energy *100% ≤ 1%
(6.1)
If the absolute value of the calculation yields a number less than or equal to 1% the NEC variance is within tolerance and the emissions and fuel economy values for that test run do not need to be corrected for SOC. If the absolute value of the calculation yields a number greater than 1%, but less than 5%, emissions and fuel economy values from the test run need to be corrected for SOC. Test runs greater than ±5% are considered invalid.
Table 6.1 presents the results of the NEC-variance determination performed on all test runs including the cold start warm-ups and preconditioning cycles. It can be seen from Table 6.1 that all of the test runs experienced an NEC-variance of less than 1%.
48
Table 6.1. NEC-Variance / SOC Correction Determination.
Test Run SOCdelta NEC Total Fuel Energy
Total Cycle Energy
NEC/Total Cycle Energy
(Amp-hrs) (Joules) (Joules) (Joules) (%)
CBD3 0.624 898,560 1.43E+08 1.42E+08 0.63
CBD3 0.424 610,560 1.43E+08 1.42E+08 0.43
OCTA 0.354 509,760 1.55E+08 1.54E+08 0.33
OCTA 0.193 277,920 1.57E+08 1.57E+08 0.18
OCTA 0.274 394,560 1.55E+08 1.55E+08 0.26
Manhattan 0.0343 49,392 1.32E+08 1.32E+08 0.04
Manhattan 0.295 424,800 1.3E+08 1.3E+08 0.33
Manhattan 0.442 636,480 1.3E+08 1.29E+08 0.49
Manhattan 0.349 502,560 1.29E+08 1.28E+08 0.39
UDDSx1 -0.371 -534,240 1.35E+08 1.35E+08 -0.39
UDDSx1 -0.684 -984,960 1.35E+08 1.36E+08 -0.73
UDDSx1 -0.342 -492,480 1.35E+08 1.35E+08 -0.36
UDDSx2 -0.17 -241,920 2.49E+08 2.49E+08 -0.10
UDDSx2 -0.33 -473,760 2.50E+08 2.50E+08 -0.19
ADEME-RATP 0.085 122,400 1.1E+08 1.09E+08 0.11
ADEME-RATP -0.236 -339,840 1.08E+08 1.09E+08 -0.31
ADEME-RATP 0.343 493,920 1.08E+08 1.08E+08 0.46
Braunschweig -0.232 205,920 1.6E+08 1.6E+08 -0.20
Braunschweig 0.143 205,920 1.57E+08 1.57E+08 0.13
Braunschweig 0.361 519,840 1.55E+08 1.54E+08 0.13
6.2 Regulated emissions, CO2 and fuel consumption
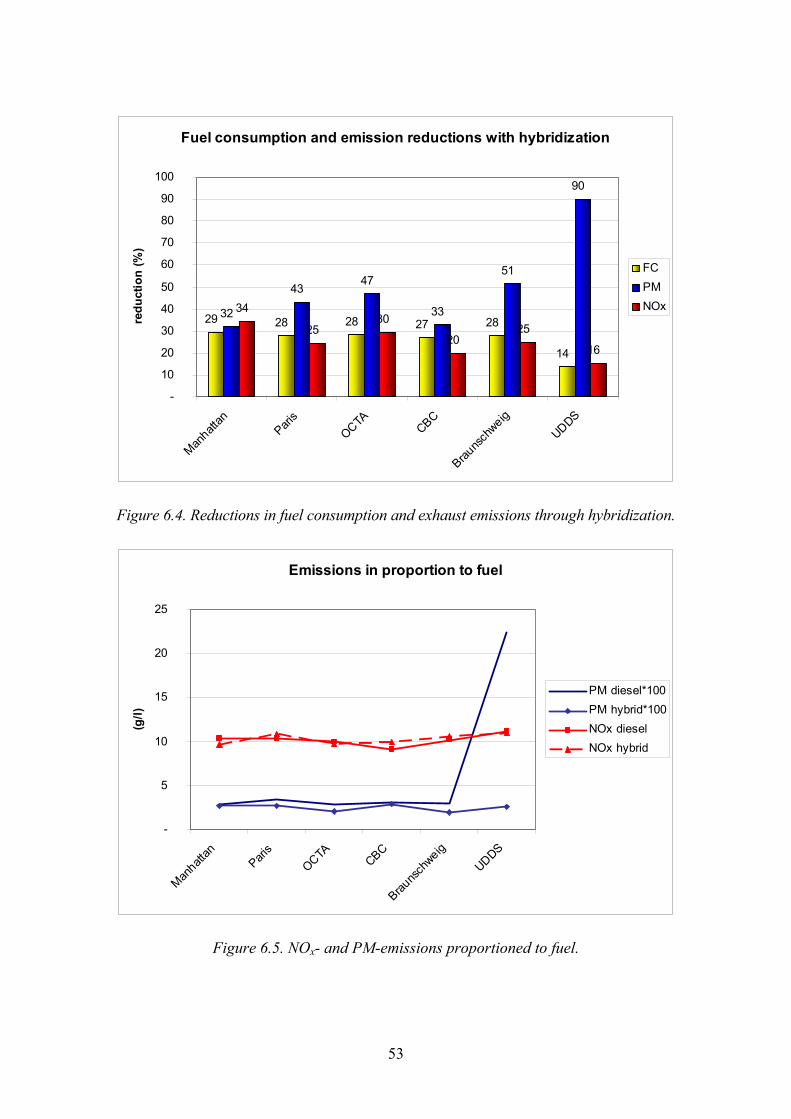
The results are shown in pair, conventional bus and hybrid bus. Figure 6.1 shows fuel consumption and CO2-emissions for the diesel bus and the hybrid bus. Figures 6.2 and 6.3 show regulated emissions. Figure 6.4 shows reductions in fuel consumption and exhaust emissions through hybridization. Figure 6.5 shows emissions in proportion to fuel consumption.
For the cycles tested by Environment Canada, fuel consumption and thus CO2-emissions vary with a factor of 1.7 (highest to lowest value) for the conventional diesel bus and a factor of 1.4 for the hybrid bus. This means that hybridization reduces the effect of duty cycle on fuel consumption.

49
Regarding emissions, both vehicles are rather predictable. NOx-emission varies from 5.1 to 8.4 g/km for the conventional bus and 4.0 to 6.0 g/km for the hybrid bus. Particulate emissions are low, generally 0.01 to 0.02 g/km. However, in the case of the conventional diesel bus, the UDDS-cycle resulted in rather high particulate emissions, approximately 0.1 g/km. This could partly be explained by some kind of malfunction or software glitch of the conventional diesel for this particular test cycle. CO- and THC-emissions were low, as can be expected with catalyzed particulate filters.
On average, hybridization saves some 25% fuel, and reduces NOx-emissions 25% and particulate emissions 50%. Transients are critical in particulate formation. As the hybrid system smooths out engine operation, particle emissions are lowered even more than fuel consumption and NOx-emissions. The great reduction in PM-emissions in the UDDS-cycle might not fully be attributed to hybridization, as the PM-emissions were �out-of-line� for the conventional diesel vehicle.
When NOx- and particulate emissions were proportioned to fuel consumption, it was found that the emissions are very stable, NOx-emissions 9�11 g/l of fuel and PM-emission (with the exception of the UDDS-cycle) 0.02�0.03 g/l of fuel for both the conventional and the hybrid vehicle. This means that independent of the duty cycle, the emissions can be rather accurately estimated based on fuel consumption.
The results are coherent, with the exception of the PM result for the conventional diesel bus in the UDDS-cycle. This abnormality is, most probably, more related to the vehicle itself than to the test cycle.

50
New Flyer Diesel MY 2005
0.81 0.760.58 0.56 0.56
0.47
2.111.99
1.51 1.47 1.47
1.22
-
0.5
1.0
1.5
2.0
2.5
Manhattan Paris OCTA CBC Braunschweig UDDS
FC (l
/km
), CO
2 (k
g/km
)
FCCO2
New Flyer Hybrid MY 2005
0.57 0.550.42 0.41 0.41 0.40
1.48 1.43
1.09 1.07 1.06 1.05
-
0.5
1.0
1.5
2.0
2.5
Manhattan Paris OCTA CBC Braunschweig UDDS
FC (l
/km
), CO
2 (k
g/km
)
FCCO2
Figure 6.1. Fuel consumption and CO2-emissions.

51
New Flyer Diesel MY 2005
2.3 2.61.6 1.8 1.7
10.4
8.4 7.9
5.75.1
5.7 5.2
-
2.5
5.0
7.5
10.0
12.5
15.0
Manhatt
anPari
sOCTA CBC
Brauns
chweig
UDDS
(g/k
m)
PM*100NOx
New Flyer Hybrid MY 2005
1.6 1.50.9 1.2 0.8 1.1
5.5 6.0
4.0 4.1 4.3 4.4
-
2.5
5.0
7.5
10.0
12.5
15.0
Manhatt
anPari
sOCTA CBC
Brauns
chweig
UDDS
(g/k
m)
PM*100NOx
Figure 6.2. NOx- and PM-emissions.

52
New Flyer Diesel MY 2005
0.040.04
0.040.04
0.020.01
0.00
0.07
0.030.04 0.04
0.01
-
0.025
0.050
0.075
0.100
0.125
0.150
Manhatt
anPari
sOCTA CBC
Brauns
chweig
UDDS
(g/k
m)
COTHC
New Flyer Hybrid MY 2005
0.060.04
0.04 0.04
0.02 0.02
0.040.05
0.02 0.02 0.020.01
-
0.025
0.050
0.075
0.100
0.125
0.150
Manhatt
anPari
sOCTA CBC
Brauns
chweig
UDDS
(g/k
m) CO
THC
Figure 6.3. CO- and THC-emissions.
53
Fuel consumption and emission reductions with hybridization
29 28 28 27 28
14
32
43 47
33
51
90
34
25 30
20 25
16
-
10
20
30
40
50
60
70
80
90
100
Manhatt
anPari
sOCTA CBC
Brauns
chweig
UDDS
redu
ctio
n (%
)
FCPMNOx
Figure 6.4. Reductions in fuel consumption and exhaust emissions through hybridization.
Emissions in proportion to fuel
-
5
10
15
20
25
Manhatt
anPari
sOCTA CBC
Brauns
chweig
UDDS
(g/l)
PM diesel*100PM hybrid*100NOx dieselNOx hybrid
Figure 6.5. NOx- and PM-emissions proportioned to fuel.

54
7. West Virginia University results 7.1 General
West Virginia University had the most comprehensive text matrix, both regarding test cycles and vehicle numbers. In its report, WVU presented results for the individual vehicles, both in the form of tables and graphs. However, in this summary report results have been averaged for the natural gas buses. Results are presented in graphical form, and the duty cycles are sequenced based on fuel consumption of the diesel vehicles.
The two diesel buses used different after-treatment systems, as presented in Table 4.2. It was suggested by the manufacturer that exhaust gas recirculation (EGR) on the first bus may not have functioned properly during the test period. The first bus showed higher CO- and NOx-emissions than the second bus, and poorer fuel economy. Therefore only data from the second bus is considered for the analyses.
7.2 Regulated emissions, CO2 and fuel consumption
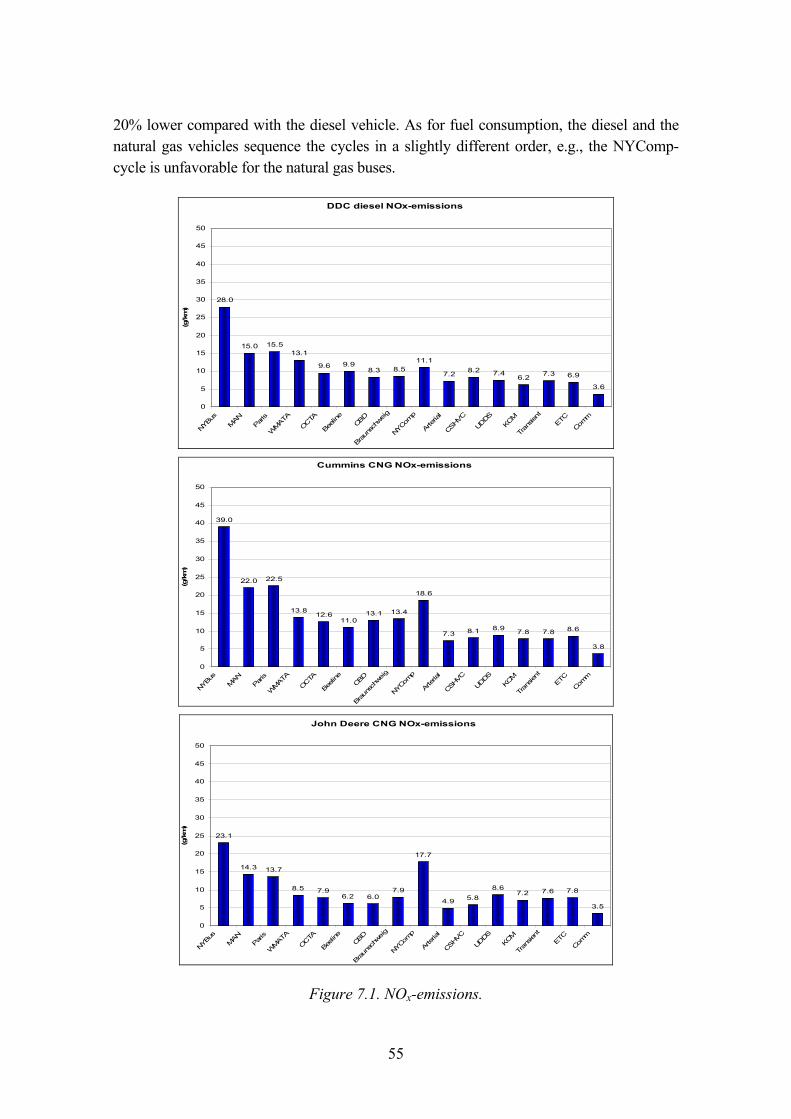
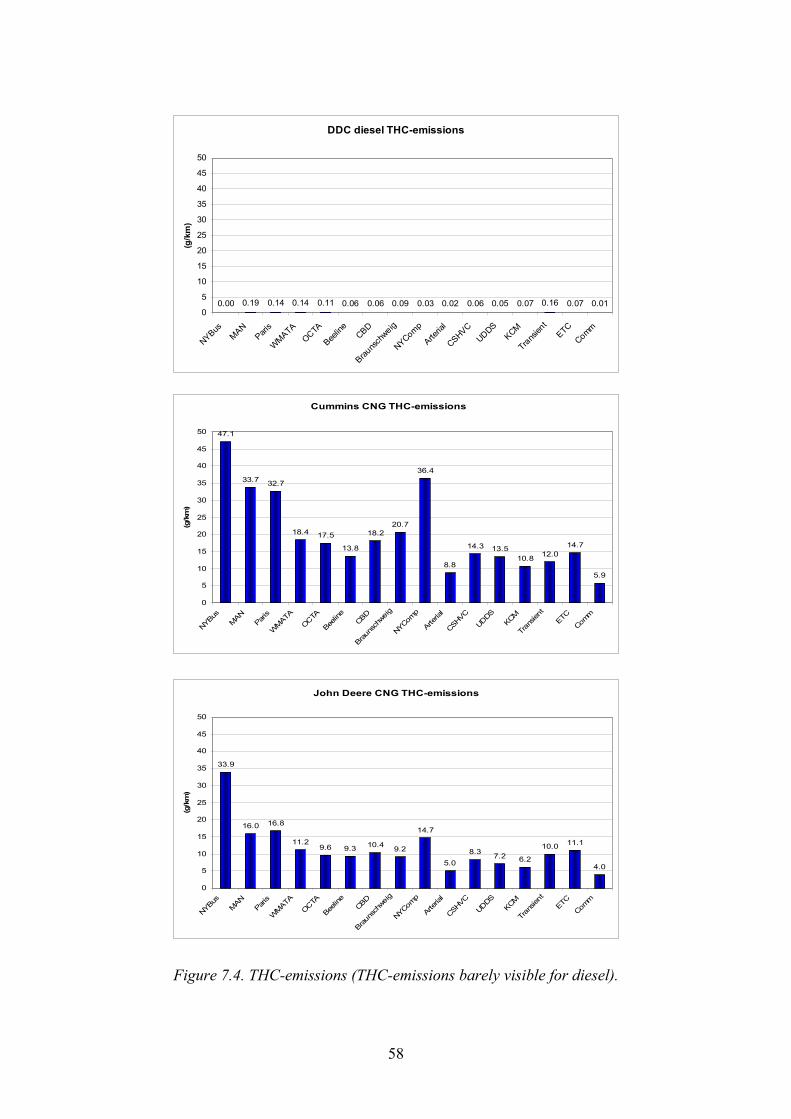
The results are shown in groups of three (DDC diesel, Cummins natural gas and John Deere natural gas). Figure 7.1 to 7.4 present regulated emissions, Figure 7.5 CO2-emissions and Figure 7.6 fuel consumption. Figure 7.7 shows equivalent CO2-emissions of the natural gas buses. Figures 7.8 (NOx) and 7.9 (PM) show emissions proportioned to fuel.
With the exception of THC, all vehicles provide rather similar emission performance. The DDC -diesel bus and John Deere -natural gas buses give roughly equivalent NOx-emissions (on an average some 10 g/km), while the Cummins -natural gas buses showed on average 14 g/km of NOx emissions. Also for PM, the DDC diesel bus and John Deere -natural gas buses are equal; average PM-emission is 0.015 g/km. The Cummins -natural gas buses have lower PM-emissions, on an average 0.01 g/km. These PM emissions were sufficiently low that they were difficult to quantify accurately.
CO is low for the DDC -diesel bus and the John Deere -natural gas buses, some 0.05 g/km, and tenfold, 0.5 g/km, for the Cummins -natural gas buses. Both natural gas buses produce high THC-emissions (primarily unburned methane, which is not regulated). Maximum values are for the NYBus-cycle and are 47 g/km (Cummins) and 34 g/km (John Deere). Average THC-values are 20 and 12 g/km, respectively, whereas the average THC-value for the diesel vehicle is only 0.01 g/km.
The fuel consumption (expressed as diesel fuel equivalent, average of all cycles) of the John Deere -natural gas buses is equivalent of one of the diesel, and this gives, due to fuel chemistry, a 25% reduction in CO2-emissions. In the case of the Cummins-buses, fuel consumption is some 10% higher than the diesel vehicle, so that CO2-emission is close to
55
20% lower compared with the diesel vehicle. As for fuel consumption, the diesel and the natural gas vehicles sequence the cycles in a slightly different order, e.g., the NYComp-cycle is unfavorable for the natural gas buses.
DDC diesel NOx-emissions
28.0
15.0 15.513.1
9.6 9.98.3 8.5
11.1
7.2 8.2 7.46.2 7.3 6.9
3.6
0
5
10
15
20
25
30
35
40
45
50
NYBu
sMAN
Paris
WMAT
A
OCTA
Beeli
neCB
D
Brau
nsch
weig
NYCo
mp
Arteria
l
CSHV
C
UDDS
KCM
Tran
sient
ETC
Comm
(g/k
m)
Cummins CNG NOx-emissions
39.0
22.0 22.5
13.812.6
11.013.1 13.4
18.6
7.3 8.1 8.9 7.8 7.8 8.6
3.8
0
5
10
15
20
25
30
35
40
45
50
NYBu
sMAN
Paris
WMAT
A
OCTA
Beeli
neCB
D
Brau
nsch
weig
NYCo
mp
Arteria
l
CSHV
C
UDDS
KCM
Tran
sient
ETC
Comm
(g/k
m)
John Deere CNG NOx-emissions
23.1
14.3 13.7
8.5 7.96.2 6.0
7.9
17.7
4.9 5.88.6
7.2 7.6 7.8
3.5
0
5
10
15
20
25
30
35
40
45
50
NYBu
sMAN
Paris
WMAT
A
OCTA
Beeli
neCB
D
Brau
nsch
weig
NYCo
mp
Arteria
l
CSHV
C
UDDS
KCM
Tran
sient
ETC
Comm
(g/k
m)
Figure 7.1. NOx-emissions.

56
DDC diesel PM-emissions
0.04
0.01 0.01 0.01 0.01 0.01
0.020.01 0.01
0.03
0.01 0.01
0.04
0.010.02
0.01
0
0.02
0.04
0.06
0.08
0.1
NYBusMAN
Paris
WMATAOCTA
Beelin
eCBD
Brauns
chweig
NYComp
Arteria
l
CSHVCUDDS
KCM
Transien
tETC
Comm
(g/k
m)
Cummins CNG PM-emissions
0.03
0.010.01 0.01 0.01 0.01
0.00
0.02 0.01
0.00 0.00
0.010.01
0.010.01
0.01
0
0.02
0.04
0.06
0.08
0.1
NYBusMAN
Paris
WMATAOCTA
Beelin
eCBD
Brauns
chweig
NYComp
Arteria
l
CSHVCUDDS
KCM
Transien
tETC
Comm
(g/k
m)
John Deere CNG PM-emissions
0.06
0.02
0.01 0.01 0.010.01 0.01 0.01
0.01
0.000.01
0.020.02
0.000.01
0.03
0
0.02
0.04
0.06
0.08
0.1
NYBusMAN
Paris
WMATAOCTA
Beelin
eCBD
Brauns
chweig
NYComp
Arteria
l
CSHVCUDDS
KCM
Transien
tETC
Comm
(g/k
m)
Figure 7.2. PM-emissions.

57
DDC diesel CO-emissions
0.000.07
0.200.04 0.03 0.04 0.03 0.08 0.02 0.00 0.03 0.04 0.04
0.120.00 0.00
0
0.25
0.5
0.75
1
1.25
1.5
1.75
2
NYBusMAN
Paris
WMATA
OCTA
Beelin
eCBD
Brauns
chweig
NYComp
Arteria
l
CSHVCUDDS
KCM
Trans
ient
ETCComm
(g/k
m)
Cummins CNG CO-emissions
1.45
1.03
1.27
0.35 0.400.23
0.14
0.56
0.93
0.17 0.23 0.16 0.19 0.12 0.07 0.07
0
0.25
0.5
0.75
1
1.25
1.5
1.75
2
NYBusMAN
Paris
WMATAOCTA
Beelin
eCBD
Brauns
chweig
NYComp
Arteria
l
CSHVCUDDS
KCM
Trans
ient
ETCComm
(g/k
m)
John Deere CNG CO-emissions
0.23 0.21
0.01 0.07 0.03 0.03 0.03 0.07 0.04 0.02 0.03 0.03 0.00 0.00 0.02 0.030
0.25
0.5
0.75
1
1.25
1.5
1.75
2
NYBusMAN
Paris
WMATA
OCTA
Beelin
eCBD
Brauns
chweig
NYComp
Arteria
l
CSHVCUDDS
KCM
Trans
ient
ETCComm
(g/k
m)
Figure 7.3. CO-emissions.
58
DDC diesel THC-emissions
0.00 0.19 0.14 0.14 0.11 0.06 0.06 0.09 0.03 0.02 0.06 0.05 0.07 0.16 0.07 0.010
5
10
15
20
25
30
35
40
45
50
NYBusMAN
Paris
WMATA
OCTA
Beelin
eCBD
Brauns
chweig
NYComp
Arteria
l
CSHVCUDDS
KCM
Trans
ient
ETCComm
(g/k
m)
Cummins CNG THC-emissions
47.1
33.7 32.7
18.4 17.5
13.8
18.220.7
36.4
8.8
14.3 13.510.8 12.0
14.7
5.9
0
5
10
15
20
25
30
35
40
45
50
NYBusMAN
Paris
WMATA
OCTA
Beelin
eCBD
Brauns
chweig
NYComp
Arteria
l
CSHVCUDDS
KCM
Tran
sient
ETC
Comm
(g/k
m)
John Deere CNG THC-emissions
33.9
16.0 16.8
11.29.6 9.3 10.4 9.2
14.7
5.08.3 7.2 6.2
10.0 11.1
4.0
0
5
10
15
20
25
30
35
40
45
50
NYBusMAN
Paris
WMATA
OCTA
Beelin
eCBD
Brauns
chweig
NYComp
Arteria
l
CSHVCUDDS
KCM
Tran
sient
ETC
Comm
(g/k
m)
Figure 7.4. THC-emissions (THC-emissions barely visible for diesel).
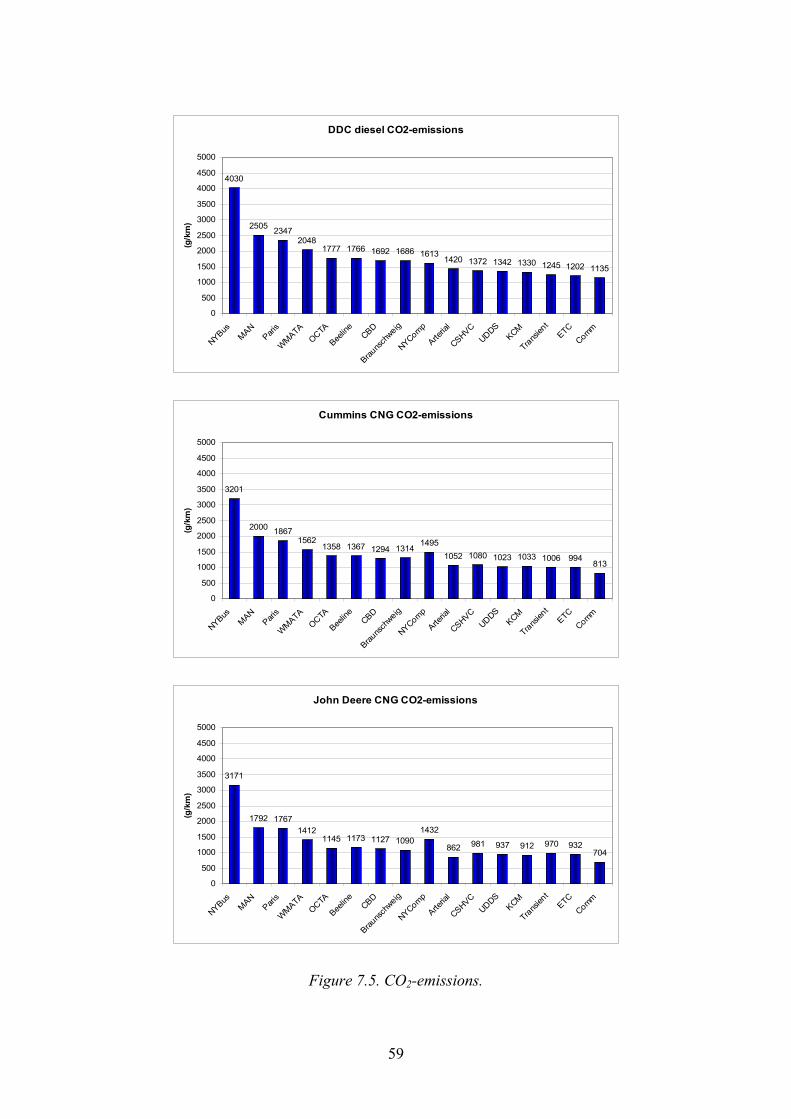
59
DDC diesel CO2-emissions
4030
2505 23472048
1777 1766 1692 1686 16131420 1372 1342 1330 1245 1202 1135
0
500
1000
1500
2000
2500
3000
3500
4000
4500
5000
NYBusMAN
Paris
WMATAOCTA
Beelin
eCBD
Brauns
chweig
NYComp
Arteria
l
CSHVCUDDS
KCM
Transien
tETC
Comm
(g/k
m)
Cummins CNG CO2-emissions
3201
2000 18671562
1358 1367 1294 13141495
1052 1080 1023 1033 1006 994813
0
500
1000
1500
2000
2500
3000
3500
4000
4500
5000
NYBusMAN
Paris
WMATAOCTA
Beelin
eCBD
Brauns
chweig
NYComp
Arteria
l
CSHVCUDDS
KCM
Transien
tETC
Comm
(g/k
m)
John Deere CNG CO2-emissions
3171
1792 17671412
1145 1173 1127 10901432
862 981 937 912 970 932704
0
500
1000
1500
2000
2500
3000
3500
4000
4500
5000
NYBusMAN
Paris
WMATAOCTA
Beelin
eCBD
Brauns
chweig
NYComp
Arteria
l
CSHVCUDDS
KCM
Transien
tETC
Comm
(g/k
m)
Figure 7.5. CO2-emissions.

60
DDC diesel fuel consumption
157.9
98.4 91.980.3
69.6 69.2 66.3 66.1 63.255.6 53.8 52.6 52.2 48.8 47.1 44.5
0
20
40
60
80
100
120
140
160
180
200
NYBusMAN
Paris
WMATA
OCTA
Beelin
eCBD
Brauns
chweig
NYComp
Arteria
l
CSHVCUDDS
KCM
Transien
tETC
Comm
(l/10
0 km
)
Cummins CNG fuel consumption (diesel equivalent)
180.7
113.5106.1
87.576.2 76.1 72.9 74.4
86.5
58.4 60.8 57.5 57.7 56.4 56.145.0
0
20
40
60
80
100
120
140
160
180
200
NYBusMAN
Paris
WMATA
OCTA
Beelin
eCBD
Brauns
chweig
NYComp
Arteria
l
CSHVCUDDS
KCM
Transien
tETC
Comm
(l/10
0 km
die
sel e
quiv
alen
t)
John Deere CNG fuel consumption (diesel equivalent)
176.0
99.6 98.4
78.263.6 65.0 62.7 60.5
79.7
47.554.5 51.9 50.4 54.1 52.2
38.8
0
20
40
60
80
100
120
140
160
180
200
NYBusMAN
Paris
WMATA
OCTA
Beelin
eCBD
Brauns
chweig
NYComp
Arteria
l
CSHVCUDDS
KCM
Transien
tETC
Comm
(l/10
0 km
die
sel e
quiv
alen
t)
Figure 7.6. Fuel consumption.

61
The methane emissions of the natural gas buses are from 4 to 47 g/km, the average value being 12 g/km for John Deere -buses and 21 g/km for Cummins-buses. Methane is a much stronger greenhouse gas than carbon dioxide, by a factor of 21. As the THC-emissions of the natural gas buses mainly are methane, this adds, on an average, some 250 g CO2eqv to the CO2-emissions of the John Deere- and 440 g CO2eqv to the CO2-emissions of the Cummins natural gas -buses. This means that the Cummins -natural gas buses, on an average, produce slightly more greenhouse gas emissions than the diesel bus. However, the methane emissions are not a regulated species for the US buses.
Figure 7.7 shows equivalent CO2-emissions for the Cummins and John Deere natural gas buses.
CO2eqv emissions
0
500
1000
1500
2000
2500
3000
3500
4000
4500
NYBusMAN
Paris
WMATAOCTA
Beelin
eCBD
Brauns
chweig
NYComp
Arteria
l
CSHVCUDDS
KCM
Transien
tETC
Comm
g/km
Cummins THC *21Cummins CO2
CO2eqv emissions
0
500
1000
1500
2000
2500
3000
3500
4000
4500
NYBusMAN
Paris
WMATAOCTA
Beelin
eCBD
Brauns
chweig
NYComp
Arteria
l
CSHVCUDDS
KCM
Transien
tETC
Comm
g/km
Deere THC *21Deere CO2
Figure 7.7. Equivalent CO2-emissions of Cummins and John Deere natural gas buses.
Fuel consumption (in diesel equivalent) varies with a factor of 3.5 for diesel and 4 to 4.5 for natural gas buses (highest to lowest fuel consumption value on the various cycles).

62
All buses show roughly equivalent variations in NOx- and PM-emissions proportioned to fuel (Figures 7.8 and 7.9). NOx-variations between vehicles are at maximum with high fuel consumption cycles, PM-variations with the cycles giving low fuel consumption. For NOx, both natural gas vehicles respond to the cycles in a similar way.
NOx emissions in proportion to fuel
0
5
10
15
20
25
NYBusMAN
Paris
WMATAOCTA
Beelin
eCBD
Brauns
chweig
NYComp
Arteria
l
CSHVCUDDS
KCM
Transien
tETC
Comm
(g/l)
DDC dieselCummins NGDeere NG
Figure 7.8. NOx-emissions proportioned to fuel.
PM emissions in proportion to fuel
0
0.02
0.04
0.06
0.08
0.1
NYBusMAN
Paris
WMATAOCTA
Beelin
eCBD
Brauns
chweig
NYComp
Arteria
l
CSHVCUDDS
KCM
Transien
tETC
Comm
(g/l)
DDC dieselCummins NGDeere NG
Figure 7.9. PM-emissions proportioned to fuel.

63
In the case of the vehicles and cycles evaluated by West Virginia University the results are not as coherent as in the cases of VTT and Environment Canada.
NYComp sticks out in many respects. For all vehicles, but especially for the natural gas vehicles NYComp gives relatively high NOx-emissions. For the natural gas vehicles, also THC-emissions and fuel consumption are high in this cycle. In the case of the diesel vehicle, the CBD-, Arterial and KCM-cycles show high PM-emissions. The John Deere -natural gas buses shows greater variation in PM with duty cycle compared with the Cummins -natural gas buses.
7.3 Effects of load on emissions and fuel economy
Three buses representing John Deere, Cummins, and the DDC were tested at three load conditions. Load specifications are presented in the following table.
Table 7.1. Load specification for no load, half load, and full load testing.
Test Weight (kg) Bus ID Gross Vehicle
Weight (kg) Curb Weight
(kg) No Load Half Load Full Load
John Deere 19,296 14,660 14,728 16,769 18,810
Cummins 19,296 14,651 14,719 16,760 18,801
Retrofitted Diesel (DDC) 17,860 13,453 13,521 15,987 17,876
The three common cycles; the Braunschweig-cycle, the Paris-cycle, and the OCTA-cycle, were employed to examine the effects of test weight on emissions and fuel consumption. In this presentation, a summary of the results is presented.
Figures 7.10 (DDC), 7.11 (Cummins NG) and 7.12 (John Deere NG) show the effect of load for the Braunschweig-cycle. Note that scaling changes from picture to picture. CO2-emissions (and fuel consumption) increase with load, as can be expected. Mixed patterns were observed for the other emissions. For the diesel and the Cummins -natural gas bus NOx-emissions increased with increasing load, but the increase was very moderate. In the case of the John Deere -natural gas bus full load gave lowest distance specific NOx-emissions. For all vehicles, half load rendered highest PM-emissions (absolute levels are very low). CO-emissions tend to increase with increasing load. Weather effects may play a role in the variability of these results, since the measurements were conducted outside of the laboratory.

64
0
5
10
15
20
CO*100 NOx HC PM*100 CO2/100
Emis
sion
s (g
/km
)
Figure 7.10. Weight effect on the second diesel bus on the Braunschweig-cycle. Note that CO- and PM-scales are increased a 100 fold while CO2-scale was decreased a 100 fold.
0
5
10
15
20
25
30
35
CO*100 NOx HC PM*100 CO2/100
Emis
sion
s (g
/km
)
Figure 7.11. Weight effect on the third Cummins-bus on the Braunschweig-cycle.

65
0
2
4
6
8
10
12
CO*100 NOx HC PM*100 CO2/100
Em
issi
ons
(g/k
m)
Figure 7.12. Weight effect on the third John Deere -bus on the Braunschweig-cycle.
7.4 Continuous emission data
West Virginia University also performed continuous emission measurements of CO-, HC-, NOx-, and CO2-concentrations in the exhaust. Figures 7.13 (DDC), 7.14 (Cummins) and 7.15 (John Deere) show examples of THC- and NOx-traces for the Braunschweig-cycle. Note the differences in scaling.
All vehicles give roughly equivalent profiles for NOx-concentration, but there are significant differences in THC-concentrations. It should, however, be remembered that the THC-emissions on natural gas vehicles are mainly methane, which is not toxic nor reactive.
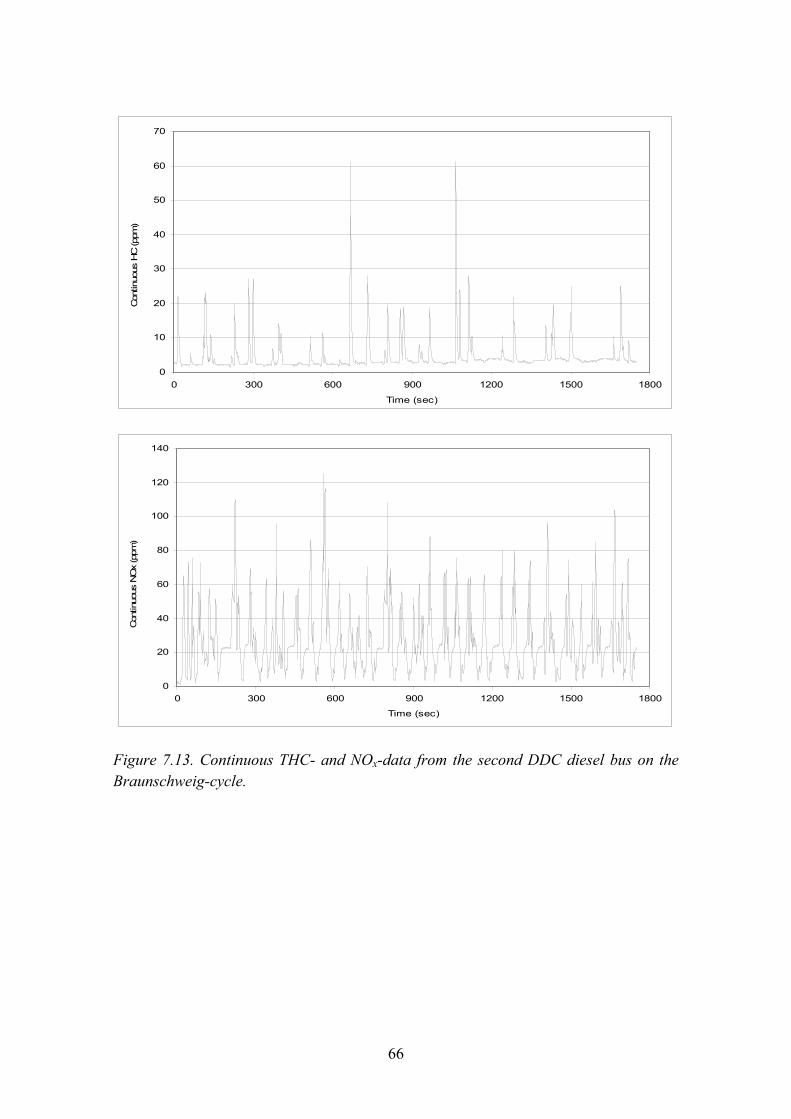
66
0
10
20
30
40
50
60
70
0 300 600 900 1200 1500 1800
Time (sec)
Con
tinuo
us H
C (p
pm)
0
20
40
60
80
100
120
140
0 300 600 900 1200 1500 1800
Time (sec)
Con
tinuo
us N
Ox
(ppm
)
Figure 7.13. Continuous THC- and NOx-data from the second DDC diesel bus on the Braunschweig-cycle.

67
0
200
400
600
800
1000
1200
1400
1600
1800
2000
0 300 600 900 1200 1500 1800
Time (sec)
Con
tinuo
us H
C (p
pm)
0
40
80
120
160
200
240
0 300 600 900 1200 1500 1800
Time (sec)
Con
tinuo
us N
Ox
(ppm
)
Figure 7.14. Continuous THC- and NOx-data from the third Cummins-bus on the Braunschweig-cycle.

68
0
100
200
300
400
500
600
700
0 300 600 900 1200 1500 1800Time (sec)
Con
tinuo
us H
C (p
pm)
0
20
40
60
80
100
120
140
160
0 300 600 900 1200 1500 1800
Time (sec)
Con
tinuo
us N
Ox
(ppm
)
Figure 7.15. Continuous THC- and NOx-data from the third John Deere -bus on the Braunschweig-cycle.

69
7.5 Unregulated emissions
West Virginia University also measured aldehydes. Exhaust samples were collected from three buses representing John Deere, Cummins, and the DDC -retrofitted bus while tested at no load and full load condition to determine the level of aldehyde compounds. Two cartridges were collected in series with a sample flow rate of 0.5 liter per minute (lpm) for each test run from every bus. Two cartridges were also collected for background analysis, but at the beginning and at the end of the testing of each bus. These cartridges were sent to the Environment Canada for subsequent analysis. Results presented in this report are background corrected.
Figure 7.16 and Figure 7.17 show background corrected emissions of formaldehyde, acetone, and acetaldehyde in milligrams per kilometer (mg/km) from these buses at no load and full load, respectively. Figures show that formaldehyde dominates the acetone and the acetaldehyde compounds. Figures also show that formaldehyde emissions from the Cummins-buses on all cycles were much higher than those from the John Deere -buses. Acetone and acetaldehyde followed the same trend. The diesel bus, however, had negligible emissions of these species, sometimes below the background levels.
0
5
10
15
20
25
30
35
40
45
50
JD-B
raun
JD-O
CTA
JD-P
aris
Cum
min
s-Br
aun
Cum
min
s-O
CTA
Cum
min
s-Pa
ris
DDC-
Brau
n
DD
C-O
CTA
DD
C-P
aris
Emis
sion
s (m
g/km
)
Figure 7.16. Background corrected formaldehyde, acetone, and acetaldehyde emissions from three buses on three test cycles each tested at no-load.

70
0
10
20
30
40
50
60
70
80
JD-B
raun
JD-O
CTA
JD-P
aris
Cum
min
s-Br
aun
Cum
min
s-O
CTA
Cum
min
s-Pa
ris
DD
C-B
raun
DD
C-O
CTA
DD
C-P
aris
Em
issi
ons
(mg/
km)
Figure 7.17. Background corrected formaldehyde, acetone, and acetaldehyde emissions from three buses on three test cycles each tested at full-load.
71
8. Discussion and conclusions
8.1 General
Three laboratories, VTT, Environment Canada and West Virginia University measured standard size urban buses driving various duty cycles on chassis dynamometers. The number of transient test cycles per laboratory varied from 6 to 16. Included in the vehicle matrix were European and North American diesel and natural gas vehicles. Environment Canada performed a comparison of a conventional diesel vehicle and a diesel-electric hybrid vehicle. Fuel consumption as well as exhaust emissions were measured.
The main objective of the project was to evaluate how various duty cycles affect fuel consumption and exhaust emission figures. As could be expected, the results vary significantly not only by test cycle, but also by vehicle technology. In some cases increased fuel consumption or load results in increased emissions, in some in reduced emissions. For some vehicles emissions can be directly proportioned to the amount of fuel consumed, for some not.
Most of the evaluated test cycles provide coherent fuel consumption and emission results. Some specific test cycles result in abnormalities, and must therefore not be considered representative.
All three laboratories performed measurements on three common cycles, the ADEME-RATP Paris bus cycle, the Orange County Transport Authority -cycle and the Braunschweig -bus cycle. This made it possible to also compare European vehicles and North American vehicles with each other. However, such a comparison is only indicative, as there are differences in vehicle specifications (including test weight), testing equipment and also in test procedures and testing conditions.
8.2 Characteristics of test cycles
A duty cycle can be described by work proportioned to distance or work intensity (kWh/km), average speed, maximum speed, standard deviation of speed and share of idle. Some cycles depict actual driving conditions, some cycles are synthetic.
Average speed is one of the most important parameters describing a cycle. As average speed goes down and the number of stops increase, work intensity and thus also fuel consumption go up. Figure 8.1 shows fuel consumption of a conventional diesel vehicle and average speed for the various duty cycles used by West Virginia University.
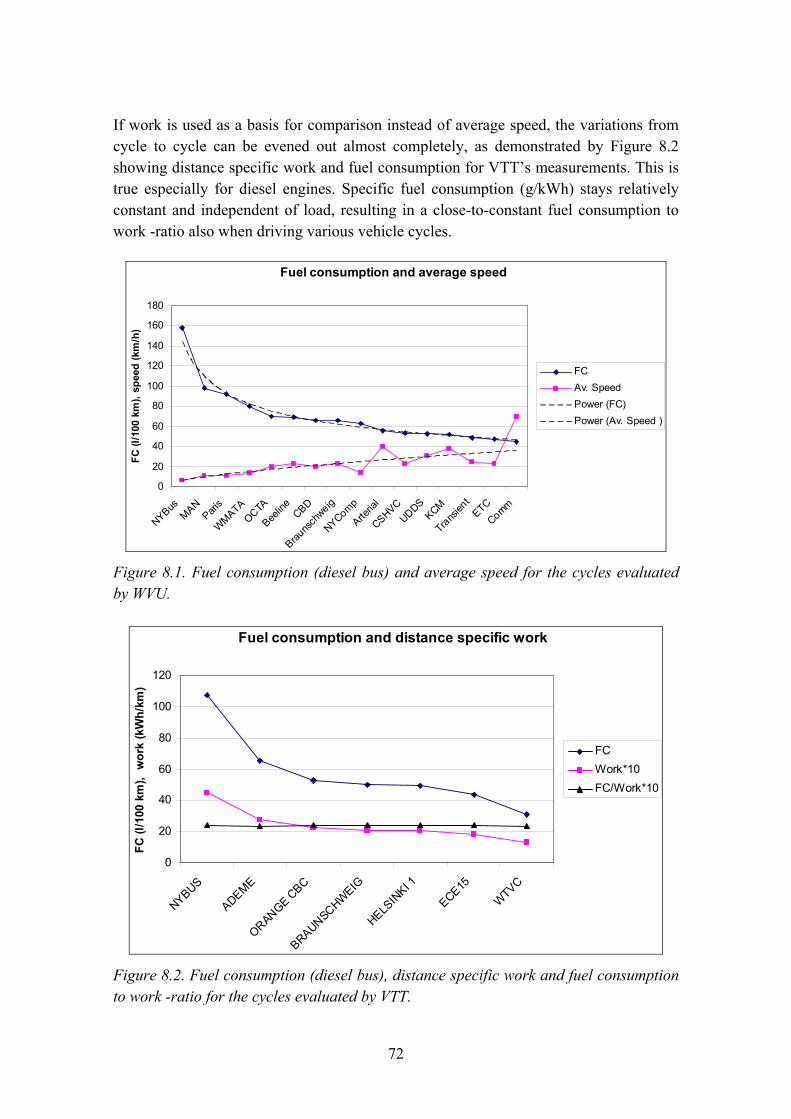
72
If work is used as a basis for comparison instead of average speed, the variations from cycle to cycle can be evened out almost completely, as demonstrated by Figure 8.2 showing distance specific work and fuel consumption for VTT�s measurements. This is true especially for diesel engines. Specific fuel consumption (g/kWh) stays relatively constant and independent of load, resulting in a close-to-constant fuel consumption to work -ratio also when driving various vehicle cycles.
Fuel consumption and average speed
0
20
40
60
80
100
120
140
160
180
NYBusMAN
Paris
WMATAOCTA
Beelin
eCBD
Brauns
chweig
NYComp
Arteria
l
CSHVCUDDS
KCM
Transien
tETC
Comm
FC (l
/100
km
), sp
eed
(km
/h)
FCAv. Speed Power (FC)Power (Av. Speed )
Figure 8.1. Fuel consumption (diesel bus) and average speed for the cycles evaluated by WVU.
Fuel consumption and distance specific work
0
20
40
60
80
100
120
NYBUS
ADEME
ORANGE CBC
BRAUNSCHWEIG
HELSIN
KI 1
ECE15
WTVC
FC (l
/100
km
), w
ork
(kW
h/km
)
FCWork*10FC/Work*10
Figure 8.2. Fuel consumption (diesel bus), distance specific work and fuel consumption to work -ratio for the cycles evaluated by VTT.
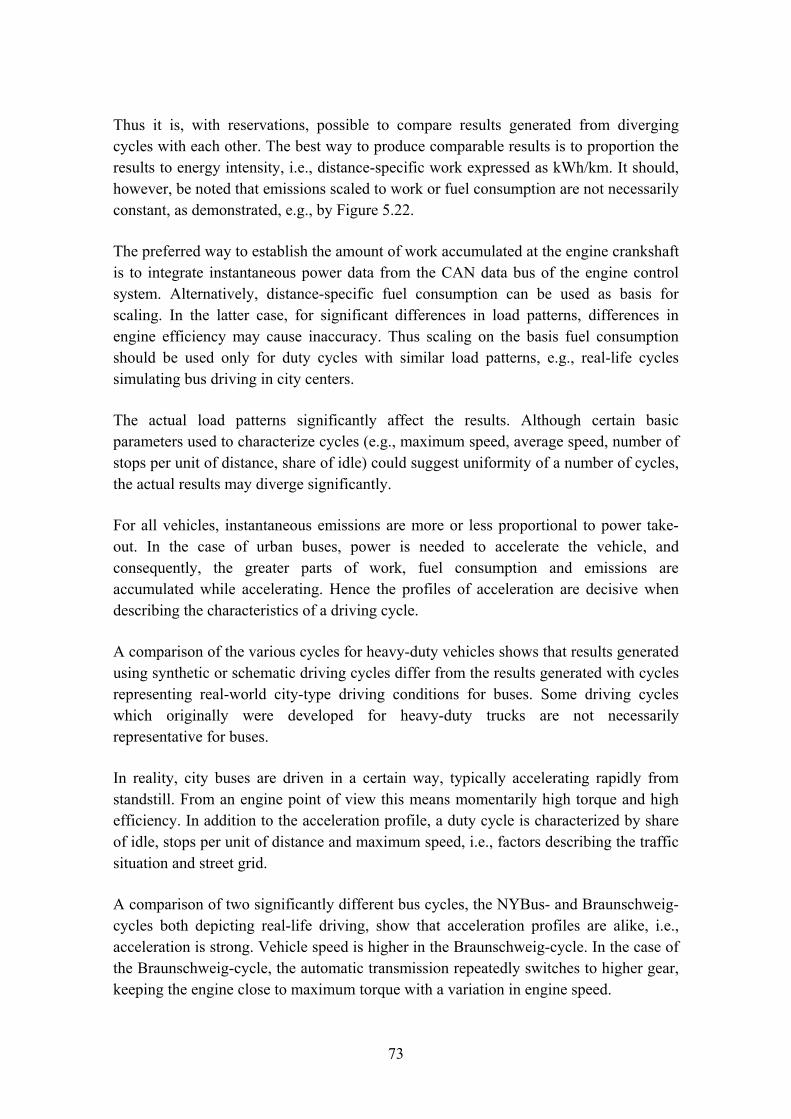
73
Thus it is, with reservations, possible to compare results generated from diverging cycles with each other. The best way to produce comparable results is to proportion the results to energy intensity, i.e., distance-specific work expressed as kWh/km. It should, however, be noted that emissions scaled to work or fuel consumption are not necessarily constant, as demonstrated, e.g., by Figure 5.22.
The preferred way to establish the amount of work accumulated at the engine crankshaft is to integrate instantaneous power data from the CAN data bus of the engine control system. Alternatively, distance-specific fuel consumption can be used as basis for scaling. In the latter case, for significant differences in load patterns, differences in engine efficiency may cause inaccuracy. Thus scaling on the basis fuel consumption should be used only for duty cycles with similar load patterns, e.g., real-life cycles simulating bus driving in city centers.
The actual load patterns significantly affect the results. Although certain basic parameters used to characterize cycles (e.g., maximum speed, average speed, number of stops per unit of distance, share of idle) could suggest uniformity of a number of cycles, the actual results may diverge significantly.
For all vehicles, instantaneous emissions are more or less proportional to power take-out. In the case of urban buses, power is needed to accelerate the vehicle, and consequently, the greater parts of work, fuel consumption and emissions are accumulated while accelerating. Hence the profiles of acceleration are decisive when describing the characteristics of a driving cycle.
A comparison of the various cycles for heavy-duty vehicles shows that results generated using synthetic or schematic driving cycles differ from the results generated with cycles representing real-world city-type driving conditions for buses. Some driving cycles which originally were developed for heavy-duty trucks are not necessarily representative for buses.
In reality, city buses are driven in a certain way, typically accelerating rapidly from standstill. From an engine point of view this means momentarily high torque and high efficiency. In addition to the acceleration profile, a duty cycle is characterized by share of idle, stops per unit of distance and maximum speed, i.e., factors describing the traffic situation and street grid.
A comparison of two significantly different bus cycles, the NYBus- and Braunschweig-cycles both depicting real-life driving, show that acceleration profiles are alike, i.e., acceleration is strong. Vehicle speed is higher in the Braunschweig-cycle. In the case of the Braunschweig-cycle, the automatic transmission repeatedly switches to higher gear, keeping the engine close to maximum torque with a variation in engine speed.

74
The difference between the NYBus-cycle and the Braunschweig-cycle is actually not in the load or acceleration profile, but rather in the duration of the high load period. In addition, the Braunschweig-cycle contains operation on partial load, whereas NYBus is almost only acceleration. However, the acceleration profile is decisive for both fuel consumption and emissions. All real-life bus cycles, whether New York, London, Paris, Braunschweig or Helsinki tend to give congruent acceleration profiles.
If a driving cycle is based on constant accelerations, like many of the synthetic cycles are, or if the acceleration profiles otherwise differ from normal bus operations, the results obtained are not necessarily representative for urban buses. The latter is true, e.g., for duty cycles derived from heavy-duty truck operations. In fact, the engine emission certification cycles used in Europe and North America are derived from heavy-duty truck operations, and these load patterns are also used for chassis dynamometer testing (ETC-Fige, HHDDT Transient). As the load profiles of urban buses differ significantly from the ones of heavy-duty trucks, buses should be tested primarily on real bus cycles.
Figure 8.3 shows engine load patterns for the European ETC-engine certification -cycle and the Braunschweig-cycle. The ETC-transient test emphasises higher engine speeds than what an engine in an urban bus uses.
Figure 8.3. Engine operation in the Braunschweig- and ETC-cycles (suggestive).
Moottorin toiminta Braunschweig ja ETC sykleissäEsimerkkikuva (viitteellinen)
0
200
400
600
800
1000
400 600 800 1000 1200 1400 1600 1800 2000 2200
BraunschweigETC

75
Figure 8.4 shows load patterns for the unladen Scania Euro 3 -diesel bus for the Braunschweig-cycle and the synthetic ECE R15 -cycle used for passenger car certification. It can be seen that when running the ECE R15 -cycle, the engine never reaches full torque, and this condition is not representative for normal bus operations.
Euro 3 Diesel, Braunschweig vs. ECE R15unloaded
0
200
400
600
800
1000
1200
0 500 1000 1500 2000 2500
Engine Speed [rpm]
Engi
ne T
orqu
e [N
m]
BraunschweigECE R15
Figure 8.4. Engine operation in the Braunschweig- and ECE R15 -cycles. Unladen diesel bus.
All laboratories had three cycles in common, the Paris Bus -cycle, the Orange County Transport Authority -cycle and the Braunschweig bus -cycle. VTT and West Virginia University also tested using the New York bus -cycle. Although very different regarding fuel consumption and average speed, the cycles are in fact surprisingly coherent regarding fuel or work specific emissions.
Table 8.1 shows approximate distance specific work in kWh/km for these four cycles.
Table 8.1. Distance specific work (on the engine crankshaft) for various duty cycles with half load.
kWh/kmNYBUS 4.0 PARIS 2.5 ORANGE 2.0 BRAUNSCHWEIG 1.8
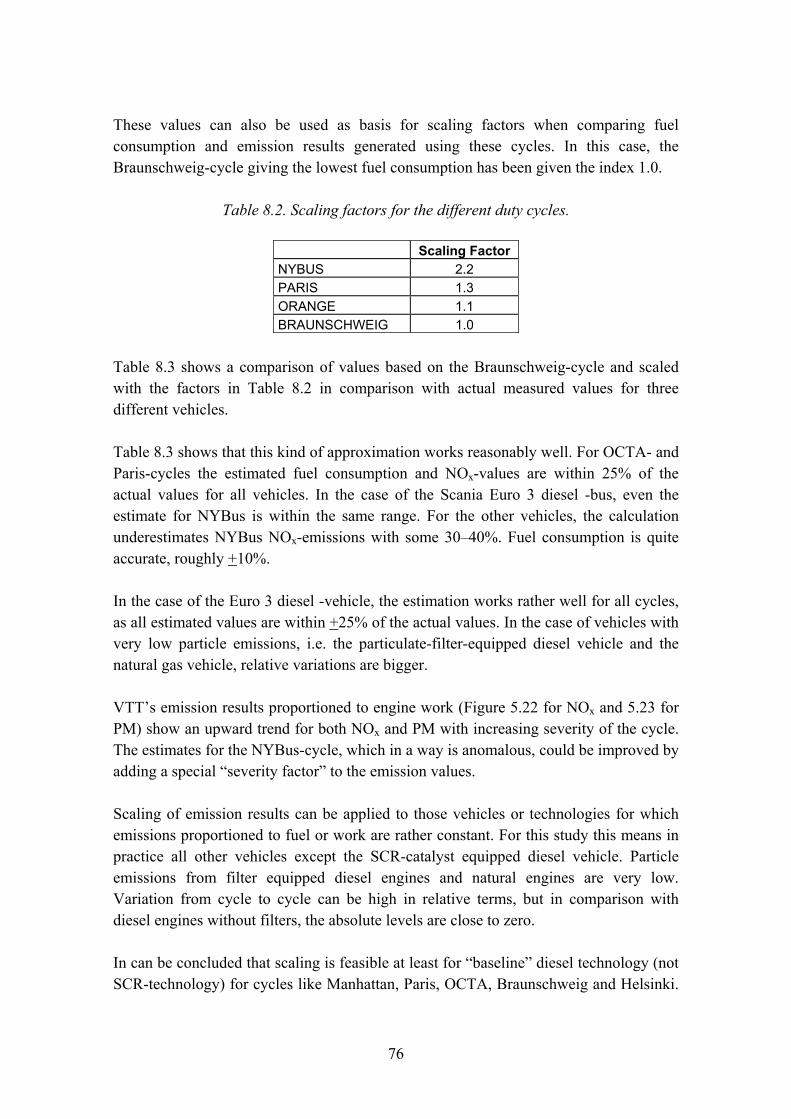
76
These values can also be used as basis for scaling factors when comparing fuel consumption and emission results generated using these cycles. In this case, the Braunschweig-cycle giving the lowest fuel consumption has been given the index 1.0.
Table 8.2. Scaling factors for the different duty cycles.
Scaling Factor NYBUS 2.2 PARIS 1.3 ORANGE 1.1 BRAUNSCHWEIG 1.0
Table 8.3 shows a comparison of values based on the Braunschweig-cycle and scaled with the factors in Table 8.2 in comparison with actual measured values for three different vehicles.
Table 8.3 shows that this kind of approximation works reasonably well. For OCTA- and Paris-cycles the estimated fuel consumption and NOx-values are within 25% of the actual values for all vehicles. In the case of the Scania Euro 3 diesel -bus, even the estimate for NYBus is within the same range. For the other vehicles, the calculation underestimates NYBus NOx-emissions with some 30�40%. Fuel consumption is quite accurate, roughly +10%.
In the case of the Euro 3 diesel -vehicle, the estimation works rather well for all cycles, as all estimated values are within +25% of the actual values. In the case of vehicles with very low particle emissions, i.e. the particulate-filter-equipped diesel vehicle and the natural gas vehicle, relative variations are bigger.
VTT�s emission results proportioned to engine work (Figure 5.22 for NOx and 5.23 for PM) show an upward trend for both NOx and PM with increasing severity of the cycle. The estimates for the NYBus-cycle, which in a way is anomalous, could be improved by adding a special �severity factor� to the emission values.
Scaling of emission results can be applied to those vehicles or technologies for which emissions proportioned to fuel or work are rather constant. For this study this means in practice all other vehicles except the SCR-catalyst equipped diesel vehicle. Particle emissions from filter equipped diesel engines and natural engines are very low. Variation from cycle to cycle can be high in relative terms, but in comparison with diesel engines without filters, the absolute levels are close to zero.
In can be concluded that scaling is feasible at least for �baseline� diesel technology (not SCR-technology) for cycles like Manhattan, Paris, OCTA, Braunschweig and Helsinki.

77
The NYBus-cycle needs a specific correction for severity. On the other hand, scaling could most probably be done also downwards for cycles less severe than these cycles, on the condition that the less severe cycles still represent actual driving patters for urban buses.
Table 8.3. Comparison of estimated and actual emission and fuel consumption values for three vehicles.
NOx g/km PM g/km FC l/100 km Scania Euro 3 Braunschweig 8.7 0.140 43.4 OCTA calculated 9.6 0.154 47.7 OCTA actual 10.7 0.150 46.4 difference % -11 3 3 Paris calculated 11.3 0.182 56.4 Paris actual 13.1 0.210 58.0 difference % -14 -13 -3 NYBus calculated 19.1 0.308 95.5 NYBus actual 23.5 0.410 96.3 difference % -19 -25 -1 Orion DDC Braunschweig 8.5 0.010 66.1 OCTA calculated 9.4 0.011 72.7 OCTA actual 9.6 0.005 69.6 difference % -2 120 4 Paris calculated 11.1 0.013 85.9 Paris actual 15.0 0.011 91.9 difference % -26 18 -7 NYBus calculated 18.7 0.022 145.4 NYBus actual 28.0 0.044 157.9 difference % -33 -50 -8 MAN NG EEV Braunschweig 2.2 0.003 41.8 OCTA calculated 2.4 0.003 46.0 OCTA actual 2.1 0.003 43.2 difference % 13 10 6 Paris calculated 2.8 0.004 54.3 Paris actual 3.5 0.002 60.1 difference % -19 95 -10 NYBus calculated 4.8 0.007 92.0 NYBus actual 7.9 0.006 104.9 difference % -39 10 -12

78
8.3 Vehicle to vehicle comparisons
The main objective of study was not to carry out vehicle-to-vehicle comparisons. It is, however, interesting to make a rough comparison of the performance of European and North American buses. It is important to note that the buses have different test weights, and may originally be configured for different applications. For example, gear ratios may differ as a result of intended application.
As mentioned previously, an uncompromising comparison is not possible due to differences in, e.g., instrumentation, measurement procedures and vehicle specifications (air conditioning, driveline layout etc.).
Figures 8.5 (NOx), 8.6 (PM) and 8.7 (CO2) presents a comparison of distance specific emission values for all the vehicle types tested. The John Deere -engine equipped buses were used in these figures to represent North American natural gas buses.
A comparison is made for five cycles:
• NYBus (VTT, WVU) • Manhattan (Environment Canada, WVU) • Paris (all) • OCTA (all) • Braunschweig (all).
For all cycles it was tested in, the stoichometric MAN natural gas bus gives lowest NOx-emissions. The DDC-equipped diesel vehicle or the Scania Euro 3 diesel, depending on the cycle, deliver highest NOx-emissions. The John Deere -natural gas engine gives slightly less NOx-emissions compared with the DDC-diesel. Both Cummins-equipped New Flyer -buses (conventional and hybrid) give moderate NOx-emissions. The NOx-performance of the Volvo SCR -bus is highly dependent on the duty cycle.
The picture for particle emissions is clear, high particle emissions for the European diesel vehicles, low for the particulate trap equipped North American vehicles and natural gas vehicles.
The DDC-diesel equipped Orion-bus delivers highest CO2-emissions, the Cummins diesel equipped New Flyer second highest. Evidently European diesel vehicles are more fuel efficient. Only with hybridization the New Flyer -bus reaches European diesel CO2- and fuel consumption levels.
In all cycles on which it was tested, the New Flyer -hybrid vehicle provided the lowest CO2-emissions. Second lowest CO2-emission is either for the John Deere -equipped natural
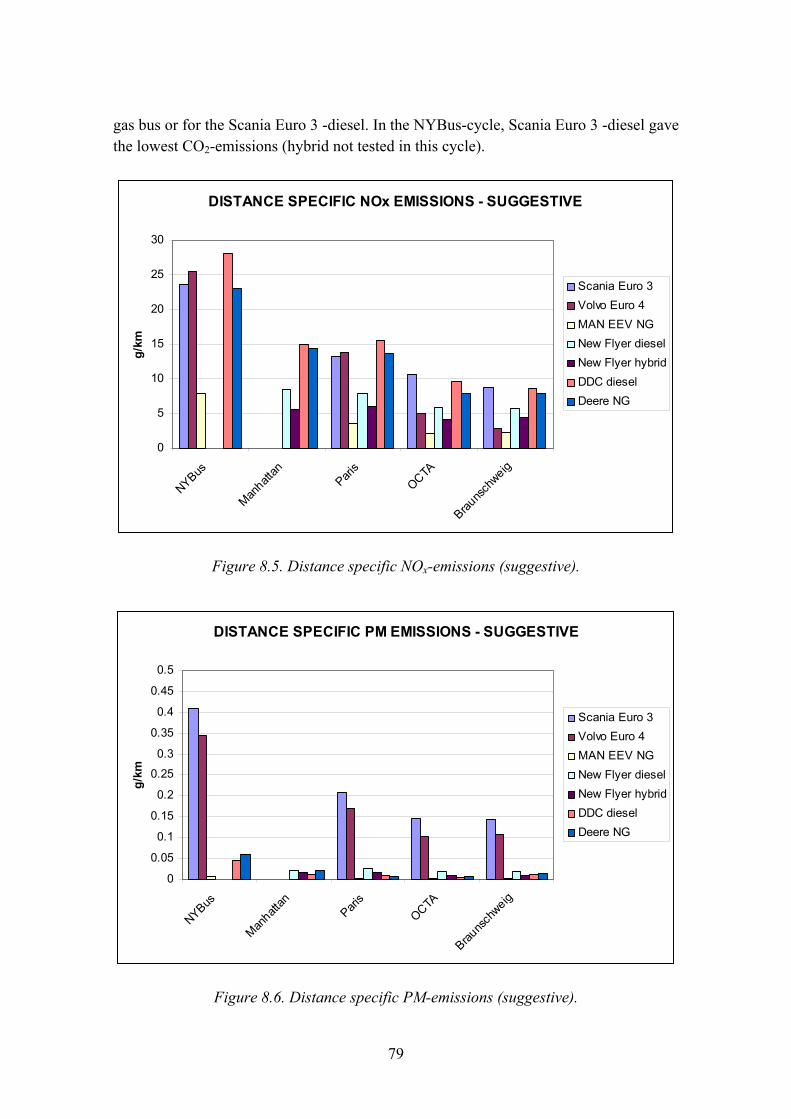
79
gas bus or for the Scania Euro 3 -diesel. In the NYBus-cycle, Scania Euro 3 -diesel gave the lowest CO2-emissions (hybrid not tested in this cycle).
DISTANCE SPECIFIC NOx EMISSIONS - SUGGESTIVE
0
5
10
15
20
25
30
NYBus
Manhatt
anPari
sOCTA
Brauns
chweig
g/km
Scania Euro 3Volvo Euro 4MAN EEV NG New Flyer dieselNew Flyer hybridDDC dieselDeere NG
Figure 8.5. Distance specific NOx-emissions (suggestive).
DISTANCE SPECIFIC PM EMISSIONS - SUGGESTIVE
0
0.05
0.1
0.15
0.2
0.25
0.3
0.35
0.4
0.45
0.5
NYBus
Manhatt
anPari
sOCTA
Brauns
chweig
g/km
Scania Euro 3Volvo Euro 4MAN EEV NG New Flyer dieselNew Flyer hybridDDC dieselDeere NG
Figure 8.6. Distance specific PM-emissions (suggestive).

80
DISTANCE SPECIFIC CO2 EMISSIONS - SUGGESTIVE
0
500
1000
1500
2000
2500
3000
3500
4000
4500
NYBus
Manhatt
anPari
sOCTA
Brauns
chweig
g/km
Scania Euro 3Volvo Euro 4MAN EEV NG New Flyer dieselNew Flyer hybridDDC dieselDeere NG
Figure 8.7. Distance specific CO2-emissions (suggestive).
8.4 Final conclusions
The results for emissions and fuel consumption vary significantly not only by test cycle, but also by vehicle technology. In some cases increased fuel consumption or load results in increased emissions, in some reduced emissions. However, for most vehicles emissions can be estimated as directly proportioned to the amount of fuel consumed or work done by the engine. In this respect NOx-emissions from SCR-vehicles form an exception, as well as particle emissions from vehicles producing very low absolute particle emission levels.
Most of the evaluated test cycles provide coherent fuel consumption and emission results. Some specific test cycles result in abnormalities, and must therefore not be considered representative.
Scaling factors can, in some cases, be used to compare results from different cycles. The prerequisites are that the cycles represent true bus operations and that the emissions of the vehicles are reasonably stable when proportioned to fuel consumption or work.
There seems to be a clear difference in the emission profiles of European and North American vehicles. In Europe, fuel efficiency is emphasized, while in North America, more focus is given to regulated exhaust emissions, especially low particle emissions.

81
Acknowledgements
The research on VTT's heavy-duty emission laboratory was carried out by the group consisting of Nils-Olof Nylund, Kimmo Erkkilä, Matti Kytö, Ari-Pekka Pellikka, Erkki Virtanen and Reijo Mikkola.
The West Virginia University research was conducted by Nigel Clark, Donald. W. Lyons, Mridul Gautam, W. Scott Wayne, Gregory Thompson and the staff and students of the Center for Alternative Fuels, Engines & Emissions.
The research on Environment Canada�s emissions laboratory was carried out by the group consisting of Norman Meyer, Greg Rideout, and Mike White, while the support of Wes Hamilton and Peter Chiang of Allison-General Motors and Andy Beregszaszy of Natural Resources Canada was greatly appreciated.

82
References
Individual reports by Environment Canada and West Virginia University, see 4.5.
APTA. (2006). American Public Transportation Association (APTA) Transit Resource Guide, Transit Bus Fuels and Air Quality, Revised June 2006. http://www.apta.com/research/info/briefings/briefing_5.cfm.
Chandler, K., Eberts, E. & Eudy, L. (2006). New York City Transit Hybrid and CNG Transit Buses: Interim Evaluation Results. Technical Report NREL/TP-540-38843. January 2006. http://www.eere.energy.gov/afdc/pdfs/38843.pdf.
Coroller, P. & Plassat, G. (2003). Comparative Study on Exhaust Emissions from Diesel and CNG-Powered Urban Buses. Proceedings of the Diesel Engine Emissions Reduction Conference (DEER), 2003. http://www.osti.gov/bridge/servlets/purl/829628-p2hKIe/native/829628.pdf
DieselNet. Emission Test Cycles. http://www.dieselnet.com/standards/cycles/index.html.
Johnson, T. (2006). Diesel Emission Technology in Review. 2006 Diesel Engine-Efficiency and Emissions Research (DEER) Conference. August 20�24, 2006, Detroit, Michigan. http://www1.eere.energy.gov/vehiclesandfuels/pdfs/deer_2006/session2/2006_deer_johnson.pdf.
Nylund, N.-O. & Erkkilä, K. (2005). Bus Emission Evaluation. 2002�2004 Summary Report. Research Report: PRO3/P3015/05. VTT Processes, April 2005. 51 p. http://www.vtt.fi/inf/julkaisut/muut/2005/BusEmissionEvaluation.pdf.
Puetz, W. (2005). Future Diesel Engine Thermal Efficiency Improvement and Emissions Control Technology. A Detroit Diesel Corporation Perspective. 11th DEER Conference, Chicago IL. August, 2005. http://www1.eere.energy.gov/vehiclesandfuels/pdfs/deer_2005/plenary/2005_deer_puetz.pdf.
SAE J2711. SAE Standard J2711 Recommended Practice for Measuring Fuel Economy and Emissions of Hybrid-Electric and Conventional Heavy-Duty Vehicle, Society of Automotive Engineers, Document No. J2711, 2002.
STT Emtec. Emissions and engine technology. http://www.sttemtec.com/.

1/1
Appendix 1:
NYBus
0
10
20
30
40
50
60
0 100 200 300 400 500 600Time (s)
Spee
d (k
m/h
)
Figure 1. New York Bus Cycle.
ADEME-RATP
0
10
20
30
40
50
60
0 500 1000 1500 2000Time (s)
Spee
d (k
m/h
)
Figure 2. ADEME-RATP (Paris) Bus Cycle.

1/2
Manhattan
05
1015202530354045
0 200 400 600 800 1000Time (s)
Spee
d (k
m/h
)
Figure 3. Manhattan Bus Cycle.
0
10
20
30
40
50
0 200 400 600 800 1000 1200 1400 1600 1800 2000
Time (sec)
Spe
ed (m
ph)
Figure 4. The WMATA Cycle (note: speed in mph).

1/3
NYComp
0
10
20
30
40
50
60
70
0 200 400 600 800 1000Time (s)
Spee
d (k
m/h
)
Figure 5. New York Composite Cycle.
ECE15
0
10
20
30
40
50
60
0 200 400 600 800Time (s)
Spee
d (k
m/h
)
Figure 6. European Passenger Car Cycle ECE R15.

1/4
Orange County
0
10
20
30
40
50
60
70
0 500 1000 1500 2000Time (s)
Spee
d (k
m/h
)
Figure 7. Orange County Bus Cycle.
CBD
0
5
10
15
20
25
30
35
0 100 200 300 400 500 600Time (s)
Spee
d (k
m/h
)
Figure 8. Central Business District Cycle.

1/5
Braunschweig
0
10
20
30
40
50
60
70
0 500 1000 1500Time (s)
Spee
d (k
m/h
)
Figure 9. Braunschweig Bus Cycle.
0
5
10
15
20
25
30
35
0 100 200 300 400 500 600
Time (sec)
Spe
ed (m
ph)
Figure 10. The European Transient Cycle (ETC), segment 1 (ETC-URBAN) (note: speed in mph).

1/6
0
5
10
15
20
25
30
35
40
45
50
0 300 600 900 1200 1500 1800
Time (sec)
Spe
ed (m
ph)
Figure 11. The Beeline Cycle (note: speed in mph).
0
5
10
15
20
25
30
35
40
45
0 200 400 600 800 1000 1200 1400 1600 1800
Time (sec)
Spe
ed (m
ph)
Figure 12. The City Suburban Heavy-Duty Vehicle Cycle (CSHVC) (note: speed in mph).
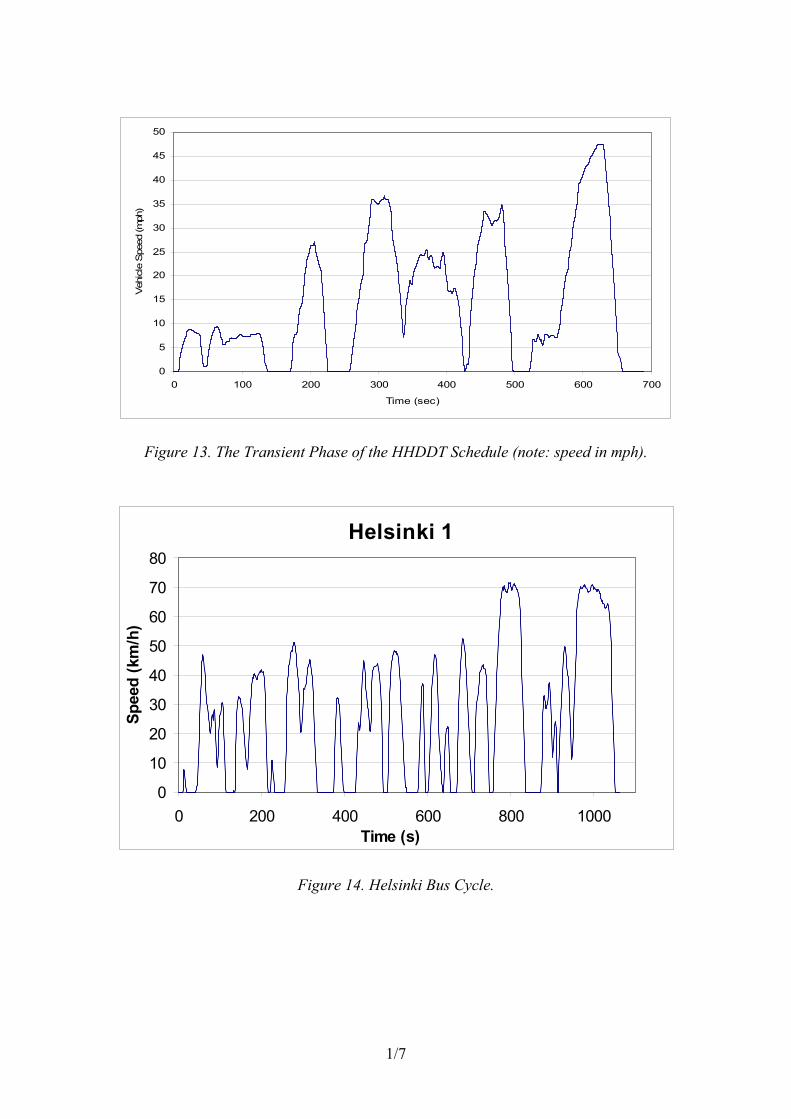
1/7
0
5
10
15
20
25
30
35
40
45
50
0 100 200 300 400 500 600 700
Time (sec)
Veh
icle
Spe
ed (m
ph)
Figure 13. The Transient Phase of the HHDDT Schedule (note: speed in mph).
Helsinki 1
0
10
20
30
40
50
60
70
80
0 200 400 600 800 1000Time (s)
Spee
d (k
m/h
)
Figure 14. Helsinki Bus Cycle.
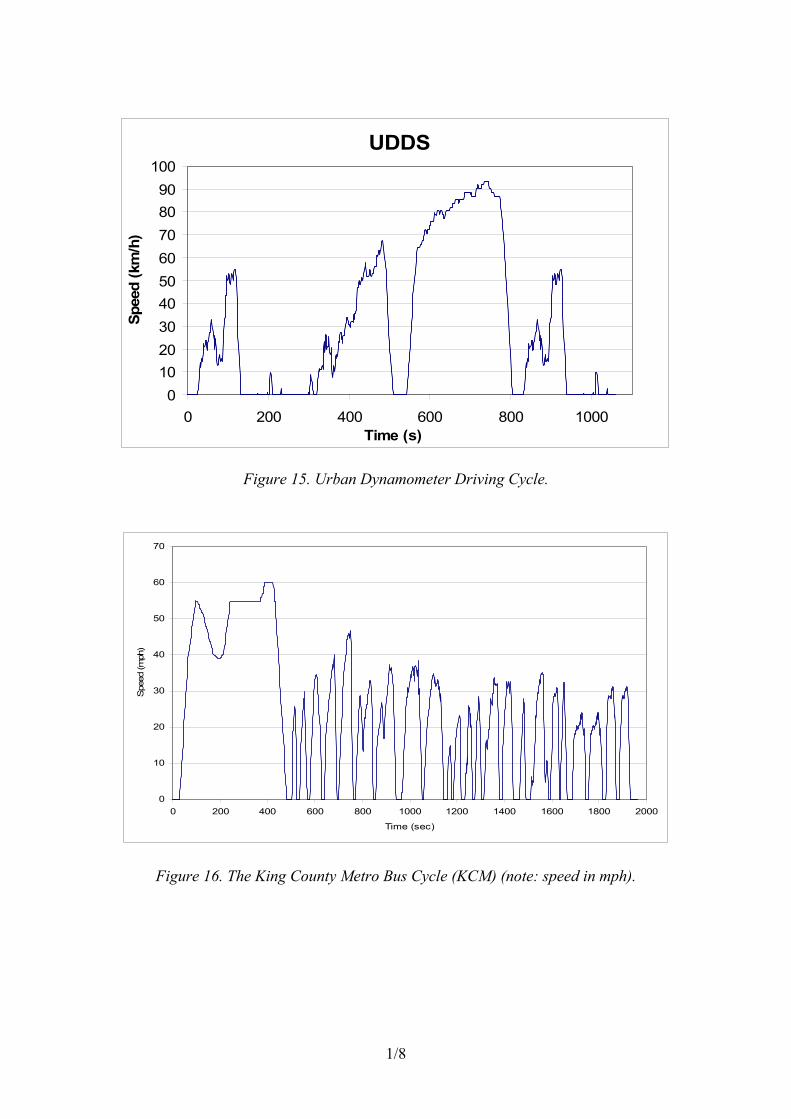
1/8
UDDS
0102030405060708090
100
0 200 400 600 800 1000Time (s)
Spee
d (k
m/h
)
Figure 15. Urban Dynamometer Driving Cycle.
0
10
20
30
40
50
60
70
0 200 400 600 800 1000 1200 1400 1600 1800 2000
Time (sec)
Spe
ed (m
ph)
Figure 16. The King County Metro Bus Cycle (KCM) (note: speed in mph).

1/9
Arterial
0
10
20
30
40
50
60
70
0 50 100 150 200 250 300Time (s)
Spee
d (k
m/h
)
Figure 17. Arterial Cycle.
WTVC
0102030405060708090
100
0 500 1000 1500Time (s)
Spee
d (k
m/h
)
Figure 18. World Transient Vehicle Cycle.

1/10
0
10
20
30
40
50
60
0 30 60 90 120 150 180 210 240 270 300 330
Time (sec)
Spe
ed (m
ph)
Figure 19. The Commuter Cycle (note: speed in mph).

Series title, number and report code of publication
VTT Research Notes 2396 VTT-TIED-2396
Author(s) Nylund, Nils-Olof, Erkkilä, Kimmo, Clark, Nigel & Rideout, Greg Title Evaluation of duty cycles for heavy-duty urban vehicles Final report of IEA AMF Annex XXIX
Abstract Three laboratories, VTT, Environment Canada and West Virginia University measured standard size urban buses driving various duty cycles on chassis dynamometers. The number of test cycles per laboratory varied from 6 to 16. Included in the vehicle matrix were European and North American diesel and natural gas vehicles. Environment Canada performed a comparison of a conventional diesel vehicle and a diesel-electric hybrid vehicle. Fuel consumption as well as exhaust emissions were measured.
The main objective of the project was to evaluate how various duty cycles affect fuel consumption and exhaust emission figures. As could be expected, the results vary significantly not only by test cycle, but also by vehicle technology. In some cases increased fuel consumption or load results in increased emissions, in other cases reduced emissions. However, for most, vehicles emissions can be directly proportioned to the amount of fuel consumed. In this respect NOx-emissions from SCR-vehicles form an exception, as well as particle emissions from vehicles producing very low absolute particle emission levels. Scaling factors to be used for comparing emission results generated with different duty cycles were developed.
Most of the evaluated test cycles provide coherent fuel consumption and emission results. Some specific test cycles result in abnormalities, and must therefore not be considered representative for buses.
All three laboratories performed measurements on three common cycles, the ADEME-RATP Paris bus cycle, the Orange County Transport Authority cycle and the Braunschweig bus -cycle. This made it possible to also compare European vehicles and North American vehicles with each other. However, such a comparison is only indicative, as there are differences in vehicle specifications, testing equipment and also in test procedures and testing conditions.
ISBN 978-951-38-6941-0 (URL: http://www.vtt.fi/publications/index.jsp)
Series title and ISSN Project number VTT Tiedotteita � Research Notes 1455-0865 (URL: http://www.vtt.fi/publications/index.jsp)
239-C4SU00383
Date Language Pages August 2007 English 82 p. + app. 10 p.
Name of project Commissioned by
Keywords Publisher duty cycles, heavy-duty vehicles, urban vehicles, fuel consumption, diesel engines, exhaust emissions, NOx-emissions, particulate emissions, CO2-emissions, engine load patterns
VTT Technical Research Centre of Finland P.O. Box 1000, FI-02044 VTT, Finland Phone internat. +358 20 722 4404 Fax +358 20 722 4374
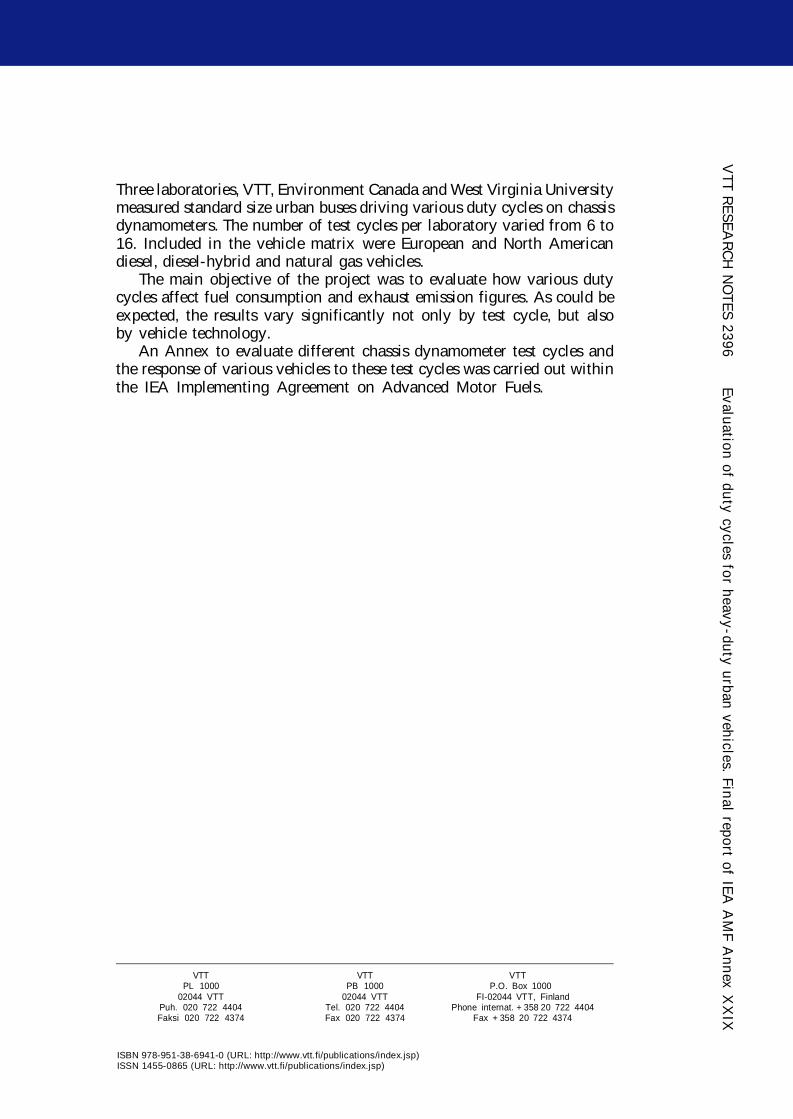
VTT R
ESEAR
CH
NO
TES 2396 Evaluation of duty cycles for heavyduty urban vehicles. Final report of IEA A
MF A
nnex XX
IXESPOO 2007 VTT RESEARCH NOTES 2396
Three laboratories, VTT, Environment Canada and West Virginia Universitymeasured standard size urban buses driving various duty cycles on chassisdynamometers. The number of test cycles per laboratory varied from 6 to16. Included in the vehicle matrix were European and North Americandiesel, dieselhybrid and natural gas vehicles.
The main objective of the project was to evaluate how various dutycycles affect fuel consumption and exhaust emission figures. As could beexpected, the results vary significantly not only by test cycle, but alsoby vehicle technology.
An Annex to evaluate different chassis dynamometer test cycles andthe response of various vehicles to these test cycles was carried out withinthe IEA Implementing Agreement on Advanced Motor Fuels.
NilsOlof Nylund, Kimmo Erkkilä,Nigel Clark & Greg Rideout
Evaluation of duty cycles forheavyduty urban vehicles
Final report of IEA AMF Annex XXIX
ISBN 9789513869410 (URL: http://www.vtt.fi/publications/index.jsp)ISSN 14550865 (URL: http://www.vtt.fi/publications/index.jsp)
Euro 3 Diesel, BR vs. NYBUSfull load
0
200
400
600
800
1000
1200
0 500 1000 1500 2000 2500
Engine Speed [rpm]
Engi
ne T
orqu
e [N
m]
BraunschweigNyBus
VTT VTT VTTPL 1000 PB 1000 P.O. Box 1000
02044 VTT 02044 VTT FI02044 VTT, FinlandPuh. 020 722 4404 Tel. 020 722 4404 Phone internat. + 358 20 722 4404Faksi 020 722 4374 Fax 020 722 4374 Fax + 358 20 722 4374