evaluation of extended gate operations at the …
TRANSCRIPT

Extended Gate Operations Final Report -- 6/11/2008 --1
EVALUATION OF EXTENDED GATE OPERATIONS
AT THE PORTS OF LOS ANGELES AND LONG BEACH
METRANS PROJECT 05-12
DRAFT FINAL REPORT
June 2008
Genevieve Giuliano, Principal Investigator School of Policy, Planning and Development
University of Southern California
Thomas O’Brien, Co-Principal Investigator Center for International Trade and Transportation
California State University, Long Beach
Research Team
Allyson Clark College of Natural Sciences and Mathematics, CSULB
Alison Linder
School of Policy, Planning and Development, USC
Josh Rohmer School of Policy, Planning and Development, USC
Walter Tan
College of Engineering, CSULB
Jiangping Zhou School of Policy, Planning and Development, USC

Extended Gate Operations Final Report -- 6/11/2008 --2
Disclaimer
The contents of this report reflect the views of the authors, who are responsible for the facts and the accuracy of the information presented herein. The document is disseminated under the sponsorship of the Department of Transportation, University Transportation Centers Program, and California Department of Transportation in the interest of information exchange. The U.S. Government and California Department of Transportation assume no liability for the contents or use thereof. The contents do not necessarily reflect the official views or policies of the State of California or the Department of Transportation. This report does not constitute a standard, specification, or regulation.

Extended Gate Operations Final Report -- 6/11/2008 --3
Disclosure
Project was funded under this contract to California Department of Transportation, with additional support from the School of Policy, Planning and Development, University of Southern California.

Extended Gate Operations Final Report -- 6/11/2008 --4
Acknowledgements
The authors gratefully acknowledge the many public and private organizations who participated in this research, including the Policy and Steering Committee of the Center for International Trade and Transportation at California State University, Long Beach. All errors and omissions are the responsibility of the authors.

Extended Gate Operations Final Report -- 6/11/2008 --5
Abstract
This report examines the implementation of extended gate operations at the Los
Angeles/Long Beach ports. Under continued pressure to adjust operations in ways that mitigate traffic and air quality impacts of port operations and in response to threatened regulatory legislation, terminal operators collaborated to establish and implement a voluntary program of extended gate hours. The program, known as PierPASS, assesses a Traffic Mitigation Fee (TMF) on eligible containers moved into and out of the ports during peak hours. In order to encourage more off-peak moves, the fee is not assessed on containers moved between 6 PM and 3 AM Monday-Thursday and between 8 AM and 6 PM on Saturdays. There are no PierPASS gates on Friday evening or on Sunday. The fees are intended to defray the costs of extended operations at the ports.
We focus on the implementation of the program and its outcomes over a period of two years. We discuss the motivations and actions of the ports, terminal operators, shippers, drayage industry, longshore labor, community leaders, and elected officials. We place our examination in the institutional framework of the goods movement supply chain. Our results are based on data provided by PierPASS, the California Department of Transportation (Caltrans), the Pacific Maritime Association, and on data from four drayage trucker surveys. We also conducted a series of extended interviews with stakeholders.
We find that the PierPASS program resulted in a significant temporal shift of cargo moves at the ports. We examine the effects of this shift on heavy truck traffic. We find that the redistribution of port cargo moves is reflected in hourly patterns of heavy truck traffic volumes on the major highways serving the ports. Using a traffic simulation model, we estimated PierPASS effects on highway system performance for various weekday time periods. PierPASS had the effect of shifting truck traffic out of the mid-day and into the evening (after 6 PM) period. Simulations showed little change in the level of peak period congestion, and a reduction in mid-day congestion, despite significant growth in container volumes since PierPASS was implemented. We conclude that the goal of reducing congestion has been achieved.
We also conducted an institutional analysis and evaluated the program’s policy implications. We find that PierPASS was a response by terminal operators and steamship companies to growing political pressure. Given their market power within the supply chain, they were able to create a program that protected their interests yet responded to political imperative. Because PierPASS has been successful in shifting a significant share of cargo to evenings and weekends as intended, international trade interests have been able to claim that they have contributed to reduced congestion and vehicle emissions. Winners and losers of PierPASS reflect the larger structure of the international supply chain.

Extended Gate Operations Final Report -- 6/11/2008 --6
TABLE OF CONTENTS
1 INTRODUCTION .................................................................................................................. 8 1.1 INTRODUCTION .......................................................................................................... 8 1.2 TRENDS IN GOODS MOVEMENT AND INTERNATIONAL TRADE ................... 9 1.2.1 Growth of San Pedro Bay Ports ...................................................................... 9 1.2.2 Impacts on Los Angeles Region ................................................................... 11 1.2.3 Prior Research............................................................................................... 12
2 PIERPASS IMPLEMENTATION........................................................................................ 14 2.1 WHY PIERPASS: FORCES FOR CHANGE ............................................................. 14 2.1.1 Rapid Growth of International Trade............................................................ 14 2.1.2 Increased Public Awareness ......................................................................... 14 2.1.3 Capacity Constraints ..................................................................................... 15 2.1.4 Legislative Pressures..................................................................................... 16 2.2 ECONOMIC AND REGULATORY STRUCTURE ................................................... 17 2.2.1 Ports and Terminal Operators ....................................................................... 18 2.2.2 The Longshore Union ................................................................................... 19 2.2.3 Drayage Trucking ......................................................................................... 19 2.3 DEVELOPMENT, STRUCTURE AND IMPLEMENTATION OF PIERPASS........ 20 2.3.1 Developing PierPASS................................................................................... 20 2.3.2 Structuring PierPASS.................................................................................... 23 2.3.3 Launching PierPASS .................................................................................... 25 2.4 USE OF PIERPASS...................................................................................................... 26
3 IMPACTS ON HIGHWAY SYSTEM ................................................................................. 28 3.1 IMPACTS ON THE HIGHWAY SYSTEM ................................................................ 28 3.1.1 Data ............................................................................................................... 28 3.1.2 Descriptive Analysis ..................................................................................... 29 3.1.3 Simulation Model Estimation and Results.................................................... 32 3.1.4 Conclusions on Highway Impacts ................................................................ 37
4 IMPACTS ON STAKEHOLDERS ...................................................................................... 38 4.1 PORTS .......................................................................................................................... 38 4.2 TERMINAL OPERATORS.......................................................................................... 38 4.2.1 Terminal Operations ..................................................................................... 39 4.2.2 Perceptions of PierPASS............................................................................... 42 4.2.3 Evidence from Labor Data............................................................................ 43 4.3 DRAYAGE TRUCKING ............................................................................................. 45 4.4 OTHER STAKEHOLDERS......................................................................................... 50
5 CONCLUSIONS................................................................................................................... 53 5.1 EXPLAINING OUTCOMES ....................................................................................... 54 5.2 POLICY IMPLICATIONS........................................................................................... 56
REFERENCES ............................................................................................................................. 57 APPENDIX A INTERVIEW LISTS..................................................................................... 61 APPENDIX B PIERPASS TIMELINE ................................................................................ 62 APPENDIX C MTO INTERVIEW INSTRUMENT ........................................................... 66 APPENDIX D COMMUNITY INTERVIEW INSTRUMENT........................................... 71 APPENDIX E WAREHOUSE AND DC INTERVIEW INSTRUMENT........................... 75

Extended Gate Operations Final Report -- 6/11/2008 --7
LIST OF FIGURES
Figure 1.1: Growth in LA/LB Port Container Volume 10Figure 1.2: Growth in West Coast Container Traffic 11Figure 2.3: Weekly Share of Off-Peak Cargo 27Figure 3.1: Caltrans Vehicle Classification Count Stations in Los Angeles County 29Figure 3.2: I-710 Hourly Share of Heavy Truck Traffic, Before and After PierPASS 30Figure 3.3: I-110 Hourly Share of Heavy Truck Traffic, Before and After PierPASS 30Figure 3.4: Weekend Hourly Truck Volumes on I-710 Northbound, Before/After PierPASS 32Figure 3.5: Changes in PM Peak Hour Traffic on Freeways Proximate to the Ports,
Scenario 4 (Growth + PierPASS) 36Figure 3.6: Changes in Night Traffic on Freeways Proximate to the Ports, Scenario 4 36Figure 4.1: Total Hours, Paid, Registered and Casual Workers 44Figure 4.2: Total Paid Hours per 1.000 Assessed Tonnage 44
LIST OF TABLES Table 2.1: State Legislative Activity Associated with Ports, 2000-2004 17Table 2.2: PierPASS Implementation Timeline 21Table 2.3: Evolution of MTO Discussion Agreements 24Table 3.1: Heavy Truck Traffic Average Hourly Share by Time Period, Before and After PierPASS 31Table 3.2: Description of Traffic Simulation Scenarios 33Table 3.3: Traffic Simulation Results, RSAs 19 and 20 only 34Table 3.4: Scenario Result Comparisons (Percent change), RSA’s 19 and 20 only 35Table 4.1: Terminal Descriptions 39Table 4.2: Gate Operations before PierPASS 40Table 4.3: Expectations and Assessment of PierPASS 42Table 4.4: Driver Perceptions of PierPASS 46Table 4.5: Driver Reasons for Not Wanting to Work Nights and Saturdays (PierPASS) 48Table 4.6: Driver Reasons for Not Wanting to Work Nights and Saturdays (CTA) 48

Extended Gate Operations Final Report -- 6/11/2008 --8
1 INTRODUCTION
1.1 INTRODUCTION The use of extended gate hours has long been promoted as a way to both improve port
productivity and smooth truck flows associated with port drayage operations. Although ships are typically serviced 24/7 in the US, drayage operations are limited by terminal operating practices, which typically occur on weekdays from 8 AM to 5 PM. Rapidly increasing trade volumes at the Los Angeles and Long Beach Ports have been associated with increasing congestion at the ports and on the surrounding highway system, and with increased vehicle emissions.
In response to efforts to regulate gate operating hours, the ports and terminal operators established the PierPASS program in 2004 and implemented it in July 2005. Extended gate operations were offered, and a fee was imposed on container moves during regular weekday hours, Monday through Thursday. Proceeds from the fees are allocated back to terminal operators to offset the additional costs associated with extended gates.
This report presents results from a comprehensive evaluation of the PierPASS program. The objectives of the evaluation were to 1) understand how and why the PierPASS program was implemented, 2) determine whether it achieved its stated goals, 3) identify its impacts on other parts of the supply chain, and 4) assess implications for long-term change and transferability to other ports in the US.
The research team used a mixed methods approach. The development and implementation of the program was monitored for a period of over 2 years. An institutional analysis of the program and its outcomes was conducted. Impact of extended operations on traffic flow was analyzed via simulation. Impacts on terminal operators, truckers, warehousing, and beneficial cargo owners were examined via surveys and interviews. The evaluation is based on data from many sources, including: PierPASS, Inc. Caltrans District 7 Trucker survey data Pacific Maritime Association labor data Southern California Association of Governments Trade media, newspapers Extended interviews with port management, terminal management, warehousing, cargo owners, and community groups
This research follows a previous evaluation of California Assembly Bill (AB) 2650, a
regulation which required terminal operators to offer either extended gate hours or appointments for drayage moves in and out of the ports.1 The previous project allowed the research team to continuously monitor events leading up to the PierPASS program. The PierPASS research began shortly before the program was implemented and continued through June 2007, allowing observation of nearly two years of operations. The sequential evaluation of two major changes in port operations provided an opportunity for in-depth analysis of the political and institutional
1 METRANS project 04-06; see Giuliano et al, 2005.

Extended Gate Operations Final Report -- 6/11/2008 --9
aspects of these changes. This research took place during a highly dynamic period for port operations and
international trade. Growing public concern over air quality, traffic congestion, and more general quality of life issues, together with the uniqueness of PierPASS, raised the visibility of the ports both locally and nationally. Over the course of this research we have observed a large shift in the policy and regulatory environment. These changes led to a greater emphasis on the policy and institutional aspects of the PierPASS evaluation.
The report is organized as follows. First, the remainder of this chapter provides background on growth of port-related trade and a review of the relevant literature. Chapter Two describes the implementation of PierPASS (including results on use of extended hours), discusses motivating factors that led to its development, and describes the institutional and political context from which PierPASS emerged. Chapter Three presents an analysis of impacts on the highway system. Chapter Four discusses impacts on ports, terminal operators, and other parts of the supply chain: truckers, trucking companies, warehousing, and cargo owners. Chapter Five presents an overall assessment of PierPASS and discusses policy implications.
1.2 TRENDS IN GOODS MOVEMENT AND INTERNATIONAL TRADE Economic restructuring and globalization have vastly increased the volume of
international trade. The share of US GDP attributed to merchandise trade grew from 15% in 1991 to 21% in 2000 (Bureau of Transportation Statistics, 2003a). The U.S. is the world’s largest maritime trading nation; the value of water-borne goods shipments exceeds that of all other modes of transport of international merchandise freight. It accounts for about 38% of all US international merchandise trade value (Bureau of Transportation Statistics, 2003b).
Freight flows by all transportation modes have increased. Total US ton-miles of freight increased from 3.2 billion in 1990 to 3.8 billion in 2001 (Bureau of Transportation Statistics, 2006). Truck and air transport have increased faster than other modes, with trucks carrying about 80% of all domestic freight in terms of value (Bureau of Transportation Statistics, 2005). Increased freight volumes have had significant impacts on metropolitan areas. Traffic at major freight generators (ports, airports, rail yards, warehouse/distribution nodes) has greatly increased, adding to congestion and impacting surrounding neighborhoods. Increased truck traffic contributes to congestion, more delay due to accidents, and more vehicle emissions.
1.2.1 Growth of San Pedro Bay Ports Since the early 1990s East Asian exports to the U.S. have grown some 7% annually, and
U.S. trade with China alone is expected to more than double by 2020. Because of its proximity to Asian production centers, California in general, and the Los Angeles Region in particular, has accommodated a large share of this growth. In 2005, the two ports accounted for 34% of total US container traffic (in TEUs, or twenty foot equivalent units) and 85% of all California container traffic (American Association of Port Authorities, 2006). In 2005, two-way trade between China and the LA Customs District increased nearly 18% over the previous year to $109 billion.
As a result, the combined Ports of Los Angeles and Long Beach saw substantial growth

Extended Gate Operations Final Report -- 6/11/2008 --10
in container volumes, continuing a decade long trend, as shown in Figure 1.1. The two ports moved nearly 16 million twenty-foot equivalent units in 2006, nearly double the 1999 combined volumes. If these trends continue, 2010 TEU volume could exceed 20 million. Growth of the Los Angeles/Long Beach complex has exceeded that of any other West Coast port, as shown in Figure 1.2. Continued growth is explained by scale economies in international shipping, the large local consumer market, good connections to the US national market, and extensive supporting industries.
Figure 1.1: Growth of LA/LB Port Container Volume
LA/LB Combined Annual TEU Volume
0.00
2.00
4.00
6.00
8.00
10.00
12.00
14.00
16.00
18.00
1999 2000 2001 2002 2003 2004 2005 2006
TEU
(mill
ions
)
Source: Ports of Los Angeles and Long Beach

Extended Gate Operations Final Report -- 6/11/2008 --11
Figure 1.2: Growth in West Coast Container Traffic
Source: American Association of Port Authorities
1.2.2 Impacts on Los Angeles Region Growth in trade has generated substantial benefits and costs on local residents. On the
positive side, it is estimated that the logistics sector accounts for about 585,000 jobs (1 in every 12 jobs in the region), and provides significant tax revenue to local governments (Chang, 2005). However, these economic benefits come with large external costs: congestion, air pollution, noise, and other impacts on local quality of life. Erie (2004) has observed that international trade creates policy dilemmas because the benefits are dispersed (in this case lower prices for goods and services throughout the US) and the costs are concentrated. The dilemma is particularly strong for local public officials, who are dependent upon trade for tax revenue and economic development, but at the same time must respond to legitimate and increasingly serious citizen concerns.
The most noticeable impact is from trucks on the roads and the congestion associated with them. It is estimated that the ports generate about 35,000 daily truck trips. Heavy-duty truck (HDT) miles in the Los Angeles region (i.e. those trucks with five or more axles) have increased faster than total vehicle miles traveled. The major routes serving port-related trade carry very large HDT truck shares: 12 to 14% of total daily traffic, compared to 2 – 3% for other highways in the region.2 High volumes of trucks add to congestion problems and contribute disproportionately to incident related delays (Haveman and Hummels, 2004; California Highway Patrol, 2003).
Perhaps the most serious impact of increased trade is air pollution. The ports are the largest single source of emissions, in part because the local air district, AQMD, does not have jurisdiction over ships or trains. Ships use high sulfur content “bunker fuel,” the cheapest form
2 Calculated by the authors from 2002 California State Department of Transportation, District 7 traffic volume data.
0.00
1.00
2.00
3.00
4.00
5.00
6.00
7.00
8.00
1995 1996 1997 1998 1999 2000 2001 2002 2003 2004 2005
TEU (millions)
Los AngelesLong BeachOaklandTacomaSeattleVancouver

Extended Gate Operations Final Report -- 6/11/2008 --12
of diesel. Adding to the problem are the unique characteristics of the port drayage segment of the trucking industry which result in an older (and dirtier) heavy duty diesel truck (HDDT) vehicle fleet.
Transportation sector emissions have grown at an average rate of about 2% annually (not including international bunker fuels) since 1990 compared to .8% for non-transportation sectors. Furthermore, emissions from trucks and locomotives have grown faster than emissions from cars (US Department of Transportation, 2006). Ships emit some 23 tons of sulfur oxides on a daily basis in Southern California and are responsible for almost 60% of the port’s diesel emissions (Hanson, 2006a); the ports as a whole are responsible for some 48 tons of NOx on a daily basis (Hanson, 2006b). The ports’ contribution to PM-related pollution in the region is expected to jump from 25% to 42% by 2020 (Hanson, 2006c).
1.2.3 Prior Research The vast freight literature is mainly in logistics, operations research, or transportation
economics (e.g., Button and Pearman, 1981; Geunes and Pardalos, 2005; Gunther and Kim, 2005; Chadwin et al, 1990). The combination of dramatic increases in freight traffic and transportation systems operating at or near capacity has only recently resulted in growing visibility of freight and its role in urban congestion and environmental problems. It is perhaps not surprising that the emerging literature on urban impacts is coming from metropolitan areas where freight is a growing problem, for example Los Angeles, New York and Chicago in the US.
Environmental impacts of port-related goods movement and their environmental justice implications have been addressed for both New York and Los Angeles. Lena et al (2002) document high volumes of truck traffic in low income neighborhoods near the Ports of New York and New Jersey. They calculate estimates of emissions, and conclude that low income residents experience higher exposure levels. Southern California studies have shown that the air pollution from diesel exhaust increases cancer risk, and that the entire Los Angeles-Long Beach port complex is the single largest source of diesel pollution in the region (SCAQMD, 2000). A long-term child health survey has demonstrated a significant relationship between school absences and exposure to particulate concentrations (Coussens, 2004). Schweitzer (2006) found that exposure to risk from hazardous materials transport is greater among low income households.
Also related to this paper is a growing literature on operational changes that lead to improved productivity and efficiency of the supply chain. These include the use of “virtual” container yards (Chang et al, 2006; Davies, 2006) which allow truckers to locate an empty container close to the site where they have an import drop-off, thereby eliminating a non-revenue trip to a terminal where empties are typically stored. Other strategies include the diversion of truck freight to rail or short sea shipping (Le-Griffin and Moore, 2006; Banister and Berechman, 1999) or gate appointments which allow truckers to make a scheduled pick-up or drop-off (Giuliano and O’Brien, 2006; Namboothiri and Erera, 2007; Yahalom, 2001).
PierPASS extends truck gate operations beyond regular weekday hours. There are few examples of extended gate operations at North American ports, and we found no empirical research on the impact of extended gates on port productivity. A study on the potential for off-peak freight deliveries in the Manhattan and Brooklyn areas considered how operational changes would impact costs for shippers and receivers (Holguin-Veras et al, 2006). Interview research revealed several cases where off-peak deliveries resulted in increased productivity for shippers. The impacts of a greater number of customers requesting off-peak deliveries depended on the

Extended Gate Operations Final Report -- 6/11/2008 --13
distance and travel time to the first stop. The study also showed that receiver costs likely increase in the off-peak, primarily due to labor. Most related to this research is our recent evaluation of the effort to extend gate operating hours via regulation in California (Giuliano and O’Brien, 2006). In this case the regulation, AB 2650, aimed at reducing diesel truck emissions. It imposed a penalty of $250 on terminal operators for each truck delayed more than 30 minutes waiting to enter the gate. Terminals that operated gates 70 hours per week or offered trucks an appointment system to pickup or deliver cargo were exempt. The legislation had limited impact. No terminal at the ports of Long Beach and Los Angeles extended its hours of operation in response to the legislation; all but one terminal implemented an appointment system, and there were no measurable changes in truck queuing or pickup and drop-off transactions as a result of the regulation.
Outcomes of AB 2650 were explained in the context of the economic and institutional structure of the international trade supply chain. Terminal operators chose to implement an appointment system because costs were far less than offering extended gate hours, and because the risks of non-compliance were small. Limited use of appointments on the part of trucking companies is explained by the way appointment systems worked. An appointment did not assure timely processing of the transaction, and hence did not reduce transaction durations. Although AB 2650 had limited impacts on port operations, it was more significant as a signal to port interests that their operations were no longer beyond the bounds of public intervention. It therefore set the stage for the PierPASS program (Giuliano and O’Brien, 2007).

Extended Gate Operations Final Report -- 6/11/2008 --14
2 PIERPASS IMPLEMENTATION This chapter begins with some history on events that we identify as contributing factors
to the establishment of the PierPASS program. We then discuss the economic and regulatory structure of the international trade supply chain. This background provides the context for understanding how and why the PierPASS program was established. The third section describes the development, structure and implementation of the program. The last section describes the use of extended operations based on data provided by PierPASS, Inc.
2.1 WHY PIERPASS: FORCES FOR CHANGE
We identify four contributing factors to the establishment of PierPASS at the Los Angeles and Long Beach ports: sustained and rapid growth of international trade, increased public awareness of port-related trade impacts, capacity constraints at the ports, and legislative pressure.
2.1.1 Rapid Growth of International Trade We discussed the rapid growth of port-related trade in Chapter 1. Combined TEU annual
volumes at the ports have increased an average of 1 million TEUs per year for the last seven years, and in 2006 reached 15.8 million. The next largest west coast port, Oakland, had a total 2006 volume of 2.4 million TEUs, and an increase of 700,000 TEUs over the same period. This dramatic growth has greatly contributed to truck traffic on the region’s main freight routes and to air pollution, particularly diesel particulate emissions.
2.1.2 Increased Public Awareness Some key events raised public awareness of local congestion and air pollution problems
and generated political pressure for government agencies to take action. The first was the release of the South Coast Air Quality Management District’s (SCAQMD) Multiple Air Toxics Exposure (MATES) II Study in 2000. It assessed potential disproportionate cancer burdens and found that 71% of all cancer risk from air pollution comes solely from diesel exhaust (SCAQMD, 2000). A widely circulated map from the report showing concentrated diesel emissions was used to demonstrate that a “diesel death zone” existed in and around the ports. More recent studies have reinforced the MATES II results.
A second key event was the Natural Resources Defense Council’s lawsuit against the Port of Los Angeles over the construction of the China Shipping Terminal in 2000. The settlement included $10 million to clean up diesel trucks. It also required the terminal to use yard equipment powered by cleaner burning fuels and to test a new alternate marine power (amp) technology, cold ironing, so that ship engines could be turned off while in port.
Other events have raised the public profile of port-related trade. These include the 9/11 terrorist attack; the opening of the 20-mile long Alameda Corridor rail cargo expressway in April 2002 after several years of contentious construction; and the 2002 port shutdown resulting from a breakdown in labor negotiations. The ports have also had unwelcome visibility as a result of a major study of the I-710, the main highway connecting the ports with intermodal facilities just east of downtown Los Angeles. The report intended to determine what improvements would be necessary to accommodate the expected tripling of port trade by 2020. Forecasts of double or

Extended Gate Operations Final Report -- 6/11/2008 --15
triple cargo volumes were seen by growing numbers of local residents as unacceptable and avoidable. It became increasingly clear to elected officials that without significant mitigation, infrastructure improvements such as the I-710 would not be politically acceptable.
2.1.3 Capacity Constraints A third factor contributing to PierPASS was the 2004 peak trade season, which traditionally runs from late summer until early fall and coincides with the pre-holiday delivery schedule of shippers and retailers. The industry had anticipated a 5% increase in container volume, but the actual increase was 12%. The increase overwhelmed the ports; ships could not be processed as quickly as they were arriving, causing a growing queue of ships in the harbor. A shortage of longshore labor, the arrival of more large “mega-ships” carrying 8,000 TEUs, and a coincidental railroad labor shortage contributed to processing delays. The result was additional transit times of 6-8 days for US shippers (Waterfront Coalition, 2005), including an additional 2-3 days on the intermodal rail network. More than 100 vessels were diverted from the San Pedro Bay ports because of these problems.
The inability of the ports to handle the increased cargo sent a clear signal that productivity would have to improve if the ports were to remain competitive. Growing public opposition to infrastructure investments that would facilitate port-related trade expansion, scarcity of public funds, and a lengthy environmental review process ruled out physical expansion in the short-term. The most frequently discussed short-term solution involved opening the marine terminal gates over a longer period of the day. The gates are the entry points for trucks picking up and dropping off cargo. They typically operate from 8 AM to 5 PM weekdays. Extending gate hours would both increase cargo handling capacity and reduce port-related congestion by spreading truck traffic over more hours.
Given the growth in international trade and the obvious incentives for ports and terminal operators to increase capacity, one might ask why terminals typically do not accommodate cargo pickup and delivery outside of weekday hours. The main reason is longshore labor costs. The longshore labor contract provides for differential shift pay, overtime pay, minimum hour guarantees, and minimum size of labor work units. Terminal operators seek to maximize longshore labor productivity, and therefore restrict cargo pickup/delivery activities to a single day shift.3 Evening and weekend operating hours are typically limited to special arrangement with the ocean carrier or preferred customers moving large numbers of containers.
The second reason for the absence of extended gate hours is resistance from truck drivers and customers. For truck drivers, off-peak work means either an extended work day or a shift in schedule to a less family-friendly night shift. For owner-operators, neither comes with a guaranteed pay increase. Warehouses, distribution centers, manufacturers and other entities must also be available to process cargo during off-peak hours. Typically this involves additional labor shifts. In some areas, local zoning prohibits night or weekend deliveries. In the summer of 2005, when PierPASS began in Southern California, SSA Marine Terminal at the Port of Oakland began its own experiment in keeping gates open at night, but abandoned the effort in December 2005, claiming that it did not meet expectations with regard to traffic.
3 The loading and unloading of ships however is performed around the clock due to the high cost of keeping a vessel at berth.

Extended Gate Operations Final Report -- 6/11/2008 --16
2.1.4 Legislative Pressures Public concerns with port growth and its associated impacts have led to steadily
increasing efforts to regulate activities related to trade operations. These efforts have focused primarily on air pollution, because of the precedent of regulation based on human health impacts. Table 2.1 shows state legislative efforts to address port-related trade impacts between 2000 and the development of PierPASS. The first successful bill was AB 1775, which called for covering coke both in transport and in open storage.4
Outside pressure to extend gate operating hours had been growing for several years. Assembly Bill (AB) 2650 was passed in August of 2002, but only after a provision that would set limits on turn times (the time required to complete a transaction within the terminal) was removed, in response to opposition from marine terminal operators (MTOs). As noted above, the legislation had limited impact, at least in the short term (Giuliano and O’Brien, 2006).
At the same time State Senator Alan Lowenthal, who had sponsored AB 2650 as an Assemblyman, was proposing new legislation to require extended gate hours. AB 2650 had confirmed the seriousness with which elected officials viewed the impacts of goods movement. As a result, when Lowenthal introduced AB 2041 requiring extended gates in February of 2004, it was not viewed as an idle threat. AB 2041 established a regional governing body, the Port Congestion Management District, and authorized a charge for cargo moved at the Ports of LA and Long Beach. The fee revenue would be spent on freight-related congestion mitigation projects. The bill was adamantly opposed by MTOs; fee revenue would be under the control of a public authority, and provisions included stringent reporting requirements and quarterly public hearings. AB 2041 was not the only port-related bill under consideration. Lowenthal also introduced AB 2042 at the same time. This bill would have established an air quality baseline for the two ports. No project would be allowed that increased pollution levels beyond the baseline. The California Chamber of Commerce placed it on a list of “job killer” legislation.5 By 2004 port-related trade had become a highly visible and contentious political issue. Terminal operators were faced with a difficult choice, since passage of AB 2041 seemed certain. This set the stage for ports and terminal operators to set up their own extended gate program if Senator Lowenthal agreed to withdraw AB 2041.
4 Coke is a solid byproduct of petroleum refining. 5 AB 2042 was vetoed by the Governor in September of 2004.

Extended Gate Operations Final Report -- 6/11/2008 --17
Table 2.1: State Legislative Activity Associated with Ports, 2000-2004 Year Bill Status Description 2000 Assembly
Bill (AB) 1775
Passed by CA legislature and signed by Gov. Davis
Required covers on coke piles and on coke in transport
2002 AB 2650 Passed by CA legislature and signed by Gov. Davis
Fined terminal operators for queues outside terminal gates over 30 minutes long; Exemptions for terminals with 70-hour gates per week and/or truck appt. systems; Amended to clarify definitions of queuing and idling
2004 AB 2042 Passed by CA Legislature; vetoed by Governor Schwarzenegger
Established baseline for “no net increase” in emissions
2004 Senate Bill (SB) 1397
Passed in CA Senate; died in Assembly
Allowed South Coast Air Quality Management District to regulate locomotive emissions
2004 AB 2041 Withdrawn by Assemblyman Lowenthal
Established port management congestion district and allowed container fee for environmental mitigation, infrastructure improvement and security enhancement; Provisions of bill not operative if fee collected and at least 20% of inbound cargo moved in off-peak
2.2 ECONOMIC AND REGULATORY STRUCTURE
In order to understand how and why the PierPASS program was structured and implemented as it was, it is necessary to describe the economic and regulatory structure of the port-related supply chain. Our perceptions of relationships among actors are based on monitoring of events and activities over the past four years. We identify steamship lines, ports, terminal operators, and their major customers as the dominant actors in the supply chain. The steamship lines are foreign flag carriers, and are subject primarily to international maritime agreements with respect to operating practices.

Extended Gate Operations Final Report -- 6/11/2008 --18
2.2.1 Ports and Terminal Operators Public ports in California, including both the Port of LA and the Port of Long Beach,
operate under the 1911 California Tidelands Trust Act, meaning that the ports’ operating authority is granted by the State. The ports are managed by governing boards whose members are appointed by their respective mayors, and who have significant authority over port management. This lack of direct accountability has historically insulated the ports from political pressure (Erie, 2004). The funds of each agency are also largely protected from use for other purposes by state law and city charter. The ports operate as landlords (tenant terminals have long-term lease agreements), and their primary focus is a stable and adequate source of lease revenues.
Tenant marine terminal operating companies are either owned by or have long-term contractual agreements with the steamship lines. They serve specific customers or product lines. They manage the movement of cargo between ships and the landside shippers who serve steamship line customers -- foreign manufacturers, wholesalers and retailers. These entities are interdependent and share common economic interests: process as much cargo as possible at the lowest possible cost. Ports and terminal operators have historically had significant independence, particularly in dealing with local elected officials. Not only do ports generate large economic benefits and provide protected revenue to the cities, they also have a certain amount of protection from local regulatory oversight under Tidelands Trust Law.
Federal oversight for ports and port operations is provided by the Federal Maritime Commission (FMC). The FMC is an independent regulatory agency which administers the Shipping Act of 1984 and the Ocean Shipping Reform Act of 1998. The Shipping Act allows terminal operators anti-trust immunity under certain conditions: to enter into agreement with each other to discuss rates, conditions of service or cooperative working arrangements. The FMC reviews and processes these agreements, ensuring that the agreement in some way enhances efficiency, facilitates projects that reduce congestion in and around ports, promotes clean-up measures or funds critical freight infrastructure, all while guarding against unreasonable increases in transportation costs or a decrease in service. It is this provision that allows terminal operators to bargain collectively with longshore labor, as will be further described below.
Major customers in Asia-Pacific trade include the large discount retailers, e.g. Wal-Mart and Target. Major customers can influence ship schedules, rates, and cargo handling. For example, MTOs may offer special pickup times, or allow longer dwell time for cargo on the docks for preferred customers.
The presence of large scale economies in international trade has led to the concentration of trade in a few very large ports. Ever larger ships require deeper ports and larger dockside operations, which imply infrastructure investments that need high volumes and long-term contracts to cover costs. On the landside, more trade volume generates supporting activities – third party logistics operations, secondary manufacturing, freight distribution, and high quality rail transport – that further reinforce the advantages of large ports. These dominant actors therefore have significant market power within the international supply chain.

Extended Gate Operations Final Report -- 6/11/2008 --19
2.2.2 The Longshore Union Another important actor in the supply chain is longshore labor. Represented on the west
coast by the International Longshore and Warehouse Union (ILWU)6, it is arguably the most powerful (and highest paid) unionized labor force in the US. The ILWU contract covers wages and benefits, working conditions, and allocation of labor. It also controls the size of the labor force. As trade volumes have grown, longshore labor has enjoyed favorable bargaining conditions, and hence has been able to retain significant control over dock operations.
Unlike many other industries, the terminal operators have been given authority by the FMC (see above) to act cooperatively in dealing with longshore labor. They do so through the Pacific Maritime Association (PMA), whose members include terminal operators, stevedore companies, and steamship lines. Thus a precedent for cooperative action among these parties exists. Labor contracts are the outcome of bilateral negotiations between the PMA and the ILWU, and hence the same labor provisions apply at all west coast ports. Given the importance of international trade to the US economy, the bargaining power of the ILWU is substantial, as illustrated by the 2002 west coast port shutdown (Giuliano et al, 2005).
The cooperative structure established for negotiating with the ILWU has provided a model for dealing with other issues, including efforts to regulate port activities. The terminal operators used FMC-authorized discussion agreements to establish gate operation parameters in response to AB 2650, and ultimately to establish PierPASS.7
Once an ILWU contract is in place, terminal operators (MTOs) have few options for economizing on longshore labor. This is why MTOs have opposed extended gate hours, claiming that the volume of cargo moved during evenings and weekends would not be sufficient to cover the additional costs of dock labor. The current contract, for example, requires a second shift (evening) premium of 1.3 times the hourly rate on weekdays, and 1.5 times the hourly rate for any work on weekends. In addition, shifts are subject to 8 hour guarantees.
2.2.3 Drayage Trucking In contrast, the drayage trucking industry has little influence within the international
supply chain. The truck drayage industry is composed mainly of owner-operator drivers who contract with small trucking companies. These are low-skill, low-pay jobs. Drivers receive a lump sum based on the cargo hauled and the distance traveled which must cover all costs including fuel, insurance, registration and maintenance. Truckers have no formal means of influencing the behavior of terminal operators (or of the trucking companies who contract with them). Because they are considered private contractors and not employees, drivers are prohibited under federal anti-trust legislation from cooperative action that could impede interstate commerce. This would include setting a single rate for their services. There are many other participants in international trade: railroads, third party providers, customs brokers, etc. Two Class I railroad companies serve the San Pedro Bay ports, Union Pacific and BNSF. By virtue of the importance of the rail network in distributing goods throughout the US, the railroads also have significant market power. Other industry segments are more fragmented, and to date have had little apparent influence in port-related activities.
6 On the east coast, labor is represented by the International Longshoremen’s Association (ILA). 7 Technically the FMC does not approve requests. Rather, notice of the action is published in the Federal Register for 10 days. If there is no challenge, the FMC agreement is changed accordingly.

Extended Gate Operations Final Report -- 6/11/2008 --20
Overwhelming growth in trade volumes has made ports and MTOs much more vulnerable to both internal and external pressures. MTOs not only have an incentive to increase productivity because cargo volumes dictate it, they are responding to pressures from their landlord ports on environmental impacts. The ports can exert influence in the lease negotiation process and are more willing to do so now that they are feeling external pressure from elected officials, environmentalists and community groups who live near the ports. This latter group has been emboldened by successes in the legislative process and in the courts. The development of the PierPASS extended gate program took place in the context of these complex relationships.
2.3 DEVELOPMENT, STRUCTURE AND IMPLEMENTATION OF PIERPASS This section addresses the legislative effort that led to the development of PierPASS. We
analyze the response of terminal operators to the threat of regulatory action that would have required extended gate hours. We pay particular attention to the role of the FMC in allowing terminal operators to coordinate program development efforts and collect PierPASS fees in a way that avoided most outside scrutiny. This section also lays out the series of events that followed the creation of PierPASS, Inc. and led to the launch of the OffPeak program at the Ports of Los Angeles and Long Beach.
2.3.1 Developing PierPASS Implementation of the PierPASS program is summarized in Table 2.2. A more extensive timeline can be found in Appendix B. Senator Lowenthal, who was then Assemblyman Lowenthal, introduced AB 2041 on February 17, 2004. AB 2041 established a regional governing body, the Port Congestion Management District, and authorized a charge for cargo moved at the Ports of LA and Long Beach between the peak hours of 8 AM and 5 PM. A Port Congestion Management Fund would be spent on projects meant to alleviate freight-related congestion. The bill specifically mentioned increased use of rail for inland shipping and infrastructure improvements. In April of 2004, the legislation was amended and the membership of the District Board better defined to include representatives from the two ports, longshore labor, the City Councils of both Los Angeles and Long Beach, the trucking community and the residential community in the vicinity of the San Pedro Bay port complex. AB 2041 was further amended in May of 2004 to require that the terminal operators report specific information, including turn times, to the Board. The prospect of a Board comprising elected officials, truckers, longshore labor and the community becoming involved in terminal operations and reviewing turn times was not welcomed by the industry.

Extended Gate Operations Final Report -- 6/11/2008 --21
Table 2.2: PierPASS Implementation Timeline Date Event 2/2004 AB 2041 introduced 4/2004 AB 2041 amended; District Board defined 5/2004 AB 2041 amended to include MTO reporting requirements 6/2004 MTOs file discussion agreement amendment request with FMC,
allowing coordinated off-peak surcharge 7/2004 Discussion agreement amendment becomes effective 8/2004 MTOs announce establishment of PierPASS, Inc 8/2004 AB 2041 withdrawn 11/2004 Target program start date 5/2005 Registration opens 7/2005 Program launch 12/2005 PierPASS claims 1 million truck trips diverted 4/2006 Peak fee increase to $50/TEU 6/2006 PierPASS claims 2 million truck trips diverted 8/2006 New fee collection procedures 1/2007 PierPASS announces TruckTag program
As a result, in June 2004 the terminal operators sought authority from the Federal Maritime Commission “to discuss, agree upon, implement and enforce rules, procedures and charges intended to encourage the use of off-peak hour services, as well as to adopt and implement related procedural and administrative mechanisms.” This was done as an amendment to an existing West Coast MTO Agreement. This West Coast MTO Discussion Agreement (FMC Agreement No. 201143) first became effective in June of 2003. It allowed terminal operators at ports within California, Oregon and Washington to meet together in order to discuss “terminal rules, regulations, procedures, practices, terms and conditions for motor and rail carriers” involving a number of issues including gate rules, security, and fees charged shippers for leaving cargo on the docks longer than the allowed “free time” (demurrage). The agreement also authorized the MTOs to discuss compliance with various regulations. Specific mention is made of the Maritime Transportation Security Act, passed in 2002, which required ports and terminals to develop security and incident response plans with approval from the Coast Guard. Evolution of the MTO discussion agreements is summarized in Table 2.3.
The 2004 amendment, which became effective on July 19 (FMC Agreement No. 201143-004), was a more specific document. It authorized terminals to discuss, agree upon, establish, revise, maintain, cancel and enforce terminal rates… charges, rules, regulations, procedures, practices and terms…” A clause was added that specifically allowed “off-peak operations at marine terminal facilities in California.” This included
“measures to encourage use of off-peak hours, recovery of costs of maintaining off peak operations, hours and days of service, services and facilities to be made available, and measures to facilitate efficient payment, collection and distribution of any funds collected with regard to off-peak operation. Any measures, activities or charges adopted pursuant to this sub-paragraph may be applied with respect to peak hour shipments in furtherance of or in connection with an off-peak hours program.”

Extended Gate Operations Final Report -- 6/11/2008 --22
The authorizing section also included the development and use of technology including radio frequency ID (RFID) technology. PierPASS would later incorporate an RFID truck tag program into its operations.
The implementation section of FMC Agreement No. 201143-004 is also much more explicit than the original agreement. It authorizes the formation of a separate legal entity to implement and administer agreements as well as the use of subcontracts with third-party vendors.
FMC Agreement No. 201143-004 also established voting procedures for parties to the agreement based upon revenue units; revenue units are based on total loaded TEUs at member terminals; and established cost recovery fees based on revenue units. This means that the PierPASS fees charged to the shipper would be allocated to terminal operators based on total loaded moves (including rail and gate moves, but not transshipments or domestic moves), and not off-peak activity. The July 2004 amendment made the original discussion agreement a conference agreement. While the original document allowed MTOs to talk about rates and agree upon them voluntarily, the amendment resulted in a binding rate authority and a common tariff. Under both types of agreement, the MTOs enjoy anti-trust immunity. Both discussion and conference agreements also have the same review process. Amendments are allowed to become effective 45 days after they are filed unless the Commission seeks an injunction to enjoin the agreement in federal District Court, finding that the agreement likely will produce an unreasonable increase in transportation cost or an unreasonable reduction in service. This follows general notification in the Federal Register and a 10-day comment period. The Commission itself rarely conducts a formal review or takes a formal action. The ability to seek an injunction against an agreement allows the FMC to wield a “big stick;” but it is one that the Commission has never used since the Shipping Act, which ushered in the current agreement process, was passed in 1984. Prior to 1984, competitor protests and long delays were common.
The June 2004 request asked for expedited review. The FMC allowed the amendment to become effective on July 19. On August 23 the MTOs announced the establishment of a special purpose non-profit entity called PierPASS, Inc. to act on behalf of the MTOs and coordinate a program known as OffPeak to extend operating hours at the terminals. Lowenthal then agreed to withdraw his bill.
There have been two subsequent amendments to the West Coast MTO Agreement (Table 2.3). FMC Agreement No. 201143-005, effective in April 2005, made two important additions. The first was to add to the implementing authority section specific reference to the non-profit PierPASS, Inc. and the limited liability company PierPASS L.L.C. The entities were given the authority to “evaluate, grant, deny, and administer credit to customers,” distribute charges collected from customers and exercise lien and other legal rights on behalf of terminal operators. This modified section also granted the same rights to the terminal operators themselves. The second major addition established a provisional three-year sunset clause for the off-peak program. It did so by allowing MTOs to withdraw from the agreement no sooner than three years from the effective date of a Traffic Mitigation Fee, with six months prior written notice. In FMC Agreement No. 201143-008, effective January 18, 2007, the conference agreement begins to anticipate the need for coordinated terminal efforts in response to new environmental mandates established by the Ports of LA and Long Beach as part of the Clean Air Action Plan adopted by both ports in November 2006.

Extended Gate Operations Final Report -- 6/11/2008 --23
2.3.2 Structuring PierPASS When Lowenthal agreed to withdraw AB 2041, it allowed the marine terminal operators
to use the conference agreement to structure PierPASS, Inc. according to its needs. This included deciding how to collect fees, how to allocate them to parties to the agreement, and how to control the flow of information. This differed greatly from the structure that would have been imposed on the MTOs had the Lowenthal bill passed. Fees would not have gone back to the MTOs to cover the cost of off-peak operations; and terminal operators would not have been able to limit access to financial information about off-peak operating costs.
Because the conference agreement limits the anti-trust immunity to parties to the agreement, the discussion group made it possible to limit the number of participants at the table when the PierPASS structure was developed. This meant that not only was the trucking community excluded, but also the ports (which are subject to other FMC-regulated working agreements). Technically, ocean carriers and terminals not in California were also excluded although many of the terminal operators involved have legal ties to carriers and terminal operations in Washington and Oregon.
The discussion group decided to limit the focus of the entity it created to administer the off-peak program. The purpose of PierPASS, Inc. was to collect traffic mitigation fees and return them to the MTOs based on the allocation methods called for in the conference agreement. It did not involve itself in all aspects of off-peak operations. This allowed the MTOs to effectively argue that they did not control financial data on off-peak moves. The PierPASS office was run by seven employees. Call center functions and IT oversight and development were contracted out to a New Jersey company, which was authorized under the July 2004 amendment. This was not lost on the ILWU which noted that the 65 call center employees were non-union.
The MTOs chose a CEO for PierPASS, Inc., as opposed to a General Manager with broader responsibilities, who reports to a Board of Directors made up primarily of marine terminal operators. The CEO and President is Bruce Wargo, who came to PierPASS from SSA Marine Terminals. He has 34 years of experience in terminal and stevedoring operations, and in facility management, design and construction.

Extended Gate Operations Final Report -- 6/11/2008 --24
Table 2.3: Evolution of MTO Discussion Agreements
Effective Date Purpose & Authority Discussion Subjects Implementation Authority Notes
Agreement 201143
June 23, 2003
Matters related to motor and rail carriers including rate charges, rules, regulations, practices, terms and other conditions of service that involve or affect the relationship between MTOs and motor/rail carriers
Security, access control, gate rules, demurrage, detention, billing, compliance with interchange/leasing agreements, limitations of liability, dispute resolution, compliance with statutes and regulations including federal motor carrier safety regs and Maritime Transpo. Security Act of 2002
Conduct meetings and hold discussions, exchange information
Covers ports in CA, WA and OR
Agreement 201143-004
July 19, 2004
Adds interchange of cargo, chassis and containers and enforcement of terminal rates (binding rate authority and common rates)
Adds off-peak operations at marine terminal facilities in CA; and the development, acquisition and use of technology including RFID
Adds formation of separate legal entities to implement and administer programs; subcontracting authority; and ability to agree upon a common marine terminal operator schedule (excludes surcharges for security expenditures)
Establishes voting procedures and cost recovery methods based on revenue units (total loaded TEUs at a given terminal)
Agreement 201143-005
April 16, 2005
No new additions
No new additions
Adds PierPASS, Inc. and PierPASS L.L.C. as implementing entities including authority to administer credit to customers; Allows MTOs to exercise same authority
Allows for withdrawal from agreement 3 years after establishment of a TMF
Agreement 201143-008
January 18, 2007
No new additions
Adds appointment systems, turn times, truck idling, measures to reduce vehicle congestion at terminals and surrounding areas; Adds measures taken in response to environmental mandates (inc. clean air action plan) and security mandates (inc. Transportation Worker ID Credential)
Transportation Worker ID Credential (TWIC)

Extended Gate Operations Final Report -- 6/11/2008 --25
2.3.3 Launching PierPASS The MTOs funded the start-up costs until the traffic mitigation fee could be collected
directly by PierPASS, Inc. The OffPeak program was originally scheduled to begin in November 2004, charging a $20 per TEU fee for the movement of cargo between 8 AM and 5 PM. The MTOs intended to begin operating one new full service gate per month at all terminals until four night gates (Monday-Thursday, 6 PM- 3 AM) and a Saturday day gate (8 AM- 6 PM) were operational. The program was scheduled to sunset after three years.
Implementation took longer than anticipated. Consultants and vendors were not brought on board until the fall of 2004 and spring of 2005. There were also concerns that labor would not be readily available for additional shifts without additional ramp-up time. The start date was shifted to February 2005, then June 1. The roll-out process was modified first so that a new gate would become operational week-by-week instead of month-by-month; ultimately, the decision was made to open all off peak gates at once. The TMF fee was established at $40/TEU after a confidential third party financial analysis generated an estimate of expected off peak costs. Exemptions were made for empty returns, chassis returns, domestic freight, freight being transshipped to other ports and cargo already subject to an Alameda Corridor rail fee. No fee is charged if the container enters or exits the terminal by road outside of peak hours. PierPASS required fees on import containers to be made prior to pick-up. Exporters were allowed to pay either in advance or within five days after drop-off.
Registration for the program finally began on May 23, 2005 for the beneficial cargo owners (shippers, consignees, or their agents) responsible for paying the fee. On July 23, 2005, the international container terminals at the ports of Los Angeles and Long Beach began their operation of five off-peak shifts per week. PierPASS and the MTOs initially hoped to move 20% of container moves to the off-peak by the end of the first year (the initial target in AB 2041), 35% by the end of the second year and more than 40% by the time the programs was scheduled to sunset.
The kick-off was not altogether smooth. Problems with the registration process forced PierPASS to hold off collecting fees until July 29, 2005. Some truckers and union members held rallies in July calling for drivers to get a portion of the traffic mitigation fee being returned to the terminal operators. However, almost immediately there was a noticeable shift of truck traffic to the off-peak; 5,000 companies had registered with PierPASS by the start date; and on August 17, less than a month after the start of the program, some off-peak shifts were moving 30% of the day’s containers, surpassing the first year’s goal. By December 2005, PierPASS claimed to have diverted 1 million truck trips to the off-peak. That figure reached 2 million by the start of June 2006. There are now more than 14,000 companies registered with PierPASS.
There have been changes in the program since its inception. The original fee of $40 per TEU fee was increased to $50 per TEU on April 24, 2006. The terminal operators argued that this was needed in order to cover the higher than expected costs of sustaining the OffPeak program. In August 2006, PierPASS modified the collection procedures for export drop-offs. Because it was proving difficult to collect fees after containers had been dropped off at the terminal, the modified policy required all fees to be paid in advance.
PierPASS has also expanded beyond the collection of a traffic mitigation fee. On January 12, 2006 PierPASS announced the TruckTag program to provide RFID electronic tags to be placed on trucks in order to facilitate quick and secure check-in at terminals. 10,000 tags were initially distributed to trucking companies to be handed out to drivers. The tags will automatically be read when a truck arrives at a terminal.

Extended Gate Operations Final Report -- 6/11/2008 --26
2.4 USE OF PIERPASS
A major question is what share of container cargo was diverted to off-peak hours as a result of the fee. We are unable to answer this question directly, because we have no data on the share of cargo moving off-peak before PierPASS. Twelve of 14 terminals at the two ports operated some type of service outside of regular weekday hours prior to the start of PierPASS. Of these, 1 offered 7-day gate service, 5 offered some type of weekend service, 3 offered weekday night service, and 3 offered some combination of night and weekend service. This variation reflects differences in customer base and space availability: off-peak service is more frequently provided for cargo “on wheels” (e.g. on a chassis), as less longshore labor is required in picking up or dropping off wheeled loads. When asked what share of cargo moved off-peak, estimates ranged from 10 -30% of all cargo. A stakeholder group convened by Councilwoman Janice Hahn to explore options for reducing truck trips during peak periods estimated 18% before PierPASS.
The PierPASS program exempts several types of cargo: empty containers, transshipments which do not leave the port complex via the road or rail network, domestic cargo, or any cargo subject to the Alameda Corridor Transportation Authority (ACTA) fee. PierPASS, Inc. provided us with daily counts of containers eligible to pay the fee, peak and off-peak. Exempt cargo is not included. Empty container moves account for roughly 1/3 of all truck moves. Transshipments are a small portion of total cargo. About 27% of all cargo is subject to the ACTA fee; of that, about 25% of the fee cargo is transported by truck. These numbers imply that about 55 – 60% of all truck cargo would be eligible for the TMF. In addition, the PierPASS data do not include Friday container moves, since there is no off-peak gate on Friday night. Thus the share of cargo diverted to off-peak as calculated from the PierPASS data is the share of eligible cargo less Friday cargo, not the share of all truck cargo. We were unable to obtain daily container moves, or sufficient sample data to calculate off-peak diversion as a share of total truck moves. A conservative approximation is that 40 – 45% of truck moves is not included in the PierPASS numbers.
From July 2005 to September 2006 (57 weeks of data), the average share of off-peak cargo is 39.8%. Note that this is calculated as the share of Monday-Thursday fee-eligible cargo. Figure 2.3 gives weekly shares, and it is evident that the share is increasing over the period. We estimated a simple regression on the series; the estimated average rate of increase is about 8%/week. The immediate response to the program is evident, with the early weeks in the range of 35%.
With these data we can make upper and lower bound estimates of PierPASS impacts. As an upper bound, we assume that all truck cargo is shifted in the same proportion as eligible cargo; hence the share diverted to off-peak would be about 40%. The lower bound assumption is that all cargo that is exempt moves during the peak. Given about 40-45% of truck moves are exempt, the share diverted would be 22-25% of all cargo. However, there are many dual transactions (data from our previous research showed 27% for one terminal), so it is unlikely that no exempt cargo shifted to off-peak. It therefore appears that significant diversion did take place as a result of PierPASS.
Since the fee increase took place during the time series, we were able to test whether it had any effect on diversion. Although the average share after the price increase is significantly greater than before the price increase (38.8% vs. 41.2%, ANOVA F sig at .000), when we run a regression with both week and a dummy variable for before/after, we find that the dummy

Extended Gate Operations Final Report -- 6/11/2008 --27
coefficient is not significant, meaning that the price increase had no significant impact on the overall trend. It would appear that there is an ongoing adjustment to the PierPASS program; more consignees are finding ways to flex their operations to avoid the fee. There is apparently little sensitivity to the fee itself, suggesting that adjustment costs (additional operating hours, more storage space for cargo, etc.) are the key factor in cargo scheduling. Figure 2.3: Weekly Share of Off-Peak Cargo
Off-peak cargo as share of eligible cargo
y = 0.0796x + 37.476R2 = 0.3607
20
25
30
35
40
45
50
Aug 05
wee
k 1
Aug 05
wee
k 3
Sept 0
5 wee
k 1
Sept 0
5 wee
k 3
Sept 0
5 wee
k 5
Oct 05
wee
k 2
Oct 05
wee
k 4
Nov 05
wee
k 2
Nov 05
wee
k 4
Dec 05
wee
k 1
Dec 05
wee
k 3
Jan 0
6 wee
k 1
Jan 0
6 wee
k 3
Feb 06
wee
k 1
Feb 06
wee
k 3
Mar 06
wee
k 1
Mar 06
wee
k 3
Mar 06
wee
k 5
April 0
6 wee
k 2
April 0
6 wee
k 4
May 06
wee
k 2
May 06
wee
k 4
June
06 w
eek 2
June
06 w
eek 4
July
06 w
eek 2
July
06 w
eek 4
Aug 06
wee
k 2
Aug 06
wee
k 4
Sept 0
6 wee
k 1
perc
ent
Fee increase to $50/TEU

Extended Gate Operations Final Report -- 6/11/2008 --28
3 IMPACTS ON HIGHWAY SYSTEM
The major external factors that led to the PierPASS program were traffic congestion and emissions. The intent of the program was to shift truck traffic to off-peak hours. This chapter examines impacts on the highway system, first with a descriptive analysis of state highway data, and then via simulation modeling.
3.1 IMPACTS ON THE HIGHWAY SYSTEM
Any measurable impact on traffic congestion associated with PierPASS would require a significant shift in truck traffic out of the AM and PM peaks relative to conditions before PierPASS. We are unable to answer this question directly, because we have no data on the share of cargo moving off-peak before PierPASS, as discussed in Chapter 2. Based on the PierPASS, Inc. data, we estimated that diversion resulting from PierPASS is in the range of 22 – 40% of all cargo moves. The PierPASS data indicate that cargo moves have been redistributed, so we expect some impact on the local highway system. We examine impacts in two ways. First, we make simple comparisons of truck traffic volumes before and after PierPASS using data from two state highway locations closest to the port area. Despite the volume of truck traffic generated by the ports (approximately 40,000 daily trips), the scale of the region’s overall traffic volumes would swamp any shift in port-related traffic as this traffic gets dispersed throughout the highway network. These locations provide the best indicators of the localized impacts of PierPASS. Second, we use simulation modeling to estimate effects on vehicle miles and vehicle hours traveled.
3.1.1 Data Traffic volume data were obtained from the California Department of Transportation
(Caltrans) for the years 2004 through 2006. Caltrans maintains 8 count stations in Los Angeles County that provide both hourly volume and vehicle classification data (see Figure 3.1 for locations). Caltrans uses the standard ITE vehicle classification system, and we use classes 8–14 (heavy duty trucks) for our analysis.

Extended Gate Operations Final Report -- 6/11/2008 --29
Figure 3.1: Caltrans Vehicle Classification Count Stations in Los Angeles County
We focus on the count stations closest to the ports, on the I-110 and I-710, as these are the locations most impacted by port-related traffic. Unfortunately, the data files are incomplete, with substantial amounts of missing or incomplete data. We are therefore limited in the number of before/after comparisons that can be made. Most of the results reported here are based on comparable weeks in May, August and December. Data for our simulations was provided by the Southern California Association of Governments (SCAG). We use the 2003 baseline traffic O-D matrix as the basis of our simulations.
3.1.2 Descriptive Analysis If the PierPASS program shifted truck traffic out of the AM and PM peak periods, we
should observe these shifts at count stations near the ports. We compared the temporal distribution of truck traffic for weekdays in May, August and December 2004 (before PierPASS) and 2006 (after PierPASS). We omitted Fridays, as no PierPASS gates operate on Fridays. Figures 3.2 and 3.3 show hourly shares of heavy truck volumes before and after PierPASS for I-710 and I-110 respectively. It can be readily seen that mid-day volumes decreased and late afternoon/evening increased at both locations. There is a slight decrease in AM peak share for I-710 which is not evident for I-110. It bears noting that the I-110 station is closest to the port terminals. The noontime dip reflects the longshore lunch hour. During that hour dock services

Extended Gate Operations Final Report -- 6/11/2008 --30
are limited. Figures 3.2 and 3.3 suggest that there were small shifts of truck traffic out of AM and PM peaks, but a large shift out of the mid-day period. Figure 3.2: I-710 Hourly Share of Heavy Truck Traffic, Before and After PierPASS
0%
1%
2%
3%
4%
5%
6%
7%
8%
9%
10%
0 1 2 3 4 5 6 7 8 9 10 11 12 13 14 15 16 17 18 19 20 21 22 23
20062004
Figure 3.3: I-110 Hourly Share of Heavy Truck Traffic, Before and After PierPASS
0%
1%
2%
3%
4%
5%
6%
7%
8%
9%
10%
11%
12%
0 1 2 3 4 5 6 7 8 9 10 11 12 13 14 15 16 17 18 19 20 21 22 23
20062004
Table 3.1 gives the average share by time period for the two locations. The time intervals are those used by SCAG. It can be seen that the big changes are in the shift of truck traffic out of
Night
AM Peak
Midday
PM Peak
Night
AM Peak Midday
PM Peak Night Night
Time
Time

Extended Gate Operations Final Report -- 6/11/2008 --31
the mid-day period and into night hours. The standard deviation to mean night hour share for I-110 and I-710 combined in 2006 is 0.19, in contrast to 0.21 in 2004. This means that the higher percentage of heavy trucks at night in 2006 is a stable rather than an exceptional phenomenon and its variation over time is even smaller than its counterpart in 2004. There is little change in the AM peak. The PM peak changes are mixed. This is illustrated in Figures 3.2 and 3.3: the before and after lines intersect within the PM peak period. We conducted simple difference of means tests for each location and time period. Mean differences were significant in all cases except the AM peak on I-110 (see Table 3.1). Table 3.1: Heavy Truck Traffic Average Hourly Shares by Time Period, Location, Before and After PierPASS Location Time Period I-110 AM peak
(6 – 8 AM) Mid-day
(9 AM – 14 PM) PM peak
(15 – 18 PM) Night
(19 PM – 05 AM)Before 11.45 56.71 21.04 10.80 After 11.49 47.47 17.84 23.20 Difference +0.04 -9.24* -3.80* +13.60* N=27 I-710 Before 15.22 52.64 16.43 15.71 After 12.92 45.72 18.15 23.21 Difference -2.30* -6.92* +1.72* +7.50* N=25 *Sig at p <0.01
Results from these locations suggest that PierPASS had a significant impact on truck traffic, but the change could also result from a more general redistribution of truck traffic. We therefore examined truck volume data at locations further from the ports. Data problems restricted potential comparisons. We compared similar before/after temporal distributions for the SR-91 count station (see Figure 3.1 for location), and we found no significant differences before/after PierPASS (results not shown).
PierPASS was also intended to shift truck traffic to weekends. Again using the I-710 data, we compared truck volumes on weekends before/after PierPASS. Ten weekends in June, August, and December in 2004 and 2005 and six comparable weekends in 2006 were chosen to assess truck volume on the I-710 northbound. Figure 3.4 gives one example of our results, and shows that total weekend truck volume on I-710 northbound increased after PierPASS, with most of the increase taking place in the early morning hours. Daily weekend average truck volumes before/after PierPASS were about 5000 and 5300 respectively. Before and after volumes were 6400 and 8000 on Saturdays and 3700 and 3500 on Sunday. For the I-110, the average daily truck volumes are similar (about 4500) with a similar increase taking place in the early morning hours.

Extended Gate Operations Final Report -- 6/11/2008 --32
Figure 3.4: Weekend Hourly Truck Volumes on I-710 Northbound, Before and After PierPASS.
0
50100
150
200
250300
350
400
450500
0 1 2 3 4 5 6 7 8 9 10 11 12 13 14 15 16 17 18 19 20 21 22 23
Average beforeJuly 2005Average after July2005
3.1.3 Simulation Model Estimation and Results We employ traffic simulation modeling to estimate the impact of PierPASS on traffic
congestion. The TransCAD modeling system is utilized, with data provided by SCAG. Specifically, we use the 2003 SCAG Regional Travel Model baseline, the most recent baseline data available. The SCAG region includes 5 counties with a 2000 population of 16.5 million. The travel model data are massive: 4,192 traffic analysis zones and 62,140 links (SCAG, 2007).
In conducting a before/after analysis, it is important to account for all the other changes that may have taken place to influence traffic volumes and patterns. In our case, the major factor is port growth. The combined TEU annual volume for the ports increased by about 2.7 million, from 13.1 million in 2004 to nearly 15.8 million in 2006. To put this in perspective, total 2006 TEU volume was 4 million for the Ports of Seattle and Tacoma, the second largest port complex on the west coast. That is, the increase at Los Angeles/Long Beach is 2/3 of the total combined 2006 volume of Seattle-Tacoma. Even if no other economic growth took place, the increase in port trade volume would add to traffic volumes and increase congestion over this time period. Also, the increase in traffic volumes could offset any redistribution of truck traffic due to PierPASS. For 2006 we therefore factor up the total number of heavy truck trips entering and exiting port zones based on the increase in TEU volume. Specifically, we adjusted the heavy truck trips originating or arriving at the 32 zone centroids associated with the port in the SCAG model, and then adjust the truck O-D matrix accordingly.
A second issue is how to account for overall regional growth. We explored several options, but ultimately concluded that there was no acceptable way to adjust the 2003 baseline. Since we do not account for background growth in traffic, our estimates on PierPASS impacts are conservative. A third issue is how to handle truck traffic in the simulation model. The SCAG model generates a separate truck O-D matrix which is then loaded on the network simultaneously with passenger traffic (SCAG, 2007). SCAG uses fixed heavy truck shares for each time period; these
AM Peak Midday
PM PeakNight Night

Extended Gate Operations Final Report -- 6/11/2008 --33
shares are much different from the shares calculated from our empirical data. We therefore use the time period shares from our empirical data: we pooled the I-110 and I-710 data and used the average time period shares as our best available estimate of both a “before PierPASS” baseline and PierPASS-related distribution changes. Finally, we noted earlier that PierPASS impacts would be concentrated in the area near the ports. We therefore focus on the sub-area that includes the ports. This sub-area comprises two Regional Statistical Areas (RSAs), which are aggregates of traffic analysis zones (TAZs). The two RSAs include 240 TAZs and about 5 percent of the total regional VMT. Table 3.2 describes the scenarios we simulate. Each scenario includes four time period simulations: AM peak, mid-day, PM peak, and night. Scenario 1 is the before PierPASS baseline; we simply adjust the SCAG data for port truck traffic shares by simulation time period. Scenario 2 estimates what would have happened had port volume increased while the hourly distribution of port truck traffic remained unchanged. Scenario 3 estimates the impact only of the PierPASS time distribution shift, holding port traffic constant. Scenario 4 estimates the combined effects of port growth and truck traffic distribution shift. Table 3.2: Description of Traffic Simulation Scenarios
Scenario Base O-D matrix Ports truck O-D matrix
Time period port truck share factor
Scenario 1 – before PierPASS baseline
2003 SCAG baseline
2003 SCAG baseline 2004 Caltrans data
Scenario 2 – port growth + no
PierPASS shift
2003 SCAG baseline
2003 SCAG adjusted for port
growth 2004 Caltrans data
Scenario 3 – no port growth + PierPASS
shift
2003 SCAG baseline
2003 SCAG baseline 2006 Caltrans data
Scenario 4 – port growth + PierPASS
shift
2003 SCAG baseline
2003 SCAG adjusted for port
growth 2006 Caltrans data
We conducted each simulation using the entire SCAG network. Each simulation is simply a new traffic assignment; no attempt was made to iterate across trip distribution, etc. Truck trips are converted to Passenger Car Equivalents (PCEs) using the SCAG PCE values. Results are given for the portion of the network within RSAs 19 and 20, and are summarized in Table 3.3. VMT and VHT include all vehicle trips taking place within the time interval. It can be seen that additional truck traffic associated with port growth increases VMT and VHT across all time periods (Scenario 2). The PierPASS shifts not accounting for port growth reduce VMT and VHT in the AM, mid-day and PM, and increase VMT/VHT in the night period (Scenario 3). The combination of port growth and PierPASS results in VMT/VHT close to the base case (Scenario 4).

Extended Gate Operations Final Report -- 6/11/2008 --34
Table 3.3: Traffic Simulation Results, RSAs 19 and 20 only Scenario Time Period AM peak
(6 – 8 AM) Mid-day
(9 AM – 14 PM) PM peak
(15 – 18 PM) Night
(19 PM – 05 AM)1 - Baseline VMT 3,884,245 6,608,959 6,480,319 2,819,734 VHT 170,546 278,798 173,690 78,197 2 – Port growth, no PP
VMT 3,914,851 6,863,584 6,522,389 2,826,779 VHT 172,311 350,064 179,188 78,371 3 – PP only, no port growth
VMT 3,866,665 6,415,304 6,473,070 2,857,290 VHT 168,707 256,307 174,924 79,141 4 – Port growth + PP
VMT 3,899,594 6,625,505 6,505,439 2,860,370 VHT 171,312 290,590 177,072 79,096 Table 3.4 provides comparisons across the scenarios. The upper half of the table gives percent changes in VMT; the lower half gives percent changes in VHT. For example, in the AM peak, port growth leads to a 0.79% increase in VMT relative to the baseline, and the PierPASS shift leads to a 0.45% decrease in VMT. When we combine growth and the PierPASS shift, we get a 0.40% increase. That is, the PierPASS shift offsets some of the increase in AM peak VMT. The separate effects of growth and PierPASS are given in the last two rows; about half of the growth effect is offset by the PierPASS effect. The same pattern is observed for AM peak VHT.
The mid-day changes are much larger, consistent with the greater PierPASS mid-day shift (about 8% reduction), and the greater share of truck traffic in the mid-day. Results suggest that the PierPASS shift has entirely offset the port growth effect. The PM peak results are similar to AM peak: changes are small, but the PierPASS shift tends to offset the growth effect. Night is the only period when PierPASS contributes to VMT/VHT. Despite the large average shift (about 10%), the effect is small, because truck traffic accounts for a smaller share of total traffic at night. Results suggest that the PierPASS shift has about four times the effect of the port growth effect. This does not affect average speeds, because there is little congestion on the network during night hours.

Extended Gate Operations Final Report -- 6/11/2008 --35
Table 3.4: Scenario Result Comparisons (Percent change), RSAs 19 and 20 only
Scenario Time Period AM peak
(6 – 8 AM) Mid-day
(9 AM – 14 PM) PM peak
(15 – 18 PM) Night
(19 PM – 05 AM)VMT 1 vs 2 growth effect only 0.79 3.85 0.65 0.25
1 vs 3 PP effect only -0.45 -2.93 -0.11 1.33
1 vs 4 growth + PP effect 0.40 0.25 0.39 1.44
2 vs 4 PP effect, given growth
-0.39 -3.47 -0.26 1.19
3 vs 4 growth effect, given PP
0.85 3.28 0.50 0.11
VHT 1 vs 2 growth effect only 1.04 21.64 3.17 0.22
1 vs 3 PP effect only -1.08 -10.95 0.71 1.21
1 vs 4 growth + PP effect 0.45 0.97 1.95 1.15
2 vs 4 PP effect, given growth
-0.58 -17.00 -1.181 0.925
3 vs 4 growth effect, given PP
1.54 13.38 1.23 -0.06
We illustrate transportation network effects with Figures 3.5 and 3.6. Figure 3.5 shows the changes in directional traffic volumes for the PM peak, Scenario 4 (Growth + PierPASS). The darker shading is increased traffic, and the lighter shading is decreased traffic relative to the baseline.
The width of the shading indicates the volume of change. The increase in southbound traffic (to the ports) is quite evident; truckers are traveling to the ports in time for the 6 PM start of off-peak service. Figure 3.6 shows changes for the Scenario 4 night period. Increased traffic on the I-110, the I-710, and the state highway routes leading to the I-710 in both directions is quite evident.

Extended Gate Operations Final Report -- 6/11/2008 --36
Figure 3.5: Changes in PM Peak Hour Traffic on Freeways Proximate to the Ports, Scenario 4 (Growth + PierPASS)
Figure 3.6: Changes in Night Traffic on Freeways Proximate to the Ports, Scenario 4

Extended Gate Operations Final Report -- 6/11/2008 --37
3.1.4 Conclusions on Highway Impacts The PierPASS program has resulted in a significant shift of truck traffic from day to night hours. Traffic volume data show freeway locations near the ports with relatively lower truck volumes during the day, and relatively higher volumes on weekends. These shifts are not observed elsewhere, suggesting that they reflect the results of the PierPASS program. Shifts out of the AM and PM peaks were small, and hence could not be expected to have significant effects on peak period traffic. On the other hand, the large shift out of mid-day hours likely provided some degree of congestion relief.
Our traffic simulation analysis suggests that the temporal shifts associated with PierPASS have largely offset the increase in truck traffic associated with port growth. PierPASS increased night truck traffic volumes, but since there is little congestion on the network during night hours, the shift to this time period does not add to delay on the network. We conclude that the PierPASS program achieved its objective of shifting truck traffic out of peak periods. In doing so, it offset about two years of port growth.

Extended Gate Operations Final Report -- 6/11/2008 --38
4 IMPACTS ON STAKEHOLDERS This chapter discusses the impacts of PierPASS on major stakeholders: ports, terminal
operators, the trucking industry, other industry segments, and the local community. Most of the information in this chapter is drawn from open-ended interviews conducted throughout the period of study. A list of all interviews conducted is available in Appendix A. In addition the research team monitored local media and maintained a chronology of all events related to the PierPASS program. The PierPASS Timeline is found in Appendix B.
4.1 PORTS As noted in Chapter 2, the Long Beach and Los Angeles Ports operate under authority
from the state. The ports have the right to manage the Harbor District for commerce, navigation, fisheries and education. They are “landlord ports:” docks are operated under long term lease agreements by terminal operators. Terminal operator lease agreements are approved by both the Harbor Commission and the City Council.
We interviewed representatives from both ports regarding the PierPASS program. Both ports were supportive of extended gate hours programs, but stated that they had no direct involvement in the structure of PierPASS or the setting of the fee. Historically both ports have taken the position that they have no involvement in dock operations. Both expect the program to be permanent, and see it as an important strategy to accommodate growing trade volumes. One respondent noted the political and environmental pressure facing the ports, and saw the program as a response to that pressure.
4.2 TERMINAL OPERATORS PierPASS standardized off-peak gate operations at all container terminals at the two ports.
Each is open between 6 PM and 3 AM Monday-Thursday and on Saturday from 8 AM – 6 PM. However, terminals take different approaches with regard to other operational procedures that may have an impact on the effectiveness of off-peak gates. These include the extent to which terminals operated in the off-peak before PierPASS, or the ways in which they use other tools such as gate appointments to facilitate the flow of goods.
In order to determine how terminal operators responded to PierPASS, we conducted interviews with representatives of all of the terminals. The terminals represent a wide cross section of operations at both ports with regard to size, customer base, and operational philosophies (wheeled vs. grounded operations, use of gate appointments, use of technology, etc.)
Interviews were conducted in person by a two-person team with three exceptions, where phone and/or e-mail based interviews were conducted. Interviews averaged one hour per terminal. Interviewers used a three-page questionnaire to guide questioning. The interview instrument is available in Appendix C. Our questions were designed to determine how terminal operators perceived off-peak gates both before and after the implementation of PierPASS, the extent to which gate moves were shifted to the evening and weekends, how other operations may

Extended Gate Operations Final Report -- 6/11/2008 --39
have changed as a result of the program, and whether they see this as a temporary or permanent change for the industry. We are also interested in whether the MTOs view PierPASS as a model for other parts of the country. With cargo volumes rising throughout the US, both the industry and elected officials are observing PierPASS with great interest. Because the terminal operating companies in Los Angeles and Long Beach also have similar operations in other ports, the respondents to our questions were in a position to address the topic.
4.2.1 Terminal Operations Table 4.1 lists the all container terminals at the two ports, provides some basic
information on size of operation, and lists the interview date (WBCT and China are separate entities, but share certain gate operations). Interviews took place over a 9 month period. Terminals measure annual volume of cargo in many different ways (lifts, moves, TEUs), and it was not possible to develop a common metric across the terminals. We therefore provide acreage and number of cranes as indicators of capacity. It may be noted that 7 terminals are in excess of 200 acres; the largest is APM Maersk at 484 acres. Important factors affecting terminal operation are the types of cargo handled and the presence of on-dock rail. Different types of cargo require different handling processes. Availability of on-dock rail allows containers to be loaded/unloaded between ship and railroad. Without on-dock rail, rail-bound cargo traffic moves by drayage truck, either to near-dock rail facilities or to the major rail terminal near downtown Los Angeles. All container moves take place by truck at terminals without on-dock rail. Table 4.1: Terminal Descriptions Terminal Port Size
(acres) Capacity (cranes)
Non-container cargo
On-dock rail Date of interview
APL LA 292 12 Yes Yes 8/11/06 APM Maersk LA 484 14 Yes - limited Yes 11/23/06 CUT LB 95 5 Yes No 2/22/07
Evergreen LA 205 8 Yes - limited Yes 12/11/06 ITS LB 246 14 No Yes 8/22/06 LBCT LB 102 7 No Yes 5/14/07 PCT LB 256 16 No Yes 5/22/07 SSA – A LB 170 10 No Yes 12/14/06 SSA – C LB 70 3 Yes No 6/7/07 TRAPAC LA 173 11 No No 8/3/06 TTI LB 345 14 Yes Yes 3/26/07 WBCT/China LA 261 8 Yes Yes 9/28/06 Yusen LA 185 10 Yes No 10/8/06

Extended Gate Operations Final Report -- 6/11/2008 --40
We expected that PierPASS outcomes would be affected by whether terminals operated some type of extended gate operations before PierPASS. Table 4.2 gives information on service and gate operations before PierPASS. The table is drawn from both interview and data from the Pacific Maritime Association. It can be seen that 12 of 14 terminals operated some form of extended gate service, but the extent of off-peak service varied greatly. APM is the only terminal that operated day and night full service gates; it is the largest terminal and most containers are on chassis, hence the need for longshore labor for container moves within the terminal is greatly reduced. All others had various restrictions for off-peak operations. Typically off-peak gates were scheduled for specific shipments or clients. Four terminals had an extra charge for off-peak moves. Table 4.2: Gate Operations before PierPASS
Terminal Any
extended gates?
If yes, weekend operations?
If yes, night operations?
If yes, hoot operations (3 AM-8AM)?
If yes, extra charge?
APL Yes Sat, Sun: partial service
Tues - Fri: partial service No No
APM Maersk Yes No Mon – Fri: full service No No
CUT Yes
Sat day: full service, Sat
night: partial service, no Sun
Tues – Fri: partial service No Yes
Evergreen Yes No No Mon, Tues,
Wed: hoot full service
Yes
ITS Yes No Sat: Sun day: partial
service No No Yes under some
circumstances
LBCT Yes Sat, Sun day: partial service No No Yes
PCT No Unknown Unknown Unknown Unknown SSA – A No Unknown Unknown Unknown Unknown
SSA – C Yes No Tues, Wed: full service No No
TRAPAC Yes Sat, Sun day: partial service
Tues, Wed, Thurs: partial
service
Wed hoot: full service No
TTI Yes Sat day: full service, no Sun No Mon - Fri hoot:
full service Unknown
WBCT/China Yes No Sat: Sun day: partial service No No Unknown
Yusen Yes Sat – Sun day: partial service No No No
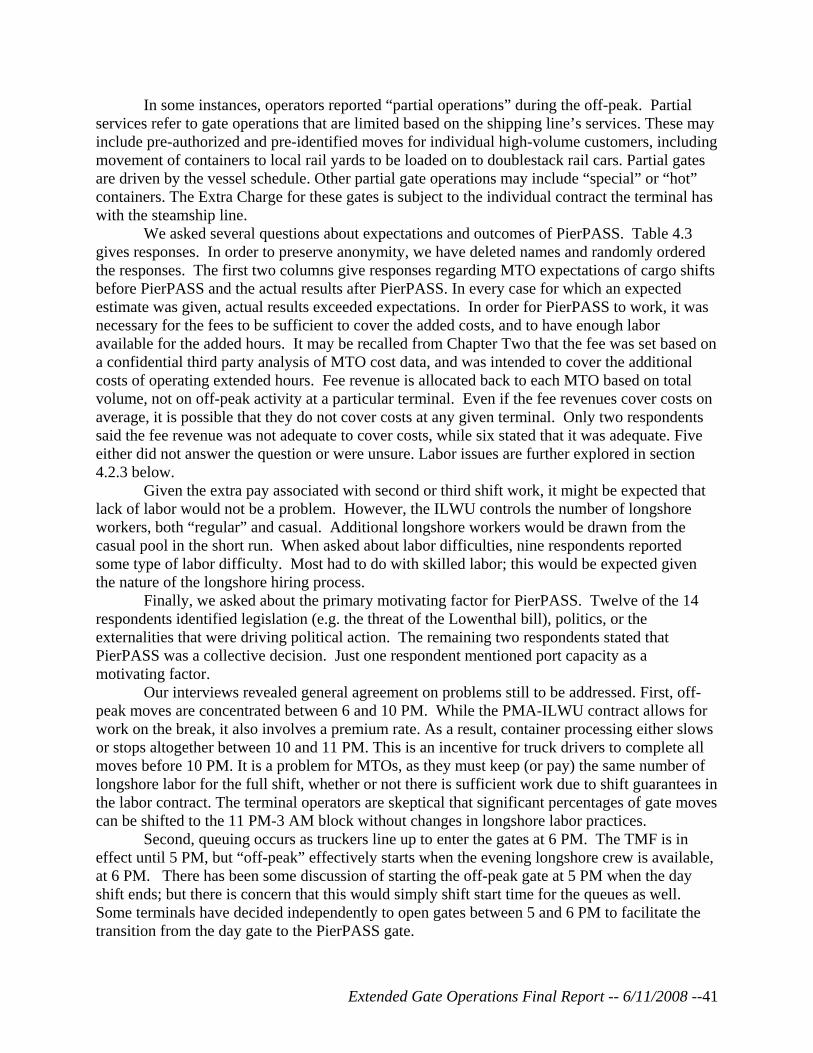
Extended Gate Operations Final Report -- 6/11/2008 --41
In some instances, operators reported “partial operations” during the off-peak. Partial services refer to gate operations that are limited based on the shipping line’s services. These may include pre-authorized and pre-identified moves for individual high-volume customers, including movement of containers to local rail yards to be loaded on to doublestack rail cars. Partial gates are driven by the vessel schedule. Other partial gate operations may include “special” or “hot” containers. The Extra Charge for these gates is subject to the individual contract the terminal has with the steamship line.
We asked several questions about expectations and outcomes of PierPASS. Table 4.3 gives responses. In order to preserve anonymity, we have deleted names and randomly ordered the responses. The first two columns give responses regarding MTO expectations of cargo shifts before PierPASS and the actual results after PierPASS. In every case for which an expected estimate was given, actual results exceeded expectations. In order for PierPASS to work, it was necessary for the fees to be sufficient to cover the added costs, and to have enough labor available for the added hours. It may be recalled from Chapter Two that the fee was set based on a confidential third party analysis of MTO cost data, and was intended to cover the additional costs of operating extended hours. Fee revenue is allocated back to each MTO based on total volume, not on off-peak activity at a particular terminal. Even if the fee revenues cover costs on average, it is possible that they do not cover costs at any given terminal. Only two respondents said the fee revenue was not adequate to cover costs, while six stated that it was adequate. Five either did not answer the question or were unsure. Labor issues are further explored in section 4.2.3 below.
Given the extra pay associated with second or third shift work, it might be expected that lack of labor would not be a problem. However, the ILWU controls the number of longshore workers, both “regular” and casual. Additional longshore workers would be drawn from the casual pool in the short run. When asked about labor difficulties, nine respondents reported some type of labor difficulty. Most had to do with skilled labor; this would be expected given the nature of the longshore hiring process.
Finally, we asked about the primary motivating factor for PierPASS. Twelve of the 14 respondents identified legislation (e.g. the threat of the Lowenthal bill), politics, or the externalities that were driving political action. The remaining two respondents stated that PierPASS was a collective decision. Just one respondent mentioned port capacity as a motivating factor.
Our interviews revealed general agreement on problems still to be addressed. First, off-peak moves are concentrated between 6 and 10 PM. While the PMA-ILWU contract allows for work on the break, it also involves a premium rate. As a result, container processing either slows or stops altogether between 10 and 11 PM. This is an incentive for truck drivers to complete all moves before 10 PM. It is a problem for MTOs, as they must keep (or pay) the same number of longshore labor for the full shift, whether or not there is sufficient work due to shift guarantees in the labor contract. The terminal operators are skeptical that significant percentages of gate moves can be shifted to the 11 PM-3 AM block without changes in longshore labor practices.
Second, queuing occurs as truckers line up to enter the gates at 6 PM. The TMF is in effect until 5 PM, but “off-peak” effectively starts when the evening longshore crew is available, at 6 PM. There has been some discussion of starting the off-peak gate at 5 PM when the day shift ends; but there is concern that this would simply shift start time for the queues as well. Some terminals have decided independently to open gates between 5 and 6 PM to facilitate the transition from the day gate to the PierPASS gate.

Extended Gate Operations Final Report -- 6/11/2008 --42
Table 4.3: Expectations and Assessment of PierPASS
Terminal Expected
share moves off-peak
Actual share off-
peak
Is fee revenue
adequate?
Off-peak labor
difficulties?
Primary motivating
factor
1 Unsure 35% Yes Steady workers Congestion
2 Unsure 35-37% Yes No Legislation
3 Unreported 38% No Skilled positions
Harbor-wide program
4 Low 20s% 40-50% Unreported Skilled positions
Business decision
5 Unreported Unreported Yes At beginning
Politics, congestion
6 Unreported Unreported Yes No Air quality, congestion
7 30% >30% Yes Quality of labor Legislation
8 30% >30% Unreported No Politics, air
quality, congestion
9 25% >25% Yes Skilled positions Legislation
10 Unsure >45% Unreported Steady workers
Legislation, capacity
11 25% 35% Unreported No Legislation
12 30-33% 33% Unreported Sometimes Legislation
13 10-15% Unreported No At beginning
Politics, congestion
4.2.2 Perceptions of PierPASS Our interviews revealed considerable consensus on the part of marine terminal operators
surrounding both the development and impacts of PierPASS. Because MTOs are competitors, they have historically taken a cautious approach to working together. However, facing the likelihood of legislation that would mandate operational changes for all of them, they found common ground. All of the respondents to our questions agreed that PierPASS was brought about primarily as a result of political pressure, not in response to the pressures of congestion and increased cargo at the terminals. While something like PierPASS might have come about eventually, this particular program was the best possible solution to an imminent threat. The

Extended Gate Operations Final Report -- 6/11/2008 --43
existing West Coast Marine Terminal Operators Discussion Group offered a mechanism to coordinate a response. PierPASS allowed MTOs to control the implementation of extended gates, in particular the collection and use of the fee, with limited oversight. It also allowed MTOs to keep financial and operating data private, as only the aggregate container moves are provided by PierPASS. Revenue data is not public; calls for audits would have to be routed through the Federal Maritime Commission. Once implemented however, there was also general agreement that PierPASS has been a benefit to the industry and that it is not likely that the program will end after three years as originally intended. The terminal operators have been able to accommodate significant growth in container volumes with all terminals agreeing to the same rules of operation. Finally there is general agreement that, while successful, PierPASS will not automatically be adopted by terminals in other parts of the country. PierPASS was brought about because of political pressure, but that pressure was brought about by an untenable situation in terms of cargo volume. Other ports will need to see similar levels of congestion before either elected officials or terminal operators will take action.
4.2.3 Evidence from Labor Data Given that PierPASS requires full service gate and dock operations through both day and
night shifts, we would expect that dock labor would benefit, either through more jobs or more premium pay or both. We were able to obtain labor data from the PMA on number of registered positions and total hours paid, from January 2003 through September 2006. After the large increase in positions in late 2004, total positions remained relatively stable at around 7,000. Figure 4.1 shows total paid hours for both registered and casual workers.8 There is no indication that paid hours have increased since the implementation of PierPASS. In order to account for changes in traffic volume, we also calculated paid hours per TEU and per “assessed tonnage”, which is defined as “all waterborne cargo tonnage”….”for which one or more employees were paid in connection with its movement under the ILWU-PMA agreements.” Figure 4.2 gives paid labor hours per assessed tonnage. The average before PierPASS is 2.87 per 1,000 tons; the average after PierPASS is 2.61. There is a declining trend until around the time of PierPASS implementation, and a slight upward trend thereafter.
The data suggest that MTOs have managed to redistribute work, reducing labor during the day shift to offset increased labor on the night shift. It should be noted that these numbers do not reflect the higher wage rate of night shift work, 1.33 times the regular rate. Hours paid do however reflect shift guarantees. It would appear that PierPASS to date has not resulted in additional ILWU labor work or reduced labor productivity.
8 Per ILWU contract provisions, there are three labor classifications: Class A, Class B, and Casual. Class A and B workers are part of the registered pool of workers. Casual workers are used only when no other Class A or B workers are available. The number of registered workers is established by a joint labor/management committee, and new registered workers are selected from the Casual pool.
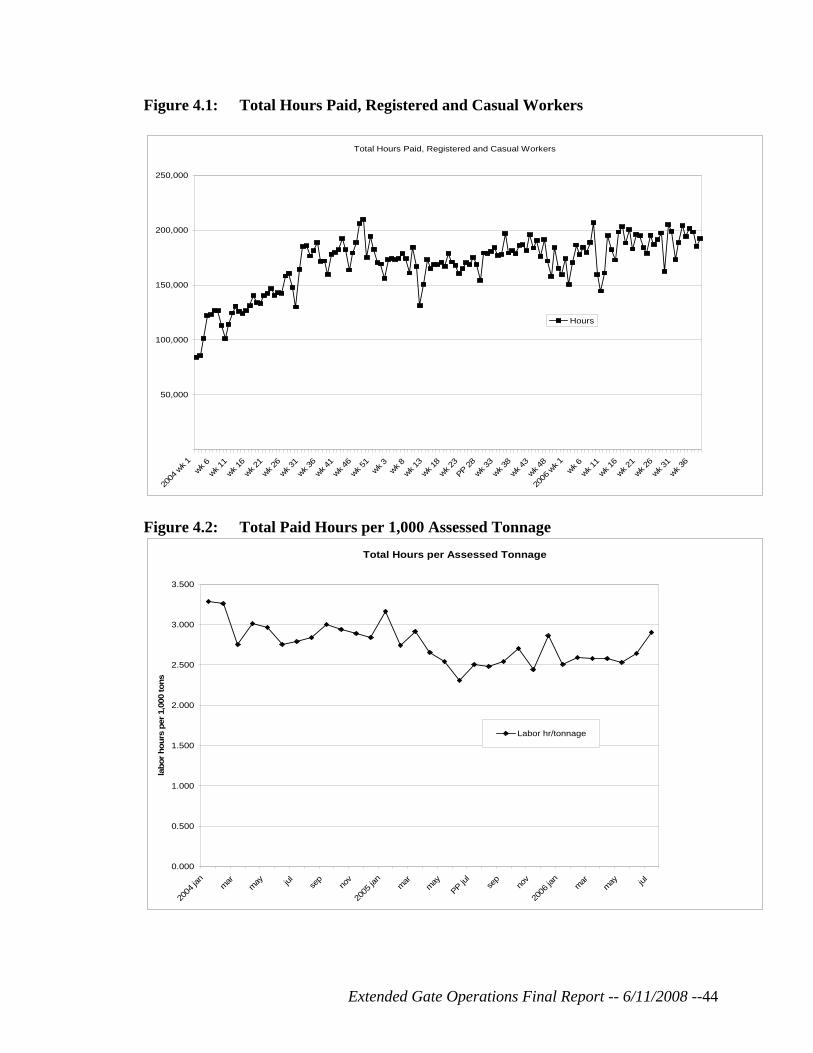
Extended Gate Operations Final Report -- 6/11/2008 --44
Figure 4.1: Total Hours Paid, Registered and Casual Workers
Total Hours Paid, Registered and Casual Workers
50,000
100,000
150,000
200,000
250,000
2004
wk 1
wk 6wk 1
1wk 1
6wk 2
1wk 2
6wk 3
1wk 3
6wk 4
1wk 4
6wk 5
1wk 3 wk 8
wk 13
wk 18
wk 23PP 28
wk 33
wk 38
wk 43
wk 48
2006
wk 1
wk 6wk 1
1wk 1
6wk 2
1wk 2
6wk 3
1wk 3
6
Hours
Figure 4.2: Total Paid Hours per 1,000 Assessed Tonnage
Total Hours per Assessed Tonnage
0.000
0.500
1.000
1.500
2.000
2.500
3.000
3.500
2004
jan
marmay jul se
pno
v
2005
jan
marmay
PP jul
sep
nov
2006
jan
marmay jul
labo
r hou
rs p
er 1
,000
tons
Labor hr/tonnage

Extended Gate Operations Final Report -- 6/11/2008 --45
4.3 DRAYAGE TRUCKING
Apart from the terminal operators themselves, the greatest impact of PierPASS has been felt by the port drayage industry. Truckers have long complained about terminal congestion and labor practices that require drivers to deal with long queues both outside and inside of the terminal gates, limiting the number of revenue turns that they can make between the ports and intermodal rail yards, distribution centers and warehouses.
It is hoped that spreading out gate moves over a longer period will translate to shorter transaction times for truckers, as less time would be spent waiting for a container to be available. It is also possible that the additional gate hours will allow truckers to make additional turns, thereby increasing the truck driver’s income. Drivers are paid by the trip. However, the trucker’s work day is regulated by federal hours of service mandates. It is therefore possible that PierPASS would require significant modifications to the driver’s schedule to accommodate a second shift. This may or may not be desirable from the trucker’s perspective. Changes in the driver’s schedule may also necessitate changes in the trucking company’s schedule as well.
Conducting a survey of individual truckers was not feasible given the scope of the project. Instead we chose to further assess surveys conducted by both the California Trucking Association and PierPASS done throughout the first 16 months of the program. These different trucking surveys reveal how PierPASS impacted the life of the truck driver. This includes changes in work hours, turn times, and wages earned.
The California Trucking Association (CTA) commissioned surveys to be conducted by Stonebridge Associates Inc. in the fall and winter of 2005. PierPASS Inc. commissioned a second set of surveys, conducted by Fairbank, Maslin, Maullin and Associates (FMMA) in the spring and winter of 2006. Both sets of surveys were conducted face to face; respondents could choose to take the survey in either English or Spanish.
The first CTA survey was conducted in September 2005 at locations in and near the two ports and involved 365 drivers working for 116 companies. 81% of the respondents selected the Spanish language version. The second survey was conducted in December 2005 at similar locations involving 506 drivers working for 195 companies. An even greater percentage (93%) chose the Spanish language survey. PierPASS surveyed 480 drivers between May 18 and 27, 2006 and 451 drivers sampled from the day, evening and Saturday shifts between November 27 and December 9, 2006.
Differences between the two survey samples include the length of time that the survey was conducted (4 days for CTA vs. a full week for PierPASS) the numbers of drivers selecting the Spanish or English version of the survey (as high as 93% of the CTA respondents used the Spanish language version; 66% of the PierPASS respondents used the Spanish language version in Dec 2006.) The margin of error is similar for both surveys (4.6% for PierPASS and 4% for CTA).
Both the PierPASS survey and the CTA survey generated results regarding truckers’ perceptions of and response to the PierPASS program. While several questions seek similar information, the questions were asked differently.
Overall attitude towards the Pier Pass program
In questioning overall attitude toward the program, PierPASS had five categories: “Very Positive,” “Just Somewhat Positive,” “Neither Positive or Negative,” “Just Somewhat Negative,” “Very Negative” and “No Opinion.” CTA used the categories Positive, Negative and Undecided,

Extended Gate Operations Final Report -- 6/11/2008 --46
and also tested to see if a positive attitude was related to higher compensation received for any schedule changes made by drivers. Not surprisingly, drivers who had been paid extra had more favorable opinions. Table 4.4 summarizes the responses from the four surveys to this question.
Table 4.4: Driver Perceptions of PierPASS
CTA 1st
Sep. 2005
CTA 2nd Dec. 2005
CTA 2nd (drivers who
report receiving
extra compensation for off-peak
work) Dec. 2005
PierPASSMay 2006
PierPASS Nov.-Dec.
2006 Number of
respondents* 365 506 Approx. 100 398 347
Positive** 27% 36% 61% 66% 61% Undecided/Neither
positive nor negative
30% 29% 16% 11% 12%
Negative*** 43% 35% 23% 23% 29% *The number of total respondents for the PierPASS surveys was 480 in May of 2006 and 451 in Nov-Dec. 2006. The questions regarding driver perception were only asked of those claiming to be familiar with the program. **Includes very positive and somewhat positive for PierPASS *** Includes very negative and somewhat negative for PierPASS
The responses indicated that drivers had a more favorable response to PierPASS in
December than in September. This may be due in part to the fact that drivers who work two or more Saturday gates per month make considerably more turns than average. The second survey also indicated that 21% of drivers who work nights and 17% of those who work Saturdays received extra compensation for the off-peak schedules. This is an adjustment that seems to have been made in the months between the two surveys. However, the second CTA survey still showed general dissatisfaction with key aspects of PierPASS. Drivers still complain that there is no apparent difference between turn times during the day and during evening and Saturday gates. Drivers who make more turns tend to do so because the work week is longer. A significant percentage (approximately 40%) still refuse to work the extended gates.
The more favorable response of respondents taking the PierPASS surveys is likely to reflect, in part, additional time. As drivers become more familiar with the program, they are more likely to adjust their schedules in a way that results in the greatest benefit to the driver. In addition, while the CTA survey focused on additional driver compensation, the PierPASS survey asked respondents about four different types of personal benefits resulting from the program: reduced traffic congestion, more flexible work schedule, more trips per shift, and higher

Extended Gate Operations Final Report -- 6/11/2008 --47
earnings. A driver is more likely to have a favorable perception of PierPASS if given an expanded range of benefits. Working on Saturdays
Willingness to work on Saturdays was also assessed; yet the question was phrased differently in the two surveys. PierPASS asked about frequency of Saturday hours using the categories “all/most of the time, (31% in May of 2006 and 31% December of 2006), “just sometimes” (39% in May of ‘06 and 43% in 12/06), and “hardly ever/never” (30% in May ‘06 and 26% 12/06). Drivers appeared to be less resistant to working on Saturdays in the 2nd survey. The CTA asked if drivers “have worked on Saturdays.” The first survey found 42% had, 24% had not and 34% were undecided. The second survey found 46% had, 17% had not with 37% undecided. Of those who have worked on Saturdays, 77% of respondents in the second survey reported receiving extra compensation.
The CTA also investigated if a positive attitude toward the program increased willingness to work on Saturdays. This was only asked in the 2nd survey in December 2005. Of those who had a positive attitude about the program, 40% were willing to work on Saturday; of those who had a negative attitude, only 25% were willing to work on Saturdays. Working night shifts
Both surveys looked at willingness to work nights during the first survey. The PierPASS survey asked drivers if they made trips during certain hours of the day. 22% started work after 3PM indicating that their work hours might extend to nights. As of the November-December 2006 PierPASS survey, 33% of drivers had made trips between midnight and 3AM while 67% had not. The first CTA survey reported that 41% of drivers did not work nights while 51% worked one or more nights per week. By the second CTA survey, 48% worked nights. Reasons for not working Saturdays or nights
The second PierPASS survey in December of 2006 asked drivers to identify their reasons for not wanting to work on Saturdays and nights (Table 4.5). The PierPASS survey provided the following reasons as choices: “I don’t like to work that late,” “ trucking companies don’t send me,” “I have used all my hours for the week,” “ terminal issues,” “company schedule/doesn’t work those hours,” “ money issues, other reasons.” The same question and responses were provided for reasons to not work on Saturdays with the addition of “insufficient work.” “Heavy traffic” and “money issues” were not provided as a choice in this case. These questions were asked only of those who did not work during the time in question.

Extended Gate Operations Final Report -- 6/11/2008 --48
Table 4.5: Driver Reasons for Not Wanting to Work Nights and Saturdays (PierPASS)
Reasons for not making work trips, Midnight-3AM,
Monday- Thursday Percentage Reasons for not working on
Saturday after 2PM Percentage
I don’t like to work that late 49% I don’t like to work that late 32% Trucking companies don’t send me
25% Trucking companies don’t send me
25%
I have used all my hours for the week
13% I have used all my hours for the week
11%
Terminal issues 4% Insufficient work 4% Company schedule doesn’t work those hours
4% Doesn’t work Saturdays 27%
Money issues 3% Heavy traffic 1% Other reasons 2%
The CTA version of this question was phrased slightly differently as “Reasons for not
wanting to work night or Saturday gates.” The reasons provided were “Did not want to give up family time,” “no extra compensation,” “ turn times too long,” “did not like night driving,” “safety and security,” “cannot make enough trips,” “customers not open for delivery,” “hours of service compliance,” “not enough customers requesting nights,” “company refuses to work at night.” Summary findings are included in Table 4.6.
Table 4.6: Driver Reasons for Not Wanting to Work Nights and Saturdays (CTA)
Reason 1st Survey 2nd Survey Did not want to give up family time 41% 41% No extra compensation NA 29% Turn times too long 37% 27% Did not like night driving-safety& security 28% 26% Cannot make enough trips 24% 15% Customers not open for delivery 18% 15% Hours of service compliance 17% 11% Not enough customers requesting nights 23% 11% Company refuses to work at night 9% 6%
The surveys revealed some discontent. 42% of the drivers who reported changing their
work schedule as a result of the program said the change was not beneficial. Half of all respondents aware of the program were making the same money as before July 2005 when PierPASS began. The PierPASS survey showed that a third of the respondents said that they have higher earnings because of the program. This is an increase over the CTA surveys conducted late in 2005.

Extended Gate Operations Final Report -- 6/11/2008 --49
The large majority of drivers begin their work day between 5 AM and 10 AM (66%). 13% begin between 11 AM and 3 PM, and 18% between 4 PM and 4 AM. This suggests that most drivers have not replaced a first shift with a second shift but simply modified or extended start time to work additional hours. Our interviews suggest that these are most likely to occur between 6 and 10 PM. Number of Trips/Turn times
The PierPASS program was supposed to offer truckers an increased number of shifts per trip due to increased efficiency. The CTA survey found that drivers who work nights do not make significantly more turns per week than drivers who do not work nights. It appears that working one (20.5 average turns per week), two (20.2 average turns per week) or three (20.0 average turns per week) nights a week resulted in a number of turns that was about the same as the average number, but working either none (19.8 average turns per week) or four (18.8 average turns per week) nights per week resulted in a lower number of turns per week. In contrast, working Saturdays appeared to have a more consistent trend in that the number of turns per week increased when drivers worked on a greater number of Saturdays: none (19.7 average turns per week ), one or more (20.7 average turns per week), two or more (21.1 average turns per week), three or more (21.3 average turns per week), four (21.6 average turns per week). The average for all drivers was 20.2 turns per week.
A similar version of this question was asked in the PierPASS survey. Though the response is grouped in a category of “personally experienced benefits of OffPeak program” the results do not show that a benefit exists. The results between the first and second survey were fairly similar. In December 2006, 45% of drivers said that they had more trips per shift, 53% said they did not, 2% had no opinion. In May 2006 the numbers were 43%, 55% and 2% respectively. Changes in congestion
In the first CTA survey 53% of drivers said that local freeways were less congested. However in the second follow-up survey 57% of drivers reported no change in congestion. The first PierPASS survey reported that in May 2006, 71% of drivers experienced reduced traffic congestion, 27% did not, and 1% had no opinion. The results in the follow-up survey in December 2006 showed similar results of 67%, 31% and 2% respectively.
The CTA survey also asked about the performance of individual terminals, revealing differences in approach to operations in general. Terminals that were rated highly not only processed drivers more quickly, they also had better quality equipment, more courteous staff and better management. The results of the two surveys are somewhat inconclusive. Neither shows overwhelming acceptance or rejection of the PierPASS program. Positive perceptions increased and then decreased by the time of the second PierPASS survey in late 2006. While off-peak gates provide an opportunity for some drivers to receive additional compensation, at least the CTA survey suggests that nearly a third of the drivers who responded are not receiving additional compensation for evening and weekend trips. This could also include the perception that additional money received for a longer work week does not really equal additional compensation. What is clear from both sets of surveys is that the primary reason for not working in the off-peak is that it is not the driver’s preference. Evening shifts result in loss of family time and most likely

Extended Gate Operations Final Report -- 6/11/2008 --50
an extended work day (since it does not appear that drivers replace a complete first shift with a complete second shift).
Clearly, truck drivers have a different definition of successful off-peak operations. The expectation that off-peak gates would result in improved turn times at individual terminals and more turns per shift have not been realized. Drivers complain that inefficiencies that existed at certain terminals prior to PierPASS still exist. Furthermore, opening terminal gates until 3 AM does not guarantee that the rest of the supply chain will make the same accommodations. Truckers as a result have been asked to accommodate changes in operations not only at the ports but at DCs and warehouses, all without the benefit of a guaranteed traffic mitigation fee to offset costs. In some cases, truckers have been asked to bear the added liability of holding cargo overnight until it can be delivered during regular work hours.
While some drivers do desire the added flexibility of night time drays, it is usually the beneficial cargo owner who decides when to make the pick-up and drop-off and whether or not to pay the PierPASS fee. In this way, the driver is still not in complete control of the trip. For drivers, this is another example of a program which was not developed by them or with their significant input.
4.4 OTHER STAKEHOLDERS
Other key stakeholders also make it clear how limited a role they have played in the development of PierPASS, i.e. they are responding to a program designed for the benefit of terminal operators. We conducted seventeen additional interviews with other industry stakeholders and those integral to the development of the program (Appendix A). These include representatives from PierPASS, Inc., representatives of distribution centers/warehouse associations, and governmental officials. A similar questionnaire-based approach was used. The intent was to determine the stakeholder’s response to the program and, for those further along the supply chain, the impacts on second shift operations outside the terminal gates.
The Ports have been interested observers but have not been involved in establishing the PierPASS fee structure. However port representatives - as well as elected officials and their representatives - are in agreement with terminal operators that PierPASS is a useful business model, but that it does not guarantee success elsewhere. The Discussion Agreement approach allows competitors to pursue areas of common interest but does not guarantee consensus. Terminal operators will still be responding to localized pressures. In the short term, ports in other parts of the country are more likely to view PierPASS as a competitive advantage for them. As long as customers of the Ports of LA and Long Beach face added obstacles to moving cargo when they want (i.e. greater costs and increased congestion), places like Oakland, Seattle, New York/New Jersey, Houston and Charleston believe they can offer a cheaper and more convenient alternative.
Distribution centers, warehouses, and exporters have modified their own operations in response to, not in conjunction with, the terminal operators. This means that they have had to add second shift staff, including security, allocate more space to off-peak storage until goods can be delivered at the start of the next business day or pay a third party to coordinate the same. In some cases, DCs and warehouses have looked to low-cost solutions like dispatching off-peak moves in advance or adding on-call personnel (as opposed to on-site personnel) but are still required to keep the yard open for drop-offs in the off-peak.

Extended Gate Operations Final Report -- 6/11/2008 --51
Regardless of the approach taken, DCs and warehouses–unlike the terminal operators–do not enjoy the benefit of the traffic mitigation fee as a means of covering off-peak operating costs. Their only option is to pass along the costs. Our interviews suggest that some businesses may be in a better position to do that than others. Waste recyclers for example, who ship paper and scrap metal products to Asia, are more limited in their ability to shift operations to the off-peak. The PierPASS fees make it necessary to move as much port-related activity to the evening as possible; yet, City ordinances restrict off-peak pick-ups.
We were also interested in the response of local community groups to PierPASS. We conducted interviews and surveys with leaders from neighborhood associations in the vicinity of the two ports and adjacent to the freeways leading away from the ports. We chose to contact associations because we were interested in any formal position taken in support of or in opposition to PierPASS. We were also interested in how often these groups formally agendize port-related projects and how they communicate their positions.
We identified community associations in Long Beach by using a district map provided by the City which lists 133 neighborhood-based associations and an additional 26 citywide or regional associations. The search was narrowed to focus on those approximately 15 community associations that had boundaries in close proximity to the Port of Long Beach. We also used Council District websites. A majority of the council members’ websites have links to the community associations within their district. From links to the community associations’ website and email addresses gathered via the district homepages, contact was made with the community associations. Some of the associations were listed on the web but only a phone number was given for the contact. In these cases, a phone call was made asking if they would participate in a survey.
In Los Angeles, we identified neighborhood councils in San Pedro and Wilmington. The focus was primarily councils that were located near the 110 freeway or near the port of Los Angeles. There were 3 neighborhood associations located in the South LA district of Los Angles that were contacted based on their proximity to the 110 freeway. There were seven neighborhood associations in the Harbor district chosen for their proximity to the Port of Los Angeles. In one instance, two members of the research team were invited to make a presentation on the research project to approximately 20 members of the Central San Pedro Neighborhood Council who responded to the survey questions in an open-ended discussion.
A web based survey was created to collect the remaining responses (Appendix D). Some contacts listed on the associations/groups websites no longer remained. Email addresses were incorrect or the email sent was disregarded. All together nine different groups responded, six from Long Beach and three from the City of Los Angeles.
In general, we found little formal response to PierPASS. Not a single community or neighborhood association of the 10 responding to the survey was invited to submit comments on PierPASS during its development. All of the groups reported that they either did not take a formal position on PierPASS or could not recall doing so. Four of the ten stated that their groups had taken a formal action in support of or in opposition to some other port-related project such as the Clean Air Action Plan. In one case however, the respondent indicated that the action involved truck parking on local streets. Many of our other questions had a similar response: undecided. This involved questions regarding any perceived changes in traffic patterns since the inception of PierPASS
Despite the limited number of survey responses, we cannot conclude that residents are uninterested in port operations or strategies like PierPASS. Clearly opposition to terminal

Extended Gate Operations Final Report -- 6/11/2008 --52
expansions and concerns over the local impacts of goods movement-related activities have driven the lawsuits and legislative efforts that brought about PierPASS in the first place. Given all the media attention to neighborhood opposition, it seems surprising that even the people who are active in community groups or neighborhood councils (and hence more aware of external events than the average citizen) have little awareness of the program, or whether it has impacted their lives one way or another.
There are some possible explanations. One is that community groups simply want to close the ports down and nothing else will do. Another is that local associations are more concerned with issues over which they have direct control, particularly in the case of Los Angeles neighborhood councils which have a quasi-formal role to play in the land use approval process. Neighborhood associations must certainly be interested in the outcome of the debate over port activity, but because they have little direct involvement in the debate, leave the fight to their elected officials, regional groups, or other players like the Natural Resources Defense Council which are better positioned to use the legislative process and the courts to bring about change. Finally, it is also possible that response was muted because local residents perceived the program to have little impact on them one way or the other. PierPASS has received tremendous media attention but much of it has to do with how the program will set the stage for other changes in the industry. The context involves labor negotiations, discussion agreements, and control of container surcharges. These are questions of process; neighborhood associations are more concerned with impacts.

Extended Gate Operations Final Report -- 6/11/2008 --53
5 CONCLUSIONS
In Chapter One, we outlined four different goals for our study:
1. Understand why and how PierPASS was implemented 2. Determine whether it achieved its stated goals 3. Assess its impacts on other parts of the supply chain 4. Identify the implications for long-term changes and the likelihood of transferability
We have determined that PierPASS was implemented in response to the threat of legislative action that would have otherwise mandated off-peak operations. The marine terminal operators chose instead to design a voluntary program which allowed them to control not only the fee collection process but the use of the fees themselves. Instead of transferring PierPASS revenues to the government, which would have been required under AB 2041, the MTOs were able to use the traffic mitigation fees to offset the costs of second shift operations, labor in particular. However, Senator Lowenthal’s proposed legislation, by and large, had its desired impact. Port operations changed dramatically with the implementation of port-wide off-peak gates, something that elected officials and many in the community had been demanding for years. Almost overnight, PierPASS reached its first year goal of moving 20% of the eligible container moves to the off-peak. In shifting truck traffic out of the peak periods, PierPASS offset about two years of port growth.
The ports and MTOs likely benefited from increased trade volume, and certainly benefited from having the fee contribute to the added costs of off-peak operations. We surmise that extended operations contributed to the ports’ ability to process more cargo. ILWU labor also benefited. MTOs have managed to redistribute work, reducing labor during the day shift to offset increased labor on the night shift; however PierPASS increased the number of hours for which longshore labor receive premium pay.
The results were less conclusive for other industry stakeholders as further explored below. Shifting truck trips to less congested time periods benefited drayage truckers, as trips were being made at faster speeds. However, travel time benefits were likely not as large as the costs of working less convenient hours, at times without extra pay. Warehouses and distribution centers have also had to respond to the changing nature of port operations, although they may accommodate evening drop-offs with minimal changes to personnel. Cargo can still be processed during the day. In those cases where warehouses and distribution centers still do not accept off-peak deliveries, truckers may be required to hold the cargo overnight for a peak period delivery.
The traveling public received benefits from relatively lower daytime truck volumes and associated congestion reductions. The impact on the consumer is still unknown. The direct costs of PierPASS are paid by cargo owners, and we have no information on the degree to which these added costs are passed on to consumers. These issues merit further study. Finally, it appears that PierPASS was beneficial for elected officials, who were able to point to the program as evidence that the ports were responding to public concerns.

Extended Gate Operations Final Report -- 6/11/2008 --54
5.1 EXPLAINING OUTCOMES In some ways, these findings are best explained as a unique example of using price
incentives to redistribute traffic. Like the handful of experiments with congestion pricing, it demonstrates that price incentives are powerful tools for managing the transportation system.
The more interesting question though is how we got to this particular model for congestion pricing. Outcomes of PierPASS can be explained in terms of the structure of industry relationships within the international trade supply chain. The ‘dominant actors’, who have common interests and substantial market power, structured a response to the threat of regulation that enabled them to implement a significant operational change that resulted in a best possible outcome. Throughput capacity at the ports increased, while the fees nearly assured that terminal operators would suffer no financial losses. The peak fee shifted a significant share of cargo moves to evenings and weekends, allowing international trade interests to claim that they have contributed to reduced congestion and vehicle emissions.
Several aspects of PierPASS support this conclusion. First, it seems clear that the threat of regulation was the motivating factor for operational change, based on both our interview data and recent history. Extended gate hours had been a subject of discussion for several years. The intent of AB 2650 that preceded PierPASS was to get extended gate hours implemented, but it was unsuccessful in doing so: terminal operators had the cheaper and less risky alternative of implementing an appointment system. Terminal operators took no steps to extend gate hours until AB 2041 was introduced and appeared likely to pass. The legislative threat provided the incentive for cooperative action.
Second, the cooperative action that resulted in PierPASS was built upon earlier efforts among the dominant actors that took advantage of the flexibility of federal law to allow cooperation (e.g. exemptions from anti-trust requirements). The establishment of PierPASS provides the structure for more cooperation, as for example with the TruckTag program in 2006. Such programs have a common characteristic: they are intended to facilitate terminal operations in ways that are cost-effective from the MTO perspective.
Third, the PierPASS program protects terminal operators in several ways: 1) establishment of a common fee and operating practices eliminates competition between MTOs on these dimensions of service, 2) control of both the fee rate and its revenues maximizes the chances that MTOs will incur no losses as a result of the program, 3) the separate, non-profit entity limits information available to the public regarding program costs, making it difficult if not impossible to determine whether the fee is excessive (e.g. whether MTOs are producing excess profits from cooperative price setting). PierPASS effectively created a firewall to protect terminal operator data. As a non-profit organization, it has no financial reporting requirements beyond the auditing of its own financial statements. When asked for data, terminal operators can legitimately respond that all relevant data is with PierPASS.
Fourth, although the stated purpose of the program was to spread truck traffic to off-peak periods, the fee is not well-structured to do this. Fees are not based on morning and afternoon weekday traffic peaks, nor is there an option to process cargo in the early morning. The ‘peak’ was based on longshore labor shifts, not on highway congestion levels.
Finally, PierPASS winners and losers reflect industry relationships. Dominant actors were largely winners as a result of PierPASS. As noted above, the PierPASS schedule reflects ILWU work shifts, and the fee is based on terminal operating costs. Steamship line operations were not affected, and the implementation of PierPASS brought favorable press to the ports,

Extended Gate Operations Final Report -- 6/11/2008 --55
which were portrayed as contributing to the solution of capacity constraints and to negative environmental impacts of port operations.
As previously stated, actors in the supply chain without market power have not fared as well. Drayage trucking was not consulted in the development of PierPASS, despite the obvious impacts it would have on this industry segment. Although spreading pickups and drop-offs over more hours of the day should lead to shorter transaction times (all else equal), the 17:00 to 18:00 and 22:00 to 23:00 gap in operations, and the smaller size of the evening labor force caused additional delays for truckers. These delays are only a problem for truckers. Those who pay for their services pay a fixed fee; and the delivery time window factors in some amount of delay. Trucker surveys indicate that transaction time at the docks has not improved. These results are consistent with the weak position of truckers within the supply chain. Their efforts to claim some of the PierPASS revenue -- very late in the process -- were summarily ignored; terminal operators and ports knew they would not be able to exert enough pressure to achieve such an outcome.
Similarly, distribution centers, warehouses, and others had limited input in the development of PierPASS. Like the drayage truckers, they were left to absorb the additional costs of the program. From all indications, the added costs of the program have been successfully passed on to consignees and truckers.
Our examination of PierPASS leads to two additional conclusions. First, the degree to which consignees shifted to the off-peak suggests that constraints on the landside were not as great as anticipated. In part this is explained by pre-existing off-peak hour operations. Some cargo receivers and dispatchers already had in place at least some evening activity. The continued gradual increase in off-peak volume share implies continued adjustments and expansion of evening activity. The absence of a significant effect of the April 2006 fee increase suggests that cost factors associated with extended hours of operation are the important determinants of scheduling cargo moves for consignees. PierPASS results suggest that MTO resistance was the major factor delaying extended gate hours. Given that their expectations of the diversion were quite close to what happened, it seems they were aware that some cargo moves could be shifted to evening or night hours without much difficulty.
Second, PierPASS represents a significant shift in strategy on the part of the dominant actors. The growing evidence on health effects of particulates and port activity as a major source of particulate emissions has made it impossible for political leaders not to embrace an aggressive mitigation strategy. International trade proponents have no choice but to actively participate. Without operational changes that are viewed by those outside the industry as minor, no credible case could be made for supporting growth in port activity, or for the public infrastructure investments to accommodate that growth. Thus the question is one of how externalities can be addressed with the least cost to the dominant port interests. Some basic principles seem to emerge: direct all operational changes, maintain control of revenue streams, and cooperate to achieve outcomes that are mutually beneficial.

Extended Gate Operations Final Report -- 6/11/2008 --56
5.2 POLICY IMPLICATIONS
Is PierPASS a harbinger of the future? Our response is both positive and negative. On the positive side, impacts of trade-related activity in metropolitan areas are increasing, thus increasing the public visibility of ports. Efforts to regulate port operations have also occurred in metropolitan New York, Oakland and Vancouver. As environmental impacts grow, we can expect growing opposition from both environmental advocates and local communities, and various forms of mitigation, possibly including changes in operational practices, as the condition for continued trade growth. The TMF is intended to reduce highway congestion. If PierPASS is understood to be an environmental strategy, and not merely a growth strategy, then it will likely be used as a model by environmental and community groups and elected officials elsewhere.
On the other hand, metropolitan areas throughout the US are aggressively pursuing international trade as a means for economic development. Seattle has been an active partner in advocating improvements to the Seattle – Chicago rail corridor as a means to enhance its competitive position and is investing in a major new intermodal facility. Several ports are engaged in expansion plans, including the recently opened complex at Prince Rupert in British Columbia, Charleston, Houston, and Tacoma. No other US port has to date experienced a peak crisis as happened in Southern California in 2004, so none has a business incentive yet to change operating practices. Rather, regulation and higher costs in Los Angeles and Long Beach are good news to competitors. PierPASS has set a precedent. Ports and terminal operators now have a new level of responsibility to reduce impacts beyond their borders. Now that the link between container-based fees and mitigation outside the ports has been established, it is a short step to imposing more fees for similar purposes. Indeed, California Senate Bill (SB) 927, which called for a container fee of $30 per TEU to support infrastructure and emissions mitigation passed both houses of the California Legislature in 2006, but was vetoed by the Governor later the same year. He argued that the legislation provided no mechanism for the usage of the fees collected to favorably leverage the billions of dollars in available funding to develop public-private partnerships; and that it included only two ports and applied only to goods shipped in containers. Lowenthal introduced a new bill, SB 974, in February 2007 with a similar fee that would also apply to Oakland. With more goods movement-related legislation being introduced since PierPASS, addressing both financing and operations, and with the likelihood that new container fees will eventually pass, the ports of Los Angeles and Long Beach themselves adopted their own infrastructure fee in late 2007. Like the PierPASS TMF, the ports would directly control this fee. We expect that these voluntary measures will continue as the lesser of two evils as long as there is a need to identify funding sources for both infrastructure development and environmental mitigation The institutional structure that made PierPASS possible is not unique to Southern California. Thus the framework exists in other places for similar outcomes to take place, with actions that reflect the market power of certain stakeholders. .

Extended Gate Operations Final Report -- 6/11/2008 --57
REFERENCES American Association of Port Authorities (2006) Table: US/Canada Container Traffic in TEUs (http://aapa.files.cms-plus.com/Statistics/CONTAINER_TRAFFIC_CANADA_US.xls). Banister, D. and Berechman, J. (1999) Transport Investment and Economic Development, London: Taylor & Francis. Blower, D. and Campbell, K.L. (2002) The Large Truck Crash Causation Study. University of Michigan Transportation Research Institute Working Paper 2002-31. Bureau of Transportation Statistics (2006) Table I-46a: US Ton-Miles of Freight in National Transportation Statistics (http://www.bts.gov/publications/national_transportation_statistics/). Bureau of Transportation Statistics (2005) Table 3-7: Passenger and Freight Transportation Expenditures (Current $ Millions) in National Transportation Statistics (http://www.bts.gov/publications/national_transportation_statistics/2005/html/table_03_07.html). Bureau of Transportation Statistics (2003) Table C-4: US Merchandise Trade and Production of Tradable Goods in GDP: 1970-2000 in U.S. International Trade and Freight Transportation Trends. BTS Report 03-02 (http://www.bts.gov/publications/us_international_trade_and_freight_transportation_trends/2003/). Bureau of Transportation Statistics (2003) Table 7: Value and Weight of U.S. International Merchandise Trade by Mode of Transportation: 1997 and 2001 in U.S. International Trade and Freight Transportation Trends. BTS Report 03-02 (http://www.bts.gov/publications/us_international_trade_and_freight_transportation_trends/2003/). Button, K.J. and Pearman, A.D. (1981) Economics of Urban Freight Transport, London: Macmillan. California Highway Patrol (2006) 2005 Annual Report of Fatal and Injury Motor Vehicle Traffic Collisions. Available at http://www.chp.ca.gov/switrs. California Highway Patrol (2003) Presentation by Craig Klein, CHP Southern Division Communications Unit, to the CSULB Center for International Trade and Transportation Policy and Steering Committee, August 2003.
Chadwin, M.L., Pope, J.A. and Talley, W.K. (1990) Ocean Container Transport: An Operational Perspective, New York: Francis & Taylor. Chang, H., Jula, H., Chassiakos, A. and Ioannou, P. (2006) ‘Empty Container Reuse in the Los Angeles/Long Beach Port Area.’ Presentation made at the National Urban Freight Conference, Long Beach CA, Feb. 1-3, 2006.

Extended Gate Operations Final Report -- 6/11/2008 --58
Chang, P. (2005) The State of the Region 2005: Measuring Regional Progress. Southern California Association of Governments (http://www.scag.ca.gov/publications/pdf/2006/SOTR05/SOTR05_FullReport.pdf). Coussens, C. (2004) ‘The Intersections of Trade and Environmental Health: Discussion of the Roundtable on Environmental Health Sciences, Research, and Medicine.” Journal of Philosophy, Science and Law 4 (http://www.psljournal.com/archives/newsedit/iom.cfm). Davies, P. (2006) ‘Off-Dock Storage of Empty Containers in the Lower Mainland of British Columbia: Industry Impacts and Institutional Issues.’ Presentation made at the National Urban Freight Conference, Long Beach CA, Feb. 1-3, 2006. Erie, S.P. (2004) Globalizing L.A.: Trade, Infrastructure, and Regional Development, Stanford, CA: Stanford University Press. Fairbank, Maslin, Maullin & Associates (2006) PierPASS: Los Angeles/Long Beach Harbor Truckers Survey. Summary Report 630-145. (http://www.cunninghamreport.com/6286PierPASSSurvey.pdf). Federal Motor Carrier Safety Administration, National Highway Transportation Safety Administration (2005) Large Truck Crash Causation Study. Available at http://aifmcsa.dot.gov/ltccs. Federal Register (2004) ‘Federal Maritime Commission Notice of Agreements Filed,’ June 17, 2004 69 (116), pp. 33903-33904. (http://a257.g.akamaitech.net/7/257/2422/06jun20041800/edocket.access.gpo.gov/2004/04-13594.htm). Geunes, J. and Pardalos, P.M. (2005) Supply Chain Optimization, New York: Springer. Giuliano, G. and O’Brien, T. (2007) “The terminal gate appointment system at the Ports of Los Angeles and Long Beach: An Assessment,” Transportation Research D, forthcoming.
Giuliano, G. and O’Brien, T. (2006) Evaluation of the Terminal Gate Appointment Systems at the Los Angeles-Long Beach Ports. METRANS Research Report 04-06.
Giuliano, G., Agarwal, A., Li, C., and Linder, A. (2005) Caltrans/MTA/METRANS Port Impact Study Final Report. Report submitted to California Department of Transportation District 7 and Los Angeles County Metropolitan Transportation Authority.
Golob, T.F. and Regan, A.C. (2004) Truck-Involved Crashes and Traffic Levels on Urban Freeways. University of California Institute of Transportation Studies Working Paper Gunther, H. and Kim, K.H. (2005) Container Terminals and Automated Transport Systems: Logistics Control Issues and Quantitative Decision Support, Berlin: Springer.

Extended Gate Operations Final Report -- 6/11/2008 --59
Hanson, K. ‘Ports Pass Clean Air Plan.’ Long Beach Press Telegram (online version), November 20, 2006. Hanson, K. ‘Emissions Act Cleaned Up,’ Long Beach Press Telegram (online version), November 6, 2006. Hanson, K. ‘Pollution may Hurt Business at Ports,’ Long Beach Press Telegram (online version), November 17, 2006. Haveman, J. D. and Hummels, D. (2004) California’s Global Gateways: Trends and Issues, San Francisco, CA: Public Policy Institute of California.
Holguin-Veras, J.,Polimeni, J, and Basu, N. (2006) Potential for off-peak freight deliveries to congested urban areas, TIRC Final Report Project C-02-15. Le-Griffin, D.H. and Moore, J. (2006) Potential Impact of Short Sea Shipping in the Southern California Region. METRANS Research Report 04-04.
Lena, T.S., Ochieng, V, Carter, M; Holguin-Veras, J; and Kinney, P. (2002) ‘Elemental Carbon and PM2.5 Levels in an Urban Community Heavily Impacted by Truck Traffic,’ Environmental Health Perspectives 110(10), pp. 1009-1015. Los Angeles Economic Development Corp. (2006) International Trade Trends & Impacts: The Southern California Region 2005 Results and 2006 Outlook (http://www.laedc.org/reports/Trade-2006.pdf)
Moonesinghe, R., Longthorne, A., Shankar, U., Singh, S., Subramanian, R., and Tessmer, J. An Analysis of Fatal Large Truck Crashes. National Highway Traffic Safety Administration Technical Report No. DOT HS 809 569.
Namboothiri, R. and A. Erera, (2007) “Planning local container drayage operations given a port access appointment system,” Transportation Research E, forthcoming.Schweitzer, L. (2006) ‘Environmental Justice and Hazmat Transport: A Spatial Analysis in Southern California,’ Presentation made at the National Urban Freight Conference, Long Beach CA, Feb. 1-3, 2006. South Coast Air Quality Management District (SCAQMD) (2000) Multiple Air Toxics Exposure Study In the South Coast Air Basin: MATES-II Final Report and Appendices. Diamond Bar, CA: SCAQMD. (http://www.aqmd.gov/matesiidf/matestoc.htm). Southern California Association of Governments. 2003 Model Validation and Summary: Regional Transportation Model (Draft), 2007. Stonebridge Associates, Inc.(2005) Survey of Port Driver Attitudes on PierPASS OffPeak Program. (http://www.cunninghamreport.com/9265CTAPierPASSSurvey.pdf).

Extended Gate Operations Final Report -- 6/11/2008 --60
Stonebridge Associates, Inc. (2006) Second Survey of Port Driver Attitudes on PierPASS OffPeak Program. (http://www.caltrux.org/downloads/pdf/Public_Downloads/Pier_Pass_Survey.pdf). US Department of Transportation, Center for Climate Change and Environmental Forecasting (2006) Table: About Transportation and Climate Change: Emissions Inventories (http://climate.volpe.dot.gov/transemiss.html). Waterfront Coalition (2005) National Marine Container Transportation System: Call for Action. (www.portmod.org).
Yahalom, S. (2001) Intermodal Productivity and Goods Movement Phase 2: Land Access to Port and Terminal Gate Operations. University Transportation Research Center, Region II. (http://www.utrc2.org/research.assets/35/intermodal1.pdf).

Extended Gate Operations Final Report -- 6/11/2008 --61
APPENDIX A INTERVIEW LISTS
PierPASS Interview Matrix (non terminals)
Organization Date Interviewed
Where Interviewed
Alameda Corridor Transportation Authority 6/5/06 Carson
Terminal Interview Matrix
Association of CA Recycling Industries 7/26/06 Baldwin Park
CA State Senate 12/13/06 Phone CA State Senate 6/9/06 Long Beach CA State Senate 5/22/07 Sacramento
CP Transporters 2/25/07 Rancho Dominguez
Federal Maritime Commission 6/06/06 Long Beach
Federal Maritime Commission 1/23/07 Washington
DC Federal Maritime Commission 7/27/07 Phone
Conference Golden State Logistics 9/28/06 Long Beach Mattel (El Segundo) 7/09/07 Phone PierPASS 2/9/06 Long Beach PierPASS/Ogilvy 12/21/06 Long Beach Port of Long Beach 8/31/06 POLB Port of Los Angeles 12/20/06 Email Rail 12/13/06 Phone
US Dept. of Commerce 4/17/07 Phone
Terminal Date Interviewed
Where Interviewed
APL 8/11/2006 Email APM 11/23/2006 APM CUT 2/22/2007 CUT Evergreen 12/11/206 Evergreen ITS 8/22/2006 ITS LBCTI 5/14/2007 LBCTI
PCT SSA Pier J 5/22/2007 PCT SSA Pier J
SSA Pier A 12/14/2007 SSA Pier A SSA Pier C 6/7/2007 SSA Pier C Trapac 8/3/2006 Phone TTI / HANJIN 3/26/2007 Email WBCT 9/28/2006 WBCT YTI 10/8/2006 YTI

Extended Gate Operations Final Report -- 6/11/2008 --62
APPENDIX B PIERPASS TIMELINE
9/30/2002 CA Governor Gray Davis signs AB 2650; Limits the amount of truck queuing at terminal gates to 30 minutes. 2/17/2004 AB 2041 proposed, would establish Port Congestion Management Districts and would require a container charge to be collected to alleviate
congestion. 8/1/2004 PierPASS program announced, AB 2041 withdrawn
11/1/2004 PierPASS program originally scheduled to begin operation. 11/8/2004 PierPASS announces that extended gate hours will be implemented on an accelerated schedule. 12/1/2004 5000 dockworkers hired to alleviate future terminal delays.
12/21/2004 Senior PierPASS officials brief Waterfront Coalition members. 1/5/2005 PierPASS announces intent to debut program in March debut, anticipates fee $40/TEU. 2/1/2005 PierPASS selects Affiliated Computer Services to implement PierPASS. 2/7/2005 Terminal Operators PierPASS start date from March to June 1
2/24/2005 PierPASS announces goals: 20- 25% of cargo moved off-peak within first year, 30% within second year, 35-40% within three years. Costs to be evaluated every six months.
4/1/2005 PierPASS start postponed to July. 4/6/2005 Affiliated Computer Systems signs contract valued at $12 million over 3 years 5/1/2005 Ogilvy Public Relations Worldwide of San Francisco to provide PR services for PierPASS. 6/1/2005 Total Terminals International starts offering night and weekend gates, and ends hoot hours at POLA. 6/8/2005 PierPASS drops five-week rollout plan in favor of a single date.
6/12/2005 Some truckers call for stop-work meeting on June 23, first night or PierPASS. 6/15/2005 PierPASS encourages shippers to register well in advance of June 23 inauguration. 6/17/2005 Journal Of Commerce announces free 90-min teleconference regarding PierPASS's Off-Peak program.
7/1/2005 PierPASS boycott flyer circulates, suggests that truckers should fight to get portion of mitigation fee. 7/1/2005 Traffic mitigation fee raised to $40 per 20ft container and $80 per 40ft container. 7/1/2005 ILWU accuses Terminal Operators of outsourcing PierPASS functions to non-union workers.
7/14/2005 PierPASS CEO Bruce Wargo appears at Harbor Transportation Club dinner meeting to explain program. 7/17/2005 PierPASS announces that over 3600 companies have registered for program 7/21/2005 ILWU backs PierPASS, but has concerns with the program's technology. 7/21/2005 PierPASS announces that over 5000 companies have registered for program 7/22/2005 Teamsters rally at POLA administration building to protest effects of PierPASS on truckers.

Extended Gate Operations Final Report -- 6/11/2008 --63
7/23/2005 PierPASS Off-peak gates begin. 7/23/2005 Yusen Terminals International announces that it will begin to require appointments for off-peak pick-ups or drop-offs. 7/23/2005 Weekend terminals operate at 20% to 50% normal weekday traffic. 7/23/2005 AB2650 rendered obsolete as PierPASS begins. 7/25/2005 PierPASS postpones collection of container fee to July 27 due to computer glitches. 7/25/2005 Nighttime gates move more than 7500 containers. 7/25/2005 Delays on first night of open gates due to shortages in experienced labor. 7/26/2005 Nighttime gates move more than 7642 containers. 7/27/2005 PierPASS moving 20 to 30% of containers on nights and weekends. 7/27/2005 PierPASS postpones collection of container fee to July 29 due to computer glitches. 7/27/2005 Nighttime gates move more than 7763 containers. 7/27/2005 PierPASS delays collection of TEU fee until Thursday, 7/28. 7/28/2005 Nighttime gates move more than 7924 containers. 7/28/2005 TACA suspends congestion surcharge at San Pedro ports until August 31. 7/28/2005 PierPASS delays collection of TEU fee until Friday, 7/29. 7/29/2005 PierPASS begins holding containers with unpaid fees. 7/30/2005 Saturday shift moves 11,183 containers.
8/1/2005 Nighttime gates move 8644 containers. 8/1/2005 August cargo volumes indicate beginning of peak-season traffic. 8/2/2005 Nighttime gates move 9240 containers. 8/7/2005 Approximately 30% of all cargo being moved during night or weekend hours.
8/12/2005 Yusen drops requirement for appointments. 8/15/2005 Trucking executives complain that cargo is not moving faster at night. 8/15/2005 Press report: Neighbors of the Ports complain about nighttime noise and pollution. 8/15/2005 Bruce Wargo tells LB Harbor Commissioners that truckers are proving they're willing to work nights. 8/17/2005 PierPASS announces itself a success, around 30% of weekly volume moving off-peak. 8/17/2005 Terminals report that majority of off-peak traffic occurs before 10pm ILWU lunch break. 8/21/2005 PierPASS continues to move 30% of containers in off-peak hours ~ 9900 per day. 8/24/2005 PierPASS issues customer advisory that invoices omitted detailed information. 8/29/2005 PierPASS survey show truckers spend less than 30 minutes on average for pickups. 8/29/2005 Trucker survey shows 47% positive, 38% negative, and 15% mixed review re: PierPASS.
9/4/2005 Southern California Association of Governments issues modal elasticity study, fuels debate over container surcharges

Extended Gate Operations Final Report -- 6/11/2008 --64
9/6/2005 Port of Oakland to begin extended hours pilot program at the SSA Marine terminal. 9/12/2005 More than one-third of LA/LB containers are carried during off-peak hours. 9/26/2005 Stonebridge Associates submits to California Trucking Association (CTA) a survey of driver attitudes about PierPASS. 9/30/2005 PierPASS reports accommodating between 9 and 11,000 tucks per night. 9/30/2005 PierPASS reports accommodating 400,000 trucks in the off-peak during its first eight weeks. 9/30/2005 33% of eligible containers moved in the off peak in September of 2005. 9/30/2005 More than 300 high paying jobs added at night at POLA and POLB due to inception of PierPASS. 9/30/2005 Report: 2/3 of the off-peak volume moving between 6 pm and 11 pm in September of 2005.
10/10/2005 PO Oakland experiments with keeping Terminal open until 2am. 10/28/2005 California Trucking Association (CTA) releases survey results regarding trucker's mixed opinion on PierPASS. 11/3/2005 ILWU stop-work meeting halts PierPASS night gates. 11/4/2005 Community members ask AQMD to monitor PierPASS's negative effects. 11/7/2005 Survey of ports credits PierPASS with 30-35% off-peak diversion. 1/17/2006 PierPASS announces RFID tags program 1/18/2006 New York Shipping Association (NYSA) chief declares PierPASS wouldn't work for Port of NY. 1/20/2006 Port of LA sets national record for volume for 4th year in a row. 1/23/2006 POLB moves 6,709,818 TEU's in 2005. Increase of 16.1%. 1/23/2006 Oakland moves 2,272,525 TEU's in 2005. Increase of 11.0%. 1/30/2006 Matson SSA terminal in LB considers joining PierPASS without $80 peak hour fees.
2/6/2006 California Trucking Association (CTA) challenges recent survey performed for PierPASS. States truckers attitudes toward PierPASS are negative.
3/8/2006 2nd PierPASS survey shows truckers who get extra pay more positive about PierPASS; that Night and Saturday shifts are unpopular (Main reason being conflict with family time); No difference in day/night turn times.
3/10/2006 Report: Less than 1/2 of exports shipments pay PierPASS fee 3/10/2006 Discussions on extending PierPASS gates to 5pm instead of 6pm. 4/19/2006 Between 150 and 300 trucks protest in Vancouver over rates, reservation system. 4/24/2006 PierPASS container fee increases to $50/$100 per container.
5/4/2006 Bruce Wargo of PierPASS states that the terminals are reluctant to start a Friday night gate until others fully utilized. 5/30/2006 CA SB 760 proposed, would impose $30/TEU fee at LA,LB to pay for security, rail, and pollution mitigation.
6/5/2006 ILWU resolution calls for an independent audit of PierPASS.
6/6/2006 Two millionth off-peak truck move for PierPASS. More than 35% of traffic is now off-peak.

Extended Gate Operations Final Report -- 6/11/2008 --65
6/6/2006 PierPASS adopts eModal Trucker Check database to support Truck Tag program. 6/26/2006 PierPASS- exporters will require a booking appointment during peak beginning August 7th.
7/2/2006 PierPASS survey reveals driver satisfaction - California Trucking Association (CTA) skeptical. 7/25/2006 PierPASS diverts 2.5 million daytime truck trips. 7/25/2006 PierPASS is 1 year old. 7/31/2006 POLB reports that 1/3 of port traffic has moved off peak. 8/14/2006 Study finds virtually no diversion of container ships due to TEU fee 8/14/2006 CA SB 1829 turn bill may cost estimates 25% of current gate moves exceed 1/2 hour. 8/21/2006 SB 760 container fee bill fails 8/21/2006 Natural Resource Defense Council releases a study and reports $30 TEU fee would not result in a diversion of cargo to other ports. 8/21/2006 SB 764 Suspended; Would have required POLB/LA to document their annual pollution and incur fine if over 2001 levels. 8/21/2006 SB 1829 Suspended; Would have limited turn time. 8/21/2006 SB 762 Suspended: would have required permit system for trucks entering ports 8/25/2006 SB 760 container fee bill revived as SB 927 8/31/2006 SB 927approved by legislators 9/11/2006 POLB/LA shippers threatened by SB 927, threaten challenges in Court if signed by Governor 9/21/2006 Bob Foster, newly elected LB mayor, announces support of $30 TEU fee. 9/25/2006 Lowenthal and Bob Foster rally to persuade governor to not veto SB 927. 1/29/2007 Statistics for end of year show that POLB has increased volume by 8.6% total 7,289,366 TEUs. 1/29/2007 Statistics for end of year show that POLA has increased volume of trade by 31.2% total 8,469,853 TEUs.
2/8/2007 PierPASS survey: Trucker earnings on the rise due to more truck trips by having extended gate hours. 2/19/2007 Fee of $50 per TEU proposed in Washington state by Senator to cover mobility infrastructure projects. 2/28/2007 Sen. Alan Lowenthal introduces revised version of $30 container bill to include Oakland.
3/5/2007 Washington state legislators throw out proposal to impose $50 TEU fee on all containers moving through ports. 3/12/2007 Report: PONY/NJ may consider plan to operate extended gates. 3/12/2007 Sen. Lowenthal proposes a revival of $30 TEU fee to pay for pollution- reduction measures. 3/26/2007 Hawaii threatens legal action against CA container fee bill if passed; posed hardship on HI consumers. 5/14/2007 PierPASS announces that its OffPeak program has diverted more than 5 million truck trips. 10/1/2007 PierPASS tightens registration procedures.

Extended Gate Operations Final Report -- 6/11/2008 --66
APPENDIX C MTO INTERVIEW INSTRUMENT
EVALUATION OF EXTENDED GATE OPERATIONS
AT THE PORTS OF LOS ANGELES AND LONG BEACH Thank you for taking the time to answer our research questions about extended gate operations at the Ports of Los Angeles and Long Beach. If you assisted us with our research on gate appointments, we are also asking you to update the information you provided us in 2004. Under continued pressure to adjust operations in ways that mitigate traffic and air quality impacts of port operations and in response to threatened regulatory legislation, terminal operators have agreed to implement a voluntary program of extended gate hours. The proposed program is called PierPASS, and it assesses a Traffic Mitigation Fee on all containers moved during peak hours. The fees are intended to defray the costs of extended operations at the ports. A special purpose entity, established by the terminal operators and known as PierPASS, Inc., administers the program. The movement of goods during evenings and weekends is seen as an opportunity to reduce daytime congestion on local highways, thereby reducing pollution. It also has the potential to increase the throughput of the terminals, which have struggled to cope with increased container volume and labor shortages. A few terminals previously offered extended gates; PierPASS is a move toward standardizing practices at all container terminals at the two ports. The extended gate evaluation will include the following: 1) descriptive analysis of extended gate operations and their role in the supply chain; 2) analysis of the use of extended hours by truckers and their clients; 3) assessment of extended hours impact on terminal throughput and queuing; 4) estimation of traffic impacts of PierPASS; 5) institutional analysis of the development, implementation and use of the PierPASS program; 6) overall assessment. PierPASS is the second major attempt within an 18-month period to mitigate the impacts of truck traffic and emissions on the surrounding community. A truck appointment system designed to limit vehicle idling at the terminal gates began in July 2003, also in response to legislative initiative. Both appointments and extended gates are expected to contribute to improved port efficiency, an issue of growing regional and national concern. Experiences at the Los Angeles/Long Beach ports will provide insight on whether operational strategies are effective in solving goods movement related impacts in metropolitan areas.

Extended Gate Operations Final Report -- 6/11/2008 --67
RESEARCH TEAM
USC Dr. Genevieve Giuliano Professor and Sr. Associate Dean of
Research and Technology Director, METRANS Transportation
Center School of Policy, Planning and
Development University of Southern California [email protected] Research Assistants: Mayank Mohan [email protected]
CSULB
Dr. Thomas O’Brien Director of Research Center for International Trade and
Transportation Associate Director, METRANS CSULB
Programs California State University, Long Beach [email protected] Allyson Clark [email protected] Jesse Hendrix [email protected]

Extended Gate Operations Final Report -- 6/11/2008 --68
Background Information 1. Contact information 2. When did the terminal open and has it been expanded in the last 5 years? 10
years? Are there plans for future build-out? 3. When does the current lease agreement expire? Have there been any interim
changes to agreement with landlord port? 4. What is the maximum number of gangs that can be run at the terminal? Operational Procedures 5. Please describe the terminal capacity with regard to acreage, number of berths,
cranes, transtainers, etc. 6. How many ships can be serviced at any one time (size and length)? 7. Do you have on-dock rail? Which rail company operates it? Have you seen any
increases in use of on-dock rail over the past year? 8. What is the annual volume of cargo? Can you provide any info on daily, weekly
volumes and variation across seasons? 9. Is any non-containerized cargo handled? 10. Please describe the transaction process. How many gates/lanes/posts/points are in
operation? 11. Does process differ for full/empty, full/full, empty/full, etc.? 12. What technologies are used to check-in vehicles and record transactions (OCR,
RFID, etc)? Include procedures for picking up chassis to load non-wheeled cargo. Are there contingency plans when OCR, etc. are not operating? How often does this occur?
13. What is the average turn time (by transaction type)? 14. What constitutes a turn? 15. How are averages generated (by sample, weekly, etc.)? 16. Prior to the start of PierPASS, what was the extent of dockside operations that
occurred outside of 8 am-5pm (both weekdays and weekends)? Did you operate (full) gate hours outside of 8 am-5 pm? What were hours for ship

Extended Gate Operations Final Report -- 6/11/2008 --69
loading/unloading; yard work, for container pickup/delivery; for gate entry/exit, by day of week, season?
17. Prior to the start of PierPASS, were there off-hour pick ups for cargo on wheels? 18. Prior to the start of PierPASS, were there limitations on the number of
moves/transactions or type/source of cargo for night gates? 19. Which industry database and communications systems do you use (e-Modal,
MTC Voyager)? PierPASS 20. What in your opinion was the primary motivating factor behind the development
of PierPASS? 21. What percentage of off-peak moves involves exempt vs. non-exempt cargo? 22. What were your original expectations with regard to the likelihood of shifting gate
moves to the off-peak? Have they been met? 23. Are you comfortable with the fee structure used to assess the cost of off-peak
operations? What changes would you make? Have you noticed any changes since the increase of PierPASS fees in the spring?
24. Are your gates open between 5-6 PM? 25. Do you have specific plans to deal with congestion at the start of PierPASS
hours? 26. Do you shut down the yard between 10 and 11 PM? Do you have different
procedures/hours for empties yard vs. transtainers? 27. Do you have different off-peak processes for export and import cargo? Have you
made any operational changes to encourage more off-peak moves? 28. Have you encountered any difficulties in ordering gangs for the off-peak? Please
explain. 29. Are there any services currently offered during peak hours that ARE NOT offered
off-peak (payment of demurrage fees, steamship line services, food vendors, etc.)?
30. Has PierPASS had any impact on use of rail services? 31. Has PierPASS changed the way you use online services such as E-modal?
Extended Gate Operations Final Report -- 6/11/2008 --70
32. Were there pre-existing price-differentials based on shift for cargo pick-up and drop-off prior to PierPASS?
33. Would you prefer an incremental approach to the adoption of extended gates
(determined by terminal and by shift) to the port-wide approach used by PierPASS?
34. Do you foresee any opportunities to operate gates (hours, services, etc.) based on
ship schedules (arrival, departure, unloading, seasonal patterns, etc.)? 35. What is your overall assessment of extended hours as a means of increasing
throughput at the gates and improving the efficiency of the supply chain? Do you believe that this is a permanent change for the industry?
36. The trucking industry continues to express some misgivings about PierPASS. Do
you envision any other operational changes from the terminals in response to these concerns?
37. Given your knowledge of port operations elsewhere, how likely is it that the PierPASS model will be adopted by other terminals you operate in other parts of the country/world?
38. Are there any data on peak vs. off-peak moves or on off-peak costs which you do
not make available to PierPASS and which we may review?

Extended Gate Operations Final Report -- 6/11/2008 --71
APPENDIX D COMMUNITY INTERVIEW INSTRUMENT
EVALUATION OF EXTENDED GATE OPERATIONS AT THE PORTS OF LOS ANGELES AND LONG BEACH
Thank you for taking the time to answer our research questions about extended gate
operations at the Ports of Los Angeles and Long Beach. No names are used in our research. All answers remain confidential.
Under continued pressure to adjust operations in ways that mitigate traffic and air quality
impacts of port operations and in response to threatened regulatory legislation, terminal operators have agreed to implement a voluntary program of extended gate hours. The proposed program is called PierPASS, and it assesses a Traffic Mitigation Fee on all containers moved during peak hours. The fees are intended to defray the costs of extended operations at the ports. A special purpose entity, established by the terminal operators and known as PierPASS, Inc., administers the program.
The movement of goods during evenings and weekends is seen as an opportunity to
reduce daytime congestion on local highways, thereby reducing pollution. It also has the potential to increase the throughput of the terminals, which have struggled to cope with increased container volume and labor shortages. A few terminals previously offered extended gates; PierPASS is a move toward standardizing practices at all container terminals at the two ports.
The extended gate evaluation will include the following: 1) descriptive analysis of
extended gate operations and their role in the supply chain; 2) analysis of the use of extended hours by truckers and their clients; 3) assessment of extended hours impact on terminal throughput and queuing; 4) estimation of traffic impacts of PierPASS; 5) institutional analysis of the development, implementation and use of the PierPASS program; 6) overall assessment.
PierPASS is the second major attempt within an 18-month period to mitigate the impacts
of truck traffic and emissions on the surrounding community. A truck appointment system designed to limit vehicle idling at the terminal gates began in July 2003, also in response to legislative initiative. Both appointments and extended gates are expected to contribute to improved port efficiency, an issue of growing regional and national concern. Experiences at the Los Angeles/Long Beach ports will provide insight on whether operational strategies are effective in solving goods movement related impacts in metropolitan areas.

Extended Gate Operations Final Report -- 6/11/2008 --72
RESEARCH TEAM
USC
Dr. Genevieve Giuliano Professor and Sr. Associate Dean of
Research and Technology Director, METRANS Transportation
Center School of Policy, Planning and
Development University of Southern California [email protected] Research Assistants: Jiangping Zhou [email protected]
CSULB
Dr. Thomas O’Brien Director of Research Center for International Trade and
Transportation Associate Director, METRANS CSULB
Programs California State University, Long Beach [email protected] Allyson Clark [email protected] Walter Tan [email protected]

Extended Gate Operations Final Report -- 6/11/2008 --73
Neighborhood Council Association/ Group __________________________- Date _____________ Contact Name______________________________________________ Position in Organization______________________________________
1. How long have you lived in your neighborhood council district? _________________________
2. Home zip code __________
Work zip code __________
3. Does your commute normally involve (check all that apply)
the I-710 __________ the I-110 __________ local surface streets __________ Other __________
4. In the last year alone, how would you measure the truck congestion within your neighborhood ? More, Less or the Same? Please explain.
5. In the last year alone, how would you measure the truck congestion on the local
freeways? More, Less or the Same? Please explain.
6. In the last year, have you noticed a difference in weekday (8am-5pm) truck traffic volume within your neighborhood and around your local streets compared to late afternoon and night time traffic? Please explain.

Extended Gate Operations Final Report -- 6/11/2008 --74
7. In the last year, have you noticed a difference in weekday (8am – 5pm) truck traffic volume on local freeways compared to late afternoon and night time traffic? Please explain.
8. In the last year, have you noticed a difference in Saturday truck traffic volume
within your neighborhood? Please explain. 9. In the last year, have you noticed a difference in Saturday truck traffic volume on
local freeways? Please explain. 10. Are you familiar with the program called PierPASS? 11. Was your neighborhood council invited to submit comments on PierPASS or any
other off-peak truck plans prior to implementation? By Whom?
12. How effective do you think PierPASS has been at decreasing truck traffic in the vicinity of the ports?
13. Has the neighborhood council taken a formal action in support of or in opposition
to PierPASS? If so, when did this occur?
14. Has the neighborhood council taken a formal action in support of or in opposition to any other port strategy such as the Clean Air Action Plan?
15. How does your neighborhood group formally communicate with the ports on matters of community concern?

Extended Gate Operations Final Report -- 6/11/2008 --75
APPENDIX E WAREHOUSE AND DC INTERVIEW INSTRUMENT
EVALUATION OF EXTENDED GATE OPERATIONS AT THE PORTS OF LOS ANGELES AND LONG BEACH
Thank you for taking the time to answer our research questions about extended gate
operations at the Ports of Los Angeles and Long Beach. No names are used in our research. All answers remain confidential.
Under continued pressure to adjust operations in ways that mitigate traffic and air quality
impacts of port operations and in response to threatened regulatory legislation, terminal operators have agreed to implement a voluntary program of extended gate hours. The proposed program is called PierPass, and it assesses a Traffic Mitigation Fee on all containers moved during peak hours. The fees are intended to defray the costs of extended operations at the ports. A special purpose entity, established by the terminal operators and known as PierPass, Inc., administers the program.
The movement of goods during evenings and weekends is seen as an opportunity to
reduce daytime congestion on local highways, thereby reducing pollution. It also has the potential to increase the throughput of the terminals, which have struggled to cope with increased container volume and labor shortages. A few terminals previously offered extended gates; PierPass is a move toward standardizing practices at all container terminals at the two ports.
The extended gate evaluation will include the following: 1) descriptive analysis of
extended gate operations and their role in the supply chain; 2) analysis of the use of extended hours by truckers and their clients; 3) assessment of extended hours impact on terminal throughput and queuing; 4) estimation of traffic impacts of PierPass; 5) institutional analysis of the development, implementation and use of the PierPass program; 6) overall assessment.
PierPass is the second major attempt to mitigate the impacts of truck traffic and emissions
on the surrounding community. A truck appointment system designed to limit vehicle idling at the terminal gates began in July 2003, also in response to legislative initiative. Both appointments and extended gates are expected to contribute to improved port efficiency, an issue of growing regional and national concern. Experiences at the Los Angeles/Long Beach ports will provide insight on whether operational strategies are effective in solving goods movement related impacts in metropolitan areas.

Extended Gate Operations Final Report -- 6/11/2008 --76
RESEARCH TEAM
CSULB
Dr. Thomas O’Brien Director of Research
Center for International Trade and Transportation Associate Director, METRANS CSULB Programs
California State University, Long Beach [email protected]
Research Assistants:
Allyson Clark [email protected]
Jesse Hendrix

Extended Gate Operations Final Report -- 6/11/2008 --77
Questions for Warehousing and DCs Background Information (for internal use only) 1. Name of Company:_____________________________________________________ Address: _____________________________________________ __________________________________
__________________________________ __________________________________
Phone: _____________________ Website (if any): _____________________________ Your Name: _________________________ Your Title: ________________________ Email: ____________________________ 2. How long has your company been in the warehousing/DC business? _____years 3. Does your company perform intermodal trucking services? Yes No
If so, number of intermodal trucks:
Company owned _______ Driver-owned (owner operator)_______
If so, Number of intermodal drivers:
Company drivers _______ Owner-operators ______
If so, are your company intermodal drivers union workers? Yes No
PierPass and Operational Procedures 4. What are your operating hours?
Weekdays: ______ a.m. to ______ p.m.
Saturdays: ______ a.m. to ______ p.m. Sundays: ______ a.m. to ______ p.m.

Extended Gate Operations Final Report -- 6/11/2008 --78
5. What is the capacity of your facility in terms of warehouse space? _________________________________________________
6. What is the capacity of your facility for holding trucks/live loads? _________________________________________________
7. Have you instituted a second shift or weekend shift since the start of PierPass?
__________________________________________________________________
If so, please indicate where operational costs have increased and to what extent (e.g. added one security guard, hired X number of new permanent staff members for second shift, added costs in overtime labor differential).
__________________________________________________________________ __________________________________________________________________ __________________________________________________________________
8. Where does night time staging occur?
_____________________________________ 9. Are you able to accept live loads in the off-peak? Yes No
10. What is the latest time that you will accept a live load? _________________
11. What percentage of your off-peak loads do you estimate arrive between 6 PM and
12:00 midnight? _________________

Extended Gate Operations Final Report -- 6/11/2008 --79
12. Has PierPass improved your throughput or your ability to meet customer demands? Please explain.
Yes Somewhat No __________________________________________________________________ __________________________________________________________________
13. Has PierPass had a negative impact on your throughput or your ability to meet customer demands (e.g. lack of capacity)? Please explain.
Yes Somewhat No __________________________________________________________________ __________________________________________________________________
14. Have you instituted any incentives for truckers to make pick-ups or drop-offs in the off-peak? Please explain.
_____________________________________________________________
_____________________________________________________________
15. Have you instituted a surcharge for work performed during off-peak hours?
Please explain.
_____________________________________________________________
_____________________________________________________________ 16. Is your overall impression of PierPass:
Very Positive Somewhat Positive Neither positive nor negative Very Negative Somewhat Negative No opinion The following are questions for discussion. Please feel free to provide any additional written comments you would like to add.

Extended Gate Operations Final Report -- 6/11/2008 --80
17. Are there problems with PierPass from the warehouse/DC perspective? If so, please describe: __________________________________________________________________________________________________________________________________________________________________________________________________________________________________________________________________________________________________________________________________________________________________________________________ 18. What advantages do you see in PierPass? __________________________________________________________________________________________________________________________________________________________________________________________________________________________________________________________________________________________________________________________________________________________________________________________ 19. Do you have any other opinions about PierPass you would like to share with us? _____________________________________________________ ________________________________________________________________________________________________________________________________________________________________________________________________________________________
THANK YOU