evaluation of extended learning opportunities summer title
TRANSCRIPT

February 2019
Evaluation of Extended Learning
Opportunities—Summer Title I
Enrichment Program (ELO STEP) in
2017–2018
P R E P A R E D B Y :
Juan Carlos Davila Valencia, M.S.
Shahpar Modarresi, Ph.D.
Program Evaluation Unit

850 Hungerford Drive
Rockville, Maryland 20850
240-740-3000
Dr. Jack R. Smith Superintendent of Schools
Dr. Janet S. Wilson Associate Superintendent, Office of Shared Accountability
Published for the Office of Shared Accountability
Copyright © 2019 Montgomery County Public Schools, Rockville, Maryland
February 2019 Office of Shared Accountability Program Evaluation Unit
Evaluation of Extended Learning Opportunities Summer Title I Enrichment Program (ELO STEP) in
2017–2018 Juan Carlos Davila Valencia, M.S., and Shahpar Modarresi, Ph.D.
Purpose of the Study
During summer 2018, the Extended Learning Opportunities—Summer Title I Enrichment Program (ELO STEP) in Montgomery
County Public Schools (MCPS) provided high achievers from low-income families, entering Grades 3, 4, and 5, easy access to
advanced programming in Curriculum 2.0, and center programs especially focused on advanced mathematics and science.
Using a non-equivalent comparison group design, this evaluation examined the outcomes of the ELO STEP program by comparing
the fall 2018 MAP-R and MAP-M scores of participants (664 students who attended 19 or more days out of 25 days of instruction) to
nonparticipants with similar characteristics (1,004 students) after controlling for pre-existing differences.
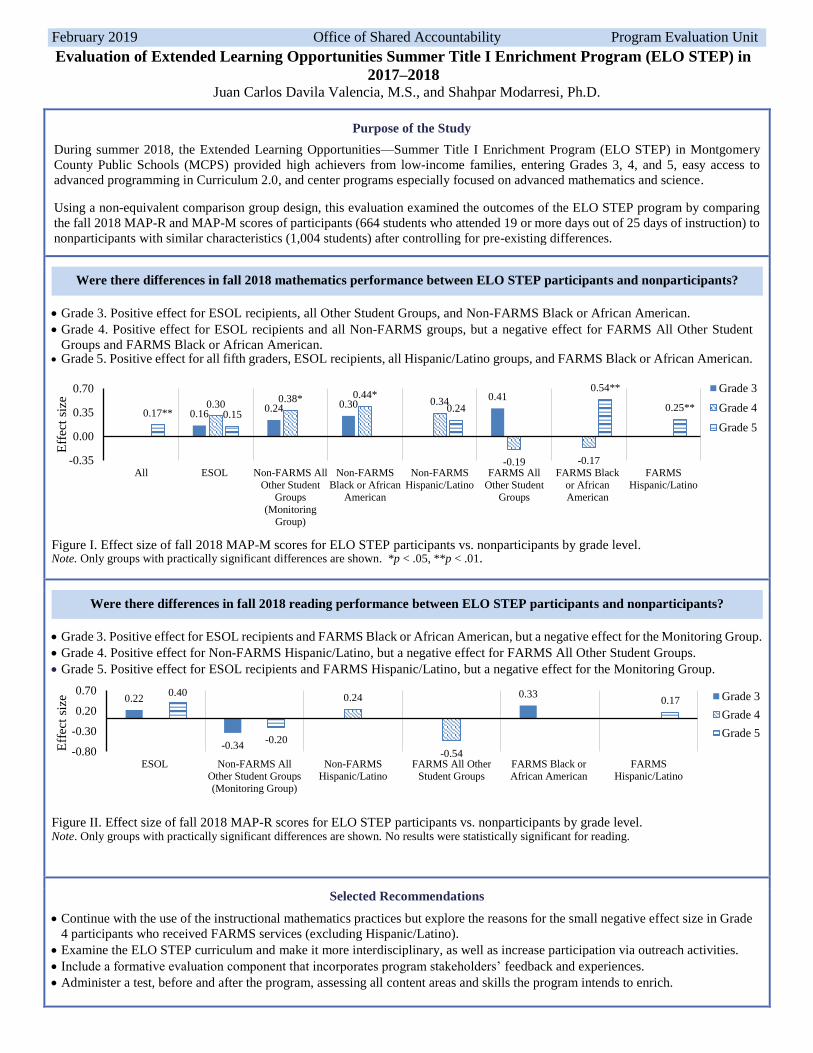
Grade 3. Positive effect for ESOL recipients, all Other Student Groups, and Non-FARMS Black or African American.
Grade 4. Positive effect for ESOL recipients and all Non-FARMS groups, but a negative effect for FARMS All Other Student
Groups and FARMS Black or African American. Grade 5. Positive effect for all fifth graders, ESOL recipients, all Hispanic/Latino groups, and FARMS Black or African American.
Figure I. Effect size of fall 2018 MAP-M scores for ELO STEP participants vs. nonparticipants by grade level. Note. Only groups with practically significant differences are shown. *p < .05, **p < .01.
Grade 3. Positive effect for ESOL recipients and FARMS Black or African American, but a negative effect for the Monitoring Group.
Grade 4. Positive effect for Non-FARMS Hispanic/Latino, but a negative effect for FARMS All Other Student Groups.
Grade 5. Positive effect for ESOL recipients and FARMS Hispanic/Latino, but a negative effect for the Monitoring Group.
Figure II. Effect size of fall 2018 MAP-R scores for ELO STEP participants vs. nonparticipants by grade level. Note. Only groups with practically significant differences are shown. No results were statistically significant for reading.
Selected Recommendations
Continue with the use of the instructional mathematics practices but explore the reasons for the small negative effect size in Grade
4 participants who received FARMS services (excluding Hispanic/Latino).
Examine the ELO STEP curriculum and make it more interdisciplinary, as well as increase participation via outreach activities.
Include a formative evaluation component that incorporates program stakeholders’ feedback and experiences.
Administer a test, before and after the program, assessing all content areas and skills the program intends to enrich.
0.160.24 0.30
0.410.30
0.38* 0.44*0.34
-0.19 -0.17
0.17** 0.150.24
0.54**
0.25**
-0.35
0.00
0.35
0.70
All ESOL Non-FARMS All
Other Student
Groups
(Monitoring
Group)
Non-FARMS
Black or African
American
Non-FARMS
Hispanic/Latino
FARMS All
Other Student
Groups
FARMS Black
or African
American
FARMS
Hispanic/Latino
Eff
ect
size
Grade 3
Grade 4
Grade 5
0.22
-0.34
0.330.24
-0.54
0.40
-0.20
0.17
-0.80
-0.30
0.20
0.70
ESOL Non-FARMS All
Other Student Groups
(Monitoring Group)
Non-FARMS
Hispanic/Latino
FARMS All Other
Student Groups
FARMS Black or
African American
FARMS
Hispanic/Latino
Eff
ect
size
Grade 3
Grade 4
Grade 5
Were there differences in fall 2018 mathematics performance between ELO STEP participants and nonparticipants?
Were there differences in fall 2018 reading performance between ELO STEP participants and nonparticipants?

Montgomery County Public Schools Office of Shared Accountability
Program Evaluation Unit i ELO STEP Evaluation
Table of Contents
Executive Summary ................................................................................................................................... iv
Background ................................................................................................................................................. 1
Overview of ELO STEP in MCPS.............................................................................................................. 1
Previous Evaluation of ELO STEP ......................................................................................................... 3
Literature Review........................................................................................................................................ 4
Achievement gap among high achievers ................................................................................................ 4
Efforts across the country ....................................................................................................................... 5
Efforts in MCPS ...................................................................................................................................... 6
Evaluation Scope and Questions ................................................................................................................. 6
Methodology ............................................................................................................................................... 7
Evaluation Design ................................................................................................................................... 7
Sample..................................................................................................................................................... 8
Analytical Procedures ............................................................................................................................. 9
Strengths and Limitations ..................................................................................................................... 11
Results ....................................................................................................................................................... 13
Evaluation Question 1. What were the demographic characteristics of students who participated in
the summer 2018 ELO STEP by gender, race/ethnicity, services received, and focus group status? .. 13
Evaluation Question 2. After controlling for pre-existing differences among students, were there
differences in reading and mathematics performance in the fall of 2018 among students receiving the
ELO STEP program compared to their peers who were invited but did not participate? Did these
differences vary by students receiving ESOL services and student focus groups? .............................. 16
Discussion and Conclusion ....................................................................................................................... 28
Recommendations ................................................................................................................................. 30
Acknowledgements ................................................................................................................................... 31
References ................................................................................................................................................. 32
Appendix A ............................................................................................................................................... 36
Appendix B ............................................................................................................................................... 37
Appendix C ............................................................................................................................................... 38
Appendix D ............................................................................................................................................... 39
Appendix E ............................................................................................................................................... 40

Montgomery County Public Schools Office of Shared Accountability
Program Evaluation Unit ii ELO STEP Evaluation
List of Tables
Table 1. Characteristics of 2018 ELO STEP Participants and Nonparticipants ......................................... 9
Table 2. Characteristics of 2018 ELO STEP Participants by Grade (Gender, Race/Ethnicity, Services
Received, and Focus Group) ............................................................................................................. 14
Table 3. Adjusted Means of Grade 5 MAP-M RIT Scores for ELO STEP Participants and their Peers 18
Table 4. Adjusted Means of Grade 5 MAP-R RIT Scores for ELO STEP Participants and their Peers 19
Table 5. Adjusted Means of Grade 4 MAP-M RIT Scores for ELO STEP Participants and their Peers 20
Table 6. Adjusted Means of Grade 4 MAP-R RIT Scores for ELO STEP Participants and their Peers .. 20
Table 7. Adjusted Means of Grade 3 MAP-M RIT Scores for ELO STEP Participants and their Peers . 21
Table 8. Adjusted Means of Grade 3 MAP-R RIT Scores for ELO STEP Participants and their Peers .. 22
Table 9. Statistical Significance and Effect Sizes for ELO STEP Participants vs. Comparison Students in
Math .................................................................................................................................................. 27
Table 10. Statistical Significance and Effect Sizes for ELO STEP Participants vs. Comparison Students
in Reading ......................................................................................................................................... 28
Table B1. Schedules of 2018 ELO STEP and Enrichment Activities ...................................................... 37
Table C1. FY 2018 Budget for ELO STEP .............................................................................................. 38
Table D1. 2018 ELO STEP Program Sites and Bell times ....................................................................... 40
Table E1. Mean and Standard Deviation of Spring 2018 MAP-P/M (Math) in Grade 2 for ELO STEP
Participants and their Comparison Group ......................................................................................... 40
Table E2. Mean and Standard Deviation of Spring 2018 MAP-P/M (Math) in Grade 3 for ELO STEP
Participants and their Comparison Group ......................................................................................... 40
Table E3. Mean and Standard Deviation of Spring 2018 MAP-P/M (Math) in Grade 4 for ELO STEP
Participants and their Comparison Group ......................................................................................... 41
Table E4. Percentage of Students Meeting the Spring 2018 AP-PR Benchmark in Grade 2 for ELO
STEP Participants and their Comparison Group .............................................................................. 41
Table E5. Mean and Standard Deviation of Spring 2018 MAP-R (Reading) in Grade 3 for ELO STEP
Participants and their Comparison Group ......................................................................................... 42
Table E6. Mean and Standard Deviation of Spring 2018 MAP-R (Reading) in Grade 4 for ELO STEP
Participants and their Comparison Group ......................................................................................... 42

Montgomery County Public Schools Office of Shared Accountability
Program Evaluation Unit iii ELO STEP Evaluation
List of Figures
Figure 1. Evaluation Design of the ELO STEP Program ........................................................................... 7
Figure 2. Gender distribution of ELO STEP participants by grade. ........................................................ 14
Figure 3. Race/Ethnicity distribution of ELO STEP participants by grade. ............................................ 14
Figure 4. Distribution of Services Received by ELO STEP participants during the school year 2017–
2018 by grade. ................................................................................................................................... 15
Figure 5. Distribution of ELO STEP participants in focus and monitoring group by grade. ................... 15
Figure 6. Distribution of ELO STEP participants in each of the focus groups by grade. ........................ 16
Figure 7. Effect size of fall MAP-M scores for all ELO STEP participants. ........................................... 23
Figure 8. Effect size of fall MAP-M scores for all ELO STEP participants receiving ESOL services. .. 23
Figure 9. Effect size of fall MAP-M scores for ELO STEP participants by focus group. ....................... 24
Figure 10. Effect size of fall MAP-R scores for all ELO STEP participants. .......................................... 24
Figure 11. Effect size of fall MAP-R scores for all ELO STEP participants receiving ESOL services. . 25
Figure 12. Effect size of fall MAP-R scores for ELO STEP participants by focus group. ...................... 26

Montgomery County Public Schools Office of Shared Accountability
Program Evaluation Unit iv ELO STEP Evaluation
Executive Summary
In response to a nationwide opportunity gap for many students who are qualified but underrepresented in
intervention programs offering challenging academic content, Montgomery County Public Schools
(MCPS) offer the Extended Learning Opportunities—Summer Title I Enrichment Program (ELO STEP).
The program is designed to provide high achievers from low-income families easy access to advanced
programming in Curriculum 2.0, and center programs that are especially focused on mathematics and
science. At the request of the Chief Academic Officer, the Office of Shared Accountability (OSA)
conducted an evaluation of ELO STEP in MCPS during the summer of 2018. This report presents the
mathematics and reading outcomes associated with the program for those students who were served by
ELO STEP.
Overview
In the summer of 2018, ELO STEP was offered to 22 Title I elementary school students in 14 sites with
an average class size of 14 students. A total of 1,824 students entering Grades 3, 4, and 5 were invited to
the program, and 785 of them (43%) attended at least one day of instruction. The program benefited
participants by providing free breakfast, lunch, transportation, and rigorous learning opportunities five
days a week for 25 days, from July 9 to August 10, 2018.
Evaluation Design and Methodology
Nowadays, the school district accountability efforts have been challenged to develop procedures that
determine the outcomes of their intervention programs on student achievement within the typical
implementation setting (lack of randomization in selection and assignment of students to an intervention
program). The critical issue in outcome evaluations is to determine whether or not a program produces
levels of effects above what would have occurred without the program (Rossi & Freeman, 1993). Using
a non-equivalent comparison group design, a frequently used type of quasi-experimental design, this
outcome evaluation examined the program’s effectiveness by comparing the academic performance of
ELO STEP students in mathematics and reading to their peers who were invited to participate but did not.
The use of a comparison group for interpreting findings in this evaluation increases our confidence that
observed students’ outcomes are the result of participation in ELO STEP instead of a function of these
students’ initial abilities.
Outcome measures for addressing the program’s effectiveness included the Measures of Academic
Progress in Reading (MAP-R) and Mathematics (MAP-M). Analyses were done by grade, content area,
and disaggregated by students’ English for Speakers of Other Languages (ESOL) status as well as
students’ focus groups. Appropriate analytical procedures, including advanced statistical analyses, were
conducted based on the nature of the evaluation questions and the characteristics of the data. The General
Linear Model (GLM) parameterization procedure, the general analysis procedures, was used to test the
significant differences between adjusted means. Statistical analyses were supplemented with the
computation of effect sizes to infer conclusions, meaningful for educational settings. A summary of
findings for each of the evaluations questions is listed below.

Montgomery County Public Schools Office of Shared Accountability
Program Evaluation Unit v ELO STEP Evaluation
Findings
Evaluation Question 1. What were the demographic characteristics of students who participated in
the summer 2018 ELO STEP by gender, race/ethnicity, services received, and focus group status?
According to the program records, 730 students participated in the ELO STEP program, attending at least
19 days of instruction (out of 25 days). There were also slightly more male than female participants (52%
vs. 48%), around 50% of attendees were Hispanic/Latino, and 30% were Black or African American.
Regarding services received in 2017–2018, about 67% of the participants received Free and Reduced-price
Meals System (FARMS) services, and 23% of them received ESOL instruction.
The disaggregation of data by focus groups revealed that approximately 41% of participants were
Hispanic/Latino receiving FARMS services, followed by Black or African American receiving FARMS
services (19%), Non-FARMS All Other Student Groups (12%), and Non-FARMS Black or African
American (12%). The rest of the focus groups’ percentages were less than 10%. When the data were
analyzed across grades, similar distributions by gender, race/ethnicity, service receipt measures, and focus
group were found.
Evaluation Question 2. After controlling for pre-existing differences among students, were there
differences in reading and mathematics performance in the fall of 2018 among students receiving the
ELO STEP program compared to their peers who were invited but did not participate? Did these
differences vary by students receiving ESOL services and student focus groups?
The benefits of the ELO STEP program varied by content area and by student characteristics, with a more
positive effect on mathematics than reading. It should be noted that even though ELO STEP did not focus
on developing students’ reading skills, the program’s daily schedule included some literacy activities
related to informational texts.
Mathematics. The mathematics outcomes of the ELO STEP participants, as compared with the
nonparticipants, were both statistically (p < 0.01) and practically (ES = 0.17) significant for those entering
Grade 5, as measured by fall MAP-M.
Comparative analyses, for mathematics, found that participants who received ESOL services performed
better in mathematics across all grade levels than those who did not. The effect size analyses revealed
practically significant differences for all grades (ES = 0.16 for Grade 3, ES = 0.30 for Grade 4, and ES =
0.15 for Grade 5).
When the data were disaggregated by student focus groups, statistically or practically significant results
associated with participation in ELO STEP varied across grade levels (Figure A1). Focus groups with the
largest effect sizes (and also significant at 0.05 level) included fourth graders in the Monitoring Group (ES
= 0.38), Non-FARMS Black or African American in Grade 4 (ES = 0.44), FARMS Black or African
American in Grade 5 (ES = 0.54), and FARMS Hispanic/Latino in Grade 5 (ES = 0.25). Other focus groups
with positive and practically significant differences in the comparative analyses are shown in bold (Figure
A1 below).
On the other hand, parallel effect size analyses revealed that fourth graders in two comparison groups
outperformed their ELO STEP counterparts: (a) FARMS All Other Student Groups (ES = -0.19); and (b)
FARMS Black or African American (ES = -0.17).

Montgomery County Public Schools Office of Shared Accountability
Program Evaluation Unit vi ELO STEP Evaluation
Reading. Overall, the advanced analyses did not provide sufficient evidence to associate the program with
a positive reading performance of ELO STEP participants for all students across grades, except for ESOL
students.
Disaggregation of performance data by ESOL status revealed that the program positively affected the
reading outcomes for all participants in Grade 3 (ES = 0.22) and Grade 5 (ES = 0.40). These findings
indicate that the impact of ELO STEP on reading performance of ESOL students is practically significant
and meaningful in an educational setting.
The analyses by focus group status (Figure A2), indicate that the program has affected the reading
performance of participants differently. For instance, analyses find a practically significant difference
between participants versus nonparticipants in favor of nonparticipants for FARMS All Other Student
Groups in Grade 4 (ES = -0.54) and Non-FARMS All Other Student Groups in Grade 3 (-0.34). In
contrast, three focus groups across all grade levels benefited from the program, such as FARMS Black or
African American in Grade 3 (ES = 0.33) followed by Non-FARMS Hispanic/Latino in Grade 4 (ES =
0.24) and FARMS Hispanic/Latino in Grade 5 (ES = 0.17).
0.240.30
0.10
0.41
-0.06
0.04
0.38*0.44*
0.34
-0.19 -0.17
0.13
0.010.09
0.24
-0.09
0.54**
0.25**
-0.30
-0.15
0.00
0.15
0.30
0.45
0.60
Non-FARMS All
Other Student
Groups
(Monitoring Group)
Non-FARMS Black
or African
American
Non-FARMS
Hispanic/Latino
FARMS All Other
Student Groups
FARMS Black or
African American
FARMS
Hispanic/Latino
Eff
ect
size
Grade 3 Grade 4 Grade 5
-0.34
0.00 0.000.09
0.33
-0.04-0.04
0.130.24
-0.54
0.07 0.12
-0.20
-0.05 -0.07
0.09 0.060.17
-0.75
-0.55
-0.35
-0.15
0.05
0.25
0.45
Non-FARMS All
Other Student
Groups
(Monitoring Group)
Non-FARMS Black
or African
American
Non-FARMS
Hispanic/Latino
FARMS All Other
Student Groups
FARMS Black or
African American
FARMS
Hispanic/Latino
Eff
ect
size
Grade 3 Grade 4 Grade 5
Figure A1. Effect size of fall 2018 MAP-M scores for ELO STEP participants by focus group.
Note. Bold indicates a practically significant difference. *p < 0.05, and **p < 0.01
Figure A2. Effect size of fall 2018 MAP-R scores for ELO STEP participants by focus group.
Note. Bold indicates a practically significant difference. None of the effect sizes was statistically significant.

Montgomery County Public Schools Office of Shared Accountability
Program Evaluation Unit vii ELO STEP Evaluation
Conclusion
After the Every Student Succeeds Act (ESSA) passed in 2015, states are more encouraged to focus on all
students, not only on struggling or at-risk children but also on students with different skill sets (Wright,
2017). ELO STEP is one example of these initiatives that intended to close the achievement gap between
high achievers from low-income families and their affluent peers. This program, during summer 2018,
provided a structured curriculum in math, science, and information literacy continuously for five weeks
to 785 students from 21 Title I schools, with an average class size of 14 students per section.
The outcome analyses provided some empirical evidence indicating that ELO STEP improved the
academic achievement of above-average students who were impacted by poverty. Comparative analyses
found more evidence of effects in mathematics than in reading, and the curriculum structure and schedule
might be the reasons for this discrepancy. According to 2018 ELO STEP daily schedule, math was taught
for 75 minutes whereas literacy activities (information literacy) were provided for 30 minutes.
In the case of particular student subgroups, results from this evaluation were mixed. This evaluation found
a variety of results, where the direction of the program’s outcome differed based on participants’
characteristics, such as grade level, race/ethnicity, and FARMS status. An overall summary of the positive
and practically significant effects of the program by student focus groups are included below:
Black or African American. Comparative analyses (ELO STEP participants and nonparticipants)
revealed that Black or African American participants in Grades 3 and 4, who did not receive
FARMS services, performed better in mathematics, as well as Black or African American
participants in Grade 5 who received FARMS services. For reading, only Black or African
American in Grade 3 who received FARMS services performed better than their peers in the
comparison group.
Hispanic/Latino. Similar comparative analyses found that Hispanic/Latino participants in Grade
4 who did not receive FARMS services performed better than their peers (nonparticipants) in math.
Better performance was observed for Hispanic/Latino participants in Grade 5 regardless of their
FARMS status using parallel analyses. In reading, the comparison of the two groups of students
(participants and nonparticipants) found that Hispanic/Latino participants in Grade 4 who did not
receive FARMS services performed better than their peers. The same comparison found similar
results for Hispanic/Latino participants in Grade 5 who did receive FARMS services.
FARMS recipients. For mathematics, the comparative analyses indicated that participants who
were not FARMS recipients, regardless of their grade level, tended to perform better in
mathematics than participants who received FARMS services. For reading, no overall conclusion
can be inferred by students’ FARMS status.
ESOL recipients. Comparative analyses, for mathematics, found that participants who received
ESOL services performed better in mathematics across all grades than their nonparticipants peers.
For reading, the same conclusion was observed but only for participants in Grade 3 and 5.
In closing, establishing the criteria of success and failure is very difficult in evaluating the impact of any
intervention programs. Borus (1979) asserts that the list of outcomes is always incomplete since only
those criteria of success, which can be measured, are considered. The effectiveness of ELO STEP in this

Montgomery County Public Schools Office of Shared Accountability
Program Evaluation Unit viii ELO STEP Evaluation
evaluation was assessed only by examining the performance of students in the area of reading and
mathematics through only one measure of students’ achievement (MAP test scores). Other program goals,
such as critical thinking, knowledge of science concepts, or students’ attitudes to complex tasks, cannot
be addressed by the analysis.
Recommendations
Based on the findings of this evaluation, the following recommendations are suggested:
Continue with the use of the instructional mathematics practices for ELO STEP for future positive
effects in mathematics. However, it is important to explore the reasons why the program had a
small negative effect size in Grade 4 participants who received FARMS services but who were not
Hispanic/Latino, even though these results were not statistically significant.
Examine the ELO STEP curriculum and make it more interdisciplinary. Similar to the
recommendation proposed in the first evaluation of ELO STEP (2016), the shorter instructional
time in literacy might be the reason why there was no apparent effect of the program on students’
overall reading performance.
Provide opportunity for and encourage teachers to conduct Action Research (AR) in their
classroom, which will allow them to collect data from their students via multiple measures, identify
patterns, collaborate with their peers, and think about different ways to improve instruction
delivery, student learning, and engagement. Guidelines and example about how to put AR in
practice can be included in the ELO STEP training that takes place before the program starts.
Increase the number of students participating in ELO STEP via outreach activities. Among the
1,824 students invited to the program, only less than the half (43%) chose to participate.
Include in future studies a formative evaluation component that incorporates students, teachers,
and parents’ feedback regarding their experience in the program. Program stakeholders’
experiences can help the administration and program staff identifying what components or
practices in the program are effective or need to be improved. Also, extend this recommendation
to parents of students who were invited but decided not to participate in order to understand the
reasons for their decision.
Replicate the study over time using different student population to see if the observed findings are
stable.
Ask parents or guardians to sign a confirmation form at the time of registration for the ELO STEP
program to commit attendance of their child or children, similar to what is done for the ELO SAIL
program.
Administer a test, before and after the program, assessing all the content areas and skills that the
program intends to enrich (e.g., critical thinking, knowledge of science concepts, students’
attitudes to complex tasks, etc.). Results from these tests can provide indicators, relevant and
specific to the ELO STEP program, which can be used to measure the impact of the intervention.

Montgomery County Public Schools Office of Shared Accountability
Program Evaluation Unit 1 ELO STEP Evaluation
Evaluation of Extended Learning Opportunities—Summer Title I Enrichment
Program (ELO STEP) in 2017–2018
Juan Carlos Davila Valencia, M.S., and Shahpar Modarresi, Ph.D.
Background
In 2015, the divisions of Accelerated and Enriched Instruction (AEI), Consortia Choice and Application
Program Services (DCCAPS), and Title I and Early Childhood Programs and Services (DTECPS) of the
Montgomery County Public Schools (MCPS) designed and implemented the Extended Learning
Opportunities—Summer Title I Enrichment Program (ELO STEP). The goal of this program is to provide
the traditionally underrepresented students with access to advanced programming in Curriculum 2.0, and
center programs.
Nationwide, summer learning programs have emerged as a promising way to address the opportunity gap
between underprivileged and privileged students since low-income parents may not afford any
investments in their children’s academic experiences (Kaushal et. al., 2011). Currently, many school
districts offer mandatory summer programs to students at risk of grade retention, but fewer districts offer
summer learning programs to a broader population of students as a means in boosting academic
performance (Augustine et. al, 2013). In the past several years, the number of summer intervention
programs across MCPS has grown, but more needs to be learned about their effects on student
achievement. At the request of the Chief Academic Officer, the Office of Shared Accountability (OSA)
conducted an evaluation of ELO STEP (a summer program) in MCPS. The ultimate goal of any program
is to be effective and to produce quality outcomes. The critical issue in outcome evaluations is whether
or not a program produces levels of effects above what would have occurred without the program (Rossi
& Freeman, 1993). Using a non-equivalent control group design, this evaluation estimated the immediate
outcome of the program on student academic performance in mathematics and reading. The findings
present the effects associated with the summer 2018 implementation of the ELO STEP program at MCPS.
Overview of ELO STEP in MCPS
In response to nation-wide opportunity gaps and in order to decrease excellence gaps within MCPS, the
ELO STEP program in Title I schools was designed to offer accelerated and enriched instructional
opportunities to students impacted by poverty who may not have access to enriching summer programs
otherwise. The broad objectives of the ELO STEP program include: (a) offer advanced pathways for
students; (b) engage students in complex texts and tasks aligned to Common Core; (c) nurture critical
thinking skills; (d) stimulate students through a rigorous environment; (e) allow students to take risks in
academic situations; and (f) expose students to specialized instructional materials that are recommended
by the National Association for Gifted Children (Montgomery County Public Schools, 2018).
The program was first offered in July 2015 to incoming third-grade students who were enrolled in a Title
I school and met specific selection criteria. The targeted students for the program were above average
students attending Title I schools. By the summer of 2018, the ELO STEP was extended to rising Grades
3, 4, and 5 students who were enrolled in a Title I school and met specific selection criteria. The goal was

Montgomery County Public Schools Office of Shared Accountability
Program Evaluation Unit 2 ELO STEP Evaluation
to nurture critical and creative thinking skills through engaging, hands-on, rigorous instruction, using the
infrastructure from an existing MCPS summer program, the Extended Learning Opportunities Summer
Adventures in Learning (ELO SAIL) program. The 2018 ELO STEP program was offered during July 9
– August 10, 2018 (25 days of instruction) at 14 sites, and provided free breakfast, lunch, and
transportation to and from school (Lang, 2018).
Student eligibility and selection. Students in Grades 3, 4, and 5 from Title I schools who met the following
criteria during 2017–2018 were invited to participate in the 2018 ELO STEP.
1. Met one of the InView subtests at or above the 50th percentile: (a) Analogies; (b) Quantitative; (c)
Sequencing;
2. Were on or above the target Instructional Reading Level at the end of Marking Period 2;
3. Participated in Grade 2 mathematics enrichment as indicated on the Marking Period 2 report card;
4. Earned a score at or above the 50th percentile for the Grade 2 fall Measures of Academic Progress
– Primary Grades (MAP-P) for mathematics (applied to Grade 2 students only);
5. Earned a score at or above the 50th national percentile on fall or winter Measures of Academic
Progress –Reading (MAP-R) (applied to Grade 3 and 4 students only);
6. Earned a score at or above the 50th national percentile on fall or winter Measures of Academic
Progress –Mathematics (MAP-M) (applied to Grade 3 and 4 students only).
In addition, schools were asked to consider students who met the following criteria: (1) received Free and
Reduced-price Meals System (FARMS) services; (2) received schools advocacy (in cases where a student
did not meet the criteria stated above, principals and/or school staff members could have advocated for
students by completing a School Advocacy Form) (Appendix A); and (3) received instruction in Jacob’s
Ladder and/or William and Mary Curricula during 2017–2018.
Staff and training. AEI hired ELO STEP professional staff from among teachers in MCPS. Teachers
who were interested in ELO STEP teaching opportunities were asked to apply through the online MCPS
Careers System during April 3–7, 2018. AEI collaborated with the Elementary Integrated Curriculum
(EIC) team to avoid scheduling conflicts between the required summer training and the ELO STEP
summer work schedules. Also, one 2.5 hour training session was provided to Grade 3, 4, and 5 teachers
before the program started.
Curriculum and Class Activities. The overall academic outcome of ELO STEP was to engage students
in a deeper study of concepts and topics based on their assigned grade level. AEI developed the structure
of the ELO STEP curriculum, whereas DTECPS developed the extended part (offered to some participants
only). ELO STEP was provided in all 14 sites from 9:00 a.m. to 1:00 p.m. and offered instruction in math
and science. Even though ELO STEP did not focus on developing reading skills, this program included
some literacy activities related to informational texts. The extended part or enrichment activities during
the afternoon were provided only in nine sites to some participants from 1:00 p.m. to 3:30 p.m. and
instruction included digital literacy and coding based on existing curricula from Code.org and
Commonsense.org. Schedules of the ELO STEP program and the extended part can be found in
Appendix B.
Program Operations and Cost. As mentioned before, the 2018 ELO STEP was designed and
implemented by three offices (AEI, DCCAPS, and DTECPS), and participants received free breakfast,
lunch, and transportation to and from school. According to DTECPS, the cost of the program was

Montgomery County Public Schools Office of Shared Accountability
Program Evaluation Unit 3 ELO STEP Evaluation
$505,621 including teachers and paraeducators’ salaries, meetings, staff benefits, and instructional
materials, but excluding transportation and meal costs (Appendix C). Also, in case substitute teachers
were needed due to illness or another emergency, a list of experienced teachers was provided to each ELO
STEP site. However, if teachers from the list were not available, schools were asked to follow the same
substitute procedures used during the school year.
Participating Students and Schools. In 2018, 1,824 students from 22 Title I Elementary Schools were
invited to participate in ELO STEP across 14 sites. Among them, 785 students (43%) did participate (at
least attended one day or more), and 1,039 (57%) did not. Also, 78 students who were not initially invited
did participate. Program staff reported an average class size of 14 students. The full list of the ELO STEP
sites and their hours of instruction can be found in Appendix D. All school sites were asked to monitor
students’ attendance accurately and contact parents/guardians of students who missed the first three days
of the program to determine their plans.
Previous Evaluation of ELO STEP
The Office of Shared Accountability (OSA) evaluated the first implementation of ELO STEP in the
summer of 2015 (Zhao et al., 2016). The first section of this evaluation was formative and provided
information regarding the experiences of students, teachers, and parents about the components of the
program and how it might be improved. The second section of the evaluation comprised an outcome study
on how effective the program was in terms of improving fall academic performance of ELO STEP students
(in reading and mathematics) compared to their peers who were invited to participate but did not.
The implementation evaluation revealed that almost all of ELO STEP students had positive educational
experiences, indicating that their math and science teachers made those subjects interesting. ELO STEP
teachers also communicated that the program: (a) had a well-designed curriculum; (b) encompassed an
instructional content that supported students’ learning needs; and (c) was successful in helping students
engage in enriched and accelerated academic work. Similar to teachers, parents also provided positive
feedback regarding the program (Zhao et al., 2016).
The outcome evaluation showed empirical evidence that ELO STEP intervention reinforced the academic
achievement of students impacted by poverty. In mathematics, the benefits of the program were observed
in all of the four groups used in the analysis (all students, Black or African American, Hispanic/Latino,
and students receiving FARMS services). In reading, the benefits of the program were only observed in
two of the four groups (Hispanic/Latino and students receiving FARMS services). The largest ELO STEP
effect was observed among Hispanic/Latino students in both reading and mathematics, followed by Black
or African American students but only in mathematics (Zhao et al., 2016).
The 2015 evaluation report (Zhao et al., 2016) concluded that ELO STEP equalized opportunities for low-
income students to access challenging content and significantly improved the mathematics performance
of all students who participated. Moreover, according to the authors, the use of the following practices
likely contributed to the success of the program: (a) the use of multiple measures in selecting the students;
(b) the presence of enriched curriculum for nurturing critical and creative thinking skills through engaging,
hands-on, and rigorous instruction; (c) the presence of teachers’ professional development; (d) the
presence of expanded learning time outside of the normal school day; and (e) the equalized opportunities

Montgomery County Public Schools Office of Shared Accountability
Program Evaluation Unit 4 ELO STEP Evaluation
between more affluent and less affluent families by providing summer learning to students impacted by
poverty.
Literature Review
Achievement gap among high achievers
A large body of research has shown that the achievement gaps are evident between disadvantaged high-
achieving students and their affluent peers. For instance, in their study, Peters et al. (2012) argued that
high-achieving students from low-income families fell out of the high achievement group in elementary
and high school faster compared to their higher-income peers. Similarly, Smarick (2013) remarked that
students in high poverty schools were underrepresented among high achievers and their proportion
declined over time. In their analyses, Plucker et al. (2013) showed that even though there were state and
federal efforts to close these achievement gaps among high-achieving students, these gaps closed slowly
or in many cases grew over the past generation. Moreover, the same authors reported that the highest-
performing American students were disproportionally White and wealthy, and the gap between White and
non-White had widened over the years.
One of the possible reasons why low-income students experienced different summer achievement
trajectories relates to the limited opportunities they have to practice academic skills over the summer.
Some studies have found that low-income students spend more time watching television during the
summer than the students from wealthier backgrounds, and low-income students are also less likely to
have enriching nonacademic experiences, such as sports, compared to their affluent peers (Augustine et
al., 2016). Hence, summer learning initiatives have emerged as an alternative to equalize opportunities
and create access for low-income students to put in practice skills learned during the school year. For
instance, one randomized experimental study examined the short and long-run effects of voluntary
summer programs in five districts and found strong evidence of short term gains in mathematics
(Augustine et al., 2016). Additionally, the same study remarked that students with high attendance in
voluntary summer programs after two consecutive summers outperformed their peers in mathematics and
English Language Arts as well as exhibited stronger social-emotional skills (Augustine et al., 2016).
Similarly, Cooper et al. (2000) in their meta-analysis found that summer programs led to favorable
outcomes on mathematics assessments than on reading assessments.
As documented by the literature, most of the summer programs, even though they are usually mandatory,
have targeted students at risk of grade retention and not high achievers (Augustine et al., 2013). According
to Olszewski-Kubulius et al. (2012), during the No Child Left Behind (NCLB) era, there has been extra
attention on raising the achievement of low performers in detriment of high performers since teacher’s
time and attention have been concentrated on struggling students. Teachers perceived that low-achieving
students received significantly more attention and represented their schools’ top priority (Loveless et al.,
2008). The passing of Every Student Succeeds Act (ESSA) in 2015 addressed this particular issue by
giving the authority to the states over their accountability regimes, and therefore encouraging them to
focus on all pupils (Wright, 2017). States, for example, can give substantial weight to measures of
academic growth for all students from one year to another, or use average scale scores or performance
indexes to measure academic growth beyond proficiency (Wright, 2017).

Montgomery County Public Schools Office of Shared Accountability
Program Evaluation Unit 5 ELO STEP Evaluation
Many studies on achievement gaps have been conducted during the NCLB era, suggesting that the focus
on low achievers compared to high achievers was apparent. Even the results of state-level research
mirrored the trends observed in national studies, revealing that gaps increased over time more for advanced
students than those with low levels of achievement (Zhao et al., 2016). However, recent research is
demonstrating that the focus has switched to an emphasis on all students. For instance, according to the
study conducted by the Thomas B. Fordham Institute of all the state accountability plans (including
Washington, D.C.) as of October 2017, the country is doing better in signaling that every child is
important, regardless of their achievement level (Wright, 2017). Twenty-two states and Washington, D.C.
(45% of all states) ranked “strong” on this objective and 14 states (27%), including Maryland, ranked
“medium.”
Efforts across the country
Many initiatives have been implemented across the country to tackle the issue of the achievement gap.
Olszewski-Kubilius et al. (2012) provided a list of nine successful programs aimed at low-income and
high achievers, run by schools, school districts, and non-school organizations. Also, based on literature
and expert opinions, there are nine components that ensure a quality summer learning program: (1) smaller
class size; (2) differentiated instruction; (3) high-quality instruction; (4) aligned school-year and summer
curricula; (5) engaging and rigorous programming; (6) maximized participation and attendance; (7)
sufficient duration; (8) involved parents; and (9) evaluation of effectiveness (McCombs et al., 2011).
One of the programs highlighted by Olszewski-Kubilius et al. (2012) was Project NEXUS – Linking
Middle Schools to College Success, implemented by the Maryland State Department of Education
(MSDE) from 2005 to 2008. The goal of this program was to expand opportunities for students from low-
income families to gain access to challenging coursework and, therefore, to be prepared for the rigors of
higher education (Olszewski-Kubilius et al., 2012). The following positive outcomes were observed after
the program ended: (a) the number of middle school students taking Pre-AP courses in NEXUS schools
increased by more than 12%; (b) the number of high school students enrolled in AP courses increased by
23%; (c) the number of AP tests taken increased by 21%; and (d) an increase of 5% was observed in test
takers scoring 3-5 on AP exams (Olszewski-Kubilius et at., 2012).
Another pertinent program is the Young Scholars Program, implemented by the Fairfax County Public
Schools (FCPS). This program first identifies and nurtures advanced academic potential in students from
historically underrepresented groups. Then, school administrators, teachers, and advanced academic
resource teachers work together to prepare those identified young learners for more challenging and
rigorous courses (FCPS, 2018). The selection of students includes individuals from a diverse cultural,
ethnic, and linguistic background who are unlikely to be considered for gifted programs (Olszewski-
Kubilius et al., 2012). Positive outcomes were also observed during this program: (a) the number of Black
or African American, and Hispanic/Latino enrolled in the program increased by 21% from 2010 to 2012;
and (b) the number of young scholars identified for secondary advanced academics increased by more
than 200% from 2010 to 2011 (Olszewski-Kubilius et at., 2012).

Montgomery County Public Schools Office of Shared Accountability
Program Evaluation Unit 6 ELO STEP Evaluation
Efforts in MCPS
Besides ELO STEP, which mainly targets low-income high-achieving students, MCPS also offers other
summer programs that target students from low-income families. One of these programs is the Extended
Learning Opportunities Summer Adventures in Learning (ELO SAIL), which provides literacy and
mathematics instruction to Title I students entering kindergarten, Grade 1, or Grade 2 in the fall following
the program. The goal of this program is to prevent summer loss and prepare students for the next grade
level by focusing on reading, writing, and mathematics, as well as arts and sciences in some participating
schools. This program started in 2002 as a 4-week program in 17 Title I schools, and it expanded to a 5-
week program in 21 Title I schools by the summer of 2018. The most recent evaluation conducted by
Cooper-Martin et al. (2016) showed that this program had mixed results with a strong positive academic
outcome on the targeted population in the fall than at the end of the school year. For reading, the authors
reported that positive gains were observed mainly on kindergarteners compared to Grade 1 and Grade 2
students; however, these results differed from earlier evaluations (Cooper-Martin et al., 2016). Also,
positive outcomes in reading were observed in first and second graders who participated in previous ELO
SAIL, but not in the summer of 2015. For mathematics, these positive gains were mainly limited to Grade
1 and Grade 2 students, and these results were also observed in previous evaluations of the program,
except for 2012 (Cooper-Martin et al., 2016). The analyses focused on high-poverty or underrepresented
populations and found positive results on at least some measures for FARMS or ESOL recipients (Cooper-
Martin et al., 2016). The Program Evaluation Unit of the Office of Shared Accountability (OSA) is
currently conducting an evaluation of the outcome of the 2018 summer ELO SAIL, and the findings will
be shared when the study is completed.
Another initiative that MCPS started to implement during the summer of 2018 is the Summer Unleash
Potential (Summer UP) program. The goal of this program is to prevent summer learning loss and enhance
students’ social-emotional skills by providing high-quality instructional and enrichment activities to
students from low-income families. The Summer UP program targeted elementary and middle school
students at 43 focus schools, which are schools that do not meet the level of poverty for a Title I
designation but have a high percentage of students receiving FARMS services. The duration of this
program was five days a week for four weeks, 6.5 hours per day. A little more than 600 students from
Grades 3 to 8 and with academic need were identified as eligible to participate. The Program Evaluation
Unit of OSA is currently conducting an evaluation of this program, and the results will be shared when
available.
Evaluation Scope and Questions
The purpose of this study was to assess the outcome in terms of academic achievement of the students
enrolled in the 2018 ELO STEP program by addressing the following questions:
1. What were the demographic characteristics of students who participated in the summer 2018 ELO
STEP by gender, race/ethnicity, services received, and focus group status?
2. After controlling for pre-existing differences among students, were there differences in reading and
mathematics performance in the fall of 2018 among students receiving the ELO STEP program
compared to their peers who were invited but did not participate? Did these differences vary by
students receiving ESOL services and student focus groups?

Montgomery County Public Schools Office of Shared Accountability
Program Evaluation Unit 7 ELO STEP Evaluation
Methodology
This section includes the evaluation design, measures, data sources, analytical sample, data analysis
procedures, and strengths and limitations associated with this study.
Evaluation Design
In conducting the evaluation of an intervention program, an experimental design with random assignment
is an ideal sampling method to create experimental and control groups. The students in the program would
receive a treatment (e.g., ELO STEP), whereas no specific treatment would be given to those students in
the control group. The procedure of random assignment is a powerful technique for controlling all known
and “unknown” extraneous (or covariate) variables because it makes both groups very similar at the time
of program delivery. Unfortunately, randomized methods are not often feasible in educational settings
due to ethical, practical, and logistical issues (Modarresi et al., 2007). Consequently, this evaluation
employed a non-equivalent comparison group design, a frequently used type of quasi-experimental design,
as recommended by many researchers (Bordens & Abbott, 2008; Fraenkel & Wallen, 2009; Shadish, Cook
& Campbell, 2002). The design (Figure 1 below) compares the outcomes for the group of students who
participated in the program with a comparison group of students who did not participate but were similar
on observable characteristics (Institute of Education Sciences, 2016). The emphasis in this design is to
maximize internal validity of the study by controlling for confounding variables.
Figure 1. Evaluation Design of the ELO STEP Program
Pre-program ELO STEP Post-program
ELO STEP student group O1 => X => O2
Comparison group (Non-STEP) O1 => C => O2
O1 – Spring 2018 test scores for Grades 2, 3, and 4 in mathematics and reading
X – Five weeks of ELO STEP program treatment from July 9 to August 10, 2018
C – Non-STEP (no ELO STEP treatment)
O2 – Fall 2018 test scores for Grades 3, 4, and 5 in mathematics and reading
Pre-program Measures. Pre-program measures for addressing the second evaluation question included
the Measures of Academic Progress – Reading (MAP-R), the Measures of Academic Progress –
Mathematics (MAP-M), the Assessment Program in Primary Reading (MCPS AP-PR), and the Measures
of Academic Progress – Primary Grades (MAP-P). Specifically, Rasch Unit (RIT) scores from the spring
2018 administration of the MAP-R and MAP-M were used as pre-program measures in reading and math
for rising Grade 4 and Grade 5 students. MCPS has been administering the MAP-R in Grades 3–8 since
2004. For the rising Grade 3 students, the pre-program measure was the spring 2018 MCPS AP-PR in
reading and MAP-P in Mathematics since Grade 2 students in MCPS do not take MAP-R or MAP-M.
MAP-R, MAP-M, and MAP-P are computer adaptive achievement tests developed by the Northwest
Education Association (NWEA, 2008 and 2011). MAP-R measures five reading areas, such as word
recognition and vocabulary, reading comprehension–literal, reading comprehension–
inferential/interpretive, reading comprehension-evaluation, and literary response and analysis. MAP-M,
on the other hand, measures algebraic concepts, computation, geometry, measurement, number sense and

Montgomery County Public Schools Office of Shared Accountability
Program Evaluation Unit 8 ELO STEP Evaluation
numeration, statistics, and probability and graphing (NWEA, 2011). RIT scale scores on MAP-R and
MAP-M were used for advanced analyses since the equal-interval property of the RIT scale scores makes
them appropriate for various statistical purposes. For the rising Grade 3 students, the pre-program
measures in mathematics were RIT scores in mathematics from the spring 2018 administration of
MAP-P because Grade 2 students in MCPS do not take MAP-M.
Post-program (Outcome) Measures. RIT scores in MAP-R and MAP-M from fall 2018 for Grades 3, 4,
and 5 were used as outcome measures for reading and mathematics respectively to examine the ELO STEP
program effect on student academic performance.
Student Characteristics Data Sources. The measures for student characteristics included gender,
race/ethnicity, services received, and student focus groups status. The receipt of services referred to the
English for Speakers of Other Languages (ESOL), Free and Reduced-priced Meal Systems (FARMS),
and special education services. These measures were extracted from MCPS data files. Student attendance
at the ELO STEP program was recorded daily by staff at each of the program sites and provided to the
evaluators.
Sample
ELO STEP participants. The participant group comprised all students who met the attendance threshold,
defined as the students who attended the program for 19 or more days (out of 25 days). This evaluation
used the cutoff of 19 days based on an analysis of the distribution of participants and days of attendance.
The attendance threshold decision made by evaluators was supported by the literature that suggests that
the relationship between program attendance and estimated treatment effects for similar programs tend to
be between 15 and 25 days or more of attendance (Augustine et al., 2016). Additionally, this sample of
students did not differ based on the hours of instruction received (morning vs. extended hours). The
analyses only considered one single treatment group with one single level of treatment in order to obtain
a larger sample size and more statistical power. In total, the number of ELO STEP attendees was 730,
including those who were not initially invited but participated. However, for addressing the second
research question, the students who were initially invited to the program (e.g., met certain criteria) and
attended for 19 or more days were included in the analysis (664 students).
Nonparticipants (comparison group). The second sample of students were nonparticipants, defined as
those students who met the selection criteria and were invited to ELO STEP but did not attend any day of
the program. Excluded from the comparison sample (nonparticipant) were students who did not
participate in ELO STEP but attended a different summer program (e.g., Building Educated Leaders for
Life or BELL). The total number of nonparticipants (comparison group) was 1,004 students.
Table 1 below presents the demographic characteristics of both groups. The group of nonparticipants was
approximately similar to the attendees in general, although some differences (greater than five percentage
points) were found for certain student characteristics. For example, the proportion of Black or African
American was slightly higher among the participants compared to the nonparticipants (30% vs. 21.5%),
and the proportion of participants “Non-FARMS All Other Students” (Monitoring Group) was slightly
lower among the participants compared to the nonparticipants (12.3% vs. 20.8%).

Montgomery County Public Schools Office of Shared Accountability
Program Evaluation Unit 9 ELO STEP Evaluation
Table 1. Characteristics of 2018 ELO STEP Participants and Nonparticipants
Participants
(19 or more days of
attendance)
Nonparticipants
N % N %
Total 730 100.0 1,004 100.0
Grade level as of fall 2017
Grade 3 267 36.6 391 38.9
Grade 4 214 29.3 308 30.7
Grade 5 249 34.1 305 30.4
Gender
Female 351 48.1 464 46.2
Male 379 51.9 540 53.8
Race/ethnicity
Asian 90 12.3 99 9.9
Black or African American 222 30.4 216 21.5
Hispanic/Latino 362 49.6 490 48.8
White -- -- 160 15.9
Receipt of services during the school year 2017–2018
ESOL 167 22.9 219 21.8
FARMS 488 66.8 589 58.7
Focus groups
Non-FARMS All Other Student Groups (Monitoring Group) 90 12.3 209 20.8
Non-FARMS Black or African American 86 11.8 89 8.9
Non-FARMS Hispanic/Latino 66 9.0 117 11.7
FARMS All Other Student Groups 56 7.7 89 8.9
FARMS Black or African American 136 18.6 127 12.6
FARMS Hispanic/Latino 296 40.5 373 37.2
Note. Results are not reported (--) for groups with fewer than 10 students. For groups of between 10 and 20
students, only the percentage rate is reported only if the percentage rate is ≤ 95% or ≥ 5%.
Analytical Procedures
Descriptive analyses, tests of significance, and effect size measures were used to assess ELO STEP effects
in this study. Specifically, this study was conducted via the following analytical techniques.
Descriptive statistics. The characteristics of ELO STEP participants were analyzed using descriptive
statistics. Analyses were done at each of the grade levels and within each grade. The data were
disaggregated and described by student characteristics (gender and race/ethnicity), service receipt
measures, and student focus groups or ESOL status. Bivariate analyses, such as chi-square tests, were
used where appropriate and applicable, especially to examine the outcome differences between

Montgomery County Public Schools Office of Shared Accountability
Program Evaluation Unit 10 ELO STEP Evaluation
participants and nonparticipants before the exposure to the program (Appendix E). This analysis revealed
that participants and nonparticipants performed in general at a similar level on all the pre-program
measures (spring 2018), except for math in Grade 3 and reading in Grade 4. A similar overall conclusion
was obtained when the analysis was disaggregated by focus group, with the exception of “Non-FARMS
All Other Student Groups” (or Monitoring Group). As a result, math and reading scores were included in
the statistical models, where appropriate, to control for students’ prior academic achievement.
Advanced statistical models. The goal of the advanced analyses was to compare the achievement of
students in the ELO STEP group to their counterparts in the comparison group to assess the effectiveness
of the program. Empirically, selection bias is an important problem in utilizing quasi-experimental data
to evaluate the impact of any programs (Shadish, Cook & Campbell, 2002). In gauging the efficacy of an
intervention program, the analysis of covariance (ANCOVA) is commonly used as an analytical procedure
on the data collected from quasi-experimental designs to adjust for selection bias. The procedure assesses
the effects of a program while controlling for covariates, particularly a pretest (initial ability measure) that
might confound the effects of a program (Campbell & Stanley, 1963; Judd, Smith, & Kidder, 1991; Kirk,
1995; Institute of Education Sciences, 2016). In this evaluation, ANCOVA was used to test for significant
differences between the two groups of students’ mean RIT scores on MAP tests (outcome measures) after
adjusting for covariates and control variables to increase the statistical power. This procedure improves
precision by removing some of the variability in the outcome measures that were not due to the program’s
effects. A description of step-by-step analytical procedures is presented below.
To balance the nonequivalent groups (ELO STEP and comparison groups), propensity scores based on
gender, race/ethnicity, FARMS status, and participation in the English for Speakers of Other Languages
(ESOL) and special education programs were computed by using logistic regression models as suggested
by the literature (Luellen, Shadish, & Clark, 2005). Propensity scores represent “selection bias” or the
likelihood that a student with certain pre-existing characteristics would be enrolled either in the ELO
STEP program or included in the comparison groups. The propensity scores were then divided into five
categories (quintiles) and incorporated as categorical covariates in the statistical models to control for
selection bias (Rosenbaum & Rubin, 1982, 1983, 1984, 1985; Austin, 2011).
In addition to utilizing propensity scores, a measure of initial abilities of students (spring test scores) was
included in each of the statistical models as a covariate, where available and appropriate, to further reduce
the selection bias inherent in the quasi-experimental design. The independent variable in each of the
statistical models was a dummy variable created to represent the status of the students’ experience (1 =
ELO STEP group, and 0 = comparison group). Analyses were done at grade level as well as subject level.
In addition to the propensity scores (quintiles), the covariate (student spring test scores), the dummy
variable representing students’ status (participation or not), and the interaction between them were
included in each of the statistical models. The coefficient of this product was used to test for non-
parallelism or interaction. The General Linear Model (GLM) parameterization procedure, the general
analysis procedures, was used to test the significant differences between adjusted means. The analysis for
each of the outcome measures was conducted separately.
Effect size. The statistical analyses were supplemented with the computation of effect size statistics to
judge whether the observed differences between student groups (ELO STEP vs. comparison) were large
enough to be of practical significance to educators. A small mean difference between the treatment and
comparison group may be statistically significant when a sampling error is small due to a large sample
size. Conversely, a relatively large mean difference may not be statistically significant when a sampling

Montgomery County Public Schools Office of Shared Accountability
Program Evaluation Unit 11 ELO STEP Evaluation
error is large due to a small sample size. Therefore, several researchers (e.g., Kline, 2004; Rossi, Lipsey,
& Freeman, 2004; Carver, 1993; Levin, 1993; Thompson, 1995; American Psychological Association,
2001) suggest that it would be prudent to report the results of statistical significance tests as well as
estimates of the practical significance (e.g., the effect size).
One of the most common effect size measures is the standardized mean difference, Cohen’s d, by which
an effect size (ES) of 0.20 is considered small, an ES of at least 0.50 is considered medium, and an ES of
0.80 or greater is considered large (Cohen, 1988). However, a study examining evaluations of 346
education programs for at-risk children reported that the average effect size, adjusted for characteristics,
was d = 0.12 (Borman et al., 2002). In addition, Lipsey and Wilson (1993) in their meta-analyses of
school improvement programs concluded that educational treatment effects of d = 0.10 to d = 0.20 should
not be interpreted as trivial. In a more recent article, Lipsey et al., (2012) noted that “Cohen’s broad
categories of small, medium and large are clearly not tailored to the effects of intervention studies in
education.” The authors argued that another basis for assessing the practical significance of a program
effect would be to compare it with the effects found for similar programs with similar study samples and
outcome measures. In their review of studies of intervention programs, Lipsey et al. (2012) concluded
that the mean of 227 reported effect sizes of interventions that focus on curriculum or broad instructional
programs across intervention programs studies is 0.13, and the median ES is 0.08. Therefore, in this
evaluation, an ES of 0.15 was considered an appropriate level for the threshold for a small practically
significant effect, d = 0.50 the threshold for a medium effect, and d = 0.80 the threshold for a large effect.
Effect Size Formula. In their article, Lipsey et al. (2012) indicated that adjusted mean values better
estimate the program’s effect by reducing any bias from the baseline differences and thus are the best
choices for use in a representation of that effect. The authors continued by stating:
When that representation involves the standard deviations, however, their values should not be
adjusted for the influence of the covariates. In virtually all such instances, the standard deviations are
used as estimates of the corresponding population standard deviations on the outcome variables
without consideration for the particular covariates that may have been used in estimating the difference
on the means (Lipsey et al., 2012).
Consequently, this study used the following formula to calculate the effect sizes: 𝐸𝑆 = (𝑀𝑡 −𝑀𝑐)/𝑆𝐷.
The 𝑀𝑡 and 𝑀𝑐 are the adjusted group means for the ELO STEP group (treatment) and the comparison
group respectively, and 𝑆𝐷 is the standard deviation of the pooled outcome scores (Borman, et al., 2002;
Thompson, 2002; Lipsey et al., 2012). The ES index is scale invariant or metric-free and can be used to
interpret the patterns of outcome measures’ differences between groups of students and across different
measures (Bloom et al., 2008; Lipsey et al, 2012). The Cohen’s d index has been shown to be upwardly
biased when the sample size is small (Institute of Education Sciences, 2016); therefore, caution should be
exercised in the interpretation of effect sizes when study samples are small.
Strengths and Limitations
Strengths. The findings presented in this report are based on a sound evaluation design and appropriate
analyses. The current evaluation used a non-equivalent comparison group design to investigate the
impacts of ELO STEP on the students’ academic achievement. It is important to note that isolating and
showing the effects of any program on students’ achievement is not an easy task in educational settings.

Montgomery County Public Schools Office of Shared Accountability
Program Evaluation Unit 12 ELO STEP Evaluation
The authors employed two control techniques for improving the internal validity of the findings and for
estimating a less biased effect of the ELO STEP program.
Control by study design. The key component of the quasi-experimental design is the use of
appropriate comparison groups when evaluating a program’s outcomes. In this evaluation, those
students who met the ELO STEP selection criteria in terms of achievement measures but did not
attend the program were used to be included in the comparison groups in all grades studied in this
report. The use of a comparison group for interpreting findings increases our confidence that
observed students’ outcomes are the result of participation in the program instead of a function of
students’ initial abilities.
Control by statistical techniques. A major problem with employing the quasi-experimental design
in educational settings is that the two groups of students may have important pre-existing
differences that may influence their achievement after exposure to an intervention, and this will
consequently threaten the internal validity of the findings (Gay & Airasian, 2000). Prominent
researchers (Campbell & Stanley, 1963; Judd, Smith, & Kidder, 1991) argued that in order to
observe the true effects of treatment in quasi-experimental designs, ANCOVA should be
conducted to control for confounding variables. Therefore, ANCOVA procedures were utilized
in this study to evaluate the outcomes of the ELO STEP program.
Limitations. As mentioned previously, this evaluation relied on a quasi-experimental design to address
the effectiveness of ELO STEP. However, many researchers argue that only an experimental design can
control each of the sources of internal validity (e.g., selection bias, maturation, history, attrition) in a study
(Campbell & Stanley1963; Babbie, 1992; Judd, Smith, & Kidder, 1991; Hedrick et al., 1993).
Consequently, causal conclusions about the impact of ELO STEP program on the reading and mathematics
achievement of students may not be inferred from the analyses presented in this report.
Also, some practical and logistical issues occurred during or after the implementation of ELO STEP. For
instance, the sample size of participants was reduced when some students in the treatment group
transferred to another school system for the 2018–2019 school year, and when some students had to be
excluded from the analysis due to lack of complete test scores data in math or reading, either before or
after the program. Moreover, this evaluation measured the effectiveness of ELO STEP by using students’
scores in MAP-M and MAP-R from spring and fall 2018. However, the gap in time between the end of
the summer program and the post-program test administration during the school year could have allowed
other factors, different from the program, to influence students’ performance. In the case of fall 2018
assessments, the window to administer MAP-R or MAP-M was almost two months (from September 11
to November 2, 2018). Participants who took these tests at the end of the assessment period rather than
at the beginning were more likely to be exposed to other factors, such as more instruction days, not
necessarily attributed to the program. Additionally, the effectiveness of this program was mainly assessed
by the academic performance of students in both reading and mathematics. Other program effects (e.g.,
having better critical skills, engagement, etc.) were not addressed by this study.
In closing, it is important to note that only one measure of students’ mathematics or reading achievement
(MAP test scores) was used to examine the effectiveness of ELO STEP. The overall results may change
if multiple measures were used in the outcome analyses.

Montgomery County Public Schools Office of Shared Accountability
Program Evaluation Unit 13 ELO STEP Evaluation
Results
Results are shown in the order of the evaluation questions.
Evaluation Question 1. What were the demographic characteristics of students who participated in
the summer 2018 ELO STEP by gender, race/ethnicity, services received, and focus group status?
Table 2 shows the characteristics of participants who attended at least 19 of the 25 days of instruction.
According to ELO STEP records, 730 students attended the program. There were slightly more male than
female participants (52% vs. 48%), and around 50% of attendees were Hispanic/Latino, and 30% were
Black or African American. Regarding services received in 2017–2018, about 67% of the participants
received FARMS services, and 23% of them received ESOL instruction.
Table 2. Characteristics of 2018 ELO STEP Participants by Grade (Gender, Race/Ethnicity, Services
Received, and Focus Group)
Total Grade 3 Grade 4 Grade 5
N % N % N % N %
Total 730 100.0 267 100.0 214 100.0 249 100.0
Gender
Female 351 48.1 122 45.7 104 48.6 125 50.2
Male 379 51.9 145 54.3 110 51.4 124 49.8
Race/ethnicity
Asian 90 12.3 26 9.7 25 11.7 39 15.7
Black or African American 222 30.4 82 30.7 69 32.2 71 28.5
Hispanic/Latino 362 49.6 135 50.6 111 51.9 116 46.6
White -- ≤ 5.0 -- 5.6 -- -- -- 6.4
Receipt of services in 2017–2018
ESOL 167 22.9 84 31.5 48 22.4 35 14.1
FARMS 488 66.8 183 68.5 141 65.9 164 65.9
Special education -- ≤ 5.0 -- 7.1 -- -- -- --
Focus groups
Non-FARMS All Other Student Groups
(Monitoring Group) 90 12.3 33 12.4 25 11.7 32 12.9
Non-FARMS Black or African American 86 11.8 28 10.5 28 13.1 30 12.0
Non-FARMS Hispanic/Latino 66 9.0 23 8.6 -- 9.3 23 9.2
FARMS All Other Student Groups 56 7.7 -- 6.4 -- -- 30 12.0
FARMS Black or African American 136 18.6 54 20.2 41 19.2 41 16.5
FARMS Hispanic/Latino 296 40.5 112 41.9 91 42.5 93 37.3
Note. Results are not reported (--) for groups with fewer than 10 students. For groups of between 10 and 20 students,
only the percentage rate is reported.
Table 2 above also shows participants’ characteristics disaggregated by grade. In general, almost similar
distributions were observed across grades, especially the distribution of Hispanic/Latino and Black or

Montgomery County Public Schools Office of Shared Accountability
Program Evaluation Unit 14 ELO STEP Evaluation
African American participants, as well as the distribution of participants receiving FARMS services. Also,
the distribution of participants in each of the focus groups did not differ much across grades.
By Gender. Figure 2 shows the distribution of ELO STEP participants by gender and grade. Among third
graders, there was a slightly higher participation in ELO STEP of male students compared to female.
However, this difference decreased for higher grades; the gender distribution of participants in Grade 5
was almost the same.
By Race/Ethnicity. Figure 3 displays the distribution of ELO STEP participants by race/ethnicity and
grade. Across all grades, there was a high participation of Hispanic/Latino students, followed by Black
or African American. The percentages of Hispanic/Latino and Black or African American participants
were almost similar across all grades, and participation of students with “Other” race was slightly higher
in Grade 5 compared to Grades 3 and 4.
45.754.348.6 51.450.2 49.8
0
20
40
60
80
100
Female Male
Per
centa
ge
of
Par
tici
pan
ts
Grade 3 Grade 4 Grade 5
5.6
30.7
50.6
13.1
--
32.2
51.9
14.56.4
28.5
46.6
18.5
0
20
40
60
80
100
White Black or African
American
Hispanic/Latino OtherPer
centa
ge
of
Par
tici
pan
ts
Grade 3 Grade 4 Grade 5
Figure 2. Gender distribution of ELO STEP participants by grade.
Figure 3. Race/Ethnicity distribution of ELO STEP participants by grade.
Note. “Other” includes American Indian or Alaskan Native, Asian, and with two or more races. Results are not
reported (--) for groups with fewer than 10 students.

Montgomery County Public Schools Office of Shared Accountability
Program Evaluation Unit 15 ELO STEP Evaluation
By Services Received. Figure 4 shows the distribution of the services received by ELO STEP participants
during the 2017–2018 school year by grade. The percentage of participants receiving FARMS services
was almost similar across all grades; however, the percentage of participants receiving ESOL instruction
and special education was especially higher in Grade 3 in comparison to the other grades.
By Focus Groups. On average, 12% of ELO STEP attendees in each of the grades were neither Black or
African American nor Hispanic/Latino and not receiving FARMS services (also defined as “Monitoring
Group”), whereas the rest of participants (on average 88%) were categorized as other focus groups (Figure
5).
Figure 6 shows the distribution of ELO STEP participants by each focus group, excluding the Monitoring
Group. The percentage of participants in each of the focus groups was almost similar across grades, with
a maximum variation that did not exceed more than five percentage points. The only focus group with a
31.5
68.5
7.1
22.4
65.9
--
14.1
65.9
--0
20
40
60
80
100
ESOL FARMS Special Education
Per
centa
ge
of
Par
tici
pan
ts
Grade 3 Grade 4 Grade 5
87.6
12.4
88.3
11.7
87.1
12.9
0
20
40
60
80
100
Other Focus Groups Monitoring Group
Per
centa
ge
of
Par
tici
pan
ts
Grade 3 Grade 4 Grade 5
Figure 4. Distribution of Services Received by ELO STEP participants during
the school year 2017–2018 by grade.
Note. Results are not reported (--) for groups with fewer than 10 students.
Figure 5. Distribution of ELO STEP participants in focus and monitoring
group by grade.

Montgomery County Public Schools Office of Shared Accountability
Program Evaluation Unit 16 ELO STEP Evaluation
higher variation by grade was observed among “FARMS All Other Student Groups” (6.4% of third graders
versus 12% of fifth graders).
Evaluation Question 2. After controlling for pre-existing differences among students, were there
differences in reading and mathematics performance in the fall of 2018 among students receiving
the ELO STEP program compared to their peers who were invited but did not participate? Did
these differences vary by students receiving ESOL services and student focus groups?
As mentioned in the Methodology section, the program’s outcome was examined by comparing the
MAP-R and MAP-M scores from fall 2018 between ELO STEP participants and their comparison group.
Analyses were conducted separately by grade, for all students and by focus group, and effect sizes (ES)
were calculated to show if the program effect was practically significant.
Grade 5
Mathematics. Table 3 presents the adjusted means on fall MAP-M for the ELO STEP and comparison
groups. After adjusting for the effects of student characteristics and pre-test scores, the calculated adjusted
mean difference (1.64) for all Grade 5 students between the two groups (attendees and non-attendees) was
statistically (p < 0.01) and practically (ES = 0.17) significant in favor of the ELO STEP group.
In the case of participants receiving English for Speakers of Other Languages (ESOL) services, also a
positive and practical (ES = 0.15) significant difference was found, suggesting that participants in ELO
STEP who received ESOL services in the 2017–2018 school year performed better on fall MAP-M than
their nonparticipant peers (Table 3).
Disaggregation of the data by focus group showed that differences between participants and
nonparticipants were statistically (p < 0.01) and practically (|ES| ≥ 0.15) significant for only two of the six
comparisons made (Black or African American, and Hispanic/Latino students receiving FARMS services)
10.5 8.66.4
20.2
41.9
13.19.3
--
19.2
42.5
12.09.2
12.016.5
37.3
0
10
20
30
40
50
Non-FARMS Black or
African American
Non-FARMS
Hispanic/Latino
FARMS All Other
Student Groups
FARMS Black or
African American
FARMS
Hispanic/Latino
Per
cenat
ge
of
Par
tici
pan
ts
Grade 3 Grade 4 Grade 5
Figure 6. Distribution of ELO STEP participants in each of the focus groups by grade.
Note. Results are not reported (--) for groups with fewer than 10 students.

Montgomery County Public Schools Office of Shared Accountability
Program Evaluation Unit 17 ELO STEP Evaluation
in favor of the ELO STEP group. For these two focus groups, participants significantly outperformed
their nonparticipant peers on fall MAP-M. In the case of Hispanic/Latino participants who did not receive
FARMS services, the adjusted mean difference (2.43) was practically (ES = 0.24) but not statistically (p
> 0.05) significant, suggesting that the magnitude of difference was meaningful in educational settings.
For the rest of focus groups and the Monitoring Group, the analyses revealed neither a statistical nor a
practical significance between the participants and nonparticipants.
Table 3. Adjusted Means of Grade 5 MAP-M RIT Scores for ELO STEP Participants and their Peers
Means of MAP-M RIT Scores in Fall 2018 ELO STEP Program Effect
ELO STEP Participants Nonparticipants ELO STEP vs. non-ELO
STEP
N
Original
Mean
(SD)
Adjusted
Mean N
Original
Mean
(SD)
Adjusted
Mean
Adjusted
Mean
Difference
St.
Error
Effect
Size
(ES)
All Grade 5 Students 199 225.31
(8.71) 225.77 282
224.62
(10.35) 224.13 1.64** 0.51 0.17
English for Speakers
of Other Languages
(ESOL) participants
19 221.58
(6.65) 222.29 40
221.55
(6.93) 221.29 1.01 1.31 0.15
Non-FARMS
All Other Student
Groups
(Monitoring Group)
31 230.00
(8.39) 230.81 61
231.31
(10.17) 230.74 0.07 1.31 0.01
Non-FARMS Black
or African American 28
222.46
(8.64) 224.10 29
224.90
(10.86) 223.20 0.90 1.62 0.09
Non-FARMS
Hispanic/Latino 21
222.00
(9.30) 224.04 36
222.86
(10.52) 221.61 2.43 1.62 0.24
FARMS All Other
Student Groups 23
227.26
(10.17) 225.37 34
224.97
(9.32) 226.20 -0.83 1.49 -0.09
FARMS Black or
African American 32
224.97
(8.46) 223.50 28
217.64
(7.05) 218.86 4.64** 1.31 0.54
FARMS
Hispanic/Latino 64
224.84
(7.37) 224.89 94
222.76
(9.24) 222.72 2.17** 0.77 0.25
SD = Standard Deviation. *p < 0.05 and **p < 0.01
Bold indicates a practical significant difference (|ES| ≥ 0.15)
Reading. Table 4 shows that for all Grade 5 students, the adjusted mean difference (-0.08) was neither
statistically (p > 0.05) nor practically (ES = -0.01) significant. The findings suggest that, after adjusting
for the effects of student characteristics and pre-test scores, ELO STEP students as a group performed
similarly to their peers in the comparison group as measured by fall 2018 MAP-R.
Table 4 also shows the results for participants receiving ESOL services, who reported a positive and
practical (ES = 0.40) significant difference.

Montgomery County Public Schools Office of Shared Accountability
Program Evaluation Unit 18 ELO STEP Evaluation
The analysis by focus group did not find any statistically (p > 0.05) significant difference between ELO
STEP participants and nonparticipants in each of the comparisons made as measured by fall 2018 MAP-
R. However, the effect size analyses showed that the comparisons between the two groups (Monitoring
Group vs. Comparison group) and one of the five focus groups (FARMS Hispanic/Latino vs. Comparison)
showed practical significance. The Monitoring Group presented a negative adjusted mean difference
(-2.16), which was practically significant (ES = -0.20), suggesting that nonparticipants as a group
performed better than their participant peers. A contrasting result was found among the Hispanic/Latino
receiving FARMS services; the adjusted mean difference between the two was positive (1.54) and
practically significant (ES = 0.17).
Table 4. Adjusted Means of Grade 5 MAP-R RIT Scores for ELO STEP Participants and their Peers
Means of MAP-R RIT Scores in Fall 2018 ELO STEP Program
Effect
ELO STEP Participants Nonparticipants ELO STEP vs. non-ELO
STEP
N
Original
Mean
(SD)
Adjusted
Mean N
Original
Mean
(SD)
Adjusted
Mean
Adjusted
Mean
Difference
St.
Error
Effect
Size
(ES)
All Grade 5
Students 203
216.07
(8.73) 216.89 282
217.94
(10.93) 216.97 -0.08 0.59 -0.01
English for Speakers
of Other Languages
(ESOL) participants
19 209.47
(8.05) 211.43 39
208.74
(9.37) 207.88 3.55 2.20 0.40
Non-FARMS
All Other Student
Groups
(Monitoring Group)
30 220.84
(9.70) 222.73 60
226.05
(11.09) 224.89 -2.16 1.30 -0.20
Non-FARMS Black
or African American 29
216.97
(6.43) 217.93 28
220.11
(9.66) 218.31 -0.38 1.59 -0.05
Non-FARMS
Hispanic/Latino 21
212.10
(11.94) 214.28 37
216.43
(11.14) 215.12 -0.84 2.20 -0.07
FARMS All Other
Student Groups 25
213.92
(9.60) 215.67 34
216.24
(8.37) 214.88 0.79 1.87 0.09
FARMS Black or
African American 33
218.00
(7.75) 216.70 28
214.71
(7.45) 216.24 0.46 1.33 0.06
FARMS
Hispanic/Latino 65
214.52
(6.90) 215.11 95
214.06
(9.97) 213.58 1.54 0.98 0.17
SD = Standard Deviation. *p < 0.05 and **p < 0.01
Bold indicates a practical significant difference (|ES| ≥ 0.15)
Grade 4
Mathematics. Table 5 presents the adjusted means on fall MAP-M for the ELO STEP and comparison
groups after controlling for effects of student characteristics and initial differences on pre-program
measures. The calculated adjusted mean difference (0.93) for all Grade 4 students between the two groups

Montgomery County Public Schools Office of Shared Accountability
Program Evaluation Unit 19 ELO STEP Evaluation
(participants and nonparticipants) was neither statistically (p > 0.05) nor practically (ES = 0.11)
significant. However, in the case of participants receiving ESOL services, a positive and practical (ES =
0.30) significant difference was found (Table 5).
When the data were disaggregated by focus group, the comparison between participants and
nonparticipants revealed mixed results. For the first two comparisons (Table 5), the adjusted mean
differences were both statistically (p < 0.05) and practically significant (|ES| ≥ 0.15) for the Monitoring
Group and Non-FARMS Black or African American students, revealing that participants performed better
on fall MAP-M than their nonparticipant peers. Moreover, the adjusted mean difference (Table 5) for
Non-FARMS Hispanic/Latino was not statistically but practically significant in favor of ELO STEP
group. Conversely, for all participants receiving FARMS (excluding Hispanic/Latino), the adjusted mean
differences were not statistically but practically (|ES| ≥ 0.15) significant in favor of the comparison group.
Table 5. Adjusted Means of Grade 4 MAP-M RIT Scores for ELO STEP Participants and their Peers
Means of MAP-M RIT Scores in Fall 2018 ELO STEP Program
Effect
ELO STEP Participants Nonparticipants ELO STEP vs. non-ELO
STEP
N
Original
Mean
(SD)
Adjusted
Mean N
Original
Mean
(SD)
Adjusted
Mean
Adjusted
Mean
Difference
St.
Error
Effect
Size
(ES)
All Grade 4
Students 195
211.40
(8.52) 211.92 291
211.30
(8.58) 210.99 0.93 0.58 0.11
English for Speakers
of Other Languages
(ESOL) participants
43 209.91
(6.64) 210.44 67
207.66
(7.46) 208.29 2.14 1.19 0.30
Non-FARMS
All Other Student
Groups
(Monitoring Group)
22 214.14
(8.70) 218.77 61
215.98
(10.17) 215.00 3.77* 1.66 0.38
Non-FARMS Black
or African American 27
213.85
(8.12) 214.73 20
212.85
(8.29) 211.20 3.53* 1.35 0.44
Non-FARMS
Hispanic/Latino 19
209.89
(9.23) 210.39 36 207.86
208.06
(6.30) 2.52 1.58 0.34
FARMS All Other
Student Groups 9
210.89
(5.58) 210.58 14
211.57
(8.92) 212.05 -1.47 1.97 -0.19
FARMS Black or
African American 37
211.42
(6.88) 210.64 37
211.14
(9.37) 212.06 -1.42 1.22 -0.17
FARMS
Hispanic/Latino 81
210.25
(9.23) 210.56 123
209.68
(7.11) 209.51 1.05 0.94 0.13
SD = Standard Deviation. *p < 0.05 and **p < 0.01.
Bold indicates a practical significant difference (|ES| ≥ 0.15)
Note. Due to a small sample, results for "FARMS All Other Student Groups" were validated via t-tests.

Montgomery County Public Schools Office of Shared Accountability
Program Evaluation Unit 20 ELO STEP Evaluation
Reading. Table 6 shows that the adjusted mean difference of all Grade 4 students (-0.07) was neither
statistically (p > 0.05) nor practically (ES = -0.01) significant, suggesting that ELO STEP students as a
group performed similarly to their peers in the comparison group as measured by fall 2018 MAP-R. Also,
for participants receiving ESOL services, neither practical nor statistically significant difference was
found (Table 6).
Results by focus group were mixed and in both directions (either negative or positive); however, none of
the comparisons among groups were statistically significant (p > 0.05). The calculated effect sizes from
the focus group analyses (ELO STEP group vs. comparison group) revealed that two of the six
comparisons made were practically significant (|ES| ≥ 0.15). In the case of Hispanic/Latino participants
not receiving FARMS services, the analysis showed that they performed better on fall MAP-R than their
nonparticipant peers (ES = 0.24). Conversely, in the case of all FARMS recipients (excluding Black or
African American and Hispanic/Latino), reading performance of participants was lower compared to
nonparticipants.
Table 6. Adjusted Means of Grade 4 MAP-R RIT Scores for ELO STEP Participants and their Peers
Means of MAP-R RIT Scores in Fall 2018 ELO STEP Program
Effect
ELO STEP Participants Nonparticipants ELO STEP vs. non-ELO
STEP
N
Original
Mean
(SD)
Adjusted
Mean N
Original
Mean
(SD)
Adjusted
Mean
Adjusted
Mean
Difference
St.
Error
Effect
Size
(ES)
All Grade 4
Students 195
208.70
(9.21) 209.18 290
209.52
(10.04) 209.25 -0.07 0.62 -0.01
English for Speakers
of Other Languages
(ESOL) participants
43 203.51
(8.51) 204.09 67
202.13
(8.28) 202.91 1.18 1.46 0.14
Non-FARMS
All Other Student
Groups
(Monitoring Group)
22 211.50
(9.66) 215.01 61
216.27
(10.10) 215.42 -0.41 1.82 -0.04
Non-FARMS Black
or African American 27
210.63
(10.87) 211.68 20
211.90
(10.87) 210.24 1.44 1.80 0.13
Non-FARMS
Hispanic/Latino 19
209.58
(10.83) 210.20 36
208.25
(9.73) 207.83 2.37 1.84 0.24
FARMS All Other
Student Groups 9
205.44
(11.98) 204.85 14
210.00
(8.74) 210.27 -5.42 3.16 -0.54
FARMS Black or
African American 37
209.08
(9.32) 209.28 37
208.89
(9.68) 208.65 0.64 1.62 0.07
FARMS
Hispanic/Latino 81
207.27
(7.49) 207.25 122
206.28
(8.56) 206.29 0.96 0.86 0.12
SD = Standard Deviation. *p < 0.05 and **p < 0.01.
Bold indicates a practical significant difference (|ES| ≥ 0.15)
Note. Due to a small sample, results for "FARMS All Other Student Groups" were validated via t-tests.

Montgomery County Public Schools Office of Shared Accountability
Program Evaluation Unit 21 ELO STEP Evaluation
Grade 3
Mathematics. Table 7 presents the adjusted means on fall MAP-M for the ELO STEP and comparison
groups after controlling for student characteristics and initial differences on pre-program measures. The
calculated adjusted mean difference (0.95) for all Grade 3 students between the two groups (participants
and nonparticipants) was statistically (p < 0.05) but not practically (|ES| ≤ 0.15) significant in favor of the
ELO STEP group. However, in the case of participants receiving ESOL services, a positive and practical
(ES = 0.16) significant difference was found (Table 7).
When the analysis was disaggregated by focus group, none of the adjusted mean differences between the
two groups of students was statistically significant (p > 0.05). However, the calculated effect sizes from
the focus group analyses (ELO STEP group vs. comparison group) revealed that three of the six
comparisons made were practically significant with ES greater than 0.15: (a) Non-FARMS All Other
Student Groups (Monitoring Group); (b) Non-FARMS Black or African American; and (c) FARMS All
Other Student Groups. In the case of these three particular subgroups, participants performed better than
their nonparticipant peers on fall MAP-M. For the rest of focus groups, neither a statistical nor a practical
significance was found for adjusted mean differences between attendees and non-attendees.
Table 7. Adjusted Means of Grade 3 MAP-M RIT Scores for ELO STEP Participants and their Peers
Means of MAP-M RIT Scores in Fall 2018 ELO STEP Program Effect
ELO STEP Participants Nonparticipants ELO STEP vs. non-ELO
STEP
N
Original
Mean
(SD)
Adjusted
Mean N
Original
Mean
(SD)
Adjusted
Mean
Adjusted
Mean
Difference
St.
Error
Effect
Size
(ES)
All Grade 3 Students 250 198.63
(7.90) 198.94 342
198.09
(8.61) 197.99 0.95* 0.46 0.11
English for Speakers
of Other Languages
(ESOL) participants
78 195.46
(6.65) 195.58 95
193.90
(7.05) 194.49 1.09 0.81 0.16
Non-FARMS
All Other Student
Groups
(Monitoring Group)
32 205.16
(7.09) 204.63 59
202.07
(9.93) 202.49 2.14 1.29 0.24
Non-FARMS Black
or African American 26
201.35
(6.15) 200.67 33
197.70
(8.60) 198.36 2.31 1.18 0.30
Non-FARMS
Hispanic/Latino 23
199.74
(8.71) 198.96 37
197.86
(7.38) 198.16 0.81 1.52 0.10
FARMS All Other
Student Groups --
201.18
(8.10) 202.15 32
198.88
(9.62) 198.39 3.76 2.14 0.41
FARMS Black or
African American 48
197.35
(8.36) 197.70 52
198.60
(8.42) 198.24 -0.54 1.03 -0.06
FARMS
Hispanic/Latino 104
195.90
(6.61) 196.27 129
196.06
(7.55) 195.97 0.30 0.70 0.04
SD = Standard Deviation. *p < 0.05 and **p < 0.01.
Bold indicates a practical significant difference (|ES| ≥ 0.15)

Montgomery County Public Schools Office of Shared Accountability
Program Evaluation Unit 22 ELO STEP Evaluation
Reading. For all Grade 3 students, Table 8 shows that the adjusted mean difference (0.04) on fall
MAP-R for participants and nonparticipants was neither statistically (p > 0.05) nor practically (ES = 0)
significant, suggesting that ELO STEP third graders as a group performed similarly to their peers in the
comparison group as measured by fall 2018 MAP-R. However, for participants receiving ESOL services,
a positive and practical (ES = 0.22) significant difference was found (Table 8).
Similar to the previous analysis by focus groups for other grades, results were mixed. None of the adjusted
mean differences in each of the six comparisons made was statistically significant (p > 0.05). However,
the calculated effect sizes from the focus group analyses (ELO STEP group vs. comparison group)
revealed that two of the six comparisons made were practically significant (|ES| ≥ 0.15). The adjusted
mean difference between the two groups of third graders (ELO STEP vs. comparison group) in the
Monitoring Group was practically significant (ES = -0.34) in favor of the comparison group. Conversely,
third graders who were Black or African American and received FARMS services had a positive (3.53)
and practically significant (ES = 0.33) adjusted mean difference.
Table 8. Adjusted Means of Grade 3 MAP-R RIT Scores for ELO STEP Participants and their Peers
Means of MAP-R RIT Scores in Fall 2018 ELO STEP Program Effect
ELO STEP Participants Nonparticipants ELO STEP vs. non-ELO
STEP
N
Original
Mean
(SD)
Adjusted
Mean N
Original
Mean
(SD)
Adjusted
Mean
Adjusted
Mean
Difference
St.
Error
Effect
Size
(ES)
All Grade 3
Students 252
197.70
(11.04) 198.19 357
198.52
(12.24) 198.15 0.04 0.91 0.00
English for Speakers
of Other Languages
(ESOL) participants
79 193.30
(11.17) 193.47 96
191.23
(10.12) 191.09 2.38 1.61 0.22
Non-FARMS
All Other Student
Groups
(Monitoring Group)
32 202.69
(10.38) 202.69 71
206.52
(11.63) 206.52 -3.83 2.41 -0.34
Non-FARMS Black
or African American 26
199.04
(9.50) 199.13 34
199.18
(11.97) 199.11 0.02 2.87 0.00
Non-FARMS
Hispanic/Latino 23
198.57
(13.58) 198.56 38
198.61
(10.87) 198.61 -0.04 3.18 0.00
FARMS All Other
Student Groups 17
199.88
(9.50) 199.83 32
198.81
(11.70) 198.84 0.99 3.15 0.09
FARMS Black or
African American 48
200.04
(9.70) 199.95 52
196.33
(11.59) 196.42 3.53 2.13 0.33
FARMS
Hispanic/Latino 106
194.26
(10.96) 194.30 130
194.75
(11.49) 194.72 -0.42 1.47 -0.04
SD = Standard Deviation. *p < 0.05 and **p < 0.01
Bold indicates a practical significant difference (|ES| ≥ 0.15)

Montgomery County Public Schools Office of Shared Accountability
Program Evaluation Unit 23 ELO STEP Evaluation
Comparison of the Program Outcome in Mathematics and Reading across Grades
The outcome of the ELO STEP program on student reading and mathematics performance, measured by
effect sizes, is presented below.
Mathematics. The effect sizes in mathematics ranged from 0.11 for third and fourth graders to 0.17 for
fifth graders, as Figure 7 shows below. There was evidence of program benefits in mathematics for
participants entering Grade 5 since the effect size associated to their adjusted mean difference was
statistically (p < 0.01) and practically significant (ES = 0.17), suggesting that the magnitude of the
difference was meaningful in educational settings.
When the analysis focused on the effect of ELO STEP in specific subgroups, positive results in
mathematics performance were observed across all grades for participants receiving ESOL instruction
during the 2017–2018 school year. As Figure 8 shows below, the calculated effect sizes for ELO STEP
participants receiving ESOL services were practically (|ES| ≥ 0.15) significant for all grades.
0.11 0.11
0.17**
0.00
0.10
0.20
0.30
Eff
ect
size
Grade 3 Grade 4 Grade 5
0.16
0.30
0.15
0.00
0.10
0.20
0.30
Eff
ect
size
Grade 3 Grade 4 Grade 5
Figure 7. Effect size of fall MAP-M scores for all ELO STEP participants.
Note. Bold indicates a practically significant difference. *p < 0.05, and **p < 0.01
Figure 8. Effect size of fall MAP-M scores for all ELO STEP participants
receiving ESOL services.
Note. Bold indicates a practically significant difference.

Montgomery County Public Schools Office of Shared Accountability
Program Evaluation Unit 24 ELO STEP Evaluation
The program’s outcome in mathematics by grade level and focus group, measured by effect sizes, are
illustrated in Figure 9. All the focus groups resulted in at least one grade with a practically significant
adjusted mean difference between attendees and non-attendees. The focus group with the largest effect
sizes was Black or African American fifth graders who received FARMS services and who participated
in ELO STEP. This group had a medium effect size (ES = 0.54), which was statistically significant
(p < 0.01), suggesting that they performed better on fall MAP-M compared to their nonparticipant peers.
Other subgroups with positive effect sizes, but not all statistically significant, are in bold in the first
quadrant of Figure 9 below. Also, two subgroup analyses, both fourth graders, revealed a negative but
small effect size, which was not statically significant (p > 0.05): (a) FARMS All Other Student Groups;
and (b) FARMS Black or African American.
Reading. As Figure 10 shows below, the effect sizes associated with the ELO STEP program in reading
were almost zero for fourth and fifth graders, and zero for third graders. As a result, regardless of the
grade level, ELO STEP participants performed as well as their nonparticipant peers on fall MAP-R.
0.240.30
0.10
0.41
-0.06
0.04
0.38*0.44*
0.34
-0.19 -0.17
0.13
0.010.09
0.24
-0.09
0.54**
0.25**
-0.30
-0.15
0.00
0.15
0.30
0.45
0.60
Non-FARMS All
Other Student
Groups
(Monitoring Group)
Non-FARMS Black
or African
American
Non-FARMS
Hispanic/Latino
FARMS All Other
Student Groups
FARMS Black or
African American
FARMS
Hispanic/Latino
Eff
ect
size
Grade 3 Grade 4 Grade 5
-0.01 -0.01-0.02
-0.01
0.00
0.01
0.02
Eff
ect
size
Grade 4 Grade 5
Figure 9. Effect size of fall MAP-M scores for ELO STEP participants by focus group.
Note. Bold indicates a practically significant difference. *p < 0.05, and **p < 0.01
Figure 10. Effect size of fall MAP-R scores for all ELO STEP participants.
Note. Grade 3 reported an overall effect size of zero.

Montgomery County Public Schools Office of Shared Accountability
Program Evaluation Unit 25 ELO STEP Evaluation
However, positive results in reading performance were observed, at least for two grades (Grades 3 and 5),
for participants receiving ESOL instruction during the 2017–2018 school year. Figure 11 shows the
calculated effect sizes for participants receiving ESOL services, practically (|ES| ≥ 0.15) significant for
Grades 3 and 5.
The outcome of the ELO STEP program in reading, as measured by effect sizes, were disaggregated by
focus group in Figure 12. All focus groups reported at least one grade with a practically significant
adjusted mean difference between attendees and non-attendees, with the exception of Non-FARMS Black
or African American students. Regardless of the grade level and participation in ELO STEP, this
particular subgroup of students performed the same on fall MAP-R. The group with the largest effect
size, although not statistically significant, was fourth graders from “All Other Student Groups” receiving
FARMS services who had a medium negative effect size (-0.54), suggesting that participants’ performance
on fall MAP-R was poorer than their nonparticipant peers. Smaller negative effect sizes, not statistically
significant, were also found for third and fifth graders in the Monitoring Group. These findings revealed
that participants from racial/ethnic groups other than Black or African American and Hispanic/Latino
performed poorer on reading than their nonparticipant peers.
Noteworthy positive effect sizes, none of them statistically significant, were also observed in the following
subgroups: (a) fourth graders Non-FARMS Hispanic/Latino; (b) third graders FARMS Black or African
American; and (c) fifth graders FARMS Hispanic/Latino (Figure 12). These findings revealed that no
overall positive conclusion could be inferred; however, positive effects of the program on reading
performance can be associated only to specific grade levels and student characteristics.
0.22
0.14
0.40
0.00
0.10
0.20
0.30
0.40
Eff
ect
size
Grade 3 Grade 4 Grade 5
Figure 11. Effect size of fall MAP-R scores for all ELO STEP participants
receiving ESOL services.
Note. Bold indicates a practically significant difference.

Montgomery County Public Schools Office of Shared Accountability
Program Evaluation Unit 26 ELO STEP Evaluation
Summary
The outcomes of the ELO STEP program varied by content area and by grade, with more positive findings
in mathematics than in reading. As Table 9 summarizes below, in mathematics, the benefits of ELO STEP
were evident (statistically and practically significant) for fifth graders overall, particularly for Black or
African American and Hispanic/Latino students receiving FARMS services, as well as for all fourth
graders not receiving FARMS services (excluding Hispanic/Latino). For some other subgroups, positive
and practical (|ES| ≥ 0.15) significant adjusted mean differences were found (Table 9), including: (a) third
graders FARMS All Other Student Groups, Non-FARMS Black or African, and Monitoring Group; and
(b) fourth and fifth graders Non-FARMS Hispanic/Latino students.
In the case of participants receiving ESOL services, also positive and practical (|ES| ≥ 0.15) significant
differences (but not statistically significant) were found across all grades, suggesting that participants in
ELO STEP who received ESOL services in the 2017–2018 school year performed better on fall MAP-M
than their nonparticipant peers.
Conversely, a small and negative practical significance results were found for fourth graders receiving
FARMS services (excluding Hispanic/Latino), indicating that nonparticipants in Grade 4 did better on fall
MAP-M than participants; however, these results were not statistically significant (p > 0.05), as Table 9
shows below.
-0.34
0.00 0.000.09
0.33
-0.04-0.04
0.13
0.24
-0.54
0.070.12
-0.20
-0.05 -0.07
0.09 0.06
0.17
-0.75
-0.55
-0.35
-0.15
0.05
0.25
0.45
Non-FARMS All
Other Student
Groups
(Monitoring Group)
Non-FARMS Black
or African
American
Non-FARMS
Hispanic/Latino
FARMS All Other
Student Groups
FARMS Black or
African American
FARMS
Hispanic/Latino
Eff
ect
size
Grade 3 Grade 4 Grade 5
Figure 12. Effect size of fall MAP-R scores for ELO STEP participants by focus group.
Note. Bold indicates a practically significant difference. None of the effect sizes was statistically significant.

Montgomery County Public Schools Office of Shared Accountability
Program Evaluation Unit 27 ELO STEP Evaluation
Table 9. Statistical Significance and Effect Sizes for ELO STEP Participants vs. Comparison Students in
Math
Group Measure Grade 3 Grade 4 Grade 5
All Students MAP-M *
d = 0.11
d = 0.11
**
d = 0.17
English for Speakers of Other Languages (ESOL)
participants MAP-M
d = 0.16
d = 0.30
d = 0.15
Non-FARMS All Other Student Groups
(Monitoring Group) MAP-M
d = 0.24
*
d = 0.38
d = 0.01
Non-FARMS Black or African American MAP-M
d = 0.30
*
d = 0.44
d = 0.09
Non-FARMS Hispanic/Latino MAP-M
d = 0.10
d = 0.34
d = 0.24
FARMS All Other Student Groups MAP-M
d = 0.41
d = -0.19
d = -0.09
FARMS Black or African American MAP-M
d = -0.06
d = -0.17
**
d = 0.54
FARMS Hispanic/Latino MAP-M
d = 0.04
d = 0.13
**
d = 0.25
*p < 0.05, **p < 0.01
Note. Bold indicates a practical significant difference (|ES| ≥ 0.15)
Shaded cells indicate a positive effect, statistically and practically significant.
In reading, even though the outcome of ELO STEP was not statistically significant for any of the grades
or by student subgroups, some differences were practically significant, which is relevant in educational
settings (Table 10). The benefits of ELO STEP were not evident for all students, but four subgroups had
practically significant differences: (a) third and fifth graders receiving ESOL services; (b) fifth graders
FARMS Hispanic/Latino; (c) fourth graders Non-FARMS Hispanic/Latino; and (d) third grader FARMS
Black or African American students.
Conversely, negative practical significance differences were found for some subgroups, indicating that
nonparticipants did better on fall MAP-M than participants: (a) fifth and third graders in the Monitoring
group, and (b) fourth graders FARMS All Other Student Groups.

Montgomery County Public Schools Office of Shared Accountability
Program Evaluation Unit 28 ELO STEP Evaluation
Table 10. Statistical Significance and Effect Sizes for ELO STEP Participants vs. Comparison Students
in Reading
Group Measure Grade 3 Grade 4 Grade 5
All Students MAP-R
d = 0.00
d = -0.01
d = -0.01
English for Speakers of Other Languages (ESOL)
participants MAP-R
d = 0.22
d = 0.14
d = 0.40
Non-FARMS All Other Student Groups
(Monitoring Group) MAP-R
d = -0.34
d = -0.04
d = -0.20
Non-FARMS Black or African American MAP-R
d = 0.00
d = 0.13
d = -0.05
Non-FARMS Hispanic/Latino MAP-R
d = 0.00
d = 0.24
d = -0.07
FARMS All Other Student Groups MAP-R
d = 0.09
d = -0.54
d = 0.09
FARMS Black or African American MAP-R
d = 0.33
d = 0.07
d = 0.06
FARMS Hispanic/Latino MAP-R
d = -0.04
d = 0.12
d = 0.17
*p < 0.05, **p < 0.01
Note. Bold indicates a practical significant difference (|ES| ≥ 0.15)
Shaded cells indicate a positive effect, statistically and practically significant.
Discussion and Conclusion
Decision makers in K-12 education have been facing higher public expectations, uncertain budgets, and
demanding constituencies in the last few years. There is an urgent need for sound evaluative information
to help school leaders to make decisions based on evaluative information regarding the expansion,
continuation, and improvement of intervention programs in the school system.
After the Every Student Succeeds Act (ESSA), passed in 2015, states are more encouraged to focus on all
students, not only on struggling or at-risk children but also on students with different skill sets (Wright,
2017). ELO STEP is one example of these initiatives that intended to close the achievement gap between
high achievers from low-income families and their affluent peers by providing accelerated and enrichment
instructional opportunities. As stated by the literature, the achievement gap problem among high
achievers has been largely documented, suggesting that students in high poverty schools tend to be

Montgomery County Public Schools Office of Shared Accountability
Program Evaluation Unit 29 ELO STEP Evaluation
underrepresented among high achievers (Smarick, 2013) and, sometimes, these gaps close slowly or grow
over the past generation (Plucker at al., 2013).
The literature has also remarked on a number of features that are associated with effective summer
programs. Most of those features are aligned with the characteristics of the 2018 ELO STEP: (a) structured
instruction (in reading, writing, or mathematics) consistent with state and local content standards and
matched with students’ academic needs; (b) adequate intensity and duration of instruction (three hours a
day, five days per week, for five to six weeks); (c) lower student-to-adult ratios than those observed in the
regular school year; and (d) academic content supplemented with enrichment activities (Augustine et al.,
2013). For instance, the 2018 ELO STEP has provided a structured curriculum in math, science, and
information literacy in the morning, and supplemented it with academic content for some students (such
as digital literacy and coding) during the afternoon. Also, the curriculum was provided continuously for
five weeks to 785 students from 21 Title I schools, with an average class size of 14 students per section.
Findings from this evaluation indicated that the ELO STEP program might be used as a potential
mechanism to improve outcomes for above average students. Similar to the findings from the first
evaluation of ELO STEP in the summer of 2015, the overall outcome of the 2018 ELO STEP was more
evident in mathematics than in reading, and particularly for Grade 5 participants. A possible reason for
this positive effect of performance in mathematics might be attributed to the curriculum structure and
schedule. As indicated in Appendix B, the 2018 ELO STEP curriculum included math, which was taught
daily for 75 minutes. However, literacy activities (information literacy) were only offered 30 minutes
each day.
Regarding particular student subgroups, results from this evaluation were mixed, whereas the first
evaluation (Grade 3 only) found exclusively positive effect sizes in mathematics and reading for all the
student subgroups analyzed (race/ethnicity and FARMS status). The current evaluation found a variety
of results by student subgroups, with only one similarity with the first outcome evaluation of ELO STEP:
Hispanic/Latino participants, regardless of their grade level, performed better in mathematics than their
nonparticipant peers. For other subgroups in the current evaluation, positive and practically significant
effects varied depending on the race/ethnicity, grade, and service status of participants:
Black or African American. Comparative analyses (ELO STEP participants and nonparticipants)
revealed that Black or African American participants in Grades 3 and 4, who did not receive
FARMS services, performed better in mathematics, as well as Black or African American
participants in Grade 5 who received FARMS services. For reading, only Black or African
American participants in Grade 3 who received FARMS services performed better than their peers
in the comparison group.
Hispanic/Latino. Similar comparative analyses found that Hispanic/Latino participants in Grade
4 who did not receive FARMS services performed better than their peers (nonparticipants) in math.
Better performance was observed for Hispanic/Latino participants in Grade 5 regardless of their
FARMS status using parallel analyses. In reading, the comparison of the two groups of students
(participants and nonparticipants) found that Hispanic/Latino participants in Grade 4 who did not
receive FARMS services performed better than their peers. The same comparison found similar
results for Hispanic/Latino participants in Grade 5 who did receive FARMS services.

Montgomery County Public Schools Office of Shared Accountability
Program Evaluation Unit 30 ELO STEP Evaluation
FARMS recipients. For mathematics, the comparative analyses indicated that participants who
were not FARMS recipients, regardless of their grade level, tended to perform better in
mathematics than participants who received FARMS services. For reading, no overall conclusion
can be inferred by students’ FARMS status.
ESOL recipients. Comparative analyses, for mathematics, found that participants who received
ESOL services performed better in mathematics across all grades than participants who did not.
For reading, the same conclusion was observed but only for participants in Grade 3 and 5.
In closing, establishing the criteria of success and failure is very difficult in evaluating the impact of any
intervention programs. Borus (1979) asserts that the list of outcomes is always incomplete since only
those criteria of success, which can be measured, are considered. The effectiveness of ELO STEP in this
evaluation was assessed only by examining the performance of students in the area of reading and
mathematics through only one measure of students’ achievement (MAP test scores). Other program goals,
such as critical thinking, knowledge of science concepts, or students’ attitudes to complex tasks, cannot
be addressed by the analysis due to the lack of existing measures.
Recommendations
Based on the findings of this evaluation, the following recommendations are suggested:
Continue with the use of the instructional mathematics practices for ELO STEP for future positive
effects in mathematics. However, it is important to explore the reasons why the program had a
small negative effect size in Grade 4 participants who received FARMS services but who were not
Hispanic/Latino, even though these results were not statistically significant.
Examine the ELO STEP curriculum and make it more interdisciplinary. Similar to the
recommendation proposed in the first evaluation of ELO STEP (2016), the shorter instructional
time in literacy might be the reason why there was no apparent effect of the program on students’
overall reading performance.
Provide opportunity for and encourage teachers to conduct Action Research (AR) in their
classroom, which will allow them to collect data from their students via multiple measures, identify
patterns, collaborate with their peers, and think about different ways to improve instruction
delivery, student learning, and engagement. Guidelines and example about how to put AR in
practice can be included in the ELO STEP training that takes place before the program starts.
Increase the number of students participating in ELO STEP via outreach activities. Among the
1,824 students invited to the program, only less than the half (43%) chose to participate.
Include in future studies a formative evaluation component that incorporates students’, teachers’,
and parents’ feedback regarding their experience in the program. Program stakeholders’
experiences can help the administration and program staff identifying what components or
practices in the program are effective or need to be improved. Also, extend this recommendation
to parents of students who were invited but decided not to participate in order to understand the
reasons for their decision.

Montgomery County Public Schools Office of Shared Accountability
Program Evaluation Unit 31 ELO STEP Evaluation
Replicate the study over time using different student population to see if the observed findings are
stable.
Ask parents or guardians to sign a confirmation form at the time of ELO STEP registration
committing their child or children to attend, similar to what is done for the ELO SAIL program.
Administer a test, before and after the program, assessing all the content areas and skills that the
program intends to enrich (e.g., critical thinking, knowledge of science concepts, students’
attitudes to complex tasks, etc.). Results from these tests can provide indicators, relevant and
specific to the ELO STEP program, which can be used to measure the impact of the intervention.
Acknowledgements
The authors would like to thank Ms. Natalie Wolanin, logistics support specialist, Program Evaluation
Unit (PEU), for her careful and thoughtful review of the report; Ms. Nichelle Owens, supervisor, Division
of Title I and Early Childhood Programs and Services, for her collaboration in providing pertinent
information about the 2018 ELO STEP program and feedback to the draft report; and Mrs. Kurshanna
Dean, supervisor, Division of Accelerated and Enriched Instruction, for her feedback to the draft report as
well.

Montgomery County Public Schools Office of Shared Accountability
Program Evaluation Unit 32 ELO STEP Evaluation
References
American Psychological Association. (2001). Publication manual of the American Psychological
Association. Washington, DC: Author. Austin P.C, 2011.
Augustine, C., McCombs, J. S., Schwartz, H. L., & Zakaras, L. (2013). Getting to Work on Summer
Learning: Recommended Practices for Success, Santa Monica, Calif.: RAND Corporation, RR-
366-WF.
Augustine, C., McCombs, J. S., Pane, J., Schwartz, H., Schweig, J., McEachin, A., & Siler-Evans, K.
(2016). Learning from Summer: Effects of Voluntary Summer Learning Programs on Low-Income
Urban Youth, Santa Monica, CA: RAND Corporation, RR-1557-WF.
Austin, P. C. (2011). An introduction to propensity-score methods for reducing confounding in
observational studies. Multivariate Behavioral Research. Vol. 46.
Babbie, Earl. (1992). The practice of social research, 6th Edition. Belmont, CA: Wadsworth.
Bloom, H. S., Hill, C. J., Black, A. R., & Lipsey, M. W. (2008). Performance trajectories and performance
gaps as achievement effect-size benchmarks for educational interventions. Journal of Research on
Educational Effectiveness, 1(4), 289-328.
Bordens, K. S. & Abbott, B. B. (2008). Research design and methods: A process approach, 7th Edition.
New York, NY: McGraw-Hill.
Borman, G. D., Hewes, G. M., Overman, L. T., & Brown, S. (2003). Comprehensive school reform and
achievement: A meta-analysis. Review of Educational Research, 73(2), 125-230.
Borus, ME. (1979). Measuring the impact of employment-related social programs. W.E.UPJOHN
Institute for Employment research.
Campbell, D. T. & Stanley, J. C. (1963). Experimental and Quasi-experimental designs for research.
Chicago, IL: Rand McNally College Publishing.
Carver, R. P. (1993). The case against statistical significance testing, revisited. Journal of Experimental
Education, 61(4), 287–292.
Cohen, J. (1988). Statistical power analysis for the behavioral sciences (2nd Ed.). Hillsdale, NJ: Lawrence
Earlbaum Associates.
Cooper, H., Charlton, K., Valentine, J., Muhlenbruck, L., & Borman, G. (2000). Making the Most of
Summer School: A Meta-Analytic and Narrative Review. Monographs of the Society for Research
in Child Development, 65(1), I-127

Montgomery County Public Schools Office of Shared Accountability
Program Evaluation Unit 33 ELO STEP Evaluation
Cooper-Martin, E., & Zhao, H. (2016). Impact of the Extended Learning Opportunities Summer
Adventures in Learning (ELO SAIL) Program on Student Academic Performance: Part 2, Results
for Summer 2015. Rockville, MD: Montgomery County Public Schools.
Fairfax County Public Schools. (2018). Young Scholars (K-12). Retrieved November 26, 2018 from FCPS
website. https://www.fcps.edu/index.php/academics/middle-school-academics-7-8/advanced-
academics/young-scholars-k-12
Fraenkel, J. R., & Wallen, N. E. (2009). How to design and evaluate research in education. New York,
NY: McGraw-Hill.
Gay, L. R. & Airasian, P. W. (2000). Educational research: Competencies for analysis and application
(6th ed.). Englewood Cliffs, NJ: Prentice Hall.
Hedrick, T. E., Bickman, L., & Rog, D. J. (1993). Applied research design: A practical guide. Newbury
Park, CA: Sage Publications, Inc.
Institute of Education Sciences (2016). What Works Clearinghouse: Procedures and Standards Handbook
Version 3.0. Retrieved December 4, 2018 from:
http://ies.ed.gov/ncee/wwc/DocumentSum.aspx?sid=19
Judd C. M., Smith, E. R. & Kidder, L. H. (1991). Research methods in social relations. San Francisco,
CA: Holt, Rinehart and Winston, Inc.
Kaushal, N., Magnuson, K. A., & Waldfogel, J. (2011). “How Is Family Income Related to Investments
in Children’s Learning?” in Greg J. Duncan and Richard J. Murnane, eds., Whither Opportunity?
Rising Inequality and the Uncertain Life Chances of Low-Income Children, New York: Russell
Sage.
Kirk, R. E. (1995). Experimental design: Procedures for the behavioral sciences. New York, NY:
Brooks/Cole Publishing Company.
Kline, R. (2004). Beyond significance testing: Reforming data analysis methods in behavioral research.
Washington, DC: American Psychological Association.
Lang, E. (2018). Memorandum to principals of Title I schools, April 12, 2018. 2018 Extended Learning
Opportunities Summer Title I Enrichment Program. Rockville, MD: Montgomery County Public
Schools.
Levin, J. R. (1993). Statistical significance testing from three perspectives. Journal of Experimental
Education, 61(4), 378–381.
Lipsey, M.W., & Wilson, D.B. (1993). The efficacy of psychological, educational, and behavioral
treatment. Confirmation from meta-analysis. American Psychologist, 48, 1181-1209.

Montgomery County Public Schools Office of Shared Accountability
Program Evaluation Unit 34 ELO STEP Evaluation
Lipsey, M. W., Puzio, K., Yun, C., Hebert, M. A., Steinka-Fry, K., Cole, M. W., Roberts, M., Anthony,
K. S., & Busick, M. D. (2012). Translating the statistical representation of the effects of education
interventions into more readily interpretable forms (NCSER 2013-3000). Washington, DC:
National Center for Special Education Research, Institute of Education Sciences, U.S. Department
of Education.
Loveless, T., Parkas, S., & Duffett, A. (2008). High-Achieving Students in the Era of NCLB. Washington,
DC: Thomas B. Fordham Institute. https://eric.ed.gov/?id=ED501703
Luellen J. K., Shadish W. R., & Clark M. H. (2005). Propensity scores: An introduction and experimental
test. Evaluation Review, 29, 530-558. doi:10.1177/0193841X0575596.
Modarresi S., Connolly. F., & Merchlinsky, S. (2007). Applying Quasi-experimental Design to the Impact
Evaluation of a Professional Development Program: Design Issues & Methodological Challenges.
The Annual Meeting of the American Educational Research Association, Chicago, IL.
Montgomery County Public Schools. (2018). ELO STEP. Retrieved November 26, 2018, from MCPS
website https://www.montgomeryschoolsmd.org/departments/dtecps/title1/elo-step.aspx
Northwest Evaluation Association. (2008). RIT scale norms for use with Measures of Academic Progress.
Lake Oswego, OR: Northwest Evaluation Association.
Northwest Evaluation Association (2011). Technical manual for Measures of Academic Progress and
Measures of Academic Progress for Primary Grades. Lake Oswego, OR: Northwest Evaluation
Association.
Olszewski-Kubilius, P. & Clarenbach, J. (2012). Unlocking emergent talent: Supporting high achievement
of low-income, high-ability students. Washington, DC: National Association for Gifted Children.
http://www.jkcf.org/assets/1/7/Unlocking_Emergent_Talent.pdf
Peters, S., & Gentry, M. (2012). Group-Specific Norms and Teacher-Rating Scales: Implications for
Underrepresentation. Journal of Advanced Academics, 23(2), 125-144.
Plucker, J., Hardesty, J., & Burroughs, N. (2013). Talent on the sidelines: Excellence gaps and America’s
persistent talent underclass. Center for Education Policy Analysis at the Neag School of Education
University of Connecticut.
Rosenthal, R., & Rubin, D. B. (1982). A simple, general purpose display of magnitude of experimental
effect. Journal of Educational Psychology, 74, 166–169.
Rosenbaum, P. R., & Rubin, D. B. (1983). The central role of the propensity score in observational studies
for causal effects. Biometrika, 70, 41–45.
Rosenbaum, P. R., & Rubin, D. B. (1984). Reducing bias in observational studies using subclassification
on the propensity score. Journal of the American Statistical Association, 79, 561–524.

Montgomery County Public Schools Office of Shared Accountability
Program Evaluation Unit 35 ELO STEP Evaluation
Rosenbaum, P.R., & Rubin, D. B. (1985). Constructing a control group using multivariate matched
sampling that incorporates the propensity score. The American Statistician, 39, 33–38.
Rossi. P. & Freeman, H. E. (1993). Evaluation: A systematic approach. Beverly Hills, CA: Sage. Sage
Publications.
Rossi, P. H., Lipsey, Mark W., & Freeman, H. E. (2004). Evaluation: A systematic approach (7th edition.).
Thousand Oaks, CA: SAGE Publications, Inc.
Shadish, W. R., Cook, T. D., & Campbell, D. T. (2002). Experimental and Quasi-Experimental Designs
for Generalized Causal Inference, Houghton Mifflin Company, M.A.: Boston.
McCombs, J., Augustine, C., Schwartz, H., Bodilly, S., McInnis, B., Lichter, D., & Cross, A. (2011).
Making Summer Count: How Summer Programs Can Boost Children's Learning. Santa Monica,
CA: RAND Corporation.
Smarick, A. (2013). Closing America's High-achievement Gap: A Wise Giver's Guide to Helping Our
Most Talented Students Reach Their Full Potential. Washington, DC: The Philanthropy
Roundtable.
Thompson, B. (2002). “Statistical,” “practical,” and “clinical”: How many kinds of significance do
counselors need to consider? Journal of Counseling & Development, 80(1), 64–71.
White, W. (1906). Reviews before and after vacation. American Education, 185-188.
Wright, B. & Petrilli, M. (2017). Rating the Ratings: An Analysis of the 51 ESSA Accountability Plans.
Washington, DC: Thomas B. Fordham Institute.
Zhao, H., Modarresi, S., & Jang, S. (2016). Evaluation of Extended Learning Opportunities Summer Title
I Enrichment Program (ELO-STEP) in 2015–2016. Rockville, MD: Montgomery County Public
Schools.

Montgomery County Public Schools Office of Shared Accountability
Program Evaluation Unit 36 ELO STEP Evaluation
Appendix A
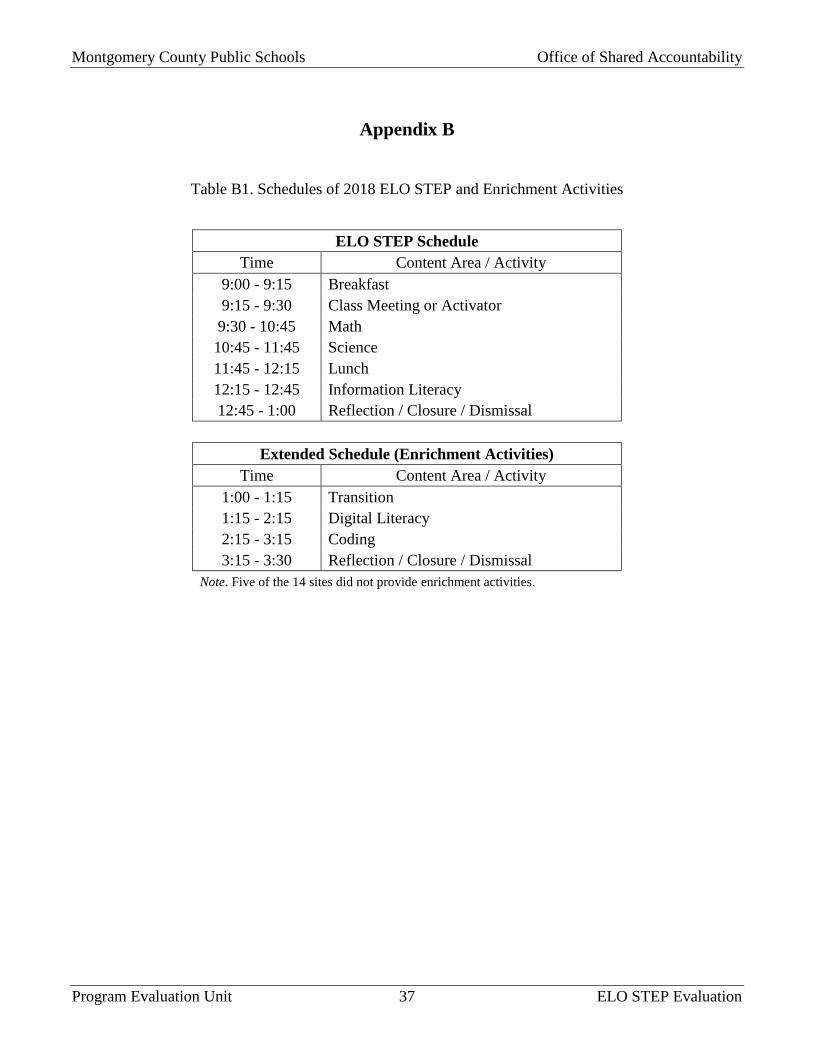
Montgomery County Public Schools Office of Shared Accountability
Program Evaluation Unit 37 ELO STEP Evaluation
Appendix B
Table B1. Schedules of 2018 ELO STEP and Enrichment Activities
ELO STEP Schedule
Time Content Area / Activity
9:00 - 9:15 Breakfast
9:15 - 9:30 Class Meeting or Activator
9:30 - 10:45 Math
10:45 - 11:45 Science
11:45 - 12:15 Lunch
12:15 - 12:45 Information Literacy
12:45 - 1:00 Reflection / Closure / Dismissal
Extended Schedule (Enrichment Activities)
Time Content Area / Activity
1:00 - 1:15 Transition
1:15 - 2:15 Digital Literacy
2:15 - 3:15 Coding
3:15 - 3:30 Reflection / Closure / Dismissal
Note. Five of the 14 sites did not provide enrichment activities.

Montgomery County Public Schools Office of Shared Accountability
Program Evaluation Unit 38 ELO STEP Evaluation
Appendix C
Table C1. FY 2018 Budget for ELO STEP
Number of Staff Cost
Teachers’ salaries, setup and professional
meeting
69 $422,370.00
Paraeducators’ salaries 9 $16,167.94
Staff benefits $35,083.04
Instructional materials $32,000.00
Total STEP cost $505,620.97
Source: Received from DTECPS on Sep. 19, 2018
Note. The ELO STEP budget excludes transportation and meal cost.

Montgomery County Public Schools Office of Shared Accountability
Program Evaluation Unit 39 ELO STEP Evaluation
Appendix D
Table D1. 2018 ELO STEP Program Sites and Bell Times
Title I Elementary Schools ELO STEP Site Bell Times
Arcola Arcola 9:00 - 3:30
Cresthaven Cresthaven 9:00 - 1:00
Capt. James E. Daly Capt. James E. Daly 9:00 - 1:00
Gaithersburg South Lake 9:00 - 3:30
Georgian Forest Georgian Forest 9:00 - 3:30
Harmony Hills Georgian Forest 9:00 - 3:30
Highland Sargent Shriver at Viers Mill 9:00 - 3:30
Jackson Road Cresthaven 9:00 - 3:30
Kemp Mill Arcola 9:00 - 3:30
JoAnn Leleck at Broad Acres JoAnn Leleck at Broad Acres 9:00 - 3:30
New Hampshire States Oak View 9:00 - 1:00
Oak View Oak View 9:00 - 1:00
Rolling Terrace Rolling Terrace 9:00 - 1:00
Roscoe R. Nix Cresthaven 9:00 - 3:30
Sargent Shriver Sargent Shriver at Viers Mill 9:00 - 3:30
South Lake South Lake 9:00 - 3:30
Summit Hall Summit Hall 9:00 - 3:30
Twinbrook Twinbrook 9:00 - 1:00
Washington Grove Summit Hall 9:00 - 3:30
Watkins Mill Watkins Mill 9:00 - 3:30
Weller Road Weller Road 9:00 - 3:30
Wheaton Woods Wheaton Woods 9:00 - 3:30

Montgomery County Public Schools Office of Shared Accountability
Program Evaluation Unit 40 ELO STEP Evaluation
Appendix E
Table E1. Mean and Standard Deviation of Spring 2018 MAP-P/M (Math) in Grade 2 for ELO STEP
Participants and their Comparison Group
Before ELO STEP intervention
(Spring 2018)
Participants vs.
Nonparticipants N Mean
Standard
Deviation
Mean
Difference p-value
All Students Participants 256 210.4 11.5 0.86 0.37
Nonparticipants 381 211.3 12.0
Non-FARMS All Other Student
Groups (Monitoring Group)
Participants 32 218.8 12.2 -2.19 0.44
Nonparticipants 78 216.6 13.9
Non-FARMS Black or African
American
Participants 26 214.5 12.4 -3.24 0.36
Nonparticipants 36 211.2 14.3
Non-FARMS Hispanic/Latino Participants 23 211.1 9.1 -1.41 0.62
Nonparticipants 40 209.7 11.6
FARMS All Other Student Groups Participants 17 211.6 9.9 2.32 0.46
Nonparticipants 33 213.9 10.8
FARMS Black or African American Participants 50 210.2 11.5 2.01 0.35
Nonparticipants 56 212.3 10.6
FARMS Hispanic/Latino Participants 108 206.8 10.4 1.02 0.43
Nonparticipants 138 207.8 9.8
Table E2. Mean and Standard Deviation of Spring 2018 MAP-P/M (Math) in Grade 3 for ELO STEP
Participants and their Comparison Group
Before ELO STEP intervention
(Spring 2018)
Participants vs.
Nonparticipants N Mean
Standard
Deviation
Mean
Difference p-value
All Students Participants 198 210.7 7.0 1.37* 0.05
Nonparticipants 302 212.1 8.4
Non-FARMS All Other Student
Groups (Monitoring Group)
Participants 22 210.9 5.6 5.17** 0.00
Nonparticipants 62 216.1 9.9
Non-FARMS Black or African
American
Participants 28 210.3 9.9 2.26 0.35
Nonparticipants 22 212.6 6.0
Non-FARMS Hispanic/Latino Participants 20 209.5 6.9 1.26 0.48
Nonparticipants 37 210.8 6.1
FARMS All Other Student Groups Participants 9 213.7 7.5 -0.73 0.82
Nonparticipants 16 212.9 7.7
FARMS Black or African American Participants 37 212.0 6.3 -2.59 0.20
Nonparticipants 39 209.4 10.7
FARMS Hispanic/Latino Participants 82 210.2 6.4 0.95 0.33
Nonparticipants 126 211.1 7.2

Montgomery County Public Schools Office of Shared Accountability
Program Evaluation Unit 41 ELO STEP Evaluation
Table E3. Mean and Standard Deviation of Spring 2018 MAP-P/M (Math) in Grade 4 for ELO STEP
Participants and their Comparison Group
Before ELO STEP intervention
(Spring 2018)
Participants vs.
Nonparticipants N Mean
Standard
Deviation
Mean
Difference
p-
value
All Students Participants 208 225.0 8.9 1.05 0.22
Nonparticipants 298 226.1 10.2
Non-FARMS All Other Student
Groups (Monitoring Group)
Participants 31 231.0 9.0 1.77 0.39
Nonparticipants 64 232.8 9.4
Non-FARMS Black or African
American
Participants 29 222.6 7.9 3.88 0.12
Nonparticipants 30 226.4 10.5
Non-FARMS Hispanic/Latino Participants 21 221.7 8.6 3.41 0.18
Nonparticipants 40 225.1 9.6
FARMS All Other Student
Groups
Participants 26 227.3 9.4 -2.68 0.26
Nonparticipants 35 224.6 9.0
FARMS Black or African
American
Participants 34 224.4 8.0 -3.10 0.13
Nonparticipants 29 221.3 7.9
FARMS Hispanic/Latino Participants 67 223.8 8.2 0.17 0.91
Nonparticipants 100 224.0 10.1
Table E4. Percentage of Students Meeting the Spring 2018 AP-PR Benchmark in Grade 2 for ELO
STEP Participants and their Comparison Group
Before ELO STEP intervention
(Spring 2018)
Participants vs.
Nonparticipants N
% Met
Benchmark p-value
All Students Participants 257 91.8 0.59
Nonparticipants 382 90.6
Non-FARMS All Other Student Groups
(Monitoring Group)
Participants 32 87.5 0.96
Nonparticipants 78 87.2
Non-FARMS Black or African American Participants 26 92.3 0.65
Nonparticipants 36 88.9
Non-FARMS Hispanic/Latino Participants 23 87.0 0.95
Nonparticipants 40 87.5
FARMS All Other Student Groups Participants 17 88.2 0.74
Nonparticipants 33 84.8
FARMS Black or African American Participants 50 92.0 0.63
Nonparticipants 56 89.3
FARMS Hispanic/Latino Participants 109 94.5 0.67
Nonparticipants 139 95.7

Montgomery County Public Schools Office of Shared Accountability
Program Evaluation Unit 42 ELO STEP Evaluation
Table E5. Mean and Standard Deviation of Spring 2018 MAP-R (Reading) in Grade 3 for ELO STEP
Participants and their Comparison Group
Before ELO STEP intervention
(Spring 2018)
Participants vs.
Nonparticipants N Mean
Standard
Deviation
Mean
Difference
p-
value
All Students Participants 198 206.6 9.1 1.47 0.09
Nonparticipants 301 208.1 9.8
Non-FARMS All Other Student
Groups (Monitoring Group)
Participants 22 208.4 7.7 5.53* 0.03
Nonparticipants 62 213.9 10.7
Non-FARMS Black or African
American
Participants 28 209.3 11.0 3.31 0.26
Nonparticipants 22 212.6 8.9
Non-FARMS Hispanic/Latino Participants 20 206.2 11.5 1.58 0.54
Nonparticipants 37 207.8 7.8
FARMS All Other Student
Groups
Participants 9 206.3 9.8 -1.15 0.76
Nonparticipants 16 205.2 8.1
FARMS Black or African
American
Participants 37 207.0 8.8 0.62 0.76
Nonparticipants 39 207.6 8.4
FARMS Hispanic/Latino Participants 82 205.1 8.1 -0.19 0.88
Nonparticipants 125 204.9 9.2
Table E6. Mean and Standard Deviation of Spring 2018 MAP-R (Reading) in Grade 4 for ELO STEP
Participants and their Comparison Group
Before ELO STEP intervention
(Spring 2018)
Participants vs.
Nonparticipants N Mean
Standard
Deviation
Mean
Difference
p-
value
All Students Participants 207 215.0 9.1 2.19** 0.01
Nonparticipants 296 217.2 9.8
Non-FARMS All Other Student
Groups (Monitoring Group)
Participants 30 221.5 8.8 3.18 0.15
Nonparticipants 62 224.7 10.4
Non-FARMS Black or African
American
Participants 29 215.7 9.7 4.11 0.08
Nonparticipants 30 219.8 9.0
Non-FARMS Hispanic/Latino Participants 21 213.3 9.9 3.44 0.16
Nonparticipants 40 216.7 8.5
FARMS All Other Student
Groups
Participants 26 211.2 8.5 3.51 0.13
Nonparticipants 35 214.7 9.0
FARMS Black or African
American
Participants 34 216.8 8.9 -3.96 0.06
Nonparticipants 29 212.9 7.3
FARMS Hispanic/Latino Participants 67 212.9 8.0 1.20 0.36
Nonparticipants 100 214.1 8.5