evaluation of farmer knowledge on cassava brown … · naliendele agricultural research institute...
TRANSCRIPT

T H E O P E N U N I V E R S I T Y O F T A N Z A N I A
&
S O U T H E R N N E W H A M P S H I R E U N I V E R S I T Y
MASTER OF SCIENCE IN COMMUNITY ECONOMIC DEVELOPMEN T
(2005)
E V A L U A T I O N O F F A R M E R K N O W L E D G E O N C A S S A V A
B R O W N S T R E A K D I S E A S E (CBSD ) I N T H E R O M A N C A T H O L I C
C H U R C H D I O C E S E O F T U N D U R U - M A S A S I I N S O U T H E A S T E R N
T A N Z A N I A
HALIMA MALIKI KWIKWEGA

EVALUATION OF FARMER KNOWLEDGE ON CASSAVA BROWN STREAK
DISEASE (CBSD) IN THE ROMAN CATHOLIC CHURCH DIOCESE OF
TUNDURU-MASASI IN SOUTH EASTERN TANZANIA
BY
HALIMA M. KWIKWEGA
SUBMITTED IN PARTIAL FULFILMENT FOR THE REQUIREMENTS OF
THE DEGREE OF MASTER OF SCIENCE IN COMMUNITY ECONOMIC
DEVELOPMENT IN THE SOUTHERN NEW HAMPSHIRE UNIVERSITY AT
THE OPEN UNIVERSITY OF TANZANIA
2005.

i
CERTIFICATION
I Certif y that I have thoroughl y read this project
report and fond i t to be in an acceptable form for submission.
Signature
Date

ii
Statement of copyright
"No part of this Project may be reproduced, stored in any retrieval system, or transmitted
in any means, electronic, mechanical, photocopying, recording or otherwise without prior
written permission of the author or the Open University of Tanzania / Southern New
Hampshire University in that behalf

iii
Dedication
Dedicated to my dear daughter, Hadija Hamza who has suffered a lot for being left alone
with sometimes-unknown people, missing me for most of the time during this course.

iv
Declaration
I declare that, this paper is my own work, and it has not been submitted for the similar
degree in any other university.

V
List of abbreviations
CBSD Cassava Brown Streak Disease CMD Cassava Mosaic Virus Disease CBO Community based Organization OFM Organization Development, Food Security and production for
Market PADEP Participatory Agricultural Development and Empowerment Project NARI Naliendele Agricultural Research Institute FRG Farmer Research Group MATI Ministry of Agricultural Training Institute VTC Village Training Centre VODP Village Oriented Development Project RIPs Rural Integrated programmes TASAF Tanzania social Action Fund SIDO Small Scale Industry Development Organization UTA International Institute for Tropical Agriculture TDV Tanzania Development Vision URT United Republic of Tanzania ASDS Agricultural Sector Development Strategy PRSP Poverty Reduction Strategy Paper GDP Gross Development Product LGRP Local Government Reform Programme LGA Local Government Authority ALP Agricultural and Livestock Policy NAFCO National Agricultural and Food Corporation DADP District Agricultural Development Programme PO- President's Office - Regional Administration and Local Government RALG NGO Non Governmental Organization URT United Republic of Tanzania

vi
Acknowledgement:
I would like to acknowledge the Ministry of Agriculture for giving me permission and funding my studies for the Masters degree in Southern New Hampshire University at the Open University of Tanzania.
I would also like to acknowledge the support given by NRI (Cassava brown streak disease project) i n the Southern zone which enabled me study and work for my project comfortably.
I am especially grateful to my Zonal Director of Research and Development for his kindness, wisdom, encouragement an d support in my ability to complete this work and my studies in general; without him, it would have been difficult fo r me to pursue this course.
I would like to acknowledge the cooperation given by the Roman Catholic Church Diocese of TUNDURU-Masasi: The Vicar General - Father Patrick Mkapa and the Development Director - Father J. Livigha in Masasi distric t for accepting my request to work in this organization for the whole period of my studies. Specia l thanks, goes to the Project leader of OFM, Mr. Steven Mwanache for his assistance and tireless effort s which made it possible for me to come up with this project.
I am also grateful to my supervisors: Dr. Geofrey Mkamilo and Felician Mutasa for their skilful assistance and efforts which made it possible for me to work on this paper; and my instructor, Mr. Michel Adjibodou.
I am also very grateful to my mom, Late farther (unfortunately i t was not possible for him to see the fruits of my studies) and my sisters for their moral and financial support to my life during my studies.
Finally I would like to thank al l who had commented or participated in one way or another in the success of this paper.

vii
ABSTRACT:
Based on needs assessment, education was chosen as the most important farmer's need in
this projec t (OFM ) because farmer s wer e lackin g ne w o r improve d agricultura l
technologies in cassava production. Improved cassava production techniques, it may help
farmers i n OF M area s and th e whol e community in the Zon e lead t o foo d security ,
poverty reduction and improved livelihood in general because cassav a is the main food
and cash crop. The evaluation of farmer's knowledge on cassava brown streak disease in
OFM wa s conducte d i n Jul y 200 4 i n cassava producin g areas of Lind i an d Mtwar a
regions in the souther n zone. This study was intended to establish the curren t farmer' s
knowledge concerning Cassava Brown Streak Disease (CBSD) and its control strategies
so that the author wil l be able to identify the gaps and how can they be covered. It was
found that , the majorit y (98% ) o f respondents wa s awar e o f CBS D an d was abl e t o
recognize the disease's symptoms . I n general about 80% of respondents reporte d to use
some control strategies i.e . about 90 % of respondents i n project area s and 68% in non
project areas whereas i n Namikunda and Maugura (OFM) village s was 47%. Thi s shows
that, much effort i s needed for more dissemination of technologies in the OF M an d the
southern zon e as a whole. Therefore, thi s report wil l becom e helpfu l i n measuring the
benefits o f the training intervention later on .

Table of Content Pag e
Supervisor(s) certification i Statement of copyright i i Dedication ii i Declaration i v List of abbreviation v Acknowledgement v i Abstract vi i
Chapter 1 1
1.0 BACKGROUN D INFORMATION O F THE ROMAN CATHOLIC DIOCESE O F TUNDURU - MASASI 1
1.1 Missio n statement 5 1.2 Objective s 5 1.3 Programme s / activities 5 1.3.1 Programme s 5 1.3.1.1 Sustainable agriculture 5 1.3.1.2 Goat component 6 1.3.1.3 Cashew component 6 1.3.1.4 Organization 6 1.3.2 Activitie s 7 1.4. Assignmen t 8 1.4.1 Proble m statement 9 1.4.2 Objective s 1 0 1.43 Specifi c Objectives 1 0 1.4.4 Expecte d output 1 0
Chapter 2 11
2.0 LITERATUR E REVIEW 1 1 2.1 Theoretica l literatur e 1 1 2.1.1 Importanc e of cassava 1 1 2.1.2 Cassav a brown streak disease Distribution 1 2 2.13 CBS D Sprea d 1 3 2.1.4 Losse s due to CDSD 1 4 2.1.5 Th e power of knowledge 1 5 2.2 Empirica l literature review 1 7 2.3. Polic y review 2 2 2.3.1 Th e Agricultural Sector Vision 2 2 2.3.2 Secto r Growth Targets 2 2

2.3.3 Wh y Agriculture is critical to Poverty reduction 2 3 2.3.4 Missio n of the Agricultural Sector Ministries 2 5 2.3.5 Polic y framework from agricultural Development 2 5 2.3.6 Agricultura l policies 2 6 2.3.7 Agricultura l Related Policies 2 7 2.3.8. Objective s of the Agricultural and Livestock Policy (ALP) ofl977 2 8 2.3.9 Implication s of major reforms for the ASDS 2 9 2.3.9.1 Poverty eradication strategies in Tanzania 3 1
Chapter3 3 7 3.0 RESEARC H METHODOLOGY 3 7 3.1 Researc h design 3 7 3.2 Researc h Approach and strategy 3 7 3.3 Samplin g techniques 3 8 3.4 Dat a collection methods 3 9 3.4.1 Primar y data collection 3 9 3.4.2 Secondar y data collection 4 0 3.5 Dat a analysis methods 4 0 3.5.1 Primar y data analysis 4 0 3.5.2 Secondar y data analysis 4 0
Chapter 4 4 2
4.0 FINDING S 4 2 4.1 Genera l Characteristics o f respondents 4 2 4.1.1 Gende r distribution 4 2 4.1.2 Ag e distribution 4 2 4.1.3 Househol d size and labour force 4 3 4.1.4 Experienc e of fanners in cassava production 4 4 4.1.5 Educatio n levels 4 5 4.1.6 Occupatio n 4 6 4.1.7 Far m areas 4 7 4.1.8 Foo d security and copying strategies to food shortage periods 4 8 4.2 Institutiona l support 4 9 4.2.1 Acces s to agricultural extension service 4 9 4.2.2 Acces s to credit facilities 5 1 4.3 Managemen t o f cassava brown streek disease 5 2 4.3.1 CBS D awareness 5 2 4.3.2 Identificatio n of disease symptoms 5 2 4.3.3 Managemen t o f CBSD by farmers 5 4 4.3.4 Knowledg e on the use of control strategies in OFM 5 4 4.3.5 Us e of control strategies in FRG and OFM areas 5 6 4.3.6 Uprootin g diseases plants 5 7
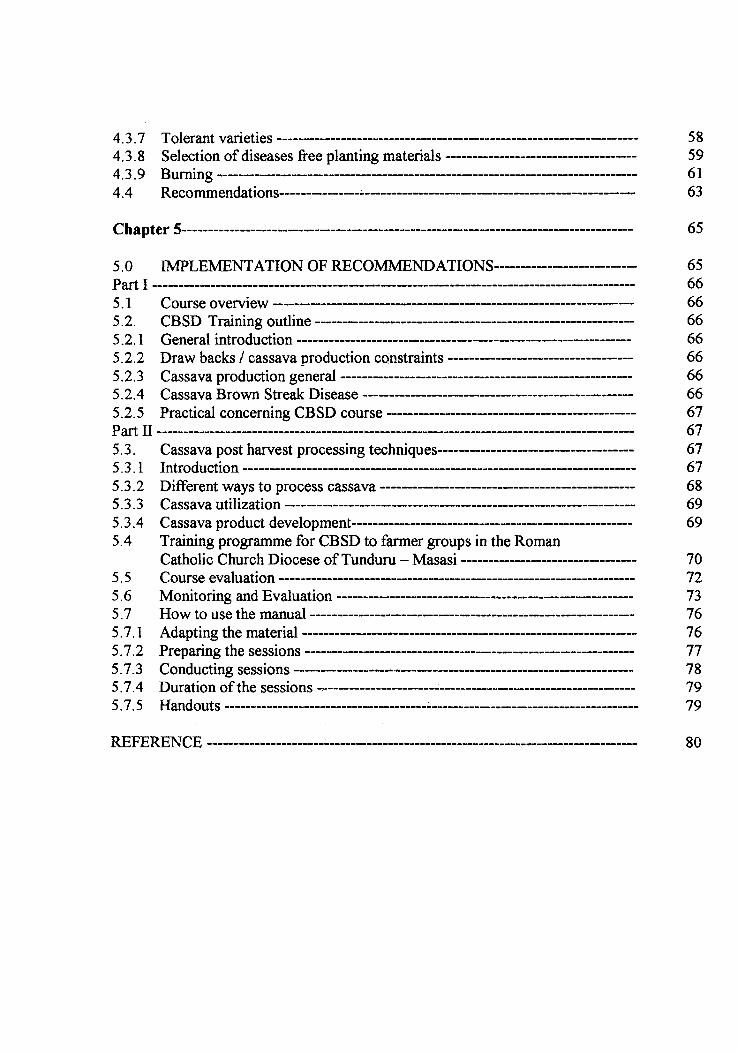
4.3.7 Toleran t varieties 5 8 4.3.8 Selectio n of diseases free planting materials 5 9 4.3.9 Burnin g 6 1
4.4 Recommendation s 6 3
Chapter 5 6 5
5.0 IMPLEMENTATIO N OF RECOMMENDATIONS 6 5
5.1 Cours e overview 6 6 5.2. CBS D Trainin g outline 6 6 5.2.1 Genera l introduction 6 6 5.2.2 Dra w backs / cassava production constraints 6 6 5.2.3 Cassav a production general 6 6 5.2.4 Cassav a Brown Streak Disease 6 6 5.2.5 Practica l concerning CBSD course 6 7 Part II 6 7 5.3. Cassav a post harvest processing techniques 6 7 5.3.1 Introductio n 6 7 5.3.2 Differen t ways to process cassava 6 8 5.3.3 Cassav a utilization 6 9 5.3.4 Cassav a product development 6 9 5.4 Trainin g programme for CBSD to farmer groups in the Roman
Catholic Church Diocese of Tunduru - Masas i 7 0 5.5 Cours e evaluation 7 2 5.6 Monitorin g and Evaluation 7 3 5.7 Ho w to use the manual 7 6 5.7.1 Adaptin g the material 7 6 5.7.2 Preparin g the sessions 7 7 5.7.3 Conductin g sessions 7 8 5.7.4 Duratio n of the sessions 7 9 5.7.5 Handout s 7 9 REFERENCE 8 0

APPENDICES 8 4 Annex I: Organizationa l Structure 8 4 Annex II: Need s identification worksheet 8 6 Annex III: Cassav a Cultivars grown in project and non projec t areas 8 7 Annex IV: Strengths , Weaknesses Opportunities and Threat 8 8 Annex V: A n application letter to the NGO and workplan 8 9 Annex VI: Farme r questionnaire 9 2 Annex VII: Budget/material s 10 1 Annex VIII: Activit y planning 10 2 Annex IX: Stud y area 10 3 Annex X: Trainin g programme 10 4
List of Table
1. Th e distribution of respondents in districts and villages 4 1 2. Househol d characteristics of the study area 4 4 3. Educatio n levels in Mangura and Namikunda 4 5 4. Typ e of skills which are trained to farmers by extension workers 5 0 5. Reason s for not accessing extension services 5 0 6. Reason s for not receiving credits 5 1 7. Diseas e identification in project and OFM areas 5 3 8. Numbe r of symptoms identified by farmers in OFM areas 5 3 9. Contro l strategies as practiced in Maugura and Namikunda (OFM) 5 7 10. Percentag e of farmers growing tolerant and tested varieties 5 9 11. Sourc e of knowledge 6 2 12. Lis t of budget items 7 3
List of Figures
1. Incom e contributed from different sources 4 7 2. Genera l farmer knowledge assessment on control strategies 5 5 3. Us e of CBSD control strategies in project and OFM areas 5 6

1
CHAPTER 1
1.0 Background information of the Roman Catholic Church Diocese of TUNDURU-
Masasi.
The Roma n Catholi c Churc h dioces e o f TUNDUR U - Masas i i s a registere d No n
Governmental Organizatio n (NGO) . I t starte d i n 1988 . I t use s the constitutio n o f th e
Roman Catholi c Church. Organizatio n development, Foo d security an d production fo r
market (OFM) , i s on e o f th e project s i n thi s NGO . Other project s ar e Vocationa l
Education an d Trainin g Authority (VETA ) an d Wome n in Development (WID) . Th e
WID projec t wa s ver y muc h concentrate d i n Tunduru distric t tha n i n Masasi district.
With regard to my field of experience, I was attached to OF M project . M y daily contact
person was OFM project leader .
The OFM with offices a t the Diocese sub-headquarters in Masasi town covered 6 wards,
through Village Training Centers (VTC) , which are located in one village of the ward and
cater fo r th e ward . OF M emerged fro m Villag e Oriente d Developmen t Programm e
(VODP), whic h wa s a projec t tha t propagate d a developmen t polic y tha t aime d
particularly a t th e youn g villag e community . I t wa s funde d b y th e Austria n Donor
formerly Institut e for International e Zusammenerbei t (I1Z ) which late in 2000 merge d
with other co-financiers to form an organization called HORIZONT 3000.
In 199 9 VOD P change d t o Rura l Development Organizatio n fo r Foo d Securit y an d

2
Marketing (RD-OFM). It aimed at bringing about a higher and sustainable productivity of
small farms in order to achieve food security and to be able to market surplus products by
considering two core measures:
(1) The introduction of methods of an organic oriented farmin g syste m - using animal
traction while preserving soil fertility.
(2) Promoting self-reliant rural grassroots organizations that would take up and spread
The innovative measures.
OFM project involves four main areas, which are: sustainable agriculture, goat
component, cashew component and organization.
Organizational structure of the NGO:
The Diocese of Tunduru works in partnership with Horizont 3000All the project activities
under VETA, WID and OFM are coordinated with the Development office or CARITAS.
The VTC serve s as a core from where the farmers ar e attracted and the project activities
are carrie d out an d linked . A Village Steerin g Committee (VSC) , associate d wit h each
center, coordinate s th e projec t implementatio n an d the activitie s organized fo r an d by
three group s o f farmers , namel y th e member s o f th e VTC-association , th e farmer s
participating at the Bes t Farm Competition (BFC) an d members o f the Wome n Group
(WG). Anne x I shows the VTC's and the members o f the farmer groups.
Steering Committee s ru n th e groups ; whereb y additiona l committees , namel y a Goa t
Rearing Committe e (GRC ) an d a Cashe w Growin g Committe e (CGC ) coordinat e th e
different activitie s supporting goat rearing, respective cashew growing in the 3 groups of

3
farmers. The Instructors' Committee deals with practical implementation of training and
is linke d wit h th e VTC-associatio n sinc e th e instructor s ar e member s o f the VTC -
association.
All group s an d committees are informa l institutions . The Village Steerin g Committee
(VSC) of the 3 groups (VTC-association , BF C an d WG) consist s of a chairperson, an
assistant chairperson, a secretary, an assistant secretary and a cashier, since each group is
supposed to raise its own funds from the activities implemented and keep it in the safe at
the VT C building . The GRC, CG C an d instructors' committee are advisory committees
with chairperson, secretary and some members. Each committee meets once per month as
well as the VSC, where all-important matters are brought together.
Chairperson and secretary from each of the 3 group steering committees, OF M projec t
staff, villag e leaders (chairman & secretary), a controller and 2 elders, form the VSC (13
members), which has final implementing power. VSC elect s the chairman and secretary
for instructors ' committee and for the goa t rearin g committee and the VT C an d VS C
elects the members of the cashew management committee. Main tasks of the VSC are:
Approve monthly training and reporting schedule, group's annual planning and budget,
new members, and control group's funds, stock, use of subsidies, etc. Besides, the VSC is
monitoring the work of instructors and presenting reports to the OF M offic e an d other
organizations.
The VTCs are looked at as tools for OFM projec t development while NARI and MATI

4
are ther e for technica l suppor t i n Agriculture in the Souther n zon e o f Tanzania which
when utilized fully may help to improve farmers' foo d security and livelihood in general.
Ownership:
The owne r i s th e Bisho p o f the Roma n Catholi c Diocese o f TUNDURU-Masas i i n
collaboration with the Austrian NGO cluste r Horizont 3000 executed i n Masasi district,
Mtwara region.
Geographical coverage:
Women I n Developmen t (WID ) is very muc h concentrate d i n Tunduru distric t while
OFM i s working in Masasi district, Mtwara region, Tanzania. Masasi district consists of
34 wards, out of which OFM started working in 6 wards in two divisions through Village
Training Centers . Th e VTC s wer e place d i n Maugura , Namikunda , Nanjota ,
Namatumbusi, Mtakuj a an d Mikuva . Vi a each VTC , OF M assists farmer s wh o ar e
members o f the VT C association; farmer s wh o ar e participatin g i n the Bes t Farme r
Competition; and women who join the Women Group. Currently OFM i s operating i n 8
wards. The three new wards are Lulindi, Nandete and Mnavira. The name of villages and
number of members of different farme r groups are as shown in table 3. The total numbe r
of members is about 332 farmers wher e as , ou t of this number 8 9 are females i.e . 27%.
The average age of the members is 40 years. About 93% of the members are married with
the average family size of 3. Table 2 shows that, the project wa s a bit gender sensitive in
its planning although women representation is not very satisfactory becaus e the numbe r
of women is very low compared to men.

5
Therefore, i n order for me to work in this NGO, I had to appl y formally by writing a
letter (Anne x V) to the Vica r genera l I n m y expression, I requeste d a permission to
provide a free consultancy for the whole of my project life (18 months). In so doing I was
accepted an d attache d t o OF M projec t accordin g to m y work experience . Th e OF M
project leade r wa s assigne d t o b e m y contac t person . Thi s was a perso n wh o wa s
responsible wit h man y communit y developmen t activitie s basicall y agricultura l an d
livestock development activitie s as wel l a s other off-far m activitie s like carpentry . His
responsibility was to provide requested suppor t to me.
1.1 Missio n statement:
To ensure food security and raise farmers' incom e by organizing marketing strategies and
strengthening as well as building up grass-root organizations
1.2 Objective s of the organization:
The overall objective was to improv e the livelihoo d securit y for rural communities of
Masasi through their village training centers and particularly members o f farmers group s
in the targeted wards and divisions.
1.3 Programme s and activities
1.3.1 Programme s
The main components of OFM involved were:
1.3.1.1 Sustainabl e agriculture:
OFM als o involved non-member s aroun d the village training centers in the Best Farm
Competition. These non-members were trained in the methods of sustainable-agriculture,
household management , foo d storage , see d ban k an d othe r agricultural-relate d skills .

6
About 300 people have participated in the Best Farm Competitions. I n the competition
the winner s (firs t winners ) were gettin g a heifer, the second an d thir d winners wer e
getting a she goat each , and hoes to all participants. Th e improvement of cashew crop
aimed at raising farmers' income to prevent them from selling their farm produce which
was their food supply to fend for their necessary requirement s lik e school fees, medical
expenses, an d uniforms for their children , etc. Th e methods o f sustainable agricultur e
that involves:
- Oxenizatio n
- Ox-car t making - Compos t Manure Making - Th e use of Sun Hemp - Applicatio n of Contour skill
1.3.1.2 Goa t component - introducing a 'borrow a goat, pay a goat' system within the same groups
1.3.1.3 Cashe w component:
Targeted were small-scale farmers wh o were already organized in active former groups
for the aim of improving their cashew production. Th e intervention aimed at increasing
the cashe w productio n of the grou p members , apar t from technical farming , training
participants i n marketing strategies and far m economic s was emphasized . Smal l scal e
processing of cashew was not proposed since marketing of processed cashew nuts in the
villages was not considered viable.
1.3.1.4 Organization :
The organization aimed at strengthening th e groups. Th e VTC-associatio n wa s to be
further strengthened , i n order to ensure their sustainability . Their experience was to be

7
exploited fo r trainin g an d monitorin g the newl y supporte d groups . Traine d VTC -
instructors assisted in supervising the farmer groups, especially on cashew activities. The
members o f th e farme r group s wer e traine d o n field an d a t institutes , i n farming,
marketing an d grou p buildin g issues . I t starte d wit h emphasi s o n empowermen t o f
farmers for self-reliance by giving more training on group organization, leadership, farm
economics and marketing.
1.3.2 Activities :
These activities include: Group organization - strengthenin g farme r groups in farming
economics and marketing strategies, cashew management and goat rearing activities, and
field days . OF M promotes sustainabl e agricultur e practices , mainl y vi a th e VTC -
association, the Best Farmer Competition and the Women Groups. Farmers are trained on
better an d alternativ e agricultura l techniques , the y receiv e tool s an d input s eithe r
subsidized or as a grant and through competitions farmers are encouraged to apply the
skills. OF M i s working in Masasi district, Mtwara region. Masasi district consists of 34
wards, out of which OF M works in 6 wards through Village Training Centers. Via each
VTC, OF M assist s farmers who are member of the 'VT C association' ; farmers who are
participating in the best farmer competition; and women who join the Women Group.
Activities aim at improving agriculture husbandry and marketing of both food crops and
cash crop s (cashew) , increasin g livestoc k keepin g (ox-mechanizatio n an d goats) ,
developing technical skills and strengthening the organization building. In each center ,
each of the 3 groups has a steering committee for the daily management and additionally

8
3 committee s tak e car e o f th e mos t importan t activities , namel y th e goa t rearin g
committee, th e cashe w managemen t committe e an d th e instructors ' committee . Th e
overall coordination of each cluster happens through the Village Steering Committee.
Products/services:
The farmer s group s ar e traine d i n self-reliance and managemen t relate d training s for
capacity building and group dynamics like farm economics and marketing.
1.4 Assignment :
Based on needs assessment (Annex II) done in OFM, education was chosen as the most
important need of the project. Education is required in order to identify a disease at its
early stages in order to control it. Training is important in order to improve farmers'
skills, knowledge and attitude on CBSD symptoms and its control strategies for increased
cassava production and market.
Based on the farmers' needs assessment conducted in January 2004 it was agreed to start
with farmer evaluation on CBSD knowledge assessment in order to know what farmers
know abou t th e mos t importan t cassav a diseas e an d it s contro l strategies . Thi s wa s
considered to be helpful i n measuring the benefits o f the intervention (training) later on.
Crop diseases were the major farmer's problem in cassava production.
Therefore, m y assignmen t wa s abou t "Evaluatio n of farme r knowledg e o n Cassava
Brown Strea k Diseas e (CBSD ) an d it s contro l strategie s i n th e Organizatio n
Development, Food securit y and production for Market (OFM) project . Th e evaluation

9
has enabled the researcher identify the knowledge gaps. In so doing, some interventions
were also identified i n order to cover the gaps. In the OF M project , nothing has been
done so far concerning the training on how to identif y an d control the disease except
radio news broadcasted by NARI - Naliendele through Radio Tanzania Dar-es-Salaam (6
times i.e. 2 times per program) and Radio Lindi (once per programme). Therefore, a total
of 3 programmes were broadcasted through Radio for creating awareness in CBSD and
its control strategies. These programmes were those concerning: 1. Causes of the disease
(CBSD), 2. Disease symptoms and 3. CBS D control strategies.
In order to have effective disease control strategies there is a need to educate farmers on
how to identify the disease symptoms of both CBSD and CMD (Katinila , 1997 ) so that
uprooting practice as one of the control strategies can easily be done at early stages of the
disease developmen t i n the fields. Mos t farmer s i n OF M area s were stil l confusin g
between the two diseases (CBSD and CMD). Som e disease control strategies have been
identified to reduce the negative effects of diseases. These include the use of disease free
planting material , field sanitation , uprootin g an d varieta l resistanc e (Hillock s an d
Jennings, 2003:230-231; Katinila and Kwikwega, 2001:1).
1.4.1 Proble m statement:
Cassava Brown Streak Disease is a major biotic production constraint of cassava in SE
Tanzania (J.P Legg and M.D. Ray a 1998:17 ; R.J. Hillock s et. al 2001:389 R.J. Hillocks
and D.L. Jennings 2003:225; N.A. Katinila 1997:1; R.J. Hillocks et. al 2001:389; Katinila
and Kwikweg a 2001:1) . I f CBS D i s no t wel l controlle d it ca n cause a cro p loss of

10
between 20 % an d 80% , whic h i s rendere d unsuitabl e fo r huma n consumption . This
disease ca n reach up to 70 % in some fields (Katinila and Kwikwega 2001:1). Previous
researches on CBS D wer e carrie d ou t i n South Eastern Tanzania . Experiment s have
shown tha t CBS D ca n reduc e roo t weigh t an d render s unfi t fo r consumptio n an d
marketing (Hillocks et.al 2001:389; Katinila and Kwikwega 2001:1). Furthermore, Socio-
economic studies were conducted in South Eastern Tanzania (Katinila 1997 ; N Katinila
and Kwikweg a 2001 , Mkamilo et.a l 1998) . Fro m these studie s i t was foun d tha t th e
majority o f farmers (abou t 85% ) were awar e o f the disease , bu t littl e information is
available on farmer's knowledge on CBSD and its control strategies.
1.4.2 Objectives :
The objective of this research was to assess farmer knowledge and control of CBSD in
farmer groups that are working with the Roman Catholic Church Diocese of TUNDURU -
Masasi for improved food security and income to rural communities.
1.4.3 Specifi c Objectives:
1. To assess farmers' knowledg e on cassava brown streak diseas e symptom s and its
control strategies .
2. T o understand the effect o f CBSD on food security and economy.
1.4.4 Expecte d output:
- Farmer' s knowledge level on CBSD wil l be understood
- Knowledg e gaps will be identified for intervention
- Th e effect o f CBSD to food security and economy will be Known .

11
CHAPTER 2
2.0 LITERATUR E REVIEW
2.1 Theoretica l literature review
2.1.1 Importanc e of cassava:
Cassava ( manihot esculenta) i s on e o f the mos t importan t tropica l roo t crop s in
developing countries. It is an important source of carbohydrate i n many parts of the low
and mid-altitude tropics. The crop is widely grown in the tropical regions of Africa, Asi a
and Latin America. Cassava production has increased greatly in Africa during the second
half of the 20th Century (Hillocks and Jennings, 2003:225). The wide adoption of cassava
in much of sub-Saharan Afric a ha s been due to its suitability to traditional farming and
food systems and the socio-economic circumstances of farming communities. The crop is
of particular value as a food security crop because of its tolerance to drought, poor soils
and easy of propagation through ste m cuttings (Leg g and Raya, 1998:17 ; Katinila and
Kwikwega, 2001:1 ; Hillock s et.al . 1996:285 ; 2001:389 ; Hillock s an d Jenning s
2003:225).
Tanzania is the third largest produce r of cassava in Africa an d the estimated cultivated
area in 1993 was 657,000 ha giving an estimated production of 6,833,000 tones. The crop
is most widely grown in the Northwest, particularly around Lake Victoria and along the
coastal plain, especially to the South in Mtwara and Lindi regions. Other important areas
of cassava cultivation are the Indian Ocean Islands of Zanzibar and Pemba and along the
shores of Lakes Tanganyika (Legg and Raya, 1998:17).

12
Cassava is the major crop in South Eastern Tanzania. It is grown as a food crop and is the
most importan t staple . I t i s als o a n importan t cas h cro p i n the region . Cassav a i s
particularly important in South Masasi and West Makonde plateau where 93% and 96%
of households respectively grow cassava. Socio-economic studies conducted in the zone
indicated tha t cassav a occupie s the first place a s a food cro p and secon d plac e afte r
cashew as a cash crop (Katinila, 1997; Mkamilo et.al. 1998:1).
Presently, fresh tuber yield of cassava under farmers' condition s ranges from 5-12 tones
per hectar e wherea s attainabl e yiel d unde r researc h conditio n is abou t 2 0 tones per
hectare. Th e main yield reducing factor was identified to be associated wit h high viral
disease infestations particularly Cassava Brown Streak Disease (Legg and Raya, 1998:17;
Katinila an d Kwikwega , 2001:1 ; Hillocks et.al. 2001:389; Hillocks; Ray a an d Thresh,
1996:285; Hillocks and Jennings 2003:225). Cassava Mosaic Disease (CMD) occurs in
all cassava growing areas of Tanzania.
2.1.2 Cassav a brown streak disease Distribution:
Cassava brown streak disease (CBSD ) i s a viral disease which has been recorded to be
endemic in all East African coasta l cassava growing areas, but restricted to the low and
medium altitudes below 1000 m a.s.l. (Hillocks et.al. 1996; Legg and Hillocks, 2002).
The disease is rarely found above 1000 m a.s.l. although symptoms may be expressed at
altitudes above this if infected cuttings are taken from the coast. The explanation for such
a restricted pattern of distribution is unknown at present bu t is likely to be due to either,

13
or both , th e distributio n of the vecto r an d th e distributio n of alternative host s in the
natural vegetation. At some locations particularly in the Southern zone of the country, the
incidence of CBSD exceeded 20%. Furthe r studies (surveys) in Tanzania have confirmed
that the disease i s endemic along the entire coast with local differences i n incidence due
to altitude , varyin g sensitivity of cultivars and source s o f planting materia l (Hillock s
et.al.2001:389-390; Hillock s an d Jenning s 2003:22 5 Katinila , 1997:1,7 ; Katinil a an d
Kwikwega 2001:1).
2,1.3 CBS D Spread:
The spread o f the diseas e i s mainly through infecte d plantin g materials (Hillock s et.al
1999, Leg g and Raya, 1998). The vector has been identified to be spread through whitefly
(Bemisia) specie s (Persona l discussio n wit h Hillock s 2004) . Result s from field
experiments on disease spread show that the main period for spread in Tanzania is April
and May i n crops planted in January and February. Further spread ceases with the onset
of the dry season. This may be because the plants are no longer attractive to the vector or
the vector disappears i n the dry season. Accordin g to Legg and Hillocks 2002: whitefl y
populations on cassava fields decline almost to zero in the dr y season. I n the Souther n
Zone, afte r severa l season s with lo w whitefly numbers, betwee n Februar y and Marc h
2004 sa w hig h numbers o f whiteflies on cassava , resultin g to a rapid spread o f both
CBSD and CMD. Also by May, cassav a green mite (CGM) damage to the upper leaves of
the cassav a cro p i n Tanzania has usuall y increase d t o th e poin t wher e the y becom e
unattractive to whitefly.

14
2.1.4 Losse s due to CBSD:
CBSD i f cannot be well controlled may cause crop loss because between 20% to 80% is
rendered unsuitable for consumption depending on variety and time of infection (Katinila
and Kwikwega 2001:1). Cassava brown streak disease decreases root weight and patches
of root necrosis, which make roots unmarketable, although the unaffected part s might still
have been suitable for consumption. The disease therefore ha s two effects, on e on total
root yield and one on root quality, which affects marketability (Hillocks et.al. 2001:389).
CBSD can decrease root weight in most sensitive cultivars by up to 70% (Hillocks et. al.,
2001:149). Th e lengt h o f time betwee n th e appearanc e o f folia r symptom s an d th e
development o f root necrosis is a varietal characteristic. In the most susceptible cultivars,
root necrosis may appear within 6 months of planting cuttings derived from symptomatic
mother plants. Som e varieties are tolerant t o CBSD , which may show foliar symptoms ,
but the development of root necrosis may be delayed allowing the ful l yiel d potential to
be realized (Hillocks et.al. 2001:389).
According to Legg and Raya (1998:18), CMD symptom recognition caused no problems,
although th e los s o f lowe r leave s resultin g from drough t stres s sometime s mad e
distinction betwee n cuttin g and whitefly-borne CM D difficult , probabl y resulting in a
slight under estimation of the latter. CBSD symptoms are extremely variable according to
cassava genotype and season, and more difficult to identify than those of CMD since they
are less conspicuous and generally confined to lower leaves. During dry season, CBS D

15
symptoms are most apparent compared to the rainy season. Similarl y for some varieties
symptoms are restricted to the roots. Both CBSD and CMD produce symptoms of foliar
chlorosis, which may be hard to distinguish from each other when the plant is infected by
both viruses and possibly also affected by cassava green mite.
2.1.5 Th e power of knowledge:
Power refers to ability of doing. Power is often conceived as the ability to exert control
over others through the use of strength, authority , or expertise to obtain an outcome on
one's own terms. Knowledge refers to know-how about an object. Knowledge itself is so
wide but people tend to concentrate on some aspects only. Neve r on earth you may find
somebody knowing everything. Knowledg e is held, controlled and generated by different
people in a society. Knowledge can be categorized into two:
1. Rura l peoples knowledge (RPK) or informal knowledge.
2. Scientifi c knowledge (formal knowledge)
That i s why it has been emphasized to activel y involve loca l people in the diagnostic
analysis of priority problems, and in planning and implementation of specific projects .
There are three aspects which affect generatio n when talking about knowledge . Thes e
are: culture , economic s and politics , an d their relatio n in time. Accordin g to Kincai d
(1988), it is believed that knowledge is everywhere but there are situations where things
might change.
There are encouraging signs that development research and development practice are
moving closer together in ways which do empower poor people to control their own

16
development; or to empower the poor and powerless people to increase the control they
can exer t over their own lives , Edwards, 1993; Scoones & Thompson, 1994).
According t o Edwards , 199 3 i t wa s insiste d that , th e fundamenta l kin d o f rational
learning is learning how to live, ho w to see , to experience, to participate in and create
what is of value in existence. Therefor e the use of indigenous knowledge in the research
process wa s emphasize d becaus e yo u canno t understan d real-lif e problems o f othe r
people unless they tell you. Peopl e also should benefit from the use of their information.
In thi s way people will be actively involved in their development process. The purposes
of any research to be relevant are:
1. T o promote the development of poor powerless people around the world.
2. Researc h mus t involv e it s subject s i n som e wa y an d a t som e stag e in
constructing both processes and outputs.
Research is the origin of knowledge. Therefore, it is highly encouraged and emphasized
to use indigenous knowledge in the process of research. Indigenous knowledge should be
valued becaus e i f peopl e ar e involve d from proble m identification , planning ,
implementation and evaluation process, whatever intervention you wil l tell them they will
be ready to accept it because they have participated. I n this way it will be sustainable and
they will fee l that it is theirs or may feel more the sense of ownership. By doing so, the
ability of the poor and powerless people will increase in controlling their own lives .

17
If needs are to be met on a sustainable basis the Earth's natural resources base must be
conserved and enhanced (World Commission on Environment and Development, 1987, p.
57). Therefore , sustainabl e developmen t a s a goa l rejects policie s an d practice s that
support curren t livin g standard s b y depletin g th e produc e base , includin g natura l
resources, and that leaves future generations with poorer prospects and greater risks than
our own. (Repetto , 1986, p. 15).
2.2 Empirica l literature review
Cassava Brown Streak Disease is a major biotic production constraint of cassava in SE
Tanzania (J.P Legg and M.D. Ray a 1998:17 ; R.J. Hillock s et. al 2001:389 R.J. Hillocks
and D.L. Jennings 2003:225; N.A. Katinila 1997:1; R.J. Hillocks et. al 2001:389; Katinila
and Kwikwega 2001:1).
Previous research activities and promotion of developed technologies were done
concerning cassava brown streak disease. Previou s researches on CBSD were carried out
in South Eastern Tanzania. These activities were based on the causes and effects of
cassava brown streak disease on yield and quality of cassava, biology and management of
Cassava Brown Streak Disease, A review of present knowledge and research needs.
The key findings of the previous research or promotion were as follows:
CBSD i s present a t high incidences in cassava fields along the coast of E. Afric a from
Southern Kenya to the Zambezi rive r i n Mozambique. In some areas it is the primary

18
biotic constraint to production and marketing of cassava (Hillocks et.al. 2001; Thresh and
Hillocks, 2003;). CBSD was shown to be a major threat to food security in coastal eastern
and southern Africa, affecting a population of around 20 million people.
The international communit y realized the impact of CBSD o n food securit y along the
eastern seaboard o f Africa. Experiment s have shown that CBSD can reduce root weight
and renders unfit for consumption and marketing (Hillocks et.al 2001:389; Katinila and
Kwikwega 2001:1) . Furthermore , Socio-economi c studie s wer e conducte d i n South
Eastern Tanzania (Katinila 1997 ; N Katinila and Kwikwega 2001, Mkamilo et.al 1998).
From these studies it was found that the majority of farmers (about 85%) were aware of
the disease , bu t little information is available on farmer's knowledg e on CBSD and its
control strategies.
The most susceptible cultivars suffer up to 70% yield loss due to CBSD, but even where
there is no actual loss of root weight, the crop can be completely spoiled by root necrosis
(Hillocks et.al. 2001; Katinil a and Kwikwega 2001).
Farmers report that roots with even a small amount of infection do not dry well and give
an inferior flour. Even a small lesion on a root wil l rende r a crop unsaleable (NR I and
Save The Children, 2004 and Hillocks et.al. 2001).
Research a t NRI and SRI Tanzania, has shown that Cassav a Brow n Strea k Viru s is
transmitted by whiteflies. (Thresh and Hillocks, 2003; Hillocks et.al. 2002; NRI and Save

19
The Children, 2004 and Muruthi et.al. 2004). Field studies on transmission and spread of
CBSD suggeste d tha t periods o f rapid sprea d coincide d with periods o f high whitefly
populations.
Among the man y varieties grown in farmers fields were a few with tolerance to CBS D
root necrosi s (NR I and Sav e Th e Children , 2004) . I n th e secon d projec t th e contro l
measures were developed and a programme o f on-farm research initiated in 8 villages in
Tanzania. Virus-free stock was selected o f several CBSD-tolerant local varieties and the
extent of CBSD in Malawi was established. If CBSD is not well controlled it can cause a
crop los s o f betwee n 20 % an d 80% , whic h i s rendere d unsuitabl e fo r huma n
consumption. This disease can reach up to 70% in some fields (Katinila and Kwikwega
2001:1).
Initial on-farm research int o roguing and selectio n of planting material was abandone d
because of farmers' hostilit y to roguin g and annua l shortag e of planting material . The
project the n focuse d exclusivel y o n disseminatio n o f CBSD-toleran t varietie s
accompanied b y a n informatio n campaig n t o rais e farmers ' awarenes s o f CBS D
symptoms an d availabilit y of tolerant varieties . I n the Souther n Zone of Tanzania, on-
farm validatio n of the toleran t varietie s wa s complete d i n six target villages and th e
emphasis with the farmers groups shifted to community multiplication. In the community
multiplication phase of the project, secondar y school s have also been used, and the plots
form th e focu s fo r inclusio n o f cassav a productio n an d utilizatio n i n th e schoo l

20
curriculum. Teacher s from six schools received trainin g at Naliendele . In addition, th e
CBSD-tolerant varietie s hav e bee n distribute d t o a furthe r tw o village s i n Ruangw a
district at the request of the District Extension Officer. In all these villages the varietie s
have been multiplied and distributed.
Tolerant cultivars have now been identified in Tanzania and Mozambique. Some of these
have been multiplied and distributed to and by farmers (NR I and Save The Children,
2004). On-farm evaluation of the CBSD-tolerant varieties in Tanzania, has shown that
there is high approval among farmers fo r some of them. A cultivar like Kiroba, has
proved very popular with farmers who market their cassava because of its early maturity
and sweetness. An improved variety, Naliendele 34 has yielded well and also has good
culinary characters. The variety release committee as a CBSD-tolerant variety has
approved Naliendele 34. These varieties will provide a temporary solution to CBSD until
the IITA programme comes up with more resistant material. Their main draw-back is
susceptibility to CMDs.
The variety distribution programme has been supported by a communication strategy that
has involved an information leaflet, information posters and radio broadcasts. Extension
officers i n the Southern Zone of Tanzania have received training in all aspects of cassava
production, crop protection and post-harvest utilization.

21
[vii] A number o f different medi a have been used to disseminate knowledg e on CBS D
and its management - poste r in 3 languages fo r Tanzania, Mozambique and Malawi. A
leaflet and radio broadcasts in Tanzania (NRI and Save The Children, 2004).
CBSD project , a s a n interventio n t o th e proble m was introduce d t o som e village s in
different district s of Mtwara and Lindi regions. One of these project activitie s was based
on promotio n an d disseminatio n o f different technologie s throug h th e us e o f toleran t
varieties identifie d a t a n earlie r phas e o f th e project . Thi s i s bein g don e throug h
community multiplication, starting from cuttings provided by the project from virus-free
stocks on stations. Thi s was concentrated t o CBS D projec t areas , selected primar y and
secondary schools.
The projec t ha s use d a numbe r o f medi a t o disseminat e knowledg e e.g . radi o
broadcasting, poster campaigns and information leaflets on knowledge of CBSD (disease
symptoms an d contro l strategies ) amon g farmin g communities . A serie s o f radi o
broadcasts were aimed at farmers, whil e a leaflet an d a poster in Kiswahili was directed
at both farmers an d extensionist. About 4000 leaflets were produced and 50 copies of the
poster were distributed . Trainin g of teachers and inclusio n o f cassava productio n and
processing technology int o schoo l curriculum was done . Furthermore , Socio-economi c
studies wer e conducte d i n Sout h Easter n Tanzani a (Katinil a 1997 ; Katinil a an d
Kwikwega 2001 , Mkamilo et.al. 1998), bu t littl e information i s availabl e on farmer' s
knowledge on CBSD and its control strategies.

22
2.3 Polic y review
2.3.1 Th e Agricultural Sector Vision
As a componen t o f the TD V 2025 , the Governmen t an d stakeholder s i n agriculture
envisage an agricultural sector that by the year 2025 is modernized, commercial, highly
productive and profitable, utilizes natural resources in an overall sustainable manner and
acts as an effective basic for inter- sectoral linkages.
Achieving thes e long - ter m goal s wil l requir e th e existin g subsistence - dominate d
agricultural secto r t o b e transforme d progressivel y int o commerciall y profitabl e
production systems . However , the Agricultura l Secto r Development Strateg y (ASDS )
represented a time slic e of only 5 years (200 2 - 2007) . The primary objective of the
ASDS i s therefore t o create an enabling and conducive environment for improving the
productivity and profitability o f the sector . Thi s wil l serv e as the basic for improved
farm income s and rural poverty reduction in the lon g term, whils t contributing to th e
medium term (2003.5) an d long-ter m (2010) goals of the Povert y Reduction Strategy
Paper (PRSP).
2.3.2 Secto r Growth Targets
The PRS P recognize s the agricultura l sector a s on e o f the priorit y poverty reduction
sectors because of its dominan t role in the economy and the high incidence of poverty in
rural areas. A high rate of sustained, broad - base d growth in the secto r is critical to
achieving the poverty reduction targets set out in the PRSP. These are:

23
• Reductio n of the proportion of the population below the basic poverty line from
48 percent in year 2000 to 42 percent in 2003 and 24 percent by the year 2010.
• Reducin g the proportio n o f rural populatio n belo w the basi c povert y from 57
percent to 49.5 percent by the year 2010.
• Reducin g the proportion of the food poor from 227 percent to 23.5 percent by the
year 2003 and 14 percent by the year 2010.
These are subject to revision, as more up to-date information becomes available from the
surveys being conducted as part of the poverty monitoring master plan.
2.3.3 Wh y Agriculture i s Critical to Poverty Reduction
According to the latest (1991/92) Household Budget Survey in Tanzania, the majority of
the poo r i s foun d i n rura l areas . Wher e agricultur e i s th e mainsta y o f livelihoo d
agriculture as defined in this report, has such a dominant role in the economy that it is the
most critica l o f the sector s that have bee n identifie d a s the priorit y poverty reductio n
sectors i n th e PRS P i n th e lon g ran. Commercializin g smallholder agricultur e an d
accelerating it s growth rate are critica l i n pulling the majorit y o f the rura l poor out of
abject poverty . The ASDS lays the foundation stones for this long run objective but also
proposes interventions with a more immediate impact in rural poverty alleviation through
diversified and increased production and productivity and smallholder agriculture.
The PRSP Progress Report 2000/01 se t growth targets for the agricultural sectors for the
coming five years of:

24
• Increasin g real annual agricultural, GDP growth from 3.6. Percent to 5 per cent by
the yea r 2003 and to 6 per cent by th e year 2005.
• Increasin g real annual growth rate of the livestock component from 2.7 per cent to
5 per cent by the year 2005.
• Increasin g rea l annua l growt h rat e o f the expor t crop s from 6.8 p r cen t t o 9
percent by the year 2005.
However, thes e targets were se t befor e a ful l analysi s o f the constraint s facin g th e
agricultural sector has been completed. Two constraints i n particular create problems of
achieving marked increases i n agricultural productivity in the shor t run. The first is the
predominance o f hand- hoe technology and a relative shortage of agricultural labour in
the rural areas. It will take time to change a significant proportion of farming systems and
/ o r introduc e mechanizatio n o n a sufficientl y larg e scal e t o rais e labo r productivity
significantly. The second constraint is the combination of the on going LGFP, the transfer
of responsibilities from central government to LGAs, an d the current capacity shortages
in LGA s t o manag e an d implemen t thes e effectively . I n tim e thes e move s wil l
significantly improv e the suppor t service s availabl e to farmers , bu t i t i s likel y t o b e
towards sector given the unpredictability of world prices for export commodities.
In th e ligh t of these considerations, a mor e realisti c target for the overal l agricultural
sector was to achieve an average annual range of growth of 5 percent p . a. over the 3 years
period 2005 / 07. If this is broad- based an d accompanied by increased off - far m rural
25
employment opportunities , i t wil l mak e a significan t impac t i n the povert y reduction
targets by the end of the decade.
2.3.4 Missio n of the Agricultural Sector Ministries
The missio n of the agricultura l secto r Ministries , withi n thei r mandates , wil l b e t o
facilitate the growth and development o f the agricultural sector to meet these medium and
long-term targets. This will enable the sector to contribute fully to insuring food security
and povert y reductio n throug h increase d volume s o f competitive cro p an d livestock
products, increase d income s especiall y as smallholde r farmers an d increase d nationa l
income and export.
This will involv e the Government in implementing the necessary institutional , legal, and
administrative and policy changes as well as planning long-term investment programme s
that wil l facilitat e furthe r transformation . Thes e intervention s ar e intende d bot h t o
improve the well being of smallholder farmers and to facilitate the increased participation
of larger private sector businesses i n agriculture. Subsistence and small- scale farmers are
mainly concerned with raising the productivity of their scarce resources, typically labour
and capital, whilst the rate of return on capital is of main concern to commercial farmers
and the private sector.
2.3.5 Polic y framework from agricultural Development
The policy environment is key to agricultural development at two levels. First a favorable
and stabl e macroeconomi c environmen t (primar y th e inflatio n rate , interes t rat e and
exchange rate ) i s a preconditio n t o profitabl e privat e investmen t i n genera l an d i n

26
agriculture in particular. Second , sector specifi c policies have an important bearin g on
agriculture's terms of trade with other sectors of the economy and also on its productivity
and profitability. The ASDS proposes changes in the existing agricultural policy to permit
private agribusines s t o expan d investment s i n primary production directly or through
partnerships wit h smallholders , inpu t distribution , produc e marketing , an d agro -
processing. Thes e polic y change s wil l demonstrat e Government' s sustaine d politica l
commitment t o economi c liberalizatio n i n th e agricultura l secto r an d remov e
uncertainties deterring the private agribusiness sector from spearheading the longer-term
development of agriculture.
2.3.6 Agricultura l Policies
The agricultural sector i s guided by two mai n policies. The agriculture an d livestock
policy o f 199 7 seek s to ensur e that th e directio n and patter n o f development i n the
agricultural secto r meet s socia l objective s an d outputs . Th e polic y emphasize s th e
importance of competitive markets, with the Government providing priority public goods
and services and the conservation of the environment as a rational basis for agricultural
development.
The cooperative Developmen t Polic y o f 199 7 evolve d on the basi s o f experiences in
implementing th e Cooperativ e Developmen t Ac t o f 1991 . I t mark s a chang e from
cooperatives bein g state-controlled institution s to becomin g autonomous an d member -
controlled private organizations. The policy provides the framework for the restructure d
co-operatives to operate on an independent, voluntar y and economically viable basis and

27
to develop into centers for providing and disseminating agricultural inputs, implements
technologies an d information . This will empowe r farmer s t o enhanc e their bargaining
position in the market. Ministries of Cooperatives and Marketing is currently facilitating
consultative meetings among cooperative stakeholders to review the 199 7 policy and the
Cooperative Ac t of 199 1 t o mak e the m mee t th e need s o f stakeholder s eve n mor e
effectively
2.3.7 Agricultur e Related Policies
Several other policies have a bearing in the development o f agriculture. The overall aim
of the National land Policy is promote and ensure a secure land tenure system, encourage
the optima l us e fo r lan d resources , an d facilitat e broad - base d soci o economi c
development without endangering the ecological balance of the environment.
One of the water policy objectives is to establish a multi sector platform and framework
for participator y agreements on the allocation of water use in a coordinated and rational
manner. Thi s will eventuall y ensure that the interest s an d rights of various water users ,
particularly the requiremen t o f catchments, crop s and livestock, are taken into account
during the process of allocating water.
The Nationa l Micro- Finance policy forms the long-term basis for developing an efficient
and effective micro- financial system and provides a framework for empowering farmers
and livestock keepers through access to credit.

28
The Gender Policy o f 2000 aims to mainstrea m gende r issue s i n all aspects of policy
planning, recourse allocatio n and implementation . Specia l attention i s directed towards
ensuring that women have access to land, other productive resources, training and labour
saving technologies. Nevertheless , i t wil l b e importan t unde r ASD S to formulation of
special programmes to enhance women's access to technology, training and credit.
The Governmen t ha s als o enacte d a Nationa l Environmen t policy , whic h lay s th e
foundation for coordinated, multi-sectoral action in this field.
2.3.8 Objective s of the Agricultural and livestock Policy (ALP) o f 199 7
The ALP of 1997 ha s the following as its major objectives:
• Assur e food security for the nation, including improvement of national standards
of nutrition
• Improv e standards of living in rural areas
• Increas e foreign exchange earnings
• Produc e and supply raw materials and expand the role of sector as a market for
industrial outputs
• Develo p and introduce new technologies for land and labour productivity
• Promot e integrate d an d sustainabl e us e an d managemen t o f natura l resource s
(environmental sustainability)
• Develo p human resources
• Provid e support services
• Promot e access of women and youth to land, credit, education and information.

29
2.3.9 Implication s of Major Reforms for the ASDS
The ASDS wil l b e implemented within the contex t o f several other majo r Government
reform programmes, includin g the Macroeconomic Reform Programmes, the LGR P an d
the PSRP.
Adjustment and Structural Reform Programmes began in 1986 with the aim of stabilizing
and putting the economy on a sustainable growth path. They have helped to correct the
macroeconomic imbalance s an d poo r performanc e tha t characterize d th e Tanzani a
economy during the 1980s and first half of the 1990s.
The reform programmes have consequently addressed issues relating to monetary policies
(devaluation, interes t rate , mone y supply) , fiscal policie s (publi c expenditur e taxes ,
subsidies, fiscal disciple ) and trade policies liberalization of markets privatizatio n and
divestiture of state enterprises). Th e current reform programmes are deepening the initia l
reforms made in these areas. The economy is now experiencing positive growth again. In
short a more favorabl e environmen t fo r privat e investmen t an d economi c growth ha s
been put in place and this will need to be sustained.
The impact of the structura l reforms o n agriculture has been profound. The removal of
subsidies ha s ha d a larg e impac t o n inpu t price s an d borrowin g interest rates , which
increased to market determined levels. The liberalization of agricultural marketing led to

30
an increase in product price in the short run, put these later stabilized when they reached
market- determined levels. As a consequence o f trade liberalization and subsidy removal,
the cooperatives ceased to be the sole buyers of crops and suppliers of inputs.
Despite som e initia l an d shor t ru n negativ e effect s o f th e reform s o n agricultura l
development, Th e Government ha s significantl y improved the polic y environmen t fo r
private investment and sustainable agricultural growth in the long term. Crop marketing
has bee n largel y liberalized and privat e traders and farmers ' organization s compete t o
provide marketing services to farmers. Cro p marketing subsidies, except those relating to
the grain operations o f the Foo d Securit y Department i n MAFS, hav e been eliminated.
Input distributio n has also been liberalized as has agricultura l export an d import trade.
Several loss - makin g agricultura l Parastatal, includin g NFC an d NAFCO , ar e i n th e
process o f being privatized or liquidated . The ASD S wil l mak e use o f this favorabl e
policy environment to reinforce the reform programmes long-term effects on agricultural
growth and rural poverty reduction.
These reforms wil l b e particularly critical t o the implementatio n of the ASD S action s
concerning the deliver y of support service s to smallholde r framers, rural infrastructur e
development an d farmer s acces s to financial service s usin g participatory approaches ,
LGAs and the local communities will gradually assume responsibility for formulating the
proposed DADPs implementing ASDS actions , using guidelines to be developed by the

31
lead ministries, assisted by the Planning Commission (SC) and PO-RALG. Th e changes
to the Tanzania Civil Service include:
• Makin g public personnel better resource managers and more accountable through
training.
• Improvin g transparency an d accountability through performance monitorin g and
evaluation.
• Improvin g service delivery under severe budget constraints .
• Restorin g ethics and professionalism in the public service.
• Improvin g structures, systems , wor k environment , compensatio n package s an d
behavioral attitudes and cultures.
The Agricultura l an d Livestoc k Research Polic y o f Tanzania (URT , 1983,1997 ) als o
emphasizes that: "There is a great scope for raising agricultural production through the
application o f both scientifi c and technica l knowledge to loca l condition s an d crops ,
especially if modern knowledge is married effectively with the accumulated experiences
of th e peasan t farmers" . Variou s development practitioner s ar e encouragin g a simila r
approach (Mkamilo, 2004:6; Ponna Wignaraja (2001) Yingy i Qian (2001).
2.3.9.1 Povert y eradication strategies in Tanzania
The strategies might focus on improving or eradication of all the factors, which cause
poverty in Tanzania, following the millennium Development Goals.

32
A growing economy involves elimination of:
• Povert y
• Inequalit y and
• Unemploymen t
The Millennium Development Goals (MDGS) were formulated whereby targets and
indicators were formulated to monitor poverty.
The MDGS are:
1. T o eradicate extreme poverty and hunger
2. T o achieve universal primary education
3. T o promote Gender equality and empowerment fo r women
4. Rechec k child mortality
5. Improv e maternal health
6. Comba t HIV/AIDS, malaria and other tropical diseases
7. Ensur e environmental sustainability
8. Develo p a Global partnership fo r development .
The targeted are:
By 2025 the proportion people living on less than I USD a day and those who suffer from
hunger should be reduced by half.

33
According to Pearce et.al. (1997) gave in implication of development that is to bring a
change that is desirable. Wha t constitutes development depends on what social goals are
being advocated by the development agency, government analyst or adviser. W e take
development to be a sector of desirable social objectives. W e take development to be a
sector of desirable social objectives, it is a list of attributes, which seeds to achieve or
maximize. Th e elements of this sector include:
• Increas e in real income per capital
• Improvement s in health and nutritional status
• Educationa l achievements
• Acces s to resources
• A 'fairer" distribution of income
• Increas e in basic freedoms.
Sustainable development is then a situation in which the development sector does not
decrease over time; i.e. as saying that the rate of change of development over time is
generally positive over some selected time horizon [(dD/dt) is positive]. I f needs are to
be met on a sustainable basis the Earth's natural resources base must be conserved and
enhanced (World Commission on Environment and Development, 1987, p. 57).
Therefore, sustainable development is a development strategy that manages all assets,
natural resources and human, resources, as well as financial and physical assets, for
increasing long-term wealth and well-being. Sustainabl e development as a goal rejects
policies and practices that support current living standards by depleting the produce base,

34
including natural resources, and that leaves future generations with poorer prospects and
greater risks than our own. (Repetto , 1986 , p. 15) .
The social policy will target to the poor people. I t is, therefore, ver y important that we
establish the methodological procedures for the identification of the poor class before we
can identif y the socio-cultural factors i n the process of alleviation of poverty (Omari,
1994).
These methods involve:
1. Identificatio n institutions and the policies they administer.
2. Posin g question that determine whether or not there are services and policies that
care for the sick, disabled, elderly and dependents.
Other steps apart from the two above are as follows:
• Examinin g the strength and weaknesses o f specific policies
• Examinin g the extent to which the state meets people's needs
• Analyzin g the extent, which it contributes to social equality.
Steps to be taken in the process of formulating poverty eradication policy:
In order for the policy to be effective, it should be formulated under participatory basis;
That is to ensure that policies are properly implemented, planning and formulation should
involve as many people as possible especially those who will be affected by the policy.

35
A policy is used to address a problem in a certain community. Socia l policies are used as
control mechanics. Therefore , policies are made in order to bring about social harmony
and peace within a community and organization.
The communities have to contribute on how or cause of action to solve problems.
Therefore, in case someone doesn't adhere to the regulations something must be done to
her/him. It is to a certain extent to which the needs are met or to help individuals and
groups achieve certain objectives, which affect thei r lives and situations, in a sustainable
basis for increasing long-term wealth and well being.
Therefore, socia l policy is an integral part of public policy and that, social policies
contributes towards social community development. Unles s we know who are the poor
and which criteria we use to identify them; any policy directed to the poor for the purpose
of changing them will not succeed development. Certai n social policies evolve
depending on the historical and economic background of the countries concerned.
Policy area s ar e linked . Thi s show s that , socia l polic y shoul d no t b e analyze d o r
discussed in isolation. Als o other policies may not be seen as social or welfare policy but
may lead to a greater contribution to social and economic development.
This research was in line with the Agriculture and Livestock Policy of 1997, which seeks
to ensure that the directio n and pattern of development i n the agricultura l sector meets

36
social objective s an d outputs . Th e polic y emphasize s th e importanc e o f competitive
markets, wit h th e Governmen t providin g priority public goods an d service s an d th e
conservation of the environment as a rational basis for agricultural development. In order
to achieve farmers goals of food security, increased income and sustainable development,
there is a need of abiding to the participatory approaches whic h will ensure community
involvement i n al l development processe s i.e . from proble m identification , planning,
implementation, monitoring and evaluation. It is through this way when farmers will have
sense of responsibility by having things in mind that, all the development processes ar e
theirs. Therefore, i t is my feeling that, this study wil l contribut e towards increased food
production hence improved food security and income by selling the surplus.

37
CHAPTER 3
3.0 RESEARC H METHODOLOGY
3.1 Researc h design:
The target villages were the cassav a producin g ones in Masasi Lindi an d Mtwara rural
districts. Villages were purposively selected jointly by the researcher, the project leade r
and th e distric t extensio n officer s basin g als o o n geographical distributio n and village
accessibility. Eight villages were involve d in the survey . I n so doing, we were doing a
comparison betwee n tw o side s i.e . projec t are a an d OF M area. Thes e village s were :
Ziwani and Mtiniko in Mtwara rural district, Chisegu in Masasi district and Mtua in Lindi
district. Thes e ar e villages , which have been participatin g i n Cassava On-Far m trials
through Farme r Research Group s (FRGs) in collaboration with Naliendele Agricultura l
Research statio n an d extensio n offices . Thes e FRG s wer e establishe d t o facilitat e
research trial s on control of CBSD and multiplication of disease free planting materials .
Other 4 villages were those, which were not under FRG. Maugura and Namikunda were
under the organization (OFM) which I was working with in Masasi district, Mnyambe -
Newala district and Kineng'ene of Lindi urban district (Figurel).
3.2 Researc h Approach an d strategy
For education to take place properly and in order to measure the benefits o f interventions ,
which wil l late r be implemented, we saw the need o f farmer evaluatio n to see what was
their statu s of their knowledge , especiall y o f the mos t constrainin g facto r i n cassav a
production which, was Cassava Brown Streak Disease. To attend the above, a survey was

38
conducted in some villages of Lindi an d Mtwara regions. A survey to evaluate farmer
knowledge was conducted in Maugura and Namikunda villages, whic h ar e unde r th e
OFM in order to know their status of CBSD knowledge in comparison to villages, which
were under CBSD project. This was a big survey from which I was involved, but for the
purpose of this paper what is going to be reported here will focu s on the two villages
under OFM compared to CBSD project areas (Control).
Informal visits to these villages were made in May 2004, where village leaders were met
and introduced on the need for conducting a survey to their villages.
3.3 Samplin g techniques:
Random sampling was done to select farmers in control villages (FRGs) where a sample
of 10 farmers was taken for interviews from each village. A purposive sampling was done
in village s under OF M wher e a sampl e o f 9 farmer s i n Maugura and 1 1 farmers in
Namikunda was taken for interviews from each village.
A total sample of 80 households (80 farmers) were interviewed in 4 villages which have
been participating in CBSD project (On-Farm Research trials) through Farmer Research
Group (FRGs), other 4 villages were those villages which were not involved in on-farm
agricultural research i.e. non FRGs where two of them were under OFM. The FRGs were
used as control groups.

39
3.4 Dat a collection methods:
3.4.1 Primar y data collection
Primary dat a collectio n wa s don e b y usin g a questionnair e (Anne x vi) , which wa s
administered to farmers through individual interviews whereby a household survey was
done. Table I shows the number of respondents in each village. A household survey was
conducted by a team of one researcher an d technicians, extension workers of respective
villages, through interviews by using a semi-structured questionnaire. This was done in
June 2004. A total of 10 days were required for a survey whereby 8 days were for the
actual survey , which was approximately one day per village. Tw o days were used for
traveling and gapping. Each enumerator interviewed at least 2 farmers per day.
Data collected included: Farmer characteristics like se x age years live d i n the village ,
main occupation , marita l status , education , experienc e i n cassav a productio n an d
household size . Othe r informatio n included : Lan d allocatio n fo r differen t crops ,
institutional suppor t (acces s to agricultur e extension service and credi t facilities) , cro p
yields, quantity sold, price, market, distance to the market and time of selling. Also , it
included dat a o n development activities , farmer cro p (cassava) managemen t practices ,
knowledge on cassava brown streak disease and its control strategies. Different sources of
information wer e determined . Othe r types o f data were : type o f cassava grown , and
reasons for growing it was determined.

40
3.4.2 Secondar y data collection
Secondary dat a collectio n wa s don e throug h literatur e review . Thi s wa s don e using
different report s from the CBO, different offices and village councils e.g. resource maps,
seasonal calenda r o f work and web sites . Secondar y data review was done in order to
know the importance of CBSD, spread and distribution of the disease, estimates of crop
losses due to CBSD and the effect o f the disease on food security, what has been done so
far an d policy review.
3.5 Dat a analysis methods:
3.5.1 Primar y data analysis
Since primary data collected was qualitative and quantitative, the qualitative data were
analyzed manually while quantitative data were entered into an SPSS computer program.
The dat a wa s als o code d an d entere d t o th e compute r unde r exce l environment .
Descriptive analysis and proportions were used to summarize primary data. Data analysis
involved descriptiv e statistics such as frequencies, cross-tabulations an d comparison of
means.
3.5.2 Secondar y data analysis
Secondary data gathered durin g literature review were analyzed manually and used to
determine th e desig n an d methodolog y o f th e study . Secondar y dat a wa s analyzed
through using different reports from different offices and village councils.

41
Table 1 : The distribution o f respondents in district and villages.
S/NO DISTRICT S VILLAGE S RESPONDENT S
Males Percen t Femal e Percen t Tota l
1 Mtwara Rural Mtiniko 6 60 4 40 10
Ziwani 8 80 2 20 10
2 Newala Mnyambe 5 50 5 50 10
3 Masasi Maugura* 4 44.5 5 55.5 9
Namikunda* 7 63.6 4 36.4 11
Chisegu 7 70 3 30 10
4 Lindi Mtua 10 100 0 0 10
Kineng'ene 7 70 3 30 10
Total 54 26 80
Mean 67.3 32.7 10
Females: 32.5%
Males: 67.5 %
* Villages under OFM

42
CHAPTER 4
4.0 FINDING S
The author wa s involve d i n a big survey where eigh t villages were involved . For the
purpose o f this paper, man y findings and recommendations wil l mainl y focu s on two
villages under OFM (Maugura and Namikunda) in the NGO, which are the targets of this
paper in comparison to project areas.
4.1 Genera l characteristics of respondents
4.1.1 Gende r distribution :
This survey involved 8 0 respondents. Abou t 5 4 out of 80 farmers (66.5% ) who were
interviewed were men and 26 of them (32.5%) were women (Table 3). Abou t 84% of
farmers were married and 16% were not. Reasons for being single were that, about 31%
of farmers said it was because of migration while 23% said it was due to divorce. Other
reasons include d deaths . I n Maugura and Namikunda , 9 an d 1 1 farmers respectively
participated in the survey where 9 out of 20 farmers (45%) of them were women. This
shows that in OFM areas there was a good representation of women in the study. Also
about 44% of women respondents were heads of households.
4.1.2 Ag e distribution :
1.1 Age distribution and experience in Cassava production:
The age distribution interviews contained people of different ag e groups. The y ranged
from 19 to 75 years old. Th e majority (31%) were those under the range of 36 - 45 years
old, followed by 21% and 18% of interviews lying between 46 - 5 5 and 56 - 6 5 years old

43
respectively. Other s wer e 1 5 - 25 , 2 6 - 35 , 6 6 - 7 5 o f about 11% , 10 % and 9 %
respectively. Th e mean of the age of respondents was about 46 years old (Table 3). Thi s
shows that , thi s i s a n importan t cro p because the majorit y o f the activ e labo r i n the
household was putting more emphasis on the crop. Also this may suggest that old people
were not full y represente d amon g cassava growers . Th e average ag e o f respondents in
Maugura and Namikunda was 41 years old. While that in FRG was 47 years old.
4.1.3 Househol d size and labour force
The mean household was 6 people. Abou t 51% of farmers have 4 -6 people/household ,
followed b y 22% with 1 - 3 people/household an d 15 % with 7 - 9 people/household .
Others (12%) had people ranging from 10 - 1 9 per household. The mean labour force and
the standar d deviatio n were a s shown in Table 3. About 63% of farmers ha d 1 labour
force, whic h implie s that, i f you compare i t with the mea n househol d size , there is a
higher dependence rate , which may contribute to reasons for increasing poverty in the
surveyed villages. I t was assumed that size of the household correlates with the labour
force, but this has been shown that it was not normally the case.

44
Table 2: Household characteristics of the study area
Characteristics Mean Standard deviation
1. Age distribution (years) 46 13.69 2. Education (years of schooling) 6 2.6 3. Years lived in the village 29 15.10 4. Experience in cassava production (years) 15 11.46 5. Household size 6 3.35
Male adults 1.40 0.89 Female adults 1.58 1.19
- Childre n (12 -17 years old) 1.24 1.38 Children (under 12 years) 1.51 1.41
6. Active labour Male adults 1.29 0.75 Female adults 1.48 1.11
- Childre n (12 -17 years old) 0.91 1.22 7. Total farm area (Acres) 8 6.14 8. Farm plots (number of plots 3 1.60 9. Land under cropping (acres) 7 6.18 10. Land area allocated to cashew 3.58 3.63 11. Land area allocated for cassava 2.21 1.88 12. Land area allocated for maize 1.15 1.31 13. Land area allocated for sorghum 0.65 1.14 14. Land area allocated for rice 0.58 0.82 15. Land area allocated for pigeon pea 0.48 0.86 16. Land area allocated for sesame 0.34 0.20 17. Land area allocated for groundnuts 0.26 0.53
4.1.4 Experienc e of farmers in Cassava production:
Above 20% of farmers have an experience in Cassava production between 1- 5 years .
This was followed by the group of farmers of about 19% , 17%, 14% and 9%, with the
experience of 16 - 20, 6 - 10 , 26 - 3 0 and 11 — 15 years respectively, The mean of years
of experience in Cassava production is 15; while the mean of the numbers of years people
lived in the village is 29 years. Abou t 29% of farmers have lived in the village for 31 -
40 years followed by 25% who have lived in the village for 21-30 years, 16% lived for
11 - 2 0 years and 11% lived for 1 - 1 0 years in their villages. Th e rest (19%) have lived

45
between 4 1 - 70 year s in the stud y areas . This shows that farmers hav e experience in
cassava production.
4.1.5 Educatio n levels:
The mean years of schooling were 6 years. The standard deviation was 2.6 years (Table
2). Abou t 60 % o f farmers complete d standar d 7 , followe d b y 15 % who completed
standard 4, whereby 5% reached standard 8 and 4% were standard 3. Onl y 2% had gone
up to secondary school while 13% of respondents ha d no education. I t was shown that
the literacy rate was high to the respondents i n the study area. In OFM areas, the mean of
the years of schooling was 7 years, which shows that most of the respondents completed
primary school education.
Table 3: Education levels in Maugura and Namikunda
Education Namikund a Maugur a Mean(% )
level Frequenc y Percen t Frequenc y Percen t
Standard 7 9 82 7 78 80
Standard 4 2 18 0 0 9
Below 0 0 0 0 0
Standard 4
No education 0 0 2 22 11
Total 1 1 10 0 9 10 0 10 0
From Tabl e 3, i t show s that, the majorit y o f respondents i n OFM area s had primary
school education whereby 22 % had no education and all of them were women. That is, 2

46
women out of 9 had no education. Thi s shows that more women were disadvantaged in
their level s of education. Th e implications of the abov e findings is that, low levels of
education requir e additiona l measure s fo r effectiv e disseminatio n o f knowledg e an d
technological inputs to CBSD and its control strategies.
4.1.6 Occupation :
Farmers in the study areas were involved in different types of economic activities, which
included agricultural production, Livestock keeping, and off farm activities.
About 80% of farmers depen d on agriculture as their source of income by selling crops.
The mos t importan t crop s i n the househol d fo r contributio n o f income were: cashew ,
cassava, maize , sorghum, rice, pigeon peas, groundnuts an d sesame. Figure 1 shows that,
crops i n genera l contribute d abou t 82 % of the tota l househol d income . Cassav a wa s
ranked as the second most important cro p after cashe w in the household by contributing
more incom e compare d t o othe r crops . Cassav a contribute d abou t 21 % of the tota l
income from crops, while cashew contributed about 34%. Cassava contributes about 17%
of the total household income.
Other developmen t activitie s also fel l unde r genera l agricultura l activitie s e.g. anima l
power utilization , cashe w productio n techniques , improve d cassav a productio n
techniques (Research) , See d multiplicatio n an d cassav a pos t harves t processin g
techniques projects . These were mentioned by 68% of respondents.

47
Other sources of income came from livestock selling mainly Chicken (6%) and off farm
activities e.g. Carpentry and Masonry and selling out labour. About 55% of respondents
were involved in off-farm activities .
Figure 1: Income contributed from different sources
4.1.7 Far m areas
The total farm area was estimated to be about 8 acres per household (Table 3). Ou t of
this, the land area under cropping was on average of 7 acres per household, which was
about 90% of the total area. The average number of farm plots was 3 for each household.
About 48% of respondents had 3 -4 plots , 41% had 1-2 acre s while 11% of them had 5

48
- 1 2 plots. The majority (45%) of respondents had a total farm area ranging from 5-10
acres followed b y 38% who had 1 - 5 acres . Th e minority (17%) of farmers ha d farm
sizes ranging from 10.1 to 35 acres. Cassava occupied about 22% o f the land allocated for
different crops.
4.1.8 Foo d security and copying strategies to food shortage periods:
CBSD i s one of the factors, which lead to low cassava production. Other factors include
drought, pest and market problems. CBSD and drought for example may lead to shortage
of cassava planting materials. As a result, fo r the las t season 2003/2004 , some farmer s
couldn't plant cassava due to lack of planting materials and hunger which, was caused by
serious drought . Thi s situatio n force d som e farmer s t o plan t an y plantin g materia l
because selection of disease free planting material was difficult .
During Decembe r - February , mor e tha n 80 % farmer s wer e sufferin g from hunger .
Therefore, in order to get something to feed their families, they had to sell their labour by
doing fieldwork to other s i n exchange ; the y receive d foo d (drie d cassav a chips) , o r
money, which at the end was enabling them to purchase their food.
The implication of this was als o show n in the need s assessment that, farmers di d not
participate full y i n producing their food because most o f their valuable time was spent
looking for food. This was said to be the critical time for weeding. Therefore, they ended
up not weeding their crops, which later led to low crop production.

49
From discussions with farmers, they suggested that, in order for them to participate fully in
food production, they asked for food suppor t during this critical period of the season. This
will mak e them sta y at home weeding their fields instead of going far away looking for
food by selling out their labour. It is through this way farmers fel t that, they may be a bit
sure of harvesting enough food for their families under conducive conditions like weather.
At th e en d of the da y farmers wil l b e helped to break their foo d shortag e cycle , which
appears to be a repeated phenomenon.
4.2 Institutiona l support
4.2.1 Acces s to agricultural extension service:
In general , about 48% of respondents ha d access to agriculture extension services. This
rate is very low compared to the importanc e of agriculture to rura l livelihood an d the
farmer's problems. The frequency o f access to extension services differed for individuals.
About 19 % said have met extension agents twice, 8% once, 8% five times, 5% and 4%
met 4 an d 3 times respectively . Abou t 52 % of respondents hav e acces s t o extension
service.
Type of skills, whic h were trained to farmers , wa s as shown in Table 4. Othe r skill s
included control on storage pests , horticulture , health and childcare, carpentry, tailoring,
economics and record keeping.
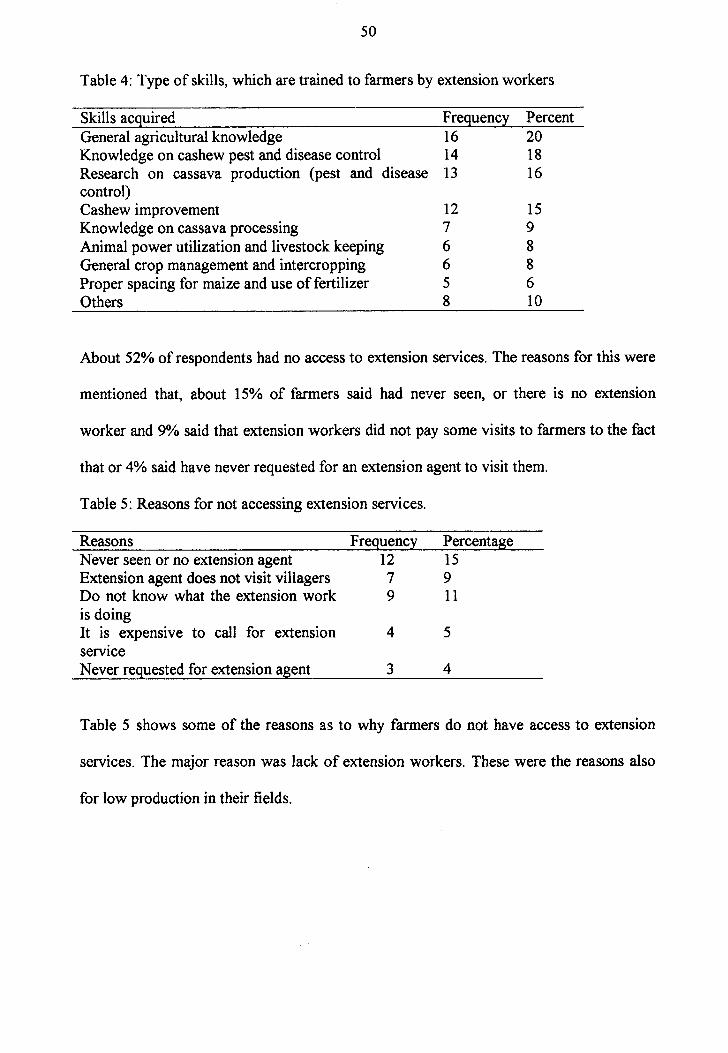
50
Table 4: Type of skills, which are trained to farmers by extension workers
Skills acquired Frequency Percent General agricultural knowledge 16 20 Knowledge on cashew pest and disease control 14 18 Research o n cassav a productio n (pes t an d diseas e 13 16 control) Cashew improvement 12 15 Knowledge on cassava processing 7 9 Animal power utilization and livestock keeping 6 8 General crop management and intercropping 6 8 Proper spacing for maize and use of fertilizer 5 6 Others 8 10
About 52% of respondents had no access to extension services. The reasons for this were
mentioned that , abou t 15 % of farmers sai d ha d neve r seen , o r there i s n o extensio n
worker and 9% said that extension workers did not pay some visits to farmers to the fac t
that or 4% said have never requested for an extension agent to visit them.
Table 5: Reasons for not accessing extension services.
Reasons Frequency Percentage Never seen or no extension agent 12 15 Extension agent does not visit villagers 7 9 Do no t know what the extensio n work 9 11 is doing It i s expensiv e t o cal l fo r extensio n 4 5 service Never requested for extension agent 3 4
Table 5 shows some of the reasons as to why farmers d o not have access to extensio n
services. The major reason was lack of extension workers. These were the reasons also
for low production in their fields.

51
4.2.2 Acces s to credit facilities
Results sho w that 15 % of respondents hav e access to credi t facilities. Th e sources of
credits mentione d wer e communit y development offic e an d SIDO . Thi s i s a smal l
proportion. Although farmers may be aware of the credit facility and they are in need of a
loan but they lack facilitation to access it. Therefore it was found that the majority (85%)
of respondent s hav e no access to credi t facilities. Tabl e 6 shows some of the reason s
mentioned by farmers for not receiving credits was the bureaucratic procedure. Farmers
felt that, there were unnecessary delays, which are caused by poor leadership. Sometimes
farmers do not request for credit because they are afraid o f the failure to paying back the
credit. They feel that, it is even better to get a loan from fello w farmers than any other
sources of credit. Other farmers did not know as to why they did not get credit even after
requesting for it. They just saw other colleagues getting while they did not.
Table 6: Reaso n for not receiving credits. N = 80
Reason Frequenc y Percentag e Bureaucratic procedures 19 24 Unaware 16 20 Lack of acquired collaterals 7 9 Farmer groups are not well organized 7 9 Poor leadership / governanc e o f distric t 5 6 councils Never requested 8 10 Do not know the reason as to why 8 5 Others 30 41

52
4.3 Managemen t of cassava brown streak disease
4.3.1 CBS D awareness:
In general, it was found that about 98% o f respondents were aware and had a problem of
CBSD. Thi s generally shows that most farmers were aware of CBSD disease while 78%
are aware of Cassava Mosaic Disease. The awareness in Maugura and Namikunda village
was 80%.
4.3.2 Identificatio n of disease symptoms:
About 4 % an d 12 % o f respondent s wer e abl e t o identif y on e an d tw o symptom s
respectively. Fo r those who were abl e t o identif y onl y on e sympto m was onl y roo t
necrosis, whic h was s o obvious to them when roots were harvested . Fo r two disease
symptoms, those were mostly mentioning to be root necrosis and stem die back. Stem and
leaf symptoms were also still confusing especially for respondents from non-project areas
and CBO s where CMD and CBSD lea f symptoms were problematic. About 78% and 4%
were abl e to recogniz e all four an d three important diseas e symptom s (root necrosis,
Yellowing of leaves, stem die back and stem lesions) respectively.
In general about 86% o f respondents were able to recognize the root symptoms, 66% of
farmers were able to recognize leaf symptoms. These were the ones who coul d recognize
the disease at early stages hence able to control the disease by uprooting because, this
practice is very important at early stages of plant establishment, i.e. within a month or
two afte r planting. About 52% an d 56% wer e able to recognize stem die back and stem
lesions respectively. I n FRG areas the knowledge on disease symptom was higher

53
compared to OFM-project areas (Table 6). Identification of stem lesions, leaf symptoms
and stem die back was still a problem to farmers in OFM areas. For example about 45 %
of respondents i n OFM area were able to recognize leaf symptoms at early stages of plant
growth compared to 91% o f respondents i n FRGt areas . This shows that, in FRG areas,
farmers can be able to practice disease control measures at early stages e.g. uprooting.
Table 7: Disease identification in project and OFM areas N = 43
Symptoms Frequency Percent Frequency Percent
Root necrosis 22 96 14 70
Yellowing of leaves 21 91 9 45
Stem die back 19 83 4 20
Stem lesion 20 87 7 25
Did not know 0 0 6 30
From Table 7 shows that in all villages farmers were aware of CBSD and even more
familiar with it.
Table 8: Number of symptoms identified by farmers in OFM areas N = 20
Number of
Symptoms
Maugura n = 9 Namikunda n = 11 Number of
Symptoms Frequency Percent Frequency Percent
1 symptom 2 22 2 18
2 symptoms 2 22 1 9
3 symptom 3 33 3 27
4 symptom 1 11 0 0
Did no t know 1 11 5 45
Symptoms FRG area n = 23 OFM area n = 20

54
Table 8 Shows that, about 33% an d 27% o f farmers in Maugura and Namikunda villages
respectively were able to identify 3 CBSD symptoms while 11% and 45% i n Maugura
and Namikund a villages respectively did not know how t o identify disease symptoms.
4.3.3 Managemen t of CBSD by farmers
It has been known that CBSD is a problem to cassava producers for a long time. Farmers
reported that they have been doing defferent practice s in trying to combat the problem.
Control strategies practiced by farmers include d dippin g cassava cuttings into kerosene
oil before planting, destroying plant residues after harvesting and cutting the upper part of
the plant s an d allo w the m t o establis h ne w shoots , shiftin g cultivatio n an d frequent
changing of varieties or planting materials.
The extensio n and research institution in the zone have over time exerted considerable
effort i n sensitizing farmers on the advantages of utilizing CBSD control measures. Five
villages i n the stud y are a reveale d that there were som e promisin g results that were
heading towards adopting of these control measures.
4.3.4 Knowledg e on the use of control strategies in OFM
There ar e abou t fou r recommende d CBS D contro l strategies from researc h wor k by
Naliendele Agricultural Research Institute. These practices are:
1. Us e of disease free planting materials
2. Uprootin g diseased plants
3. Us e o f tolerant varieties
4. Burnin g

55
It was found that, about 44% used tolerant varieties, 54% were uprooting diseased plants ,
70% were using disease free planting materials an d 36% were burning diseased plants .
About 21% of respondents were not practicing any control strategy. At least most farmer s
(80%) were trying to control the disease (Figure 2).
Figure 2: General farmer knowledg e assessment on control strategies
Key:
4 strategie s = Diseas e free plantin g material , uprooting , us e o f tolerant varietie s an d
burning
3 strategies = Disease free planting material, uprooting and use of tolerant varieties
2 strategies = Disease free planting material and uprooting

56
1 strategies = Disease free planting material
About 24% of respondents were using all the control strategies followed b y 20%, 19 %
and 16 % wh o wer e usin g a t leas t on e contro l strategy , thre e an d tw o strategie s
respectively.
4.3.5 Us e o f control strategies in FRG and OFM areas
It was found in this study that, about 90% o f the respondent s in project areas have been
practicing som e CBS D contro l strategie s (Figur e 3 ) while about 45% was reported to
practice CBSD control strategies in OFM areas.
Figure 3: Use o f CBSD control strategies in project and OF M areas

57
Table 9: Contro l strategies as practiced in Maugura and Namikunda.
Control Strategy
Namikunda Maugura Frequency Percen t Frequency Percen t
Tolerant No contro l strategy
Disease free Uproot Burn
0 0 3 2 7 3 2 7 0 0 8 7 3
2 2 2 5 5 6 4 4 4 0 0 3 3 3
Table 9 shows that, in OFM areas, no one was using tolerant tested varieties as a CBSD
control strategy, while , uprooting and burning was mostly practiced in Maugura than in
Namikunda. Fro m m y observation , the reaso n behin d thi s coul d b e that , farmer s i n
Maugura are more active and serious in their group activities compared to Namikunda
farmer group.
4.3.6 Uprootin g diseased plants:
Uprooting was practiced by 54% of the respondents i n the stud y area. I n FRG areas ,
about 83% of respondents was practicing this control strategy while 42% of respondents
in OFM areas was practicing uprooting as a control measure for CBSD.
It was felt that, most of the respondents especiall y in OFM areas , these practices were
mentioned b y chanc e becaus e i n m y experience , fo r som e practice s lik e uprootin g
diseased plants was found to be difficult t o be implemented by farmers even in the project
areas at earl y stages of the projec t becaus e the y fel t that i t was a loss of plants. Thi s
practice ha s bee n wel l an d successfull y practice d wher e school s wer e use d fo r
multiplication o f diseas e free plantin g materia l tha n i n farme r multiplicatio n plots .
Uprooting is very important especially at the early stages of plant growth (within a month

58
or tw o months afte r planting) . At this stage it needs to be done on daily basi s in the
multiplication blocks if possible to ensure cleanliness of planting materials.
Sometimes plants not showing symptoms may carry the virus. As a result, some plants
may sprou t wit h symptoms , although cuttings were taken from plants without visible
symptoms. In this case, i f the numbers of plants with symptoms are few, pull them out at
an early stage and replace with cuttings from other plants with no symptoms.
4.3.7 Toleran t varieties:
In general , about 57% of the respondents reported to use tolerant varieties as one of the
control measures for CBSD. In FRG areas, it was reported that, 78% was using tolerant
variety whil e i n OF M areas ; non e o f the respondent s wa s usin g improve d tolerant
varieties. Th e improve d varietie s wer e Naliendel e 90/034, Kigom a red , Kitumbua ,
Namikonga, Kalulu , Kirob a an d Nachinyaya. Tabl e 10 show that the mos t commonly
grown improve d varieties were Kigom a re d followe d b y Kitumbua , Namikong a an d
Naliendele 90/034 by (46%), 42% an d 40% respectively .
In FR G areas , 80% of respondents o f Mtua villag e and 100 % respondents o f Chisegu,
Mtiniko (100% ) and Ziwani (100% ) villages were growing Kigoma red . About 40% of
Mtua respondents, 83 % o f the respondents from Ziwani and Chisegu (83%); and 100% of
the respondents from Mtiniko village were growing Naliendele 90/34. These farmers were
given th e plantin g material s b y NARI . Generally , i n FR G areas, abou t 78 % o f th e
respondents were growing improved varieties.

59
Mreteta an d Mus a Said i wer e toleran t loca l varietie s and ar e selecte d fo r plantin g in
farmers' fields (Annex III). Musa Said i was a local variety grown in Mtiniko and Ziwani
villages, whil e Mretet a was als o a tolerant loca l variet y commonly grown in Chisegu,
Maugura and Namikunda. About 100 % of the respondents in Chisegu, 80 % in Maugura,
100 % in Namikunda were growing Mreteta and about 100 % of respondents i n Mtiniko
were growing cassava variety called Musa Saidi.
Table 10: Percentage of farmers growing tolerant and tested varieties N = 50
Varieties Frequenc y Percen t Naliendele.90/034 2 0 4 0 Kigoma red 2 9 5 8 Kitumbua 2 3 4 6 Namikonga 2 1 4 2 Kalulu 1 5 3 0 Nachinyaya 1 8 3 6
From Tabl e 10 , i t wa s show n that, Kigom a re d wa s mos t preferre d wher e 58 % of
respondents wer e growin g it, followe d b y Kitumbu a (46%) , Namikong a (42%) an d
Naliendele 90/034 (40%). Kalulu was the least liked in the list.
4.3.8 Selectio n of disease free planting materials:
About 70% of the respondents reported to select disease free planting materials. This was
also a norma l farmer s practic e when selectin g planting materials . I t becam e difficul t
sometimes to do the selection when there was a shortage of planting materials like the past
two seasons for Masasi was dry. Therefore, a farmer planted whatever came in front of
him/her. In this situation, it was noted that practicing this important strategy for controlling
diseased plants becomes impossible under this kind of a situation. Otherwise each farmer

60
would prefe r t o plan t diseas e free planting materials when diseases an d pest s wil l b e
identified. Therefore , i n FRG area s 90% of the respondent s wer e selecting disease free
planting materials while in OFM areas , 50 % of respondents wer e selecting disease free
planting materials.
The criteri a for selectio n were: sweetness , cookabilit y an d fiber content. Othe r criteria
included yield potential, maturity, drought resistance, plant vigor and tolerance to pests and
diseases (CBSD and CMD).
Therefore, eve n those wh o did not mentio n that they used tolerant varietie s or select
disease free planting materials as one of the control measure for CBSD, in practice they
do because the y normall y choose healthier plants which mean s they choos e what has
tolerated the most adverse conditions which are biotic (e.g. pests and diseases) and other
factors e.g . drough t an d Floods . Materia l selectio n is normall y done a t harvest . Th e
responsibility for selection of planting materials was reported to be men's activity.
Experience also shows that, most farmers d o selec t tolerant varietie s and disease fre e
planting materials , other tha n th e teste d one s from research . Fo r example in Mtiniko
village, a variety called Albert, was the most commonly grown variety by all farmers in
the previous years due to its high yielding characteristic and earliness in maturity. Almost
all farmers have abandoned growing this variety due to the fact that, it is highly affected
by CBS D i n such a way that, sometimes 100 % of the field may be infected. The same

61
applies to Chisegu or Maugura village where the most commonly grown variety was a
local type called Mreteta whereby about 100 % of Chisegu respondents were growing it
while 70 % of Maugura respondents als o were growing this variety due to it s tolerant
nature to pests and diseases especially CBSD. Therefore , from this experience, farmers
are doing trial and error in selecting and using tolerant varieties although were not the
improved varieties. Annex III shows some of the common cassava varieties grown in the
study area.
Generally the mos t importan t sourc e of planting material s was from farmers previous
crop, which was mentioned by 61% of respondents followe d b y neighbors (33%) and
21% mentioned Naliendele Agricultural Research Institute (NARI).
Yield:
Results from this stud y also showe d that, there was a differenc e i n cassava yiel d t o
farmers who were using improved varieties and those who were not using local types.
The mea n yiel d o f cassav a t o farmer s wh o use d toleran t varietie s wa s 781k g per
household while those who wer e not using tolerant varieties was 665kg.
4.3.9 Burning :
About 36% % were burnin g the disease d plants . I n m y observation , burning was no t
associated with CBS D contro l but rathe r a s a land preparatio n method where, al l plant
debris have to be burnt. In FRG areas this was practiced by 55% an d 18% i n OFM areas.

62
Source of knowledge
Table 11: Source of knowledge to farmers (N= 80)
Source Frequency Percentage NARI 40 50.00 Extension 24 30.00 Leaflet 35 43.75 Poster 23 28.80 Radio 24 30.00 Farmers 6 7.50 VTC/OF M 14 17.50 Own 10 12.50 experience Other 3 3 8
Table 1 1 shows that the mos t importan t sourc e a s mentioned by 50% of farmers wer e
NARI followe d b y leaflets , Extensio n servic e radi o an d VT C / OF M whic h wer e
mentioned by 44%, 30%, and 17.5% respectively. NARI had access to the CBSD Project
areas where training, leaflets, poster s and radio broadcasting service s were provided to
farmers. Th e VTC/OFM are operating in the two villages (Maugura and Namikunda) of
the study area. About 13.5% o f farmers were using their own farming experience. Other s
reported that , elders experience s wer e ver y helpful in advising farmers base d o n their
tradition and believes e.g. planting time or what should be planted first e.g. from farmers
experience, it was reported that Bambaranuts should not be planted first otherwise it will
not rain leading to drought henc e lo w yield fo r all crops. Other sources included : seed
fairs, farmers' field days, neighbors, village government leaders and newspapers.
The us e o f radi o woul d hav e bee n a ver y goo d sourc e o f informatio n fo r mas s
dissemination of technologies. Radio broadcasting wa s used i n August - Octobe r year

63
2003 for technology dissemination of CBSD contro l strategies but , the results were not
very much promising since most of the farmers said that, they could not hear the news
because mos t o f them did not own radios. Therefore, farmer s preferre d som e training
sessions in villages or conducting educative meetings to villagers rather than using radios.
4.2 Recommendations :
Generally i t wa s learn t that , majorit y o f farmer s ca n identif y roo t symptoms , lea f
symptoms at earl y stages and on stems in FRG area s and OF M areas . Cassava brown
streak if not well controlled may lead to serious food loss between 20% and 80% or low
quality of cassava products hence low price.
Also majority of farmers (80%) reported to use some control strategies to cassava brown
streak disease , whic h are : uprooting , selectin g disease free plantin g materials , us e o f
tolerant varieties and burning. In OF M areas , non of respondents awar e of tolerant and
tested varieties to CBSD from Agricultural research Institute, Naliendele. In Maugura and
Namikunda, farmers were not growing any of the tested varieties. Farmers normally used
their local tolerant varieties . The yield o f cassava to the people who were using tolerant
and tested varieties was high (781kg per household) compared to those who were not using
those varieties (665kg per household).
Therefore, these results shows that there is still a need of putting more effort to sensitize
farmers o n the use of developed cassava brown streak diseas e control strategies through

64
training programmes in order to improve the crop productivity and income to farm families
in Maugura and Namikunda as well as the whole of the Southern Eastern zone of Tanzania.
It was also identified that, farmers are stil l getting low prices for cassava. Therefore more
effort i s neede d t o improv e the valu e o f cassava i.e . eithe r throug h improve d cassava
processing technique s i n orde r t o ad d valu e b y usin g labou r savin g technologies fo r
producing goo d qualit y cassava product s e.g . chips/grate d materials , cassav a flour, o r
through the introductio n of alternative uses of cassava to farmers rathe r than relying on
ugali. This diversification o f the uses will captur e differen t consume r preferences henc e
more market. Togethe r with processing, there is a need of conducting a research on the
economics of cassava production in order to get the clear answers to the production costs
and actual yield per area (Acre/hectare) in the zone.
There is a need of putting more emphasis in other crops also, like pigeon pea and sorghum,
which seeme d t o b e profitable to farmer s i n order to improv e the productio n level and
income per household.
Farmers copying strategies to food shortage brings a continuous vicious circle where food
insecurity is predominantly inescapable thing. Therefore prope r preservation and storage
techniques of all food crops should be emphasized to enable availability and accessibility
of food in an affordable price.

65
CHAPTER 5
5.0 IMPLEMENTATIO N
5.1 Cours e overview
After doing an evaluation of OFM organization, it was identified that, some gaps on
education where farmers were lacking new or improved technologies in cassava
production. NARI have recommended some cassava brown streak disease control
strategies. Therefore, this evaluation will cover the gaps by conducting trainings to the
farming communities in order to disseminate CBSD management strategies . Together
with the training on CBSD, it would be good if farmers will also be taught on the proper
methods on cassava post - harvest-processin g techniques, financial management and
book keeping. This will be targeted to women who are the main food processors in the
household. CBSD is a major constraint to the expansion of cassava processing in several
ways:
1. Los s of varieties with good qualities for processing
2. Patche s of root necrosis may need to be removed from the roots before grating
3. Roo t necrosis impairs the drying process and gives a poor-quality flour (it is said
that even small areas of necrosis can adversely affect the whole root in this
respect)
4. Root s affected by CBSD cannot be sold to processors hence loss of income.

66
This training is aimed at reaching more farmers in parts where the project has been less
active to date. Therefore, in order to cover the above, the training manual is developed
which, will consist of course outline, course content as well as some guidelines on how t o
conduct the course. The outline of the course will be as follows:
PARTI:
5.2 CBS D training outline - THEORY
5.2.1 Genera l introduction
- Objectiv e of the course: "Technology dissemination to farmers"
- Importanc e of Cassava in the southern Zone and its uses.
5.2.2 Dra w backs / production constraints in cassava production
Diseases
( l )CBSD (2)CM D
The majo r drawback in the use of cassava is: -
Cyanogenic compounds (need proper post - harves t processing) and
pests like: mealy bugs, green mites, white flies and storage pests.
5.2.3 Cassav a production general:
Ecology, cassava field management practices , pests and diseases.
5.2.4 Cassav a brown streak disease.
(i) Distributio n
(ii) Losse s due to CBSD
(iii) Ho w ca n th e disease be recognized?

67
(a) O n the leaves
(b) On the roots
(c) On stems.
(iv) Wha t causes the disease ?
(v) Wher e does the infection come from? (Spread)
(vi) Ho w ca n CBSD be controlled? This includes important technologies on
CBSD management strategies i.e. Use of disease free planting materials,
uprooting, Use of tolerant varieties and burning.
NB: Poster s and leaflets wil l be used and distributed to farmers, choir s and
radio broadcasting, planting material will be distributed. This theory part
is expected to take about 12-18 hour s (approximately 3 days).
5.2.5 Practical s on CBSD management strategies
Field practica l to participants to show them how the disease looks like in the field,
and the practice on the control strategies. The practical is expected to take about 2
days.
PART II
5.3 Cassava post-harvest processing techniques
5.3.1 Introductio n
1. Cassava processing
- Understan d the need for processing

68
- Kno w cassava types and their associated products.
2. Objective of post - harves t processing
3. Importance of cassava post - harvest processing.
4. Expected out put/outcome
5.3.2 Differen t ways to process cassava.
1. Factors influencing removal of cyanogens / Critical steps in cassava processing
2. Constrains of Traditional cassava flour.
(i) Tim e factor an d (ii)Qualit y
3. Cassava flour production by using labor saving technologies.
- We are trying to promote 2 improved methods
(1) Chippin g technology
(2) Grating technology
- Understand features of processing equipment.
- How to use/operate the processing machines.
4. Understand simple procedures for cleaning the equipment after use.
5. Storage of Dried cassava i.e. handling of products processed by the machines.
6. Comparison between Traditional cassava chips drying and improved cassava chips
drying.
7. Processing in large scale.
8. Hygiene.
9. Sources and costs of machines.
Source: Intermech Engineering Ltd Morogoro.

69
Costs:
Motorized grater 780,000/=
Motorized chipper 650,000/=
A press 250,000/=
10. Gari making
- Wha t is it? It s importance
- Step s for making gari and its storage
5.3.3 Cassav a utilization
1. For human consumption
2. For livestock feed
3. For utilization in industries
5.3.4 Cassav a product development
- Ho w to prepare different types of recipe from Cassava flour e.g. cakes,
biscuits and chinchins
- Requiremen t / ingredients for different types of products.
- Understan d how to make correct measurements o f the needed ingredients
- Understan d the procedure for preparing different products
Cassava processing in general is expected to take about 7-10 days.
= = =

70
5.4 Trainin g programme for cbsd to farmer groups in the Roman Catholic Church
Diocese of TUNDURU- Masas i
Introduction:
The adoption and implementation of the Structural Adjustment and Economic Recovery
Reforms have led to the shift from the central controls of economy to liberalized market
economy. This has in turn lead to the needs and demands for skills and skilled labour.
The training for farmers among others arose from the study, which was conducted
concerning needs assessment for the NGO in year 2003. The course programme is
designed to address farmer's problems on CBSD in the NGO and the Southern zone in
general. The course is practical oriented and aspects of cassava post harvest handling
techniques, financial management an d book keeping have been incorporated to enable
farmers to work more independently with minimum supervision and to undertake
profitable and sustainable agricultural production,
[i] The training for CBSD management:
Time (Hours): Theor y 18. 5
Practical 31. 5
Total 5 0
Aim:
To teach farmers improved crop production techniques so that they can use the
knowledge and skills in cassava production.
The objective of this course:
To raise or grow cassava crop using modern husbandry practices.

71
In this course, fanners will be shown CBSD symptom s and management of the disease
through different ways like uprooting, use of disease free planting materials and tolerant
varieties to CBSD. Farmer s will get a theory part of i t and more of practical skills will be
acquired from the fields.
[ii] Improved cassava processing and utilization
Aim: T o train farmers on improved cassava processing and utilization technologies
Objectives:
- T o train farmers on preparation of new products from cassava
- T o introduce to fanners improved cassava processing equipment
- T o train farmers on safe and hygienic cassava processing techniques
The trainin g will be conducted through demonstrations on the use of the improved
cassava processing machines and preparations o f different cassava products.
The trainin g on CBSD contro l strategies will enable farmers to know how t o identify
disease symptoms and take appropriate control measures. CBSD i s also known to be a
post-harvest issue in the sense thatit reduces the crop quality. Infected roots if processed
may giv e a farmer a poor quality product. Therefore, farmers need to identify infected
roots so that they can b e isolated from being processed for better quality product.
Improved cassava post-harvest processing techniques, will help farmers add value to
cassava products which will be of high quality and fetch higher prices compared to
traditionally processed cassava.

72
5.5 Cours e evaluation
Purpose: To evaluate the training
Time: 45 minutes
The participant s will need to evaluate the training itself, what they have learnt by
identifying the strengths and weaknesses, which will lead to suggestions for improvement
in later programmes. This will be done at the end of the course despite the fact that,
everyday during the course there should be some sort of evaluations taking place to
improve the course content or procedures and methods used in conducting the training.
In designing the evaluation at the end of the course, one may adopt the format as follows:
o Whic h Topics were most useful?
o Whic h other training aspects of the training were most useful?
o Whic h topics were least useful?
o Othe r comments and observations
Due t o the explanations above the expected duration for the training will be about a
month (30 days) which includes 20 and 10 days for actual training and traveling as well
as other logistics respectively. Two peopl e will be facilitating the training programme. In
order to carry out this programme effectively. There should be some requirements.

73
Table 11: List of budget items
Budget items Estimated cost
Materials 30,446,350
Transport 1,550,000
Food and beverages 1,478,400
Services 90,000
Per diem 1,300,000
Other 3,000,000
Total 37,864,750
A detailed list of equipment can be seen in Annex VII
A time line of activities is also shown in Annex VIII.
5.6 Monitorin g an d evaluation (M&E)
Planning, monitoring and evaluation of development projects are frequently treated as
separate activities and carried out with little or no input from the project participants.
Projects are planned by outsiders, taken to the village where they are implemented, and
after some time outsiders evaluate the project again. This top-down approach to
development has main shortcomings:
o Project s may not be appropriate to the needs of the community since were not
involved in planning,
o Communit y members may not fully understand the purpose of the project and not
feel ownership or responsibility since they were not involved in designing it, and
74
o Evaluatio n and monitoring of project activitie s are often wasteful o f time and
other resources because they are not treated as an integral part of the projec t
implementation process .
Participatory appraisal offers a wide range of techniques, whic h facilitate involvement of
the community in all aspects of the project design , implementation, monitoring and
evaluation. This ensures that the community is empowered an d takes a stronger interest
and larger role in their development activities .
It has been noted from the beginning that the training need came from farmers
themselves. Therefor e farmers were actively involved in the project cycl e which started
from proble m identification and planning. It is expected to be the same in
implementation, monitoring and evaluation. Monitoring is the routine collection, analysis
and use of information about the progress of the project o r activity while evaluation is the
periodic assessment of the extent to which the objectives o f an activity or project have
been accomplished. This shows that the different element s of the project cycle are seen as
integral parts of the whole process and not as isolated activities done by different people .
Seeing M&E as an integrated suppor t to those involved requires:
• Creatin g M&E processes that lead to clear and regular learning for all those
involved in the programme operations .
• Understan d the links between M& E and management functions (esp (especially
decision making).

75
• Usin g existing processes o f learning, communication and decision making
amongst stakeholders as the basis for programme oriented M&E.
• Puttin g in place the necessary conditions and capacities for M&E to be carried
out. These capacities include:
- Huma n capacity for M&E
- Incentive s for carrying out M&E
- Organization/programm e structures
- Informatio n management system s and
- Financia l resources
The ke y parts of the M&E system include:
1. Designin g and setting up the M&E system
2. Gatherin g and managing information
3. Reflectin g critically to improve actions
4. Communicatin g and reporting results
Monitoring will be a continuous process in this programme where progress reports wil l
be written. Final evaluation of the programme will be done 5 years after the training has
been conducted to farmers. This will be planned to take about three to four weeks from
preparation for data collection to report writing and presentation.

76
Data gathering wil l be done through different PR A tools like Review of secondar y
sources, direct observations, and focused group discussions, construction of diagrams,
innovation assessment and use of semi-structured interviews (Annex IX )
Therefore the M&E system is an integrated syste m for reflection and communication that
supports project/programme implementation , so more than the more formal and data -
oriented side of M&E. The tasks of designing and implementing information gathering
and reflective learning processes help to generate insights that help to improve operations
and strategic directions.
5.7 Ho w to use this manual
The course material in this training manual consists of the course outline and the training
programme. I t is important to be clear about the following points regarding adaptation of
the material, preparing yourself for eac h session and the actual conduct of the session:
5.7.1 Adaptin g the material
You shoul d first read through the complete set of session guides and decide what parts of
it ar e appropriat e fo r the particula r group whom you are to train. It i s possible, though
unlikely, that the complete course can be run as outlined in the guidelines, without any
modifications excep t fo r the obviou s changes to names and currency . I t i s more likel y
that:
- only certain sessions or parts of sessions can be used
- modifications will have to be made to the sessions which will be used

77
- som e entirely different session s wil l hav e to be included , to cover topics which hav e
been omitted from this guide.
Think of locally familia r example s to illustrate the points made during the session , and
make a note of them in the margi n of the sessio n guide. Do not treat this manual as a
book which should be respected an d taken as the sourc e of everything you need; it is a
resource, t o use o r not to us e a s you think fit, and you should 'make i t your own' by
writing in it, adding to it and, eventually, discarding it because you might have developed
your own personal manual/material which is fully appropriat e fo r the group with whom
you are working.
5.7.2 Preparin g for the sessions
Equipment
The only equipment yo u really need i s a blackboard. The handouts, suitabl y modified,
should be typed and duplicated before the course begins, and this can be done by a local
printer or typing service if you do not have suitable facilities at your institution.
The sessions where smal l group preparation i s suggested shoul d be used no t only to
teach the topics which they cover but also as an opportunity to develop participants' self-
confidence an d ability to make effective presentation s Elaborat e educational equipmen t
such as a video recorder i s useful, but by no means essential, and it can form a barrier
between the participants and the instructor. A well managed participative learning session
held under a tree without even the benefit o f tables and chairs can be a great deal more
effective than a poorly-managed session using all sorts of equipment!

78
5.7.3 Conductin g the sessions
At the beginning of each session you should have a clear idea of the conclusions to which
you wish to lead participants, but you must also be ready to follow a quite different line i f
this appear s appropriate . A t the en d o f the session , participants shoul d feel that they
themselves have produced whatever conclusions they have reached. You, the trainer, wil l
have don e you r jo b wel l i f your ow n contributio n ha s bee n tactfull y t o stee r th e
participants, while they feel that they are in fact in charge.
Ensure that every participant understands what is being said; some women learn without
making any personal contributions, while others tend to dominate the sessions , without
themselves learning anything. It is your task to moderate the proceedings, so that every-
one gets an opportunity to contribute, and those who do not understand, and are too shy
to admit it, are identified and assisted as needed.
When dividing the group into smaller subgroups, be sure that everyone has a chance to
learn and to contribut e her views. When participants are working in groups, i t is par-
ticularly important to ensure that any figure work is not done by one member who already
has the necessary skills , while the others learn nothing.
Some trainers believe that participative sessions such as these are far easier for them than
traditional lectures, because most of the ideas are elicited from the participants rather than
being stated by the trainer. They are wrong; sessions such as these require more rather

79
than less preparation i f they are to be effective. The trainer must have the confidence to
admit that she/he, too, can and must learn , with the participants, rather than pretending
that she knows everything and they must only learn from her.
5.7.4 Duratio n of the sessions
Each session guide gives the estimated duration of the session, based on our experience.
When you prepare a session you should split it into its different steps and activities, esti-
mate the time for each of these steps, allow enough time for questions, discussions, group
work and report-back. Take the total of your estimates as being the time for each session,
rather than relying on the times given in the manual.
The actual timetable must, of course, be designed to be convenient for the participants
who are attending the course. Every trainer must put together a timetable herself which
fits the material she proposes to use, and, more important, fits into the time that the group
have available.
5.7.5 Handout s
Summary handout s ar e include d after mos t sessio n guides . Thes e shoul d be suitably
changed where necessary , reproduce d an d distributed to participant s a t the end of the
session to which they refer.

80
REFERENCES:
C.K. Omari (1994). Socia l and Cultural Factors influencing Poverty in Tanzania.
David Pearce, Edwar d Barbier and Ani l Markandy a (1997). Sustainabl e Developmen t
Economic and Environment in the third world.
Hill, Michae l 1980 , pp 1 - 3 . Understanding socia l policy. Basil Blackwell and Martin
Robertson Ltd, Oxford.
Hillocks, R. J., M. D . Raya, J. M. Thres h (1996): The association between roo t necrosi s
and abovegroun d symptom s o f brown streak virus infection of cassava i n souther n
Tanzania. Int. J. Pest Manag. 42, 285-289.
Hillocks, R . J. , M. D. Raya, J. M. Thresh (1999) . Factor s affectin g th e distributio n
spread and symptom expression of cassava brown streak disease in Tanzania. Afr. J.
Root & Tuber Crops 3,57-61.
Ian Scoone s an d Joh n Thompso n (1994) . "Knowledge , Power an d Agricultur e -
Towards a Theoretica l Understanding" . I n Beyon d Farme r First ; Rura l People' s
Knowledge, Agricultura l Researc h an d Extensio n Practice, Intermediat e Technologies
Publications, London.
Integrated Communit y Development programm e (ICDP ) Strategi c pla n 200 4 -2015 .
Masasi togethe r programme . A proposa l submitte d t o th e Britis h Executiv e service
Overseas For joint partnership an d cooperation.
Jamaica Kincaid (1988.) "A small place" from A Small Place Virago, London.
Integrated Communit y Development programm e (ICDP ) Strategi c pla n 200 4 -2015 .
Masasi togethe r programme . A proposa l submitte d t o th e Britis h Executiv e servic e
81
Overseas For joint partnership and cooperation .
Legg, J. P., M. D. Raya (1998): A survey of cassava virus diseases in
Tanzania. Int. J. Pest Manag. 44, 17-23.
Michael Edwards1993. How relevant i s Development Studies ? i n Frans 1 . Schuurman ,
ed. Beyond the Impasse : New Directions in Development Theory , Zed Books, London
1993. Chap 3.
Mkamilo, G.S. ; Raya , M.D.; and Pwelle, J.W. (1998). Socio-economic study o n cassav a
virus diseases in the Southern Tanzania .
Mtwara Region, Tanzania. Project proposa l submitted to HORIZINT3000, Austria, April
2003June - Decembe r 2003. OFM II Diocese of Tunduru - Masasi
Nathaniel Katinil a and Halima Hamza (2001). Socio-economi c assessment of Cassava
brown strea k diseas e managemen t strategie s i n selecte d village s o f Lind i and
Mtwara regions, Tanzania .
N.A. Katinila (1997). Socio-economic survey of cassava virus diseases in the Souther n
Tanzania.
Nichols, R. F. J. (1950): Th e brown streak disease of cassava: distribution , climatic
effects and diagnostic symptoms. E . African Agrie . J. 15, 154-160.
Organization Development, Foo d security and Marketing; second phase, Masasi District,
Mtwara Region , Tanzania . Projec t proposa l submitte d t o HORIZINT3000 , Austria,
April 2003
Progress repor t fo r th e periods : Januar y - Jun e an d Organizatio n Development , Foo d
security and Marketing; second phase, Masasi District,

82
Ponna Wignaraja 2001. Rethinking Development and Democracy
Progress repor t fo r th e periods : Januar y - Jun e an d Organizatio n Development, Foo d
security and Marketing; second phase, Masasi District, Mtwara Region, Tanzania. Project
proposal submitted to HORIZINT3000, Austria, April 2003June - Decembe r 2003. OF M
II Diocese of Tunduru - Masas i
R.J. Hillocks , M.D. Raya, K. Mtunda and H. Kiozy a (2001). Effects o f Brown strea k
disease on yield and quality of cassava i n Tanzania. J.Phytopathology 149,389-39 4
R.J. Hillock s and D.L . Jenning s (2003) . Cassav a brow n streak disease: a revie w o f
present knowledg e an d researc h needs . Internationa l Journa l o f Pes t Managemen t
49(3) 225-234
Storey, H. H . (1936): Virus diseases of East African plants . VII. A progres s
report on studies. E . African Agricult . J. 2, 34-39.
Repetto, R . (1986). Natura l Resources Accountin g in a Resource Base d Economy;
An Indonesian cas e study, Washington, DC World Resources Institute.
The Hon . Benjamin Willia m Mkapa , o n 21 s t December , 2001 . Th e speec h t o Th e
President o f the united republic of Tanzania at Maugura village training centre.
URT (Unite d Republi c o f Tanzania) , 1983 . Th e Agricultura l policy o f Tanzania .
Ministry of Agriculture, Government printer, Vol . 17 , Dar-er-Salaam, Tanzania.
URT (United Republic of Tanzania), 1997 . Agricultural and livestock policy.
Yingyi Qia n 2001 . Ho w Refor m worke d i n China . Departmen t o f Economics .
University of California, Barkeley, CA 94720-3880 .

83
World Commissio n o n Environmen t an d Developmen t (1987) . Ou r Commissio n
Future (The 'Brundtland Report'), Oxford University Press.
The United Republic of Tanzania, 2001. Agricultural Sector Development Strategy.