evaluation of how o&m costs vary for alternative flood control strategies€¦ · ·...
TRANSCRIPT

Evaluation of How O&M Costs Vary for Alternative Flood Control Strategies
Fargo-Moorhead Diversion Channel
ASFPM Conference June 13, 2013
Matt Redington, PE
Jeremy Cook HDR Engineering

Red River of the North Watershed
• Insert map showing Red River Watershed and various states • Get this map from Ted Shannon HMS project
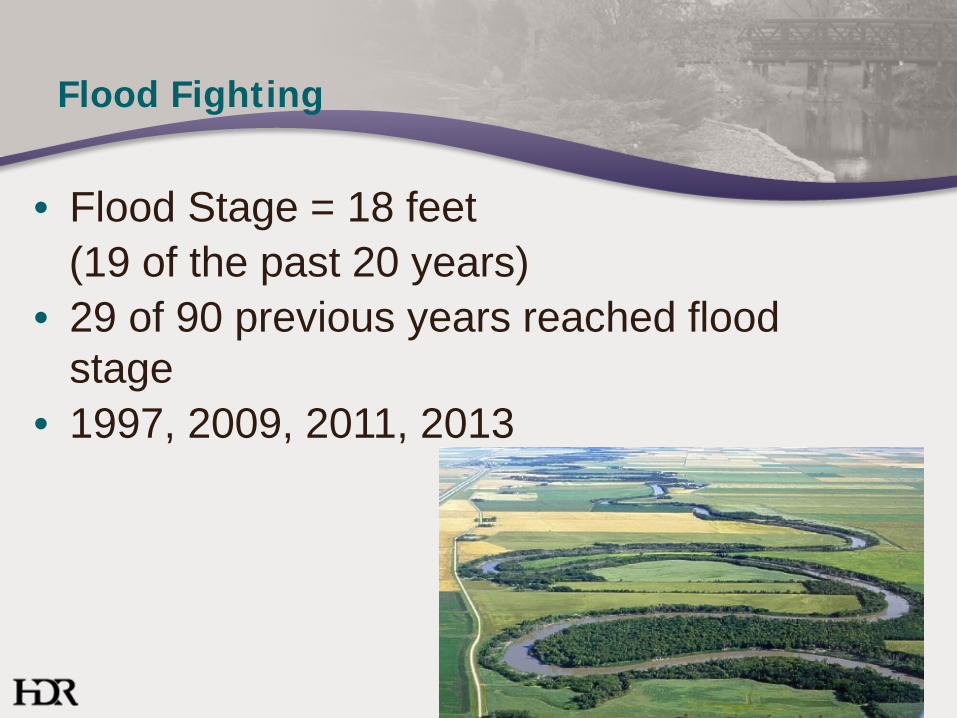
Flood Fighting
• Flood Stage = 18 feet (19 of the past 20 years) • 29 of 90 previous years reached flood
stage • 1997, 2009, 2011, 2013

Fargo and Moorhead
Moorhead, Minnesota Fargo,
North Dakota
Red River

Red River Valley Flooding

Regular Flood Fighting

The Fargo Arena

Diversion Project Features
Channel
Storage
In-Town Improvements • Buyouts • Levees • Interior drainage • Pump stations

Fargo-Moorhead Diversion Channel Is a Monumental Effort
Total Cost: $2 Billion USACE O&M Estimate: $3,559,000
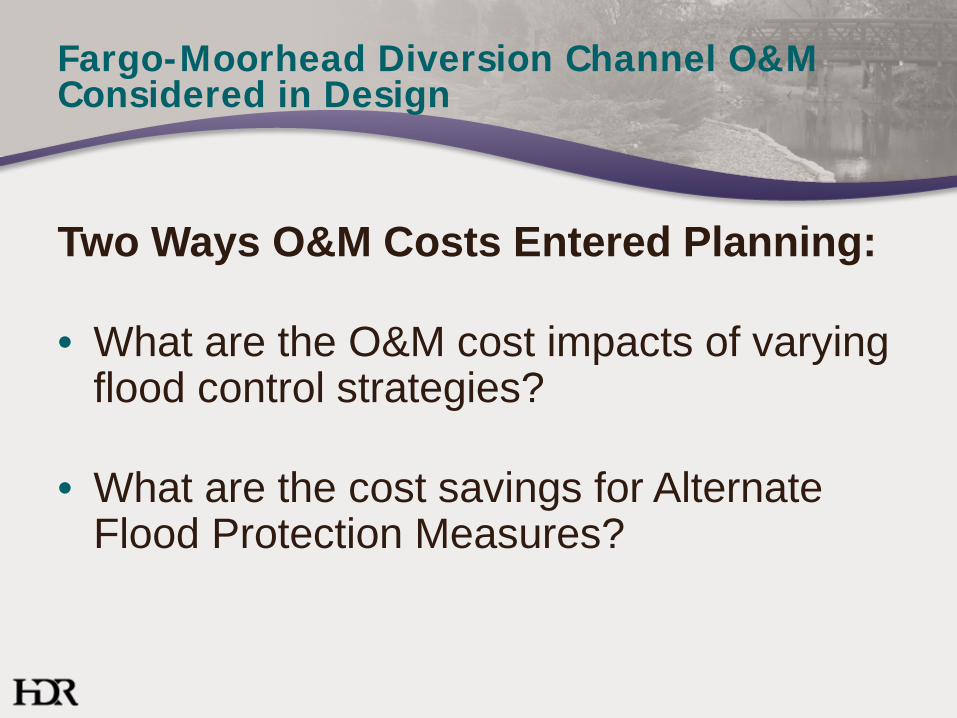
Fargo-Moorhead Diversion Channel O&M Considered in Design
Two Ways O&M Costs Entered Planning: • What are the O&M cost impacts of varying
flood control strategies?
• What are the cost savings for Alternate Flood Protection Measures?

Operations Defined
• Inventory • Administration • Inspections and Monitoring • Public Communications • Heavy Equipment and Generators • Supply and HR Management • Temporary Levees • Sandbagging

Operations Defined
• Revenue Losses – Campgrounds Admission – Golf Courses Greens Fees – Athletic Facility Fees

Maintenance Defined
• Clean up: – Streets – Open spaces
• Repair: – Levee Embankments – Roadway Embankments – Topsoil and Turf Repair – Ditch cleanout – Debris Removal

Maintenance
Clean up Paved Surfaces • Linear Feet of Street • RS Means

Maintenance
Clean up Open Space • Assumed crew • Estimated wages • Assumed acres/hr

Maintenance
Roadway Embankment Repair Ditch Cleanout and Debris Removal

Calculating Operations Costs
Existing Conditions Proposed Alternatives
FEMA Cost Data
Cost Curves Economist

Constructing Cost Curves
Insert Figures 2 and 3
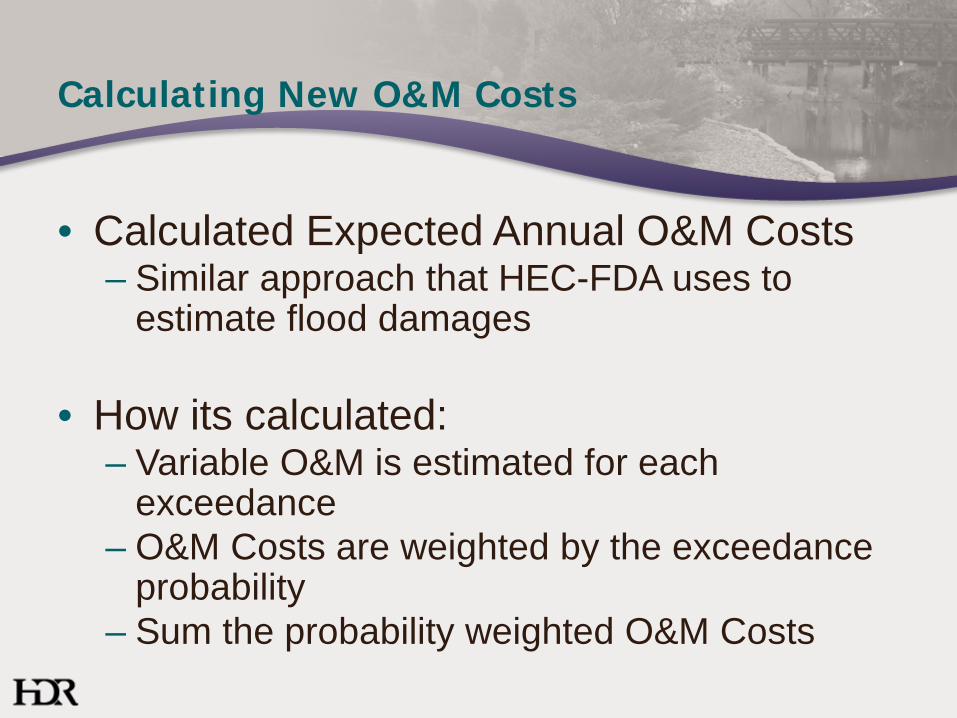
Calculating New O&M Costs
• Calculated Expected Annual O&M Costs – Similar approach that HEC-FDA uses to
estimate flood damages
• How its calculated: – Variable O&M is estimated for each
exceedance – O&M Costs are weighted by the exceedance
probability – Sum the probability weighted O&M Costs

$’s O
&M
Exceedance
0.5 0.2 0.1
Exceedance and O&M Cost Curve
Expected Annual O&M is the sum of the O&M Costs weighted by the exceedance probability across the curve
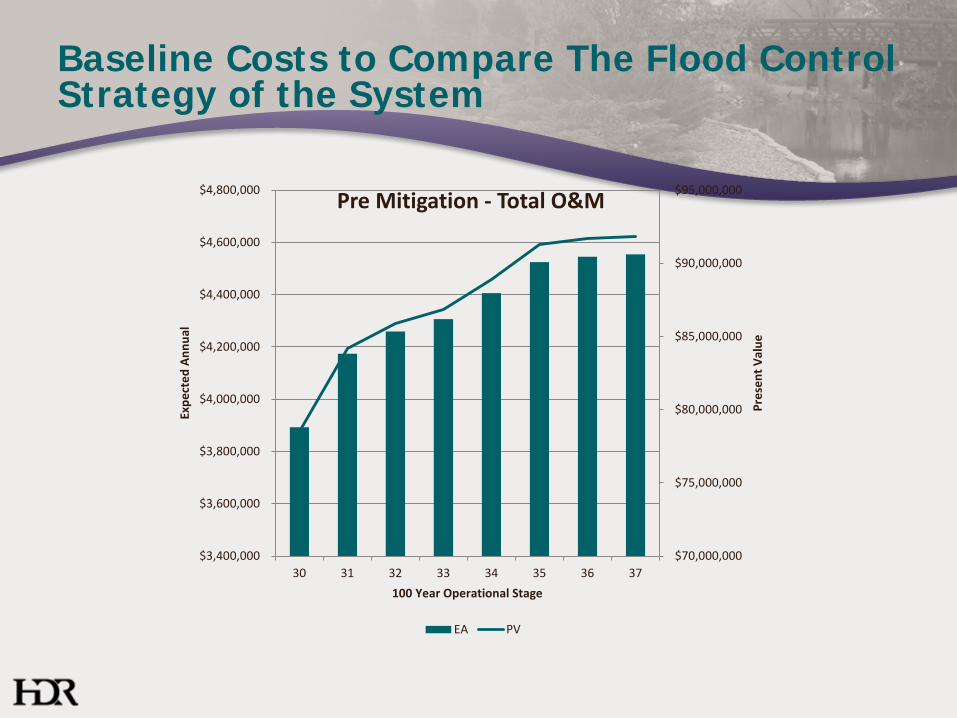
Baseline Costs to Compare The Flood Control Strategy of the System
$70,000,000
$75,000,000
$80,000,000
$85,000,000
$90,000,000
$95,000,000
$3,400,000
$3,600,000
$3,800,000
$4,000,000
$4,200,000
$4,400,000
$4,600,000
$4,800,000
30 31 32 33 34 35 36 37
Pres
ent V
alue
Expe
cted
Ann
ual
100 Year Operational Stage
Pre Mitigation - Total O&M
EA PV
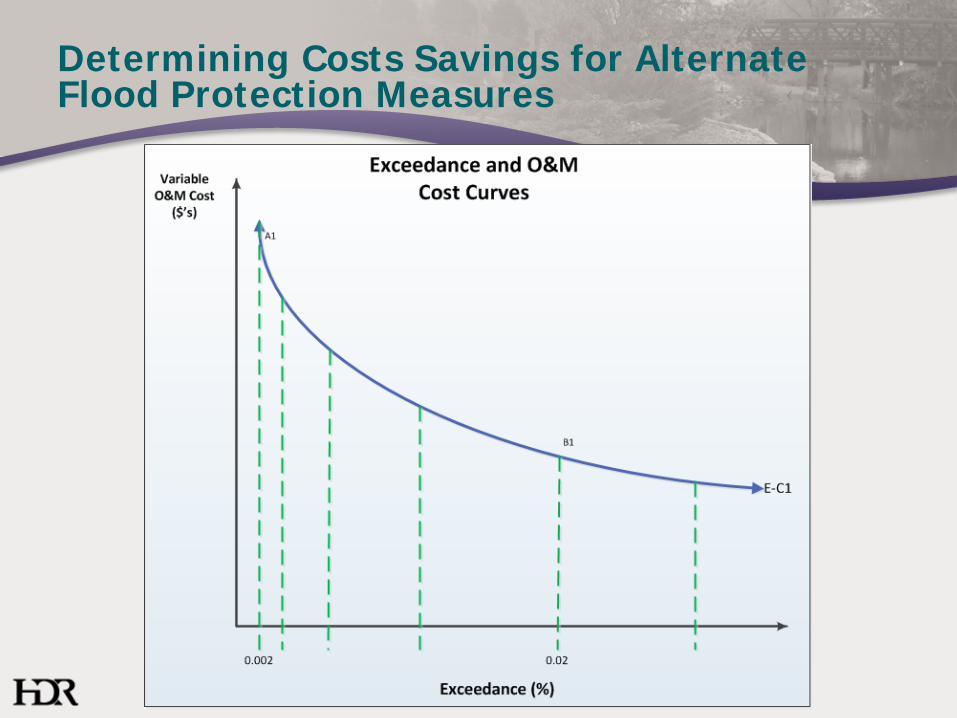
Determining Costs Savings for Alternate Flood Protection Measures
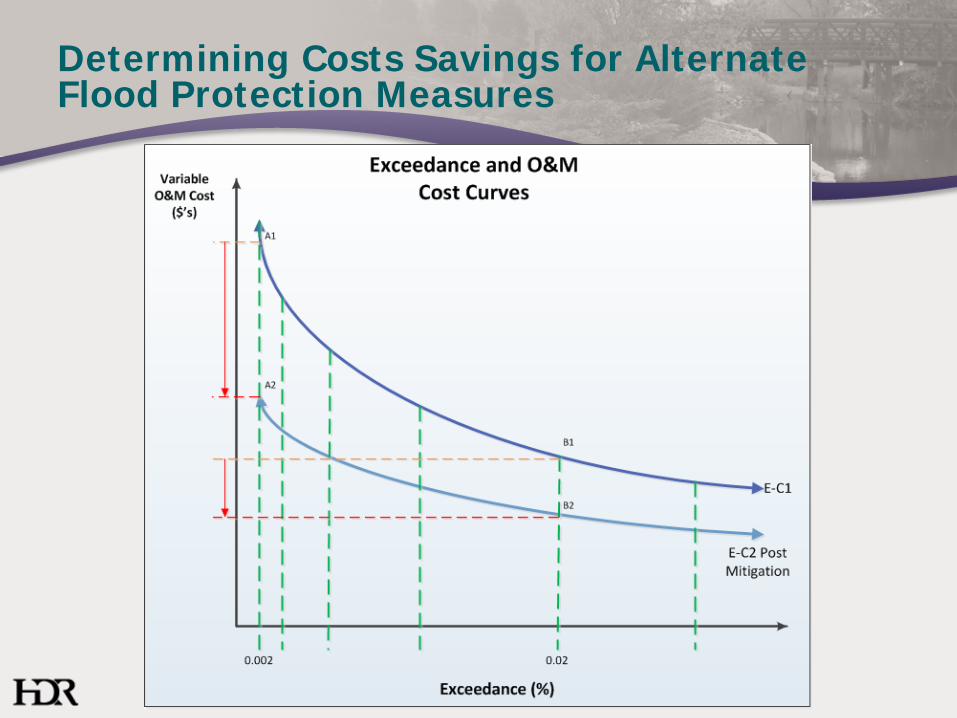
Determining Costs Savings for Alternate Flood Protection Measures

Determining Costs Savings for Alternate Flood Protection Measures
Stage
Before Mitigation
With Mitigation Option 1
PV O&M Cost ($ Millions)
PV O&M Cost ($ Millions)
% Reduction
30 78.53 78.40 -0.2% 31 84.19 83.34 -1.0% 32 85.91 84.27 -1.9% 33 86.85 83.77 -3.6% 34 88.87 84.25 -5.2% 35 91.25 84.96 -6.9% 36 91.68 84.90 -7.4% 37 91.86 84.84 -7.6%

Summary
• O&M costs should be a design consideration
• Alternate flood control strategies can result in varying O&M costs
• Historical flood fighting data can be a useful tool for proposed conditions

Questions?

Extra photos for incorporation into presentation
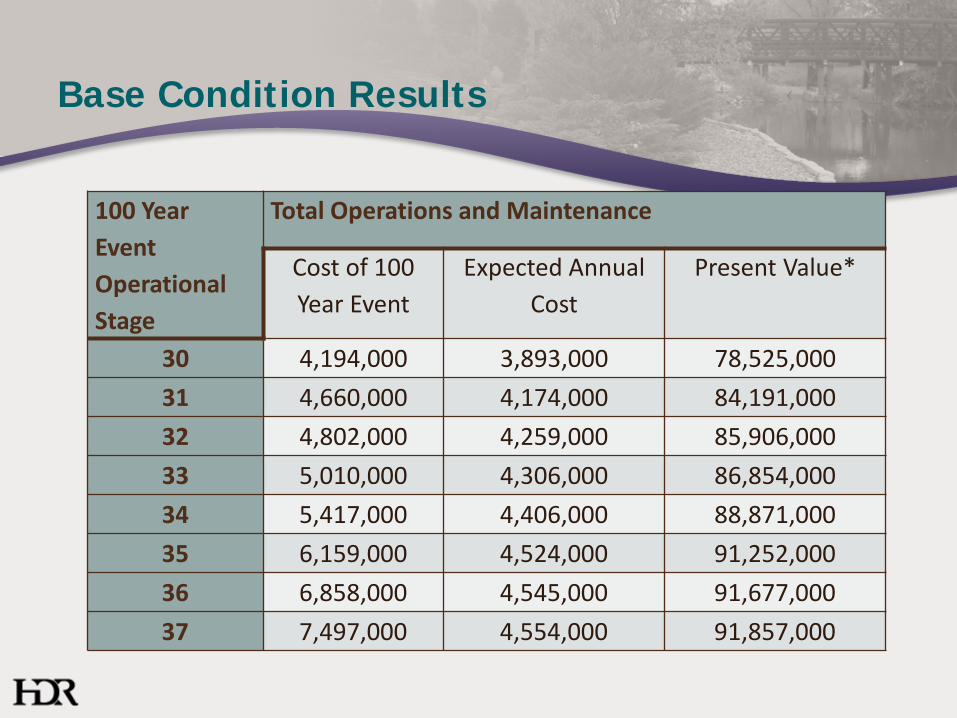
Base Condition Results
100 Year Event Operational Stage
Total Operations and Maintenance
Cost of 100 Year Event
Expected Annual Cost
Present Value*
30 4,194,000 3,893,000 78,525,000 31 4,660,000 4,174,000 84,191,000 32 4,802,000 4,259,000 85,906,000 33 5,010,000 4,306,000 86,854,000 34 5,417,000 4,406,000 88,871,000 35 6,159,000 4,524,000 91,252,000 36 6,858,000 4,545,000 91,677,000 37 7,497,000 4,554,000 91,857,000

Costs Not Included
• Lost Business Revenue • Road Closures • Private Property
– In-Town Cleanup – Golf Courses – Farmland

Operations Defined

Calculating Operations Costs
• Costs removed for stages<30 feet • Daily average cost per foot of inundation • Estimated that 80% of costs were for
temporary measures and 20% for permanent measures
• Divided costs by linear feet of protection impacted by flooding

Discount Factor for Smaller Events
River Stage
In Town Flood 100-year Flood Protection Level
30 31 32 33 34 35 36 37
30 1.0 - - - - - - - 31 1.0 1.0 - - - - - - 32 1.0 1.0 1.0 - - - - - 33 0.8 1.0 1.0 1.0 - - - - 34 0.6 0.8 1.0 1.0 1.0 - - - 35 0.4 0.6 0.8 1.0 1.0 1.0 - - 36 0.2 0.4 0.6 0.8 1.0 1.0 1.0 - 37 0.2 0.2 0.4 0.6 0.8 1.0 1.0 1.0
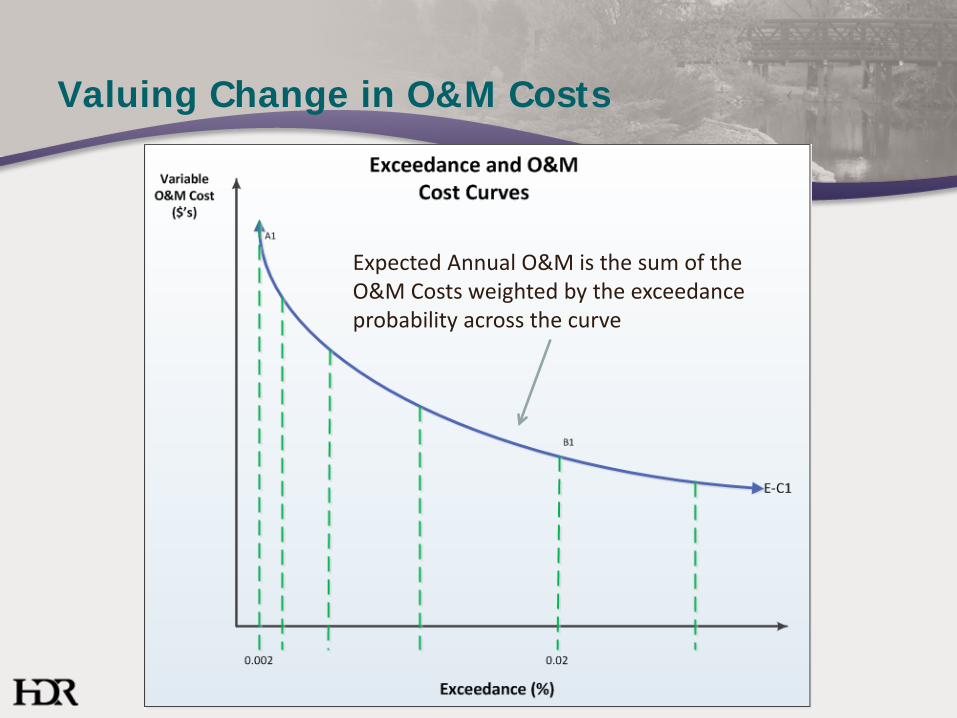
Valuing Change in O&M Costs
Expected Annual O&M is the sum of the O&M Costs weighted by the exceedance probability across the curve
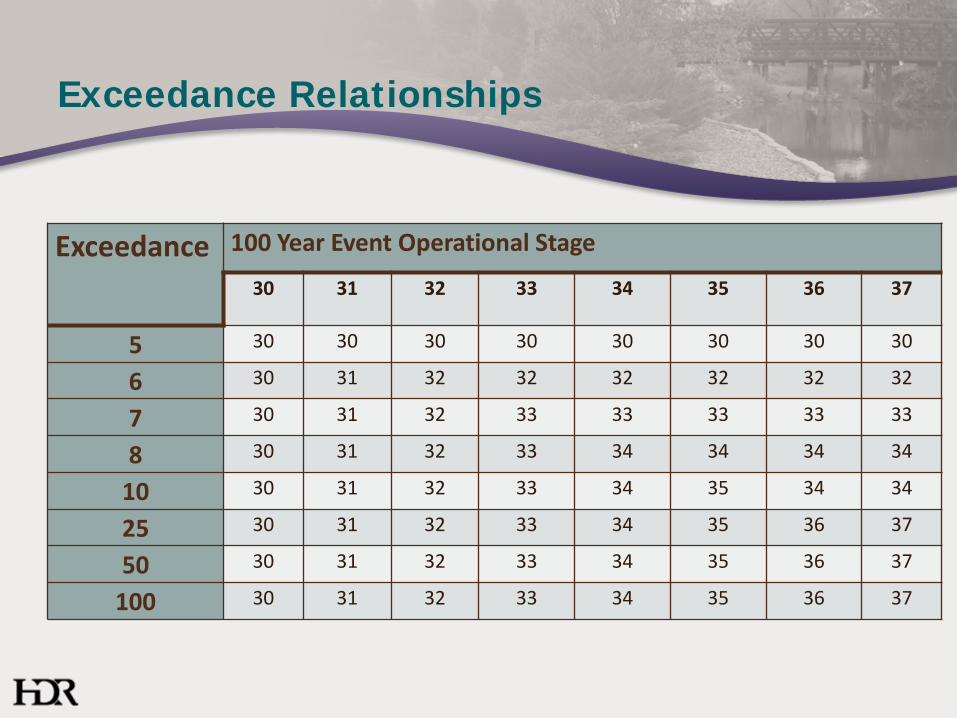
Exceedance Relationships
Exceedance 100 Year Event Operational Stage
30 31 32 33 34 35 36 37
5 30 30 30 30 30 30 30 30
6 30 31 32 32 32 32 32 32
7 30 31 32 33 33 33 33 33
8 30 31 32 33 34 34 34 34
10 30 31 32 33 34 35 34 34
25 30 31 32 33 34 35 36 37
50 30 31 32 33 34 35 36 37
100 30 31 32 33 34 35 36 37
