evaluation of in-woods chipping options for beetle-killed
TRANSCRIPT

Natural Resources Canada
Ressources naturelles Canada
Canadian Forest Service
Service canadien des forêts
Evaluation of in-woods chipping options for beetle-killed lodgepole pine wood
Paul Bicho, Ashif Hussein, Bernard Yuen, Wai Gee, and Surjit Johal
Mountain Pine Beetle Initiative Working Paper 2006-19
Natural Resources Canada, Canadian Forest Service, Pacific Forestry Centre, 506 West Burnside Road, Victoria, BC V8Z 1M5
(250) 363-0600 • www.pfc.cfs.nrcan.gc.ca
cfs-scf.nrcan-rncan.gc.ca
Evaluation of in-woods chipping options for beetle-killed lodgepole pine wood
by Paul Bicho, Ashif Hussein, Bernard Yuen, Wai Gee, and Surjit Johal
Mountain Pine Beetle Initiative Working Paper 2006–19
MPBI Project # 8.13
Pulp and Paper Research Institute of Canada 3800 Wesbrook Mall
Vancouver, British Columbia V6S 2L9 Canada
Natural Resources Canada Canadian Forest Service Pacific Forestry Centre
506 West Burnside Road Victoria, British Columbia V8Z 1M5
Canada
2006
© Her Majesty the Queen in Right of Canada 2006 Printed in Canada

Natural Resources Canada Canadian Forest Service Pacific Forestry Centre 506 West Burnside Road Victoria, British Columbia V8Z 1M5 Canada 2006 © Her Majesty the Queen in Right of Canada 2006 Printed in Canada
Library and Archives Canada Cataloguing in Publication Evaluation of in-woods chipping options for beetle-killed lodgepole pine wood / Paul Bicho ... [et al.]. (Mountain Pine Beetle Initiative working paper 2006–19) Includes bibliographical references: p. ISBN 0-662-44610-0 Cat. no.: Fo143-3/2006-19E 1. Lodgepole pine--British Columbia--Vanderhoof Region--Quality. 2. Mountain pine beetle--Economic aspects--British Columbia--Vanderhoof Region. 3. Lodgepole pine--Harvesting--British Columbia--Vanderhoof Region. 4. Lodgepole pine--Diseases and pests--British Columbia--Vanderhoof Region. I. Bicho, Paul A. (Paul Alexandre), 1960- II. Pacific Forestry Centre III. Series. SB945.M78E92 2006 634.9'7516768 C2006-980302-1
ii
Abstract The impact of using a portable in-woods chipper (Peterson DDC 5000) to chip red- and grey-stage mountain pine beetle-infested lodgepole pine (Pinus contorta) was determined from the perspective of chip quality, pulping (thermomechanical [TMP] and kraft) and pulp quality. In addition, the costs of chipping were determined and compared. Chips made by the Peterson DDC 5000 were of acceptable quality for both TMP and kraft pulping. Differences noted in the pulping and refining, albeit minor, could be linked to chip quality. Chip quality, in turn, was affected as much by seasonal chipping conditions as by wood quality. The chips made from portable in-woods chippers would be too expensive in the current chip market to be attractive to the British Columbia pulp industry or for export. Also of note was the lack of hog fuel generated by the chipper. This was due to the loss of bark in the advanced grey stage wood. Recommendations for future work include a means of assessing checking on standing timber, an assessment of bark remaining on standing timber, and optimization of chip-size distributions for mountain pine beetle. Keywords: In-woods, chipping, kraft, TMP, thermomechanical pulp, grey stage, red stage, costs, mountain pine beetle, pulping
Résumé On a évalué les effets de l’utilisation d’une déchiqueteuse portative (Peterson DDC 5000) pour découper en copeaux du bois de pin tordu (Pinus contorta) infesté aux stades rouge et gris par le dendroctone du pin ponderosa sur la qualité des copeaux, de la pâte (kraft et raffinage thermomécanique) et de la pâte résiduelle. On a également évalué et comparé les coûts du déchiquetage. Les copeaux produits à l’aide de la Peterson DDC 5000 étaient d’une qualité acceptable pour la fabrication de pâte kraft et le raffinage thermomécanique. Bien que mineures, les différences observées entre la production de pâte et le raffinage pourraient être liées à la qualité des copeaux qui, à son tour, dépendait des conditions saisonnières de déchiquetage et de la qualité du bois. Les copeaux produits à l’aide de déchiqueteuses portatives seraient trop chers pour le marché actuel du copeau de bois pour intéresser l’industrie de la pâte de bois de la Colombie-Britannique ou pour l’exportation. La pénurie du combustible de déchets de bois produits par la déchiqueteuse est également à noter, imputable à la perte de l’écorce dans le bois au stade gris avancé. On a recommandé des travaux futurs, notamment : une méthode d’évaluation de la vérification des peuplements forestiers sur pied, une évaluation de l’écorce restant dans les peuplements forestiers sur pied et l’optimisation des différentes tailles des copeaux de bois pour le bois endommagé par le dendroctone du pin ponderosa.
iii

iv

Contents List of Tables ................................................................................................................................................ vi List of Figures .............................................................................................................................................. vii 1 Introduction................................................................................................................................................1 2 Material and Methods................................................................................................................................2
2.1 Wood procurement and chipping ........................................................................................2 2.2 Wood and chip-quality assessment.....................................................................................3 2.3 Thermomechanical Pulping.................................................................................................4 2.4 Kraft Pulping ........................................................................................................................5 2.5 Statistical Analysis...............................................................................................................5
3 Results and Discussion.............................................................................................................................5 3.1 Wood Quality .......................................................................................................................5 3.2 Chipping and Chip Quality...................................................................................................9 3.3 Thermomechanical pulping of mountain pine beetle-killed pines......................................15 3.4 Kraft pulping of mountain pine beetle-killed pines.............................................................19 3.5 Fibre Costs ........................................................................................................................23
4 Conclusions.............................................................................................................................................26 5 Acknowledgements .................................................................................................................................26 6 Literature Cited........................................................................................................................................27 7 Contact ....................................................................................................................................................28 8 Appendices..............................................................................................................................................29
8.1 Appendix 1: Thermomechanical pulp and handsheet properties ......................................29 8.2 Appendix 2: Kraft pulp and handsheet properties .............................................................30 8.3 Appendix 3: In-woods Chipping of Mountain Pine Beetle Stands and Residuals,
by E.A. (Tony) Sauder, March 7, 2006..............................................................................31
v

List of Tables Table 1. Systems used for chip-size classification. The Ø symbol indicates a round hole aperture
of a specified diameter, in mm. The ⁄⁄ symbol indicates parallel bars spaced a set distance apart (in mm) for determining chip thickness. Also presented are the gross groups of “overs,” “accepts” and “pins and fines.” .................................................................................. 4
Table 2. Average dimensions, volumes and densities of harvested red and grey stems. Attributes were compared between wood types (red versus grey) via t-test (pooled variance). The red and grey woods differ significantly (α =0.05) if the corresponding t-test values are 0.050 or less.......................................................................................................................................... 6
Table 3. Summary of butt and top log disk densities for the red and grey stage woods. ............... 7 Table 4. Analysis of variance (ANOVA) for density by wood type from different sites, position on
the log, log length and log volume. If a p-value is 0.050 or less, then corresponding factor has a significant effect on density........................................................................................... 8
Table 5. Comparisons of log volume and wet weight sent to chipper, and chip wet weight collected from chipper for red and grey wood chipped in either the summer or winter by the Petersen DDC 5000G. .......................................................................................................... 10
Table 6. Chip basic density, packing density, solids content, and caustic solubility for chips made from red-stage and grey-stage wood during winter and summer......................................... 11
Table 7. Effects of season and wood type on the mass fraction (expressed as a percentage) of chips designated as “overs”, “accepts” and “pins” (as outlined in Table 6), for the two classification systems used. The Rader Accepts fraction were further classified as 2-mm- to 4-mm-thick chips and 6-mm- to 8-mm-thick chips (expressed as a fraction of the total accepts). ............................................................................................................................. 14
Table 8. Properties of Thermomechanical Pulps of In-wood Chipping Lodgepole Pine at a Constant Specific Refining Energy of 10 MJ/kg. .................................................................. 17
Table 9. Properties of Thermomechanical Pulps at a Constant Freeness of 100 mL CSF.......... 17 Table 10. Kraft pulping properties of the four chips types at a target kappa of 30. ...................... 21 Table 11. Kraft pulping properties of four trial pulps at 300 mL Canadian Standard Freeness.... 22 Table 12. Cost comparison (in USD) of using in-woods chips versus purchased sawmill residual
chips for the production of kraft pulps................................................................................... 24
vi

List of Figures Figure 1. Histogram of log number by butt diameter (in cm). ......................................................... 6 Figure 2. Histogram of % log volume by butt diameter (in cm). ..................................................... 7 Figure 3. Left: Grey-stage logs stacked shortly after felling but prior to transport or storage. Note
large bare patches where bark has fallen off the logs. ........................................................... 8 Right: Red-stage logs stacked shortly after felling but prior to transport or storage. Other
than minor damage to bark due to harvester, no appreciable loss in bark was noted. Figure 4. Peterson DDC 5000-G .................................................................................................... 9 Figure 5. Petersen DDC 5000 showing debarker (A), disk chipper (B) and chip chute (C). Note
the pile of hog fuel in the center of the picture........................................................................ 9 Figure 6. Chip-size distribution (as percent mass of chips retained on a specific tray) for chips
made from the grey-stage and red-stage logs (indicated by colour), for the winter (solid bars) and summer (stripped bars) trials. Basis of Gradex classification as outlined in Table 1. ... 12
Figure 7. Chip-size distribution (as percent mass of chips of specified thickness) for chips made from the grey-stage and red-stage logs (indicated by colour), for the winter (solid lines) and summer (broken lines) trials. Basis of Rader classification as outlined in Table 1............... 13
Figure 8. A comparison of the grouped chip classes by classifier type....................................... 14 Figure 9. Unscreened Canadian Standard Freeness (mL) versus Specific Refining Energy (MJ/kg)
for the red and grey wood (designated by colour) chipped either during winter (solid circles) or summer (open circles) trials. ............................................................................................ 16
Figure 10. Relationship between proportion of 2-mm- to 4-mm-thick chips (expressed as percentage of total accepts fraction) and the specific refining energy needed to reach 100 mL of freeness and the Canadian Standard Freeness reached after refining at specific energies. ............................................................................................................................... 18
Figure 11. Apparent sheet density (kg/m3) versus screened Canadian Standard Freeness (mL) for red and grey wood (designated by colour) chipped either during winter (solid circles) or summer (open circles) trials.................................................................................................. 18
Figure 12. Kappa number versus H-factor for the red and grey wood (designated by colour) chipped either during winter (solid circles, solid lines) or summer (open circle, dashed lines) trials....................................................................................................................................... 20
Figure 13. Screened yield versus kappa number for the red and grey wood (designated by colour) chipped either during winter (solid circles, solid lines) or summer (open circles, dashed lines) trials....................................................................................................................................... 20
Figure 14. Canadian Standard Freeness (mL) versus PFI Mill revolutions for the red and grey wood (designated by colour) chipped either during winter (solid circles, solid lines) or summer (open circle) trials.................................................................................................... 21
Figure 15. Tensile index versus PFI Mill Revolutions for the red and grey wood (designated by colour) chipped either during winter (solid circles, solid lines) or summer (open circles, dashed lines) trials. ............................................................................................................... 22
Figure 16. Tensile index versus Canadian Standard Freeness (mL) for the red and grey wood (designated by colour) chipped either during winter (solid circles, solid lines) or summer (open circles, dashed lines) trials. ........................................................................................ 23
Figure 17. Comparison of the fibre costs (in USD) to produce 1 t of northern bleached softwood kraft (NBSK) pulp for 33 Canadian and U.S. mills, sorted by region. The data presented is for the fourth quarter of 2005 (Pulp and Paper International 2006)...................................... 25
vii

viii

1 Introduction As of the summer of 2005, the mountain pine beetle (Dendroctonus ponderosae Hopkins) had infested more than 8.9 million hectares of British Columbia’s pine forests and affected more than 400 million m3 of lodgepole pine (Pinus contorta) (Eng et al. 2005). At current rates of infestation, it is estimated that more than 80% of the susceptible lodgepole pine stands will be killed by 2013, with more than 900 million m3 of wood affected. This wood volume represents 10 to 15 times the current annual allowable cut (AAC) in British Columbia. Although this may seem like a bonanza to the forest products industry, the reality is that managing the fibre supply while maintaining fibre quality under these circumstances is a huge challenge. Lumber recovery and, hence, value recovery from dead standing wood decreases with time since death, and can drop by as much as 30% for certain grades after 4 to 7 years (Lewis and Hartley 2005; Snellgrove and Fahey 1977; Parry et al. 1996). This, coupled with the effects of blue stain and decay, can result in significant losses in the value of recovered lumber (Lewis and Hartley 2005; Snellgrove and Fahey 1977; Parry et al. 1996; Fahey 1980). In addition, huge areas with significant amounts of dry, dead standing timber are also susceptible to fire. In order to maximize value recovery from the mountain pine beetle-infested wood, the province has encouraged the accelerated harvesting (AAC “uplift”) of green-stage and red-stage infested wood (British Columbia Ministry of Forests 2005). This harvesting strategy of beetle-killed wood maximizes value recovery from this wood, and reduces the risk of fire. Beetle infestation can be characterized by changes in foliage colour. The three main stages are green stage (0 to 6 months after infestation), red stage (<1 year after infestation), and grey stage—when all foliage has been lost (after 2 years after infestation and later). Moisture loss occurs rapidly at the red stage and after. Dry wood is prone to checking, which reduces lumber recovery, and to breakage during harvesting, handling and processing. Therefore, extremely dry wood is undesirable from a sawmilling perspective and, if harvested, tends to be directed to chipping operations that supply fibre for the pulping industry. The volumes of wood involved are huge and could easily swamp the infrastructure needed to utilize this material. Increased sawmilling capacity in British Columbia is projected to add about 1 million m3 of chips to the overall fibre supply, yet there has been no corresponding increase in the province’s pulping capacity (Watson 2006). Even with mill expansions in the solid wood sector, it is expected that between 200 million m3 and 500 million m3 of wood will be unused and left in the woods (Eng et al. 2005). In some circumstances, natural regeneration will, in time, return the forest to an actively growing state. In other situations, areas that should be cleared in order to accelerate replanting and regeneration will be left because wood deterioration will make these areas uneconomical to harvest; specifically, the standing timber will be deemed unsuitable as a feedstock for the solid wood sector (Eng et al. 2005). In these situations, the cost of harvesting may be offset somewhat by producing chips for the pulp and paper industry. Chips for the pulp and paper industry can be produced in several ways. The concurrent production of lumber and chips is routine in modern sawmill operations, with about 40% of the harvested lumber volume being converted to chips. Chips can also be produced at designated sites, such as in a wood room, in a pulp mill. However, these are expensive to operate and, in British Columbia, most pulp mills have closed their wood rooms and have taken advantage of the abundant supply of sawmill residual chips generated by the province’s solid wood sector. Chipping can also be carried out at, or very near, the point of harvest, using portable machines that debark, delimb and chip entire trees in a single, continuous manner. Virtually all of the chips used by the pulp industry in the province’s interior are sawmill residual chips. At this time, because of the accelerated harvesting strategies and high lumber production rates, the supply of chips in the British Columbia interior is high (Araki 2004). The province will likely be in a chip-surplus situation for the foreseeable future. However, circumstances may arise in which older, dead standing grey stage wood, unsuitable for lumber production, will need to be chipped. Scenarios in which the demand for chips rises because of increased pulp production, competition from other forest sector industries for chips or for export are unlikely at this time, but may be possible in the future. In addition, forest strategies that require the clearing of dead standing grey-stage wood from specific stands to accelerate forest regeneration or reduce fire
1
risk may require that marketable products, such as wood chips, be produced to offset the costs of clearing land. In such cases, where the timber that is unsuitable for lumber production must be chipped, the use of portable in-woods chipping systems may be necessary. In-woods chipping units that combine harvesting, debarking and chipping in one machine have been used throughout Canada to produce chips for the pulping industry (Araki 2004; Kryzanowski 2004; Markham, 2004; Peterson Pacific Corp. 2006). In one instance, a Canadian pulp mill (Diashowa–Marubeni International, Peace River, Alberta) has completely closed its wood room, relying on chips supplied by nine portable in-woods chippers (Kryzanowski 2004). These units are relatively inexpensive to purchase and operate, are versatile, reduce wood handling and transport costs, and can produce high-quality chips from low-quality wood (Markham 2004). Although these units have proven themselves in many situations, they typically chip freshly harvested, healthy trees. Information on the chipping of mountain pine beetle-killed dry wood by portable in-woods chippers is lacking. Several broad questions need to be addressed if in-woods chippers are to be considered for chipping of grey-stage beetle-killed wood under the scenarios previously described. First, although there is little doubt that in-woods chippers can produce quality chips from healthy, green trees— and from even drier timber from fire salvage operations—it remains to be proven that a quality chip can be produced from advanced grey-stage dead standing timber. The challenge is that the wood may be so checked that an in-woods chipper may not be able to produce quality chips. Second, although the pulpability of sawmill residual chips made from grey-stage dead standing timber is questionable at the best of times, it remains to be seen if issues of wood and chip quality manifest themselves in pulping, either chemical and mechanical, and the quality of the ensuing pulps. Finally, in-woods chipping is challenging even under ideal conditions: seasonality, wood quality, and equipment operational parameters affect chip recovery and quality (Hatton 1976). In this study, we propose to quantify chip recovery and quality from a portable in-woods chipping centre that is using grey-stage lodgepole pine that has deteriorated to the point where it is no longer suitable for use in solid wood products. This will be done under standard operating conditions during the summer and winter in order to assess the impact of season. Red-stage and grey-stage woods will be evaluated in order to determine the effects of wood quality on the chipping operation, if any. Chip quality will be assessed using industrially relevant procedures, but pilot-scale pulping trials will be used to correlate chip and wood quality with pulp quality. This will be done for both kraft pulp and thermomechanical pulp (TMP). The chip-recovery data will be coupled with kraft pulping and TMP-refining data, and the volume of wood needed to produce a tonne of either kraft pulp or TMP will be calculated. In addition, the cost of chip production will be estimated and used to examine the impact of using beetle-infested wood on pulp production costs. The information provided in this study will be of use in determining what role in-woods chipping operations should play in forest management and fibre supply planning for beetle-infested stands.
2 Material and Methods 2.1 Wood procurement and chipping The study was divided into two phases: a winter trial and a summer trial. Two wood types, red-stage and grey-stage, were used in each seasonal phase, resulting in four distinct trials: red/winter; grey/winter; red/summer, and; grey/summer. Sites in the Vanderhoof Forest District were scouted for suitable stands of mountain pine beetle-infested wood. Specifically, red-stage lodgepole pine trees (within 1 year of infestation) and advanced grey-stage trees (5 to 6 years after infestation) were sought. A site that had been infested by mountain pine beetle the previous summer was the source of the red-stage wood. This locale is located approximately 25 km northeast of Vanderhoof, and is mapped as a dry warm subzone of the sub-boreal spruce biogeoclimatic zone (SBSdw3). A site with dead, standing lodgepole pines that had been infested with beetle approximately 6 years previously was
2

the source of the advanced grey-stage wood. This site is located approximately 40 km south of the Fraser Lake sawmill in a sub-boreal spruce–damp, cool (SBSdk) subzone. Trees were harvested and cut to length (16 ft), and the butt and top diameters measured. Butt and top discs were cut from randomly selected logs from each site. Wood densities were determined on these discs using the water-displacement methodology (PAPTAC A.8P; http://www.paptac.ca/english/layout/index.htm; Accessed 6 Dec 2006). All logs were transported to the West Fraser sawmill in Chetwynd, British Columbia, where they were weighed and scaled in March, 2005. Logs that were included in the winter trial were then transported to a Peterson DDC 5000 in-woods chipper that was located near Taylor, British Columbia. The in-woods chipper was equipped with a three drum flails and a 66” three-knife disc chipper. The machine is described in Peterson Pacific Corp. (2006). The remaining logs, to be used in the summer-conditions trials, were stacked and stored. For the winter trial, only two of the flails were operated, as was the common practice for winter operation. Logs were chipped in sub-zero degree weather, typical of winter conditions in the area. The stacked logs were stored until late-May, 2005, when they were transported to the same in-woods chipper, and chipped according to normal summer-operating conditions. This included the use of all three flail chain debarkers. For each trial, the weight of the logs to be chipped and the weight of the resulting chips were determined. This was done by subtracting the weight of the loaded trucks from that of their tared weight. In addition, six 25-kg samples of chips were taken from each trial. Also, samples of the material generated during debarking and “waste” material were collected. Volumetric estimates of these two waste streams were made. This report refers to this material as “hog fuel.” The chip and the hog fuel samples were sent to the Pulp and Paper Institute of Canada’s (Paprican’s) Vancouver laboratory for wood- and chip-quality estimation, kraft pulping and mechanical refining. Samples from each type of beetle-attacked wood and each chipping trial were pulped and refined separately.
2.2 Wood and chip-quality assessment Chip preparation and classification For each trial, six bags of chips (~25 kg wet weight each) were received. The six bags were well mixed and subsampled, via coning and quartering, and the subsamples used for determining chip-size distributions, chip-thickness distributions, chip-moisture contents, basic wood densities and chip packing—or bulk—densities, according to the methods described by Hatton (1979). Chip-size distributions and chip-thickness distributions were determined using Gradex and RADER classifiers, respectively. The classifiers were set up as outlined in Table 1. The classification results presented represent the average of triplicate analyses. Chip-packing density was determined by the method described by Hatton (1979), a bucket of
known volume was filled with chips, and levelled at the top. The bucket was dropped several times from a height of about 6 inches. Chips were added if necessary and levelled again. The chip weights were determined and a representative sample taken for moisture-content determination. The packing density was determined by dividing the oven-dried weight of the chips by the volume. Chip densities and disc densities were determined by a modified PAPTAC method A.1H. Caustic solubility was determined by PAPTAC methods G6 and G7 (http://www.paptac.ca/english/layout/index.htm; Accessed 6 Dec 2006.)
3
Table 1. Systems used for chip-size classification. The Ø symbol indicates a round hole aperture of a specified diameter, in mm. The ⁄⁄ symbol indicates parallel bars spaced a set distance apart (in mm) for determining chip thickness. Also presented are the gross groups of “overs,” “accepts” and “pins and fines.”
Gradex Rader Tray Aperture Bar Aperture
Over sized 45 mm Ø Over thick 15 mm ⁄⁄ Over thick 10 mm ⁄⁄ Over thick 12 mm ⁄⁄
Accepts 7 mm Ø Over thick 10 mm ⁄⁄ Pins 3 mm Ø Accepts 8 mm ⁄⁄ Fines Pan Accepts 6 mm ⁄⁄
Accepts 4 mm ⁄⁄ Accepts 2 mm ⁄⁄ Pins 3 mm Ø Fines Pan
For mechanical pulping, each of the well-mixed four chip samples was screened on a Burnaby Machinery and Mill Equipment Ltd., two-deck laboratory chip classifier to remove oversize (>32 mm) and fine (<8 mm) material. For kraft pulping, chips were screened in a Weinberg chip classifier to obtain “accept” chips in the range of 2-mm to 6-mm thickness.
2.3 Thermomechanical Pulping Screened “accept” chips from each of the four trials were refined in a 30.5 cm Sunds Defibrator TMP 300 single-disc laboratory refiner to prepare high freeness primary pulps. A Labview 6.02 PC system (National Instruments, www.ni.com/labview/) was used to control and monitor the refining variables. Pertinent first-stage refining conditions are shown below:
Plates: rotor, No. 3809 modified; stator, No. 3804 modified Preheater pressure: 152 kPa Refiner housing pressure: 172 kPa to 193 kPa Chip presteaming time: 10 min (atmospheric pressure) Preheater residence time: 10 min Prex compression ratio: 3:1 Refining consistency: 27% to 33% oven dry (od) pulp (cyclone exit) Refining rate: 0.39 kg to 0.42 kg od wood/min
The high freeness primary pulps from each of the four chip samples were given further passes in a 30.5-cm Sprout Waldron open-discharge laboratory refiner equipped with type D2A507 plates at approximately 15% to 17% refining consistency. Pulps at three different energy/freeness levels were produced from each of the four chip samples in the Canadian Standard Freeness range from 79 mL to 218 mL CSF. After latency removal, each pulp was screened on a six-cut laboratory flat screen and screen reject content was determined. Bauer-McNett fibre classifications were determined on screened pulps. Fibre lengths of screened pulps were also determined on a Fibre Quality Analyzer (OpTest Equipment Inc., Hawkesbury, Ontario) instrument using representative samples from each of the 12 pulps. Handsheets were prepared with white water recirculation to minimize the loss of fines, and tested for physical and optical properties using PAPTAC standard methods. Handsheet
4

roughness was measured by a Sheffield instrument and the values obtained are expressed in Sheffield Units (SU).
2.4 Kraft Pulping Three representative aliquots of “accept” chips (2 mm to 6 mm) from each of the four samples were kraft cooked in bombs (50 gram, oven-dried charge) within a B-K micro-digester assembly (Keays and Bagley 1970). The cooking conditions were as follows:
Time to maximum temperature: 135 min Maximum cooking temperature: 170°C Effective alkali, % oven-dried weight of wood: 16 % Sulphidity: 25 Liquor to wood ratio: 4.5:1 for spruces H-Factor: 900, 1200, 1500
All the pulps produced were washed, oven dried and weighed to determine pulp yield. Pulp kappa number and black liquor residual effective alkali were determined by standard in-house procedures. From these results the optimum cooking conditions required to produce kraft pulps at 30 kappa number were estimated by fitting regression lines through each set of data (r2 > 0.95). Based on the estimated H-Factor (from above), large quantities of unbleached kraft pulps at approximately 30 kappa number from each of the samples were produced in a 28-L Weverk laboratory digester (Wennberg, Karlstad, Sweden). The cooked chips were disintegrated, washed, and screened through an eight-cut screen plate. For each pulp, four point beating curves were constructed by performing PFI (L&W, Pointe Claire, Quebec) mill runs of 0, 3,000, 6,000 and 12,000 revolutions according to PAPTAC standard C7 for each of the pulps prepared. Canadian Standard Freeness was determined for each point according to PAPTAC standard C1. Handsheets were formed and tested for physical and optical properties using PAPTAC standard methods (http://www.paptac.ca/english/layout/index.htm; Accessed 6 Dec 2006.).
2.5 Statistical Analysis All statistical comparisons were performed using SYSTAT 7.0 (SPSS, Chicago IL). The tests are identified at the point at which they are utilized. Differences were considered significant if the appropriate p-value was greater than α=0.05, unless otherwise stated.
3 Results and Discussion 3.1 Wood Quality Approximately 80 m3 of red-stage wood were harvested from an area about 25 km northeast of Vanderhoof, British Columbia. The site was designated as a SBSdw3 subzone. Similarly, approximately 50 m3 of grey-stage wood were harvested from an area 40 km south of Fraser Lakes, British Columbia. These sites were selected because it was expected that they would produce wood with similar fibre properties and because they met the mountain pine beetle-infestation criteria needed for the study. Thirty-four stems were randomly selected for each wood type. One “red” stem was damaged during handling and discarded. The total volume of red-stage wood sampled was 10.4 m3, which
5

represented 15% of the total volume harvested for this type. For the grey-stage wood, 12.0 m3 were sampled, representing 24% of the total volume harvested. These sampling frequencies are considered large enough to be representative of the entire log volume harvested. Stem dimensions, volumes and densities of the two wood types are summarized in Table 2. The data presented in Table 2 indicate that the red and grey stems were very similar with respect to gross dimensions. Differences in stem-quality attributes between the two wood types were compared via t-test (Table 2). Only two properties, butt diameter and log length, differ significantly between the two types of wood. On average, the red-stage stems had smaller butt diameters and were shorter than the grey stems. However, these differences, while statistically significant, were considered minor and had no impact on average stem volume. Table 2. Average dimensions, volumes and densities of harvested red and grey stems. Attributes were compared between wood types (red versus grey) via t-test (pooled variance). The red and grey woods differ significantly (α =0.05) if the corresponding t-test values are 0.050 or less. Red Grey t-test Stems counted 33 34 Ave. Std. Dev. Ave. Std. Dev. Butt diameter (cm) 19.5 3.5 22.1 3.8 0.005 Top diameter (cm) 13.4 3.2 14.1 2.7 0.308 Length (m) 3.3 1.1 3.8 0.9 0.049 Volume (m3) 0.315 0.238 0.354 0.177 0.449
0
5
10
15
20
25
30
35
14 16 18 20 22 24 26 28 30Butt Diameter Class (cm)
% F
requ
ency
Grey Red
Figure 1. Histogram of log number by butt diameter (in cm).
6

0
5
10
15
20
25
30
35
14 16 18 20 22 24 26 28 30Butt Diameter Class (cm)
% L
og V
olum
eGrey Red
Figure 2. Histogram of % log volume by butt diameter (in cm). The number of logs and the wood volume, expressed as percentages, were broken down by butt diameter class for each wood type, as shown in Figure 1 and Figure 2, respectively. These figures show that although 70% to 80% of the logs from the two wood types had butt diameters ranging from 18 cm to 26 cm, the remaining red logs had diameters smaller than this range and the remaining grey logs tended to be larger than this (Figure 1). This trend was also noted when volumes were compared by log diameter, although it was less pronounced (Figure 2). Regardless, all of the logs harvested had diameters that were well within the 5-cm to 51-cm range of the Peterson DDC 5000-G that was used in this study. Table 3. Summary of butt and top log disk densities for the red and grey stage woods.
Red Grey t-test Disks counted 27 31 Ave. Std. Dev. Ave. Std. Dev.
Density (kg/m3)- Butt disk 434 29 423 15 0.124 Density (kg/m3)- Top disk 411 33 406 21 0.566
Disks cut from the butt and top of logs were used for density determinations. The average densities for the logs were consistent with literature data for lodgepole pine trees from northern latitudes (Gonzalez 1990; Koch 1996). T-test comparisons showed that there was no significant difference in density between the red-stage and grey-stage wood when compared at the butt end or top end of the logs (Table 3). However, the disks from the butt ends of the logs were significantly denser than those from the top ends for the two types of wood. For the red-stage wood, the butt disks were about 7% denser than the top disks; for the grey-stage wood, the difference was 11%. Analysis of variance (ANOVA) was used to estimate the variation in wood density and diameter within a tree (butt and top disks) and between the harvest sites for the red and grey wood. In this way, the relative contribution of these factors to specific wood properties could be determined. The results are presented in Table 4.
7
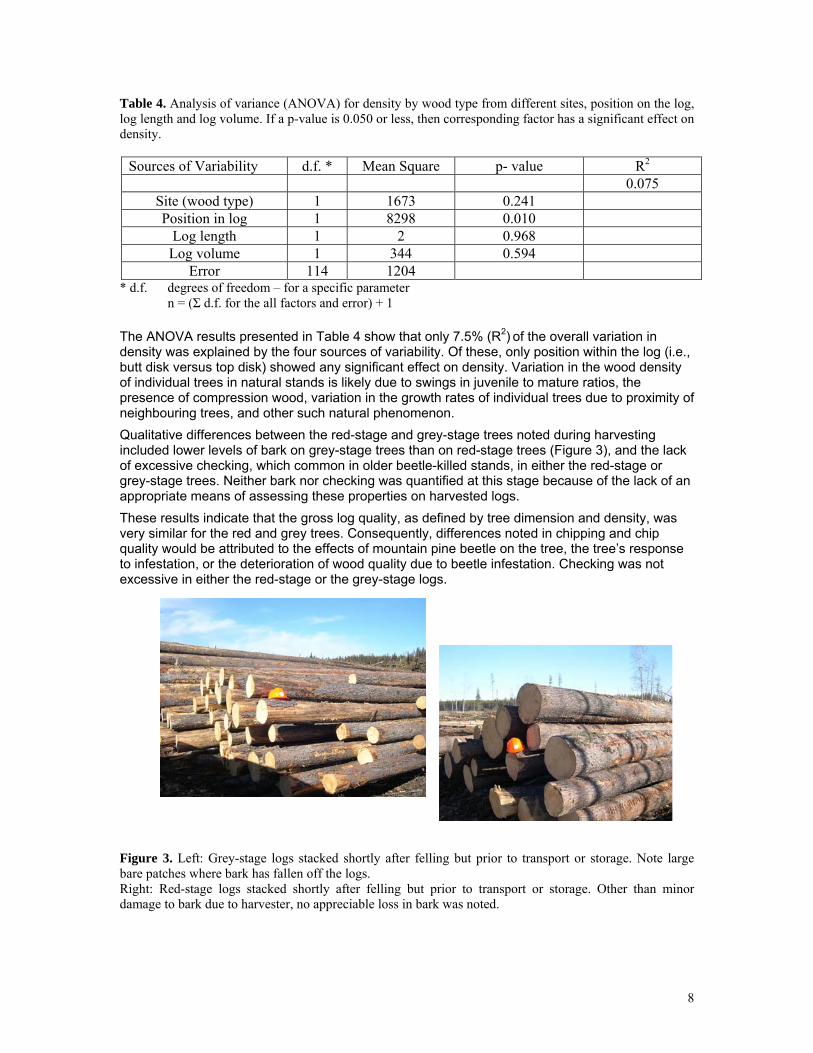
Table 4. Analysis of variance (ANOVA) for density by wood type from different sites, position on the log, log length and log volume. If a p-value is 0.050 or less, then corresponding factor has a significant effect on density.
Sources of Variability d.f. * Mean Square p- value R2
0.075 Site (wood type) 1 1673 0.241 Position in log 1 8298 0.010
Log length 1 2 0.968 Log volume 1 344 0.594
Error 114 1204 * d.f. degrees of freedom – for a specific parameter
n = (Σ d.f. for the all factors and error) + 1 The ANOVA results presented in Table 4 show that only 7.5% (R2) of the overall variation in density was explained by the four sources of variability. Of these, only position within the log (i.e., butt disk versus top disk) showed any significant effect on density. Variation in the wood density of individual trees in natural stands is likely due to swings in juvenile to mature ratios, the presence of compression wood, variation in the growth rates of individual trees due to proximity of neighbouring trees, and other such natural phenomenon. Qualitative differences between the red-stage and grey-stage trees noted during harvesting included lower levels of bark on grey-stage trees than on red-stage trees (Figure 3), and the lack of excessive checking, which common in older beetle-killed stands, in either the red-stage or grey-stage trees. Neither bark nor checking was quantified at this stage because of the lack of an appropriate means of assessing these properties on harvested logs. These results indicate that the gross log quality, as defined by tree dimension and density, was very similar for the red and grey trees. Consequently, differences noted in chipping and chip quality would be attributed to the effects of mountain pine beetle on the tree, the tree’s response to infestation, or the deterioration of wood quality due to beetle infestation. Checking was not excessive in either the red-stage or the grey-stage logs.
Figure 3. Left: Grey-stage logs stacked shortly after felling but prior to transport or storage. Note large bare patches where bark has fallen off the logs. Right: Red-stage logs stacked shortly after felling but prior to transport or storage. Other than minor damage to bark due to harvester, no appreciable loss in bark was noted.
8

3.2 Chipping and Chip Quality The logs described in the previous section were transported to a storage site in Chetwynd, British Columbia. Whole-log chipping was performed with a Peterson DDC (Delimber Debarker Chipper) 5000-G set up at a site near Taylor, British Columbia. The unit is shown in Figures 4 and 5.
Figure 4. Peterson DDC 5000-G
Figure 5. Petersen DDC 5000 showing debarker (A), disk chipper (B) and chip chute (C). Note the pile of hog fuel in the center of the picture.
LLLoooggg BBBoooooommm
LLLoooggg LLLoooaaadddiiinnnggg CCChhhiiippppppeeerrr DDDiiirrrttt CCChhhiiippp DDDiiisssccchhhaaarrrgggeee SSSeAA eepppaaarrraaatttooorrr A BBB CCC
9

The winter phase of the chipping trial was performed on March 23, 2005. The summer chipping trial was performed on May 18 and 19, 2005. Ambient temperatures in the winter trial were well below freezing, and the chipper was operated under conditions normal for that time of year. During the summer trial, temperatures were well above freezing, and the machine had been re-set for summer operation. The volume and weight of logs processed, as well as the weight of chips produced, are presented in Table 4.
Table 5. Comparisons of log volume and wet weight sent to chipper, and chip wet weight collected from chipper for red and grey wood chipped in either the summer or winter by the Petersen DDC 5000G. Winter Summer Red Grey Red Grey
Volume (m3) 36.5 20.2 41.2 27.4 Logs Wet Weight (kg) 23,401 12,950 25,210 17,690 Wet Weight (kg) 21,040 11,250 21,170 14,140
Chips Chip Recovery (%)* 89.9 86.9 84.0 79.9 * Chip recovery = (wet log weight/wet chip weight)*100% . Chip recovery, on a percentage basis, from the chipping of the two different types of wood in the winter and summer are presented in Table 5. The average chip recovery factor for all four trials was 85.2% (standard deviation: 4.3%). These recoveries were approximately 5% higher than those reported for a northern Alberta mill (Araki 2004), 8% to 10% higher than those reported for a Pacific Northwest hybrid-poplar chipping study (Hartsough et al. 2002), and more than 20% higher than those reported for a US trail that compared whole-log and cut-to-length flailing and chipping (Stokes and Watson 1991). Although these studies demonstrate the potential of the equipment, such comparisons are heavily influenced by operating conditions, maintenance, wood type and other factors (Markham 2004). Overall chip recovery for the red-stage wood was 3% to 4% higher than for the grey-stage wood. As the in-woods chipper was operating under the same conditions during a seasonal trial, in actual fact the different woods were processed within an hour of each other within a trial, the differences in chip recovery very likely reflect differences in wood and log quality rather than variation in machine operation. The two different wood types had similar log volumes (Table 2). The main difference between the two wood types was that the red logs tended to have smaller diameter logs (20% of logs had 14-cm to 16-cm butt diameters), than the grey logs (20% of logs had 28-cm to 30-cm butt diameters; Figures 1 and 2). These differences in butt diameter were considered minor and not expected to cause the losses in fibre noted between the two wood types (Araki 2004; Stokes and Watson 1991). In fact, it would be expected that the larger, grey logs would yield more chips than the smaller, red logs. The reasons for the variability in recoveries is mostly likely related to differences in wood quality. The largest differences in chip recovery occurred between season, with the summer trial having a 6% to 7% lower chip recovery than the winter trial had. This most likely reflects seasonal differences in machine operation. Although improvements in chip recovery are possible in the summer months, they may come at the expense of chip-quality attributes such as chip-size distribution. The bark-waste streams were also sampled for the winter trials. The summer trials resulted in such a small amount of bark waste that it was deemed unrepresentative and not analyzed. Chip quality is defined by several key parameters, including size distribution, moisture content, bulk density, bark content, decay content and others. The levels of these attributes are mill specific. The basic and packing densities of the chips made from red-stage and grey-stage wood
10

during the winter and summer, as well as their solids contents and caustic solubilities, are presented in Table 6.
Table 6. Chip basic density, packing density, solids content, and caustic solubility for chips made from red-stage and grey-stage wood during winter and summer. Winter Summer Red Grey Red Grey Chip Basic Density (kg/m3) 386 407 414 405 Chip Packing Density (kg/m3) 189 204 191 187 Chip Solids content (%) 74.6 74.3 78.5 79.8 Caustic Solubility (%) 19.2 20.7 23.6 21.7
Basic density is the mass of dry wood occupied by 1 m3 of solid wood. It is analogous to wood density measured, as determined for disks of wood, but is more indicative of the average density of a mass of chips. Packing density is the wood mass (in chip form) that occupies a given volume. Comparing basic chip density (Table 6) with the disk densities presented in Table 3 shows that the chip basic densities were closer to the densities of the top logs rather than those of the butt densities. This is typical of whole-log chips that have significant proportion of juvenile wood, which is prevalent in the center of the bole. Both grey-wood chip-density values presented in Table 6 are within the 397 kg/m3 to 414 kg/m3 range that corresponds to the 95% confidence limits for the top disk densities reported in Table 3. For the red top-log densities presented in Table 3, the 95% confidence limits span the 398 kg/m3 to 424 kg/m3 range. The summer red chip density presented in Table 6 falls within this range, whereas the winter values are slightly lower than the lower limits. These lower values may be due to error during chip sampling, but are still considered valid. Variation in chip-packing densities, which are influenced by wood density as well as by chip-size distribution, tend to reflect basic wood density. The main conclusion drawn from these comparisons is that chips made from whole-log chipping, as with the in-woods chipping system used in this study, have an average basic density closer to that of the juvenile-wood portion of the tree. If this trend holds for basic wood densities, then it should also be true for other wood and fibre properties which could affect pulping and pulp quality. The effects of whole-log chipping on pulp properties have been well documented (Drost et al. 2003; Hatton 1996). In general, juvenile wood has shorter, finer fibres with higher microfibril angles, than does the corresponding mature wood. This results in pulps that can have lower tear strengths and higher sheet densities than can pulps made from sawmill residual chips that originate from the mature section of a log (Drost et al. 2003; Hatton 1996). The solids contents of the chips sample for the different types of wood are presented in Table 6. It should be stressed that residual wood-moisture content in dead, standing trees is a complex phenomenon that does not fall within the scope of this study. Therefore, the results presented should only be used for comparative purposes within the context of this study. The solids contents of the “winter” chips for both types of wood were very similar (~74%), and are deemed to be indicative of the moisture content of these standing trees prior to chipping. The high solids contents of the “red” chips from the winter trial concur with the literature that indicates that moisture losses from mountain pine beetle-infested pines occur rapidly—typically within one year after infestation. The solids content of the “summer” chips are also similar (~78% to 79%), but are higher than the corresponding chips from the winter trial. The increase in solids content from the winter to summer chipping trials was 3.9% and 5.5% for the “red” and “grey” woods, respectively. This is probably due to moisture losses over the 3-month period from March to May during which the logs were stored. It should be stressed that this change in solids content is specific to the log handling and storage practices used in this study, and general inferences to moisture losses during storage are unwarranted.
11

Caustic solubility, the mass of wood that is soluble in a 1% NaOH solution under standardized conditions, has been used as an indicator of wood degradation (Hunt 1978). In general, softwoods with a caustic solubility of 20% or less are considered sound; those with 20% to 29% caustic solubility are considered to have incipient decay, and those with a caustic solubility of 30% or greater are considered to have advanced decay. However, these values should serve as general indicators only. The chips made during the winter trials had very similar caustic solubilities, indicating little or no decay, whereas storing the logs from the winter to the summer trial resulted in a minor increase in caustic solubility of 4.4% and 1% for the red and grey woods, respectively. These increases are not considered large enough to indicate levels of decay that would influence pulping or pulp properties. The key determinant of chip quality is size distribution. Most mills in British Columbia classify chip-size distribution by using sieve-type screens with specific-sized holes or bars used to measure chip length and width, or chip thickness, respectively. The results are expressed as percent mass retained on each screen. A generic classification system was used in this study to monitor size distributions. However, chip thickness is considered the crucial dimension for kraft pulping. The chip-thickness distribution was also determined. The two classification systems used are outlined in Table 1, and are identified by the instrumentation used to determine them: Gradex for the generic classification system, and Rader for the thickness distribution.
0 10 20 30 40 50 60 70 80 90 100
Pan
3 mm Ø
7 mm Ø
10 mm ⁄⁄
45 mm Ø
% Mass retained per tray
Figure 6. Chip-size distribution (as percent mass of chips retained on a specific tray) for chips made from the grey-stage and red-stage logs (indicated by colour), for the winter (solid bars) and summer (stripped bars) trials. Basis of Gradex classification as outlined in Table 1.
12

0
10
20
30
40
50
60
Fines 3 mm Ø 2 mm ⁄⁄ 4 mm ⁄⁄ 6 mm ⁄⁄ 8mm ⁄⁄ 10 mm ⁄⁄ 12 mm ⁄⁄ 15 mm ⁄⁄
Thickness class (mm)
% M
ass
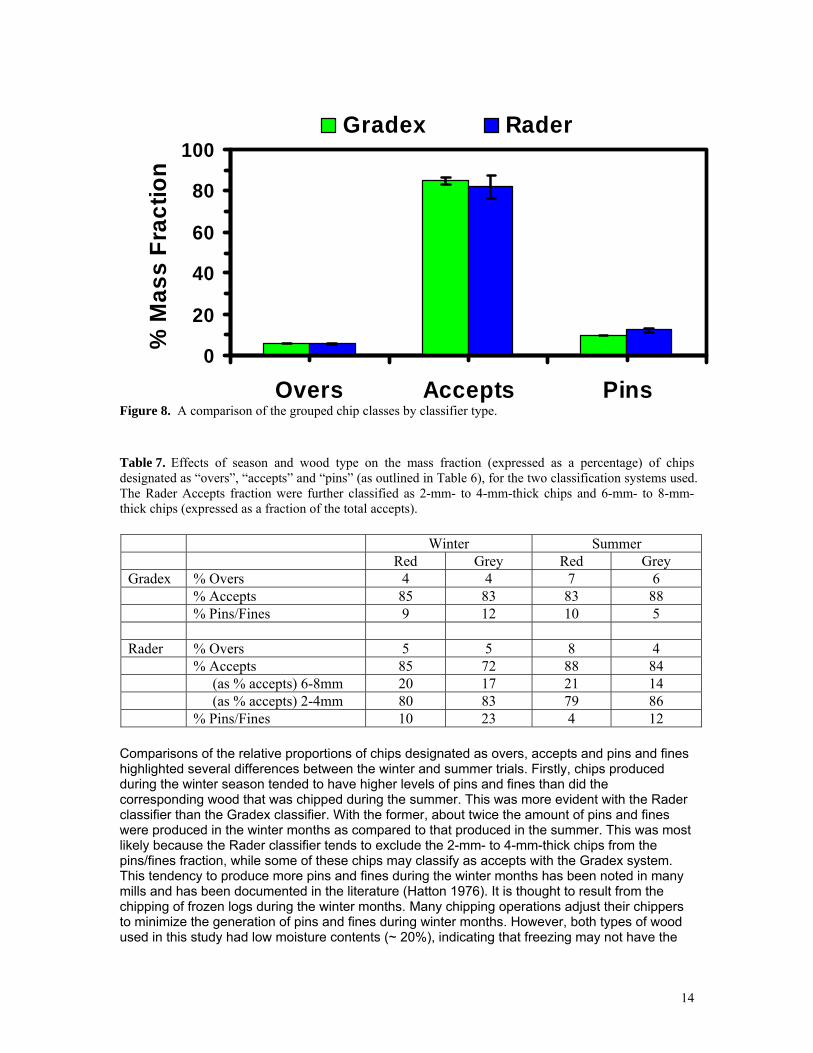
Figure 7. Chip-size distribution (as percent mass of chips of specified thickness) for chips made from the grey-stage and red-stage logs (indicated by colour), for the winter (solid lines) and summer (broken lines) trials. Basis of Rader classification as outlined in Table 1. The overall size distributions determined for the four different trials are compared in Figure 6. In general, all four trials produced chips with good overall size distributions: “accepts” were above 80%, and the over-thick and over-sized material was less than 10% for each trial. However, in all cases, with the exception of the summer/grey wood trial, the “pins and fines” contents were greater than 10%, which is considered high (Hatton 1976). When comparing chip-thickness distributions (Figure 7), all four trials gave acceptable thickness distributions, three out of the four trials having ~79% of their chips classifying within the desirable 2-mm to 6-mm range. The sole exception to this was the winter/grey trial, in which only 68% of the chips fell within this thickness range, the remainder being skewed to the smaller-sized material (23% classified as 3 mm Ø and fines). Despite these minor differences, there were no significant differences (KS test, α = 0.05) in the overall size distributions between the two wood types within a given season for each classifier type. For comparative purposes, both the Gradex and the Rader distributions were grouped as “Overs,” “Accepts”, and “Pins/Fines,” according to Table 1. It should be noted that these designations differ for the two types of classifiers. Such groups tend to highlight differences between distributions and can also be more meaningful in a mill context. Based on this grouping system, a comparison of the two classification systems shows good overall agreement (Figure 8). This is supported by a paired t-test which showed no significant differences between the two classifiers for each of the groupings (pins, accepts and overs). This allows broad comparisons by the different groupings to be made by wood type or season. The classification data is summarized for each of the four trials in Table 8.
Red WinterRed SummerGrey WinterGrey Summer
Red WinterRed SummerGrey WinterGrey Summer
13
0
20
40
60
80
100
Overs Accepts Pins
% M
ass
Frac
tion
Gradex Rader
Figure 8. A comparison of the grouped chip classes by classifier type. Table 7. Effects of season and wood type on the mass fraction (expressed as a percentage) of chips designated as “overs”, “accepts” and “pins” (as outlined in Table 6), for the two classification systems used. The Rader Accepts fraction were further classified as 2-mm- to 4-mm-thick chips and 6-mm- to 8-mm-thick chips (expressed as a fraction of the total accepts).
Winter Summer Red Grey Red Grey Gradex % Overs 4 4 7 6 % Accepts 85 83 83 88 % Pins/Fines 9 12 10 5 Rader % Overs 5 5 8 4 % Accepts 85 72 88 84 (as % accepts) 6-8mm 20 17 21 14 (as % accepts) 2-4mm 80 83 79 86 % Pins/Fines 10 23 4 12
Comparisons of the relative proportions of chips designated as overs, accepts and pins and fines highlighted several differences between the winter and summer trials. Firstly, chips produced during the winter season tended to have higher levels of pins and fines than did the corresponding wood that was chipped during the summer. This was more evident with the Rader classifier than the Gradex classifier. With the former, about twice the amount of pins and fines were produced in the winter months as compared to that produced in the summer. This was most likely because the Rader classifier tends to exclude the 2-mm- to 4-mm-thick chips from the pins/fines fraction, while some of these chips may classify as accepts with the Gradex system. This tendency to produce more pins and fines during the winter months has been noted in many mills and has been documented in the literature (Hatton 1976). It is thought to result from the chipping of frozen logs during the winter months. Many chipping operations adjust their chippers to minimize the generation of pins and fines during winter months. However, both types of wood used in this study had low moisture contents (~ 20%), indicating that freezing may not have the
14
same effect on the chipping of drier logs from beetle-killed wood as it would have on sound, moist logs. Similar comparisons based on wood type showed few trends relating to wood quality. However, differences in the classification of the chips made from the different types of wood were evident (Table 8). For example, the Gradex system tended to quantify less of the pins and fines fraction than the Rader system did. This was more pronounced with the grey-stage wood, and may indicate that purchasers of these chips may need to consider that the chipping of grey-stage wood will result in more pins and fines, regardless of season, than would be expected from sound lodgepole pine chipped under similar conditions. In most mills, chips are screened to remove “overs’ and “pins.” This was done for the pulping phases of this study. However, many mills recognize that, even within the “accepts” fraction, there can be considerable variability. Therefore, although the proportion of the “accepts” fraction contributes directly to production, the size distribution within the accepts fraction affects pulping and refining. This is represented for the Rader classification as the 2-mm- to 4-mm-thick accepts and the 6-mm- to 8-mm-thick accepts. Table 7 showed that, as with the pines and fines fraction, chips from the grey wood tended to have less of the 6-mm to 8-mm fraction than did the corresponding chips made from red wood. However, no relationship between the 2-mm to 4-mm accepts and the pins fractions was noted. Once chipped, the different wood types were pulped chemically (kraft) and thermomechanically (TMP), and the ensuing pulps characterized. In this way, it was possible to discern how differences between wood type and chip quality affected pulping and pulp quality. The Peterson DDC 5000 produced chips of acceptable quality for the pulp industry. Quality differences were attributed mainly to seasonality rather than to wood quality.
3.3 Thermomechanical pulping of mountain pine beetle-killed pines Thermomechanical pulps (TMPs), at three freenesses, were made from each of the two different wood types chipped in the summer and winter. The results for the 12 TMPs are shown in Appendix 1. The relationship between pulp freeness and specific refining energy for the four trials is presented in Figure 9. The results indicate that, although minor, the differences in refining due to seasonality were more pronounced than they were between wood types; e.g., the two types of “winter” chips refined in a very similar manner, whereas there was greater variability between the “summer” chips. These minor differences could result from storage effects, such as drying, which was noted in Table 6. To facilitate data analysis and discussion, the raw data were standardized by interpolation of extrapolation to a freeness of 100 mL CSF (Table 9) and a specific refining energy of 10.0 MJ/kg (Table 10).
15

16
50
100
150
200
250
6 7 8 9 10 11 12 13 14
Specific Refining Energy (MJ/kg)
Uns
cree
ned
CSF
(m
L)
Figure 9. Unscreened Canadian Standard Freeness (mL) versus Specific Refining Energy (MJ/kg) for the red and grey wood (designated by colour) chipped either during winter (solid circles) or summer (open circles) trials. Differences in the refining of the four types of chips refined, as indicated by the unscreened freenesses of TMP at a given specific refining energy (Figure 9), were minor but evident. These differences were more pronounced in summer than in winter. In general, chips made from the grey-stage wood required 5% to 12% less energy to reach 100 mL freeness than “red” chips did (tables 9 and 10). This difference in refining was not correlated with the wood-quality attributes, such as density or solids content, nor with the chip-classification groupings presented in Table 8. This is not surprising, as the former were very similar, and the oversized and pin chips were screened out prior to refining, making the latter more indicative of chipper productivity rather than of refiner operation. There were relationships, however, between the different sized accept fractions, as assessed by the Rader classifier in Table 8. These fractions are more representative of the chip-size distribution entering the refiner. The 2-mm to 4-mm fractions correlated with the specific refining energy needed to reach 100 mL of freeness and, as a result, also with the freeness values reached after refining at specific energy levels (Table 10). There were insufficient data to correlate the 2-mm to 4-mm fraction with bulk density or other wood- and chip-quality attributes such as basic wood density, solids content or caustic solubility, yet it is plausible that a relationship exists between these various parameters that influences mechanical refining. It has been reported that 2-mm- to 4-mm-thick lodgepole chips require about 11% less refining energy than do chips thicker than 7 mm (Hoekstra et al. 1983). Similar trends have been noted with New Zealand radiata pine (Jones et al. 2005). However, other studies have highlighted the variable nature of chip-size distributions, and, coupled with inappropriate classification, make it difficult to draw firm conclusions on the effect of chip-size distributions on mechanical pulping and pulp quality (Wood 1996).
Red WinterRed SummerGrey WinterGrey Summer
Red WinterRed SummerGrey WinterGrey Summer

17
Table 8. Properties of Thermomechanical Pulps of In-wood Chipping Lodgepole Pine at a Constant Specific Refining Energy of 10 MJ/kg. Wood Chipping Unscreened Length weighted Apparent Tensile Tear Sheffield Scattering Type Season CSF Fibre Length Sheet Density Index Index Roughness Coefficient (mL) (mm) (kg/m3) (N•m/g) (mN•m2/g) (SU) (cm2/g) Red Winter 129 1.88 300 40 9.4 292 548 Grey Winter 120 1.82 310 37 8.7 291 558 Red Summer 139 1.85 311 38 9.1 274 567 Grey Summer 112 1.74 330 37 8.7 255 558
Table 9. Properties of Thermomechanical Pulps at a Constant Freeness of 100 mL CSF. Wood Chipping Specific R - 48 Fines Length weighted Apparent Tensile Tear Sheffield Scattering Brightness ISO
Type Season Refining Fraction (P-200) Fibre length Sheet Density Index Index Roughness Coefficient Opacity
Energy
(MJ/kg) (%) (%) (mm) (kg/m3) (N•m/g) (mN•m2/g) (SU) (cm2/g) (%) (%)
Red Winter 11.4 61.1 25.8 1.85 330 46 8.8 250 567 52 96.5
Grey Winter 10.9 58.6 26.9 1.80 335 42 8.3 265 571 51 97.0
Red Summer 11.9 60.2 26.8 1.76 365 43 8.3 230 598 51 97.7
Grey Summer 10.6 57.2 28.8 1.71 342 39 8.2 239 581 51 97.2

y = 0.0197x2 - 3.4189x + 158.63R2 = 0.9967
y = 0.2863x2 - 50.585x + 2345R2 = 0.9897
100
110
120
130
140
150
75 80 85 90
% Acce
CS
Free
ness
(mL)
10.0
10.5
11.0
11.5
12.0
Spec
ifc re
finin
g en
ergy
(M
J/kg
)
pts (2-4 mm thick) Figure 10. Relationship between proportion of 2-mm- to 4-mm-thick chips (expressed as percentage of total accepts fraction) and the specific refining energy needed to reach 100 mL of freeness and the Canadian Standard Freeness reached after refining at specific energies.
250
300
350
400
50 100 150 200 250
Screened CSF (mL)
App
aren
t She
et D
ensi
ty
(kg/
m3 )
Red WinterRed SummerGrey WinterGrey Summer
Red WinterRed SummerGrey WinterGrey Summer
Figure 11. Apparent sheet density (kg/m3) versus screened Canadian Standard Freeness (mL) for red and grey wood (designated by colour) chipped either during winter (solid circles) or summer (open circles) trials. As expected, apparent sheet density decreased with freeness for each of the TMPs; however, the rate of change varied, with the greatest differences being noted between the two “red” samples (Figure 11). The fibre properties of the TMPs, at a 100 mL freeness, made from the four different chip types are presented in Table 8. In general, the Bauer-McNett distributions of the “red” TMPs tended to be skewed to the long-fibre fractions, as is evident from higher R-48 fraction and, concurrently, lower fines than the “grey” TMPs (Table 8). As a result of the higher long-fibre fractions, the “red” TMPs were rougher than the “grey” TMPs.
18
The fibre lengths for the four pulps showed a seasonal effect, with chips from the winter trial yielding TMPs that have fibre lengths that were almost 0.1 mm longer than did the corresponding wood types from the summer chipping trial. Wood-type effects on fibril length, within a chipping trial, were also noted, but were less than 0.05 mm. Variations in fibre length resulted in variations in tensile index, with shorter fibres resulting in lower tensile strengths. At a given freeness, the “grey” TMPs had lower tensile strengths than the “red” TMPs. Tear strength was fairly consistent across all pulps. The scattering coefficients of the TMPs made from both types of winter chips were 2% to 5% lower than those of the summer chips, indicating a slight improvement in sheet formation for the former. Wood type did not appear to affect formation. Also, neither season nor wood type had any significant effect on either TMP opacity or brightnesses (Table 9). However, the TMP brightnesses reported were several points lower than would be expected for similar pulps made from uninfested lodgepole pine (Hu et al. 2004). The TMPs produced from the chips made during the four trials had similar properties. Minor differences in refining behaviour were noted and were attributed to seasonality effects on chipping and chip quality, rather than to wood quality.
3.4 Kraft pulping of mountain pine beetle-killed pines Plots of the kappa number at various H-factors for each of the four trials are presented in Figure 12. Each trial condition behaved in the expected manner: kappa decreased with increasing H-factor. This justified the screened kraft yield versus kappa number comparison (Figure 13) to evaluate relative pulpability, and further justified the interpolation of data to kappa 30 for comparative purposes (Table 10). From Figure 12 and Table 10, we see that there is a seasonal trend, with the two winter chip trials pulping faster than the summer trials, as indicated by the H-factor required to reach a target kappa of 30. Within a seasonal trial, differences in the pulping rates noted within wood types can be explained by the chip-thickness distributions of the 2-mm- to 6-mm-thick chips (Table 7). Thicker chips tend to pulp slower (Hatton and Keays 1973), therefore trials with a higher proportion of 4-mm- to 6-mm-thick chips will require higher H-factors to reach a given kappa number. For the winter trial, the proportion of these thick chips for the two wood types were close (within 3%), and they pulped at a similar rate (Table 10). For the summer trial, “red” chips, which had a higher level of the 4-mm- to 6-mm chips than did the corresponding “grey” chips, pulped more slowly (Table 10). This does not, however, explain the differences in the pulping rates between seasons for impact on the red-stage woods rather than the dead, standing grey wood.
19

20
25
30
35
40
45
50
55
800 1000 1200 1400 1600
H-Factor
Kap
pa N
umbe
r Red Winter
Red SummerGrey WinterGrey Summer
Red WinterRed SummerGrey WinterGrey Summer
Figure 12. Kappa number versus H-factor for the red and grey wood (designated by colour) chipped either during winter (solid circles, solid lines) or summer (open circle, dashed lines) trials.
42
44
46
48
50
52
20 30 40 50 60
Kappa Number
% S
cree
ned
Pulp
Yie
ld
Red WinterRed SummerGrey WinterGrey Summer
Red WinterRed SummerGrey WinterGrey Summer
Figure 13. Screened yield versus kappa number for the red and grey wood (designated by colour) chipped either during winter (solid circles, solid lines) or summer (open circles, dashed lines) trials.
20
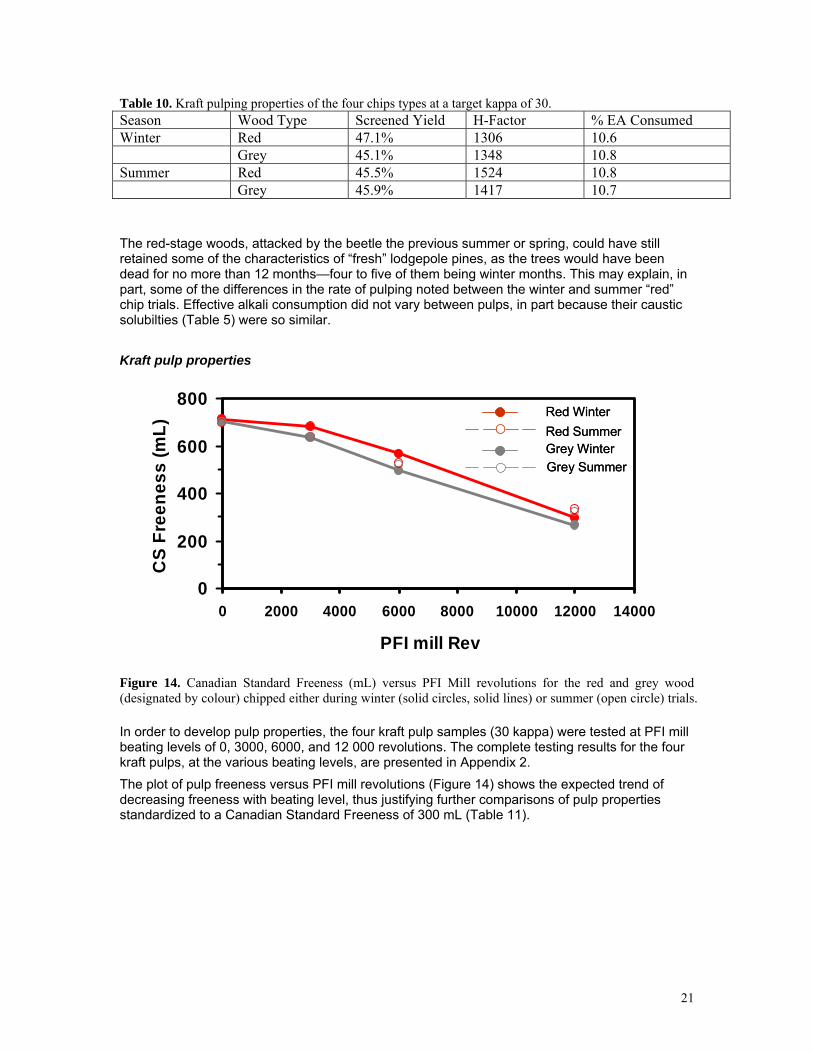
Table 10. Kraft pulping properties of the four chips types at a target kappa of 30. Season Wood Type Screened Yield H-Factor % EA Consumed Winter Red 47.1% 1306 10.6 Grey 45.1% 1348 10.8 Summer Red 45.5% 1524 10.8 Grey 45.9% 1417 10.7 The red-stage woods, attacked by the beetle the previous summer or spring, could have still retained some of the characteristics of “fresh” lodgepole pines, as the trees would have been dead for no more than 12 months—four to five of them being winter months. This may explain, in part, some of the differences in the rate of pulping noted between the winter and summer “red” chip trials. Effective alkali consumption did not vary between pulps, in part because their caustic solubilties (Table 5) were so similar.
Kraft pulp properties
0
200
400
600
800
0 2000 4000 6000 8000 10000 12000 14000
PFI mill Rev
CS
Free
ness
(mL)
Red WinterRed SummerGrey WinterGrey Summer
Red WinterRed SummerGrey WinterGrey Summer
Figure 14. Canadian Standard Freeness (mL) versus PFI Mill revolutions for the red and grey wood (designated by colour) chipped either during winter (solid circles, solid lines) or summer (open circle) trials. In order to develop pulp properties, the four kraft pulp samples (30 kappa) were tested at PFI mill beating levels of 0, 3000, 6000, and 12 000 revolutions. The complete testing results for the four kraft pulps, at the various beating levels, are presented in Appendix 2. The plot of pulp freeness versus PFI mill revolutions (Figure 14) shows the expected trend of decreasing freeness with beating level, thus justifying further comparisons of pulp properties standardized to a Canadian Standard Freeness of 300 mL (Table 11).
21

Table 11. Kraft pulping properties of four trial pulps at 300 mL Canadian Standard Freeness
Sample Grey; Winter Red; Winter Grey; SummerRed;
Summer PFI Rev. 11 139 11 978 12 633 13 057 Apparent Density (kg/m3) (1 Sheet) 686 680 699 697 Burst Index (kPa*m2/g) 11.5 11.2 11.7 12.0 Tensile Index (N*m/g) 115.7 122.2 117.5 110.0 Stretch (%) 3.05 3.39 3.22 2.98 Tear Index (mN*m²/g) (4 Ply) 11.0 11.6 10.7 10.8 Zero Span Breaking Length (km) 18.1 18.7 16.7 19.4 Air Resistance (Gurley) (sec/100 mL) 101.5 83.5 90.9 66.9 Sheffield Smoothness 106 100 95 98 Opacity (%) 89.5 89.3 88.9 89.7 Scat. Coefficient (cm²/g) 149 144 142 143
70
80
90
100
110
120
130
0 2000 4000 6000 8000 10000 12000 14000
PFI Mill Revolutions
Tens
ile In
dex
(N.m
/g)
Red WinterRed SummerGrey WinterGrey Summer
Red WinterRed SummerGrey WinterGrey Summer
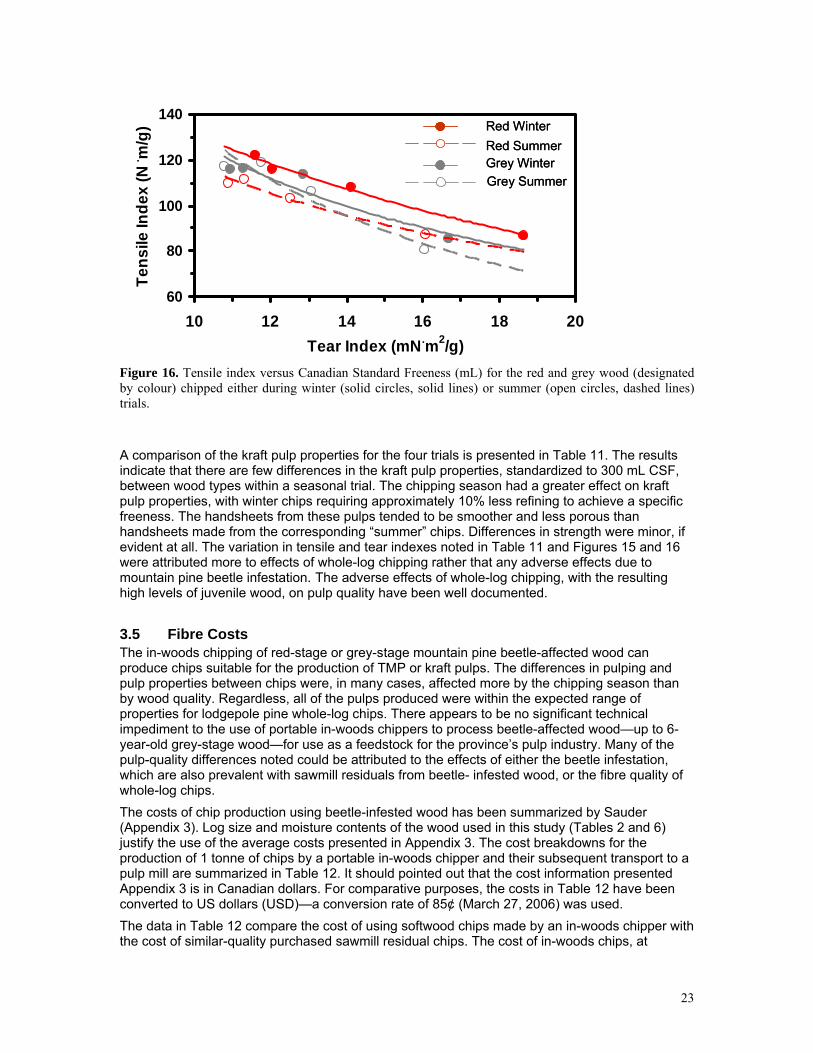
Figure 15. Tensile index versus PFI Mill Revolutions for the red and grey wood (designated by colour) chipped either during winter (solid circles, solid lines) or summer (open circles, dashed lines) trials.
22
60
80
100
120
140
10 12 14 16 18 20Tear Index (mN.m2/g)
Tens
ile In
dex
(N. m
/g) Red Winter
Red SummerGrey WinterGrey Summer
Red WinterRed SummerGrey WinterGrey Summer
Figure 16. Tensile index versus Canadian Standard Freeness (mL) for the red and grey wood (designated by colour) chipped either during winter (solid circles, solid lines) or summer (open circles, dashed lines) trials. A comparison of the kraft pulp properties for the four trials is presented in Table 11. The results indicate that there are few differences in the kraft pulp properties, standardized to 300 mL CSF, between wood types within a seasonal trial. The chipping season had a greater effect on kraft pulp properties, with winter chips requiring approximately 10% less refining to achieve a specific freeness. The handsheets from these pulps tended to be smoother and less porous than handsheets made from the corresponding “summer” chips. Differences in strength were minor, if evident at all. The variation in tensile and tear indexes noted in Table 11 and Figures 15 and 16 were attributed more to effects of whole-log chipping rather that any adverse effects due to mountain pine beetle infestation. The adverse effects of whole-log chipping, with the resulting high levels of juvenile wood, on pulp quality have been well documented.
3.5 Fibre Costs The in-woods chipping of red-stage or grey-stage mountain pine beetle-affected wood can produce chips suitable for the production of TMP or kraft pulps. The differences in pulping and pulp properties between chips were, in many cases, affected more by the chipping season than by wood quality. Regardless, all of the pulps produced were within the expected range of properties for lodgepole pine whole-log chips. There appears to be no significant technical impediment to the use of portable in-woods chippers to process beetle-affected wood—up to 6-year-old grey-stage wood—for use as a feedstock for the province’s pulp industry. Many of the pulp-quality differences noted could be attributed to the effects of either the beetle infestation, which are also prevalent with sawmill residuals from beetle- infested wood, or the fibre quality of whole-log chips. The costs of chip production using beetle-infested wood has been summarized by Sauder (Appendix 3). Log size and moisture contents of the wood used in this study (Tables 2 and 6) justify the use of the average costs presented in Appendix 3. The cost breakdowns for the production of 1 tonne of chips by a portable in-woods chipper and their subsequent transport to a pulp mill are summarized in Table 12. It should pointed out that the cost information presented Appendix 3 is in Canadian dollars. For comparative purposes, the costs in Table 12 have been converted to US dollars (USD)—a conversion rate of 85¢ (March 27, 2006) was used. The data in Table 12 compare the cost of using softwood chips made by an in-woods chipper with the cost of similar-quality purchased sawmill residual chips. The cost of in-woods chips, at
23

roadside, is 2.3 times higher than that of the purchased sawmill residual chips. The delivered cost of the in-woods chips is approximately twice that of the sawmill residuals. Delivered chip costs for the former would be expected to be higher due to the longer haul distances and greater amount of time spent driving on bush roads, reflecting the remoteness of some of these stands. However, these additional costs were not considered in this assessment.
Table 12. Cost comparison (in USD) of using in-woods chips versus purchased sawmill residual chips for the production of kraft pulps.
Source of chips In-woods Sawmill Residuals Chipper
28.73* Not Applicable Cost of production (1 bone dry tonne of chips) 62.73* 31.00#Cost at roadside (1 bone dry tonne of chips) 73.00* 41.30#Delivered costs (includes 100 km transport)
182.30@ 104.49@Fibre cost to produce 1 tonne of kraft pulp * Costs obtained from Appendix 3 converted to USD; exchange rate of 85¢ # Purchased chip costs obtained from the Wood Fibre Report (Pulp and Paper International 2006).
Delivered chip costs adjusted for hauling costs as in Appendix 3. @ Kraft pulp production costs calculated as follows:
1 BD tonne of kraft pulp consumes 2.22 t of accept chips (45% yield) 2.22 t of accept chips requires 2.53 t of whole chips (88% accepts + crushed overs).
The data indicate that the cost of in-woods chip production is comparable to the cost of sawmill residuals at roadside, supporting the observation that the administrative, silvicultural and road construction costs of the residual chips are recovered during lumber production (Appendix 3). Cost of producing 1 t of kraft pulp from in-woods chips and sawmill residual chips is also presented in Table 12. Yield data and chip-size distribution generated in this report were used to calculate the amount of wood needed. This was estimated to be 2.53 t of whole chips per tonne of kraft pulp. Wood losses were primarily due to the screening out of pins and fines, which would be used as hog fuel. Crushed “Overs” were included as accept chips. Losses due to bleaching, washing and other in-mill processing losses or extra costs were not considered. Therefore, the costs of production presented in Table 12 are not for comparison with specific mills, but rather for general comparisons such as presented in Figure 17. The cost comparison for the production of 1 tonne of kraft pulp (from Table 12) indicates that the use of chips made by a portable in-woods chipper doubles fibre costs relative to that of purchased sawmill residual chips.
24

0
50
100
150
200
250
300
350
Fibr
e C
osts
(in
US$
) to
Pro
duce
1 t
of N
BSK British Columbia interior
British Columbia coastal Canadian prairies Northwest U.S. Eastern Canada
Figure 17. Comparison of the fibre costs (in USD) to produce 1 t of northern bleached softwood kraft (NBSK) pulp for 33 Canadian and U.S. mills, sorted by region. The data presented is for the fourth quarter of 2005 (Pulp and Paper International 2006).
Figure 17 compares the fibre costs for 33 kraft mills from across Canada and the northern U.S. Fibre costs for mills in the interior of the province, which consume only sawmill residual chips, range from $105 to $140 USD. The variation in chip costs reflects individual mill situations and the calculated $104 USD sawmill residual chip cost needed to produce 1 t of northern bleached softwood kraft (NBSK) is consistent with this range. A British Columbia kraft mill purchasing chips made by an in-woods chipper, at $182 USD per tonne, would see fibre costs increase by $40 to $70 USD per tonne of NBSK pulp produced, or about 20% to 60%. The cost of in-wood chips would be prohibitive for the western Canadian (British Columbia and the prairies) chip market, uncompetitive for export to the northwestern U.S., and, although seemingly competitive in eastern Canada, transport costs quickly price these chips out of the market.
The situation is similar in the TMP sector. On average, fibre costs contribute approximately $69 USD to the cost of producing 1 t of TMP in the British Columbia interior (FisherLogic™ Fisher International. May 2005. http://www.fisheri.com/. Accessed 6 Dec 2006.). This accounts for approximately 23% of the total cost of production. As with the kraft pulp sector, the mechanical sector uses only sawmill residual chips. If a 90% refining yield and 80% acceptable chips are used, then 1.4 t of chips are needed to produce 1 tonne of TMP. Using the delivered fibre costs in Table 12, the fibre costs to produce 1 t of TMP are calculated as $102 USD for chips produced by an in-woods chipper, and $58 USD for a mill using sawmill residual chips. Again, it should be noted that variation in chip costs reflects individual mill situations. Also, TMP mills are sensitive to wood quality and often pay higher prices for superior chips. This may reflect the higher average fibre costs reported by industry. It would be expected that a TMP mill using purchased chips made by a portable in-woods chipper would see an increase in fibre costs of approximately 75%, or a $50USD per tonne increase in absolute terms.
This final phase of the study has shown that chips produced by portable in-woods chippers from mountain pine beetle-affected lodgepole pine are twice as costly to produce as sawmill residual chips made from similar logs. These costs balloon out during pulping, making these chips too expensive for the current British Columbia chip-supply situation; either for use within Canada or
25

for export. Ways of reducing some of the administrative and infrastructural costs, such as road building, could be explored. However, the only way this seems feasible is if in-woods chippers operated in conjunction with regular logging/harvesting operations. Scenario planning where stands unsuitable for lumber production need to be cleared in a cost-effective manner may need to explore options other than stand-alone in-woods chipping operations, as the supply of sawmill residual chips is expected to remain high and the price low for the foreseeable future.
4 Conclusions This study compared the effects of in-woods chipping on the chips and subsequent chemical and mechanical pulping and pulp properties, of red-stage and grey-stage mountain pine beetle-affected lodgepole pine. The two different types of wood had been matched, to the best of our abilities, for site, log dimensions and other gross features to ensure that any differences observed reflected the effects of chipping and not wood-quality variability. Gross wood-quality attributes were well matched (Tables 2, 3, 5 and 6), but one of the original goals of this study—to compare the chipping of highly checked wood (grey stage) with that of unchecked wood (red stage)—was not met. This highlights a need for an efficient means of assessing the level of checking in standing timber. However, even if highly checked logs were used, the chips made from portable in-woods chippers would be too expensive in the current chip market to be attractive to the province’s pulp industry or for export. Also of note was the lack of hog fuel generated by the chipper. This was deemed to be due to the loss of bark in the advanced grey-stage wood. Many mills are expanding their power boilers in anticipation of huge quantities of hog fuel. The supply of hog fuel may have been overestimated in some circumstances as bark may be lost during weathering of the standing timber or during handling and processing. The extent of bark loss may need to be considered as a factor in shelf-life studies. Chips made by the Peterson DDC 5000 were of acceptable quality for both TMP and kraft pulping. Differences noted in the pulping and refining of the various trials could be linked to chip quality. This raises the question of whether chip-quality parameters, such as size distribution, for green wood are the same for beetle-killed wood. Could improved productivity or pulp quality be achieved by optimizing for chip quality for beetle-killed wood? Recommendations for future work include:
• Development of a means for assessing checking on standing timber. Value recovery is contingent on directing the right wood to the right process. A practical means for assessing checking—a key determinant of lumber quality—is needed to ensure maximum value recovery from every stem harvested.
• Development of a way of assessing bark remaining on standing timber. Bark loss will affect the amount of biomass available for bio-energy generation. This should be a component of shelf-life assessments.
• Investigation and optimization of chip-size distributions for mountain pine beetle-affected wood. Chip-quality parameters currently in use are optimized for green wood. Re-defining chip quality for beetle-infested wood may improve pulping and pulp quality.
5 Acknowledgements The authors thank West Fraser for providing the grey-stage wood (Fraser Lakes) and the services of their staff at their sawmill at Chetwynd, British Columbia, for scaling and storage of the lumber used. We thank George Davidson, of Vanderhoof, British Columbia, for providing the red-stage wood. Finally, the authors thank Blake Bowden’s skilled team who operated the Peterson in-woods chipper. This project was funded by the Government of Canada through the Mountain Pine Beetle Initiative, a six-year, $40-million Program administered by Natural Resources Canada, Canadian Forest Service. Publication does not necessarily signify that the contents of this report reflect the views or policies of Natural Resources Canada, Canadian Forest Service.
26

6 Literature Cited Araki, D.S. 2004. Economics and recovery of aspen chips produced from an in-woods chipping
operation in northern Alberta. FERIC Advantage Report Vol. 5 No. 22 June 2004. 19 pp. British Columbia Ministry of Forests. 2005. British Columbia’s Mountain Pine Beetle Action Plan
2005–2010. http://www.for.gov.bc.ca/hfp/mountain_pine_beetle/actionplan/2005/ Accessed 21 Nov. 2006.
Drost, C.; Niand, Y.; Shewchuk, Y. 2003. Effect of mature and juvenile wood from five wood species on kraft pulp strength. Pulp and Paper Canada 104(11):33–36.
Eng, M.; Fall, A.; Hughes, J.; Shore, T.; Riel., B.; Hall, P.; Walton., A. 2005. Provincial-level projection of the current Mountain Pine Beetle outbreak: An overview of the model (BCMPB v2) and results of the year 2. Mountain Pine Beetle Initiative, Canadian Forest Service; British Columbia Minstry of Forests. http://www.for.gov.bc.ca/hre/bcmpb/BCMPB_MainReport_2004.pdf. Accessed 21 Nov. 2006.
Fahey, T. 1980. Evaluating dead lodgepole pine for products, Forest Products Journal 30(12):34–39.
Gonzalez, J. 1990. Wood density of Canadian tree species. Forestry Canada, Northwest Region, Northern Forestry Center. Edmonton, AB. Information Report NOR-X-315.
Hartsough, B.; Spinelli, R.; Pottle, S. 2002. Delimbing hybrid poplar prior to processing with a flail/chipper. Forest Products Journal 52(4):85–93.
Hatton, J. 1976. Effect of chipper, wood species, and season on chip thickness distribution and chip packing density of sawmill and wood room chips. TAPPI Journal 59(6):151–155.
Hatton, J.; Keays, J. 1973. Effect of chip geometry and moisture on yield and quality of kraft pulps from western hemlock and black spruce. Pulp and Paper Canada 74(1):79–87.
Hatton, J. Pulping. Pages 1029–1042 in: Koch, P. 1996. Lodgepole Pine in North America. Forest Products Society, Madison, WI.
Hatton, J.V. 1979. Chip Quality Analytical Procedures. Chapter 14 in Hatton, J.V. (Ed.). Chip Quality Monograph. Joint Textbook Committee of the Paper Industry-TAPPI, Atlanta GA.
Hoekstra, P.; Veal, M.; Lee, P.; Sinkey, J. 1983. The effects of chip size on mechanical pulp properties and energy consumption. TAPPI Journal 66(9):119–122.
Hu, T.; Johal, S.; Yuen, B.; Williams, T.; Osmond, D.; Watson, P. 2004. Cost implications for Thermomechanical pulping and brightening of blue-stained chips. Pulp and Paper Research Institute of Canada (Paprican) Research Report PRR 1716.
Hunt, K. 1978. How rot-decayed wood affects chipping and kraft pulping. Pulp and Paper Canada 79(87):65–68.
Jones, T.; Song, G.; Richardson, J. 2005. Effect of chipper setting on chip size distribution and mechanical pulp properties. Appita Journal 58(1):56–63.
Keays, J.L.; Bagley, J.M. 1970. Digester Assembly for Precision Pulping Studies. TAPPI Journal 53(10):1935–1940.
Koch, P. 1996. Lodgepole Pine in North America. Forest Products Society, Madison, WI. Kryzanowski, T. 2004. DMI will cave up to $ 8 million per year by adopting in-the-woods chipping.
Pulp and Paper Canada 105(12):23–26. Lewis, K.; Hartley, I. 2005. Rate of deterioration, degrade and fall of trees killed by mountain pine
beetle: A synthesis of the literature and experiential knowledge. Natural Resources Canada, Canadian Forest Service, Pacific Forestry Centre, Victoria, BC. Mountain Pine Beetle Initiative Working Paper 2005–14. 21 pp.
27
Markham, R. 2004. Quality chipping with the Peterson Pacific DDC 5000G mobile delimber
debarker chipper. 90th Pulp and Paper Canada (PAPTAC) Annual meeting, Montreal Que., (CD); A1175–A1177.
PAPTAC Standard methods. http://www.paptac.ca/english/layout/index.htm. Accessed 6 Dec 2006.
Parry, D.; Filip, G.; Willits, S.; Parks, C. 1996. Lumber recovery and deterioration of beetle-killed Douglas-fir and Grand fir in the Blue Mountains of Eastern Oregon. USDA Forest Service, Pacific NW Research Station. General Technical Report PNW-GTR-376.
Peterson Pacific Corp. 2006. Specification sheet for Peterson DDC 5000G. http://www.petersonpacific.com/content/ArchivesItem_11_310_0_v. Accessed 27 Nov. 2006.
Pulp and Paper International. 2006. Wood Fibre Report. Resource Information Systems Inc. (RISI), Boston, Mass. Jan. 2006: Q4, 2005 Vol. 12:1.
Snellgrove, T.; Fahey, T. 1977. Market values and problems associated with utilization of dead timber, Forest Products Journal 27(10):74–79.
Stokes, B.; Watson, W. 1991. Wood recovery with in-woods flailing and chipping. TAPPI Journal 74(9):109–113.
Watson, P. 2006. The Mountain Pine Beetle Epidemic-Changing the face of the BC industry. Pulp and Paper Canada May:12–16.
Wood, J. 1996. Chip quality effects in mechanical pulping—a selected review. Pages 491–497 in 1996 TAPPI Pulping Conference, Nashville TN. Book 1. http://www.tappi.org/s_tappi/sec.asp?CID=5436&DID=527957. Accessed 27 Nov. 2006.
7 Contact Paul Bicho PAPRICAN 3800 Wesbrook Mall Vancouver, British Columbia V6S 2L9 Telephone: (604) 222-3248 Email: [email protected]
28

29
8 Appendices 8.1 Appendix 1: Thermomechanical pulp and handsheet properties
Winter
Summer Red Grey Red Grey Unscreened CSF (mL) 82 122 178 79 111 181 107 151 216 88 140 218 Specific Energy (MJ/kg) 12.6 10.3 8.3 12.7 10.3 8.4 11.6 9.6 8.0 11.3 9.1 7.3 Screened CSF (mL) 88 134 195 74 132 177 117 173 235 89 155 223 Reject (% od pulp) 0.1 0.3 0.5 0.0 0.2 0.3 0.1 0.2 0.4 0.1 0.2 0.9 Apparent Sheet Density (kg/m3) 342 303 287 347 317 286 353 304 291 347 316 285
Burst Index (kPa•m2/g) 3.1 2.6 2.2 2.8 2.5 2.0 2.9 2.5 2.1 2.8 2.4 1.9
Tensile Index (N•m/g) 48 41 34 45 38 34 42 37 34 39 36 31 Stretch (%) 1.99 1.82 1.58 1.83 1.77 1.69 1.68 1.68 1.60 1.43 1.53 1.52
Tear Index (mN•m2/g) (4 Ply) 8.6 9.3 10.0 8.0 8.7 9.1 8.5 9.2 9.3 7.9 9.0 9.2
Brightness (%) 52 53 53 50 52 51 51 52 52 51 51 50 ISO Opacity (%) 97.1 96.1 95.6 97.2 96.7 96.4 97.4 96.6 95.5 97.3 96.6 96.0 Scattering Coefficient (cm2/g) 576 550 543 584 560 549 587 559 520 592 540 519
Sheffield Roughness (SU) 236 287 321 244 288 317 237 290 310 230 275 298 R 14 (%) 16.7 18.8 20.9 11.7 14.9 16.4 15.6 17.3 18.2 11.6 14.9 16.1 R 14/28 (%) 28.9 29.7 29.4 29.6 30.2 30.9 29.6 30.0 31.3 28.6 30.5 32.0 R 28/48 (%) 14.7 14.4 14.1 15.7 15.4 15.5 15.5 15.0 15.5 15.9 16.0 15.6 R 48/100 (%) 7.8 7.5 7.3 8.3 8.2 8.1 8.2 8.1 8.0 8.9 8.8 8.4 R 100/200 (%) 5.6 5.4 5.0 6.5 6.0 5.6 4.8 4.2 4.1 5.1 4.8 4.4 Pass 200 (%) 26.3 24.2 23.3 28.2 25.2 23.5 26.4 25.4 22.9 29.9 25.0 23.5 R - 48 Fraction (%) 60.3 62.9 64.4 57.1 60.6 62.8 60.7 62.3 65.0 56.1 61.4 63.7 Weight W. Fibre Length (mm) 2.47 2.54 2.60 2.39 2.43 2.46 2.40 2.48 2.51 2.32 2.38 2.48 Length W. Fibre Length (mm) 1.84 1.87 1.91 1.78 1.82 1.84 1.79 1.86 1.87 1.70 1.76 1.83

30
8.2 Appendix 2: Kraft pulp and handsheet properties
Sample Winter Summer Grey Red Grey Red
PFI Rev. 0 3000 6000 12000 0 3000 6000 12000 0 3000 6000 12000 0 3000 6000 12000 Screened Csf (mL) 702 635 497 267 713 682 567 299 701 637 520 321 698 638 527 334 Apparent Density (kg/m3) (1 Sheet) 532 638 665 689 518 627 673 680 557 644 673 697 557 658 672 693 Burst Index (kPa*m2/g) 6.6 9.4 10.5 11.6 6.0 9.0 10.0 11.3 6.9 10.0 10.5 11.6 7.0 10.4 11.1 11.8 Breaking length (km) 8.7 11.6 11.9 11.8 8.8 11.0 10.9 12.5 8.2 10.8 12.1 12.0 8.9 10.5 11.4 11.2 Tensile Index (N*m/g) 85.3 113.7 116.6 115.8 86.7 108.2 106.5 122.2 80.6 106.4 118.9 117.3 87.3 103.1 111.5 109.7 Stretch (%) 1.57 3.00 3.04 3.05 1.70 2.94 2.96 3.39 1.59 2.83 3.21 3.22 1.70 2.78 2.78 2.95 Tear Index (mN*m²/g) (1 Ply) 15.7 13.7 12.6 11.9 17.9 14.5 13.7 12.3 15.9 13.6 11.6 11.1 15.5 14.2 12.7 11.5 Tear Index (mN*m²/g) (4 Ply) 16.7 12.8 11.3 10.9 18.6 14.1 12.0 11.6 16.0 13.1 11.8 10.8 16.1 12.5 11.3 10.9 Zero Span Breaking Length (km) 17.1 16.9 16.5 17.9 19.0 17.8 16.4 18.7 18.1 17.9 17.7 16.8 18.6 17.8 19.0 57.1 Air Resistance (Gurley) (sec/100 mL) 0.0 6.1 16.4 115.8 0.0 4.2 10.3 83.7 0.0 7.7 27.3 84.8 0.0 9.1 18.7 59.7 Sheffield Smoothness 267 235 190 92 281 257 222 100 241 226 167 102 245 222 177 110 Opacity (%) 96.3 92.2 90.2 89.4 96.9 92.7 91.5 89.3 96.1 91.8 90.5 89.0 97.1 93.3 91.0 89.9 Scat. Coeff. (cm²/g) 272 178 158 147 276 181 155 144 259 176 159 144 275 162 179
146
8.3 Appendix 3: In-woods Chipping of Mountain Pine Beetle Stands and Residuals, by E.A. (Tony) Sauder, March 7, 2006
The Forest Research Institute of Canada (FERIC) estimated the costs for chipping frozen mountain pine beetle stems and residuals at roadside using a Peterson Pacific DDC5000 three-drum delimber debarker chipper (Table 1). The costs were determined by developing hourly equipment rates based on FERIC’s equipment-costing template and a chip-haul costing model. These costs do not include supervision, overhead and profit. A conversion factor of 2.94 m3/BDt was calculated based on an average density of 425 kg/m3 and moisture content (wet basis) of 20%. FERIC used its database of equipment productivities and previous reports to estimate equipment productivity. Feller buncher productivity was based on stands containing stems ranging from 0.12 to 0.45 m3/piece. The smaller piece size (0.12 m3) reflects a scenario where a heavy load of tops, long butts and waste pieces (residuals) remain at roadside after sawlogs have been extracted from the stems. The larger piece sizes (0.25 m3 to 0.35 m3) reflect a scenario where significant portions of standing stems were unsuitable for sawlogs. The average cost for felling assumes a 0.30 m3 piece size. The average cost for other phases is the mid-point of the maximum and minimum costs. The total costs assume the chip recovery would have to recover the full cost of administration, reforestation and road development. These costs would probably not be incurred (or could be prorated) if the material available for chipping was considered a small fraction of the overall volume removed from the block (i.e., if the material chipped were residues remaining after sawlogs were recovered). Felling productivity would reflect stand and terrain conditions, and operator experience. Skidder and front-end loader productivity were based on the productivity of the delimber debarker chipper. The costing template assumes additional skidders will be available to maintain fibre to the delimber debarker chipper. A front-end loader is included in the costing to assist with clean-up around the chipper; it is only partially utilized and its operator also assists with maintaining the delimber debarker chipper. Hauling costs were modeled based on B-train chip vans hauling 75% of the distance on paved highway and 25% on bush roads. FERIC estimates the average cost for chipping frozen mountain pine beetle stems and hauling the chips 50 km to 250 km would range from $85 to $88/BDt. Based on FERIC research, the costs to roadside chip non-frozen stems would increase 10% to 30%, mainly because more branches remain on the stem compared to during winter harvesting, and the branches require more effort to remove because they are more flexible.
References: Araki, D.S. 2002. Comparing chips made in a woodroom to chips made by a portable system.
FERIC Advantage Report Vol. 3 No. 49 November 2002. 12 pp. Araki, D.S. 2004. Economics and recovery of aspen chips produced from an in-woods chipping
operation in northern Alberta. FERIC Advantage Report Vol. 5 No. 22 June 2004. 19 pp.
- 31 -
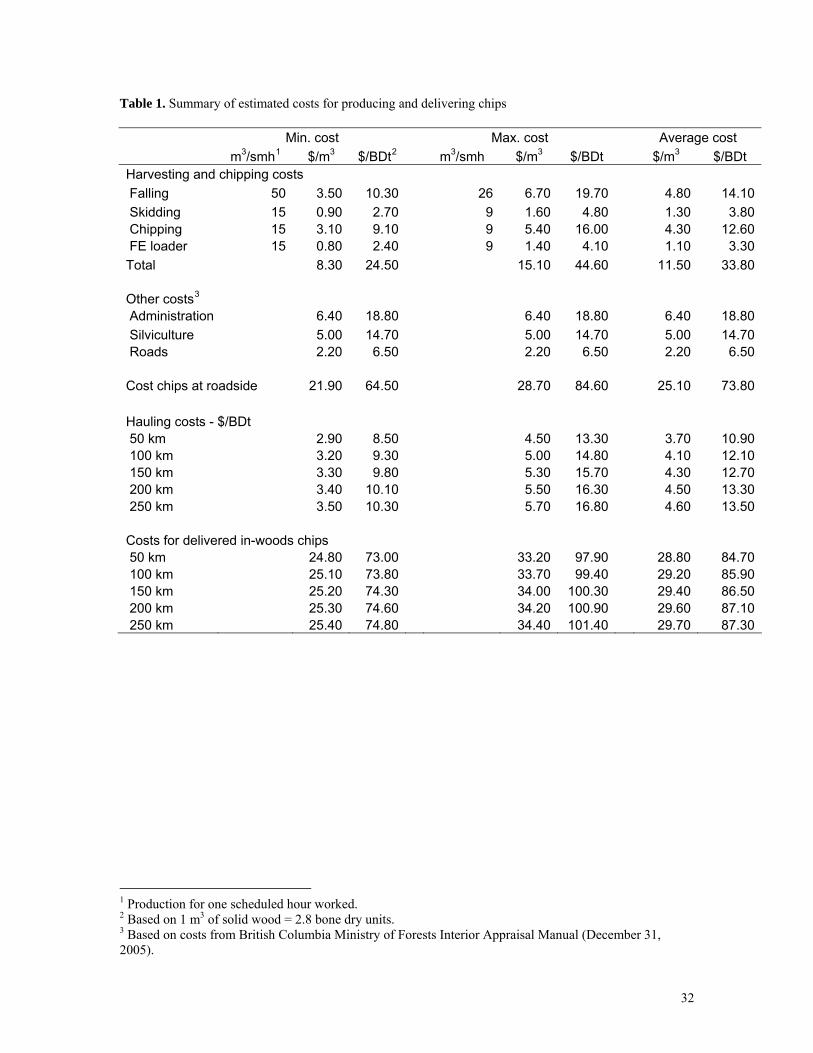
Table 1. Summary of estimated costs for producing and delivering chips Min. cost Max. cost Average cost m3/smh1 $/m3 $/BDt2 m3/smh $/m3 $/BDt $/m3 $/BDt Harvesting and chipping costs Falling 50 3.50 10.30 26 6.70 19.70 4.80 14.10 Skidding 15 0.90 2.70 9 1.60 4.80 1.30 3.80 Chipping 15 3.10 9.10 9 5.40 16.00 4.30 12.60 FE loader 15 0.80 2.40 9 1.40 4.10 1.10 3.30Total 8.30 24.50 15.10 44.60 11.50 33.80 Other costs3 Administration 6.40 18.80 6.40 18.80 6.40 18.80 Silviculture 5.00 14.70 5.00 14.70 5.00 14.70 Roads 2.20 6.50 2.20 6.50 2.20 6.50 Cost chips at roadside 21.90 64.50 28.70 84.60 25.10 73.80 Hauling costs - $/BDt 50 km 2.90 8.50 4.50 13.30 3.70 10.90 100 km 3.20 9.30 5.00 14.80 4.10 12.10 150 km 3.30 9.80 5.30 15.70 4.30 12.70 200 km 3.40 10.10 5.50 16.30 4.50 13.30 250 km 3.50 10.30 5.70 16.80 4.60 13.50 Costs for delivered in-woods chips 50 km 24.80 73.00 33.20 97.90 28.80 84.70 100 km 25.10 73.80 33.70 99.40 29.20 85.90 150 km 25.20 74.30 34.00 100.30 29.40 86.50 200 km 25.30 74.60 34.20 100.90 29.60 87.10 250 km 25.40 74.80 34.40 101.40 29.70 87.30
1 Production for one scheduled hour worked. 2 Based on 1 m3 of solid wood = 2.8 bone dry units. 3 Based on costs from British Columbia Ministry of Forests Interior Appraisal Manual (December 31, 2005).
32
This publication is funded by the Government of Canada through the Mountain Pine Beetle Initiative, a program administered by Natural Resources Canada, Canadian Forest Service (web site: mpb.cfs.nrcan.gc.ca).
Contact:For more information on the Canadian Forest Service, visit our web site at:www.nrcan.gc.ca/cfs-scf
or contact the Pacific Forestry Centre506 West Burnside RoadVictoria, BC V8Z 1M5Tel: (250) 363-0600 Fax: (250) 363-0775www.pfc.cfs.nrcan.gc.ca
To order publications on-line, visit the Canadian Forest Service Bookstore at:
bookstore.cfs.nrcan.gc.ca