evaluation of iterative reconstruction method and...
TRANSCRIPT
* Corresponding author: Masayuki Sasaki, Division of Medical Quantum Sciences, Department of Health Sciences, Graduate School of Medical Sciences, Kyushu University, 3-1-1 Maidashi, Higashi-ku, Fukuoka 812-8582, Japan. Tel: +81-92-642-6746; Fax: +81-92-642-6674; Email: [email protected]© 2016 mums.ac.ir All rights reserved. This is an Open Access article distributed under the terms of the Creative Commons Attribution License (http://creativecom-mons.org/licenses/by/3.0), which permits unrestricted use, distribution, and reproduction in any medium, provided the original work is properly cited.
Evaluation of Iterative Reconstruction Method and Attenuation Correction in Brain Dopamine Transporter SPECT Using an Anthropomorphic Striatal PhantomAkira Maebatake1, Ayaka Imamura2, Yui Kodera2, Yasuo Yamashita3, Kazuhiko Himuro3, Shingo Baba4, Kenta Miwa1, Masayuki Sasaki1*
1 Division of Medical Quantum Sciences, Department of Health Sciences, Graduate School of Medical Sciences, Kyushu University, Fukuoka, Japan
2 Radiological Science Course, Department of Health Sciences, School of Medicine, Kyushu University, Fukuoka, Japan 3 Division of Radiology, Department of Medical Technology, Kyushu University Hospital, Fukuoka, Japan 4 Department of Clinical Radiology, Graduate School of Medical Sciences, Kyushu University, Fukuoka, Japan
A R T I C L E I N F O A B S T R A C T
Article type:Original article
Objective(s): The aim of this study was to determine the optimal reconstruction parameters for iterative reconstruction in different devices and collimators for dopamine transporter (DaT) single-photon emission computed tomography (SPECT). The results were compared between filtered back projection (FBP) and different attenuation correction (AC) methods.Methods: An anthropomorphic striatal phantom was filled with 123I solutions at different striatum-to-background radioactivity ratios. Data were acquired using two SPECT/CT devices, equipped with a low-to-medium-energy general-purpose collimator (cameras A-1 and B-1) and a low-energy high-resolution (LEHR) collimator (cameras A-2 and B-2). The SPECT images were once reconstructed by FBP using Chang’s AC and once by ordered subset expectation maximization (OSEM) using both CTAC and Chang’s AC; moreover, scatter correction was performed. OSEM on cameras A-1 and A-2 included resolution recovery (RR). The images were analyzed, using the specific binding ratio (SBR). Regions of interest for the background were placed on both frontal and occipital regions.Results: The optimal number of iterations and subsets was 10i10s on camera A-1, 10i5s on camera A-2, and 7i6s on cameras B-1 and B-2. The optimal full width at half maximum of the Gaussian filter was 2.5 times the pixel size. In the comparison between FBP and OSEM, the quality was superior on OSEM-reconstructed images, although edge artifacts were observed in cameras A-1 and A-2. The SBR recovery of OSEM was higher than that of FBP on cameras A-1 and A-2, while no significant difference was detected on cameras B-1 and B-2. Good linearity of SBR was observed in all cameras. In the comparison between Chang’s AC and CTAC, a significant correlation was observed on all cameras. The difference in the background region influenced SBR differently in Chang’s AC and CTAC on cameras A-1 and B-1.Conclusion: Iterative reconstruction improved image quality on all cameras, although edge artifacts were observed in images captured by cameras with RR. The SBR of OSEM with RR was higher than that of FBP, while the SBR of OSEM without RR was equal to that of FBP. Also, the SBR of Chang’s AC varied with different background regions in cameras A-1 and B-1.
Article history:Received: 16 Feb 2016Revised: 12 Mar 2016Accepted: 18 Mar 2016
Keywords: Attenuation correctionIterative reconstructionSPECT/CT
Please cite this paper as:Maebatake A, Imamura A, Kodera Y, Yamashita Y, Himuro K, Baba Sh, Miwa K, Sasaki M. Evaluation of Iterative Reconstruction Method and Attenuation Correction in Brain Dopamine Transporter SPECT Using an Anthropomorphic Striatal Phantom. Asia Oceania J Nucl Med Biol. 2016; 4(2): 72-80. doi: 10.7508/aojnmb.2016.02.003
IntroductionDopamine transporter (DaT) imaging through
single-photon emission computed tomography (SPECT) has been used for the diagnosis of neurological and motor disorders (1, 2). DaT SPECT
Maebatake A et alIR and CTAC in DaT-SPECT AOJNMB
73Asia Oceania J Nucl Med Biol. 2016; 4(2)
using 123I-N-ω-(fluoropropyl)-2β-carbomethoxy-3β-(4-iodophenyl)tropane (123I-FP-CIT) has been reported to be useful for diagnosing the early phase of Parkinson’s disease and differentiating it from essential tremor (3-6).
Semi-quantitative indices for DaT SPECT, such as specific binding ratio (SBR), are widely used as diagnostic parameters and have been reported to be helpful in improving the diagnostic accuracy of some motor disorders (7-10). In general, DaT SPECT image quality and quantification are influenced by the applied devices, acquisition parameters, and reconstruction/correction methods (11, 12).
Guidelines on DaT SPECT have recommended the use of both filtered back projection (FBP) and ordered subset expectation maximization (OSEM) for image reconstruction (1, 2). In our previous study, we compared DaT SPECT images reconstructed by FBP and Chang’s attenuation correction (AC) among different devices and collimators, using an anthropomorphic phantom (13). We found that SBR was significantly different among devices and collimators.
Since images reconstructed by OSEM are strongly affected by reconstruction parameters, it is also important to determine the optimal reconstruction parameters. Furthermore, although the guidelines have recommended the application of AC in DaT SPECT imaging (1, 2), the accuracy of AC varies among the applied methods. In this regard, Ishii et al. reported that different AC methods resulted in different patterns on brain perfusion SPECT (14).
The aim of this study was to determine the optimal reconstruction parameters for iterative reconstruction in different devices and collimators in DaT SPECT imaging. DaT SPECT images reconstructed with iterative reconstruction and FBP were compared with those corrected by different AC methods.
MethodsPhantoms
A pool phantom (Akita Machine Engineering, Japan) was used to determine AC for Chang’s method (13). The pool phantom was cylindrical (diameter: 16 cm, height: 15 cm, and volume: 3,016 mL) and filled with 14.8 kBq/mL of 123I solution.
The evaluation of DaT SPECT images was performed with an anthropomorphic striatal phantom (NMP Business Support Co., Ltd., Hyogo, Japan) (13). This phantom consisted of chambers
for bilateral striatum (12.5 mL) and cerebrum (1,180 mL), according to magnetic resonance images of a healthy subject. The bilateral striatum and background of the phantom were filled with different 123I solution concentrations (Table 1). Four striatum-to-background radioactivity ratios (S/B ratios: 8.08, 6.03, 4.03, and 3.01) were examined in this study.
Imaging protocolThe data were acquired, using two SPECT/
CT devices: 1) Symbia T6 (Siemens Healthcare, Erlangen, Germany), equipped with a low-to-medium-energy general-purpose (LMEGP) collimator (camera A-1) and a low-energy high-resolution (LEHR) collimator (camera A-2); and 2) Infinia Hawkeye4 (GE Healthcare, Buckinghamshire, UK), equipped with an extended low-energy general-purpose (ELEGP) collimator (camera B-1) and a LEHR collimator (camera B-2).
Data acquisition was performed six times in the continuous mode with clockwise and counterclockwise rotations for 5 min/180° (rotational radius: 15 cm). A 128×128 acquisition matrix size was applied with 3.3 mm pixel size (1.45 zoom for Symbia T6 and 1.34 zoom for Infinia Hawkeye4) for all acquisitions.
Image reconstruction was performed on a workstation, using Syngo MI Applications (Siemens Healthcare, Erlangen, Germany) and Xeleris2 device (GE Healthcare, Buckinghamshire, UK). The SPECT images were reconstructed, using FBP and OSEM with AC and scatter correction. The reconstruction parameters for FBP were determined in a previous study (13). Briefly, the images were reconstructed, using a ramp filter after pre-processing by a Butterworth filter (Table 2). The OSEM of Symbia was combined with resolution recovery (RR) (Flash 3D), while
Table 1. The radioactivity of right and left striata and background in the striatal phantom
StriatumBackground
Right Left
Experiment 1 40.4 kBq/mL
20.2 kBq/mL 5.0 kBq/mL
S/B ratio* 8.08 4.03
SBRtrue** 7.08 3.03
Experiment 2 40.4 kBq/mL
20.2 kBq/mL 6.7 kBq/mL
S/B ratio* 6.03 3.01
SBRtrue** 5.03 2.01*Striatum-to-background radioactivity ratio **Specific binding ratio of true radioactivity
Maebatake A et al IR and CTAC in DaT-SPECTAOJNMB
74 Asia Oceania J Nucl Med Biol. 2016; 4(2)
2D-OSEM without RR was used in Infinia. The triple-energy window (TEW) method was
used for scatter correction, with main-energy-window width of 159 keV±10%. Sub-windows with 7% width were set right above and below the main window for scatter correction, respectively.
Specific binding ratio (SBR)The region of interest (ROI) for striatum was
the contour of each striatum on the CT image (13), placed on the slice with maximum count for striatum. For the background, a rectangular ROI (10×10 pixel) was placed on the occipital and frontal regions.
SBR was defined as the ratio of the counts obtained by subtracting the mean count of the background area (Cb) from the counts of striatum (Cs) and Cb:
The true SBR (SBRtrue) was calculated using radioactivity in the striatum and background, measured by an auto-well gamma counter (AccuFLEX γ7001, Hitachi Aloka Medical, Ltd., Tokyo, Japan); SBRtrue was considered as the reference value (Table 1). Considering S/B ratios of 8.08, 6.03, 4.03, and 3.01, SBRtrue was calculated to be 7.08, 5.03, 3.03, and 2.01, respectively.
SBR using the mean SPECT count of the striatum (Cs, mean) is referred to as SBRmean, whereas SBR using the maximum SPECT count of the striatum (CS, max) is denoted by SBRmax; SBRSPECT consisted of both SBRmean and SBRmax. The SBR recovery was calculated according to the percentage of SBRSPECT and SBRtrue as follows:
×100 (%)
Determination of reconstruction parametersThe AC in Chang’s method was determined by
pool phantom analysis, according to our previous study (13). The number of used iterations and subsets was 10 in Symbia, while eight iterations and five subsets were applied in Infinia. The μ-value of AC varied from 0.06 to 0.15 at 0.01 intervals.
The SPECT image of the pool phantom was evaluated through visual assessment for the flatness of the profile curve, the coefficient of variance (CV), and the summed difference from the reference activity. The flatness of the profile curve was visually classified into five grades by five nuclear medicine physicians (-2: obviously concave, -1: probably concave, 0: flat, +1: probably convex, and +2: obviously convex).
CV was calculated by taking the percentage of standard deviation over the mean activity, using a circular ROI (diameter: 16 cm) on the phantom image. The summed difference from the reference activity was calculated. For this purpose, a rectangular ROI (30×35 pixel) was placed on the reconstruction image. The mean activity of the top two corner pixels was used as the reference value. The difference between the reference activity and each pixel value in the used ROI was summed up (positive: convex; negative: concave). The μ-values were finally determined by evaluating these results comprehensively.
The iteration and subset number of OSEM was determined by evaluating the SPECT images of the anthropomorphic striatal phantom. The iteration number varied from 1 to 10, while the subset numbers were 1, 2, 3, 5, 6, 9, and 10, respectively. At this stage, FWHM of the Gaussian filter was 6.60 mm, which was twice the pixel size.
The striatal phantom images were evaluated by visual assessment, SBR recovery, and CV
Table 2. Reconstruction parameters for DaT SPECT images
FBP
μ-value [/cm]Butterworth filter [cycle/cm]
Order Cut-off
Camera A-1 0.12 8 0.40
Camera A-2 0.08 8 0.36
Camera B-1 0.12 8 0.44
Camera B-2 0.12 8 0.44
OSEM
μ-value [/cm] Iteration, subset Gaussian filter FWHM [mm]
Camera A-1 0.13 10, 10 8.25
Camera A-2 0.09 10, 5 8.25
Camera B-1 0.12 7, 6 8.25
Camera B-2 0.12 7, 6 8.25
Maebatake A et alIR and CTAC in DaT-SPECT AOJNMB
75Asia Oceania J Nucl Med Biol. 2016; 4(2)
of the background. On the visual assessment, the clarity of striatum and homogeneity of the background were classified into five grades by a nuclear medicine physician and four radiological technologists (5= excellent, 4= good, 3= normal,
2= poor, and 1= extremely poor). For SBR recovery, we examined a combination
of the iteration and subset number that recovery was converged. A CV of the background lower than 15% was determined as the criterion. After
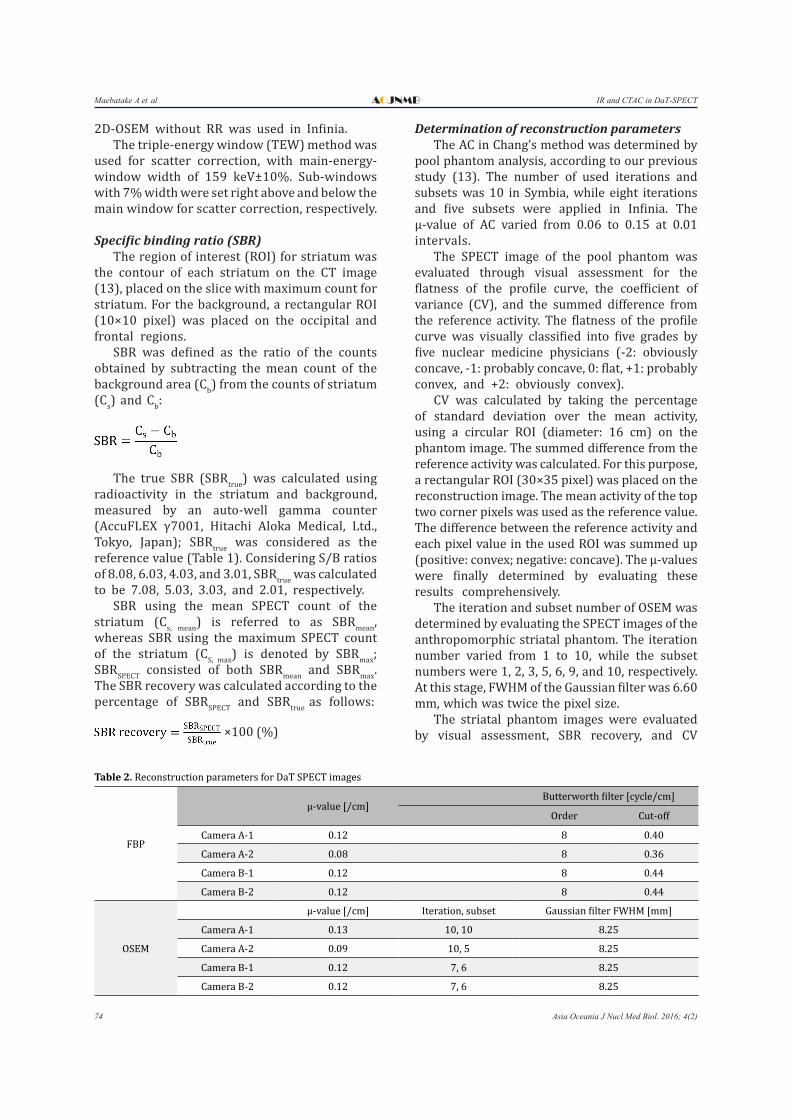
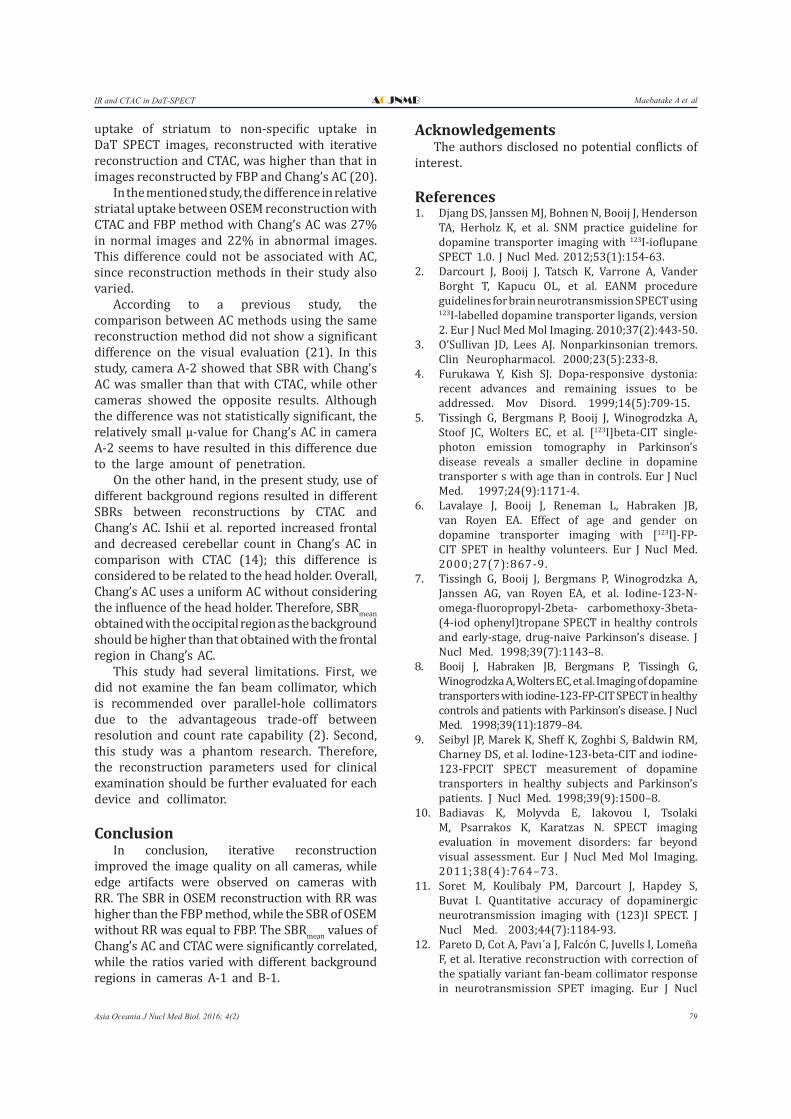
Figure 1. Relationship between the update number and SBR recovery. A) Camera A-1, B) camera A-2, C) camera B-1, and D) camera B-2 (○: SBR=6 and ○: SBR=3). The SBR recovery on camera A-1 converged at update numbers 50 to 100. The other three cameras showed early convergence at update numbers 30 to 50
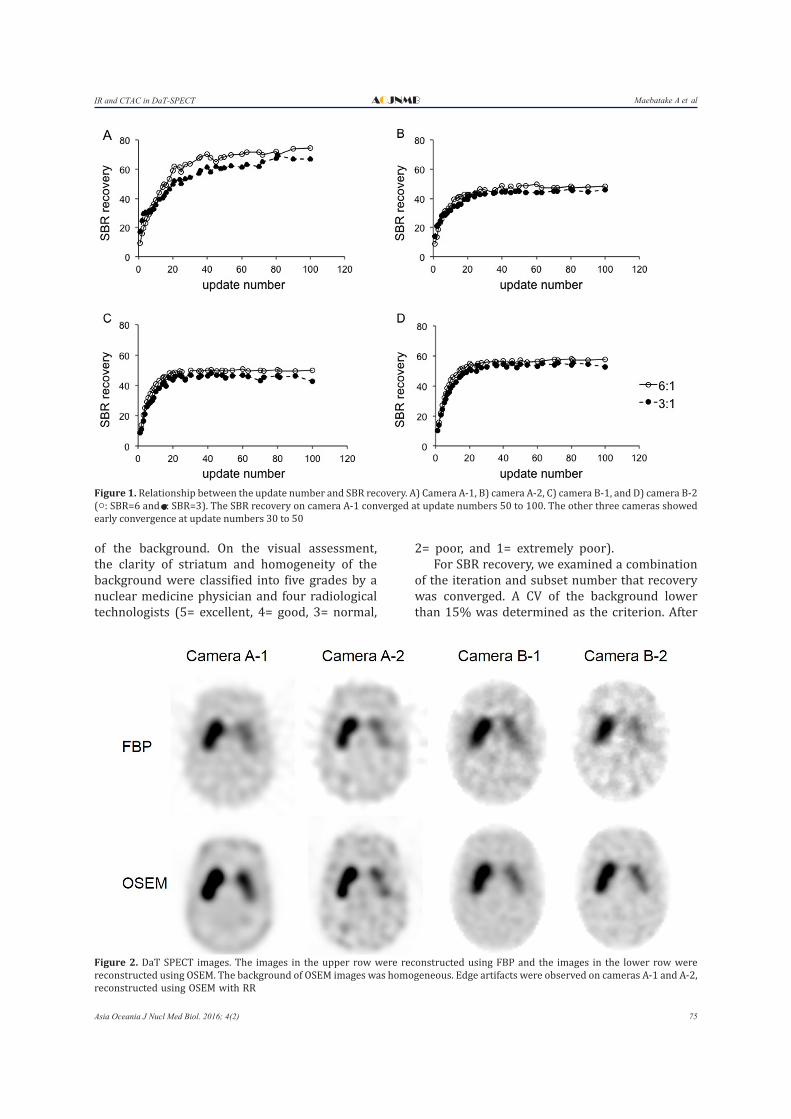
Figure 2. DaT SPECT images. The images in the upper row were reconstructed using FBP and the images in the lower row were reconstructed using OSEM. The background of OSEM images was homogeneous. Edge artifacts were observed on cameras A-1 and A-2, reconstructed using OSEM with RR
Maebatake A et al IR and CTAC in DaT-SPECTAOJNMB
76 Asia Oceania J Nucl Med Biol. 2016; 4(2)
specifying the iteration and subset number, FWHM of the Gaussian filter for OSEM was determined by the visual assessment of the SPECT image, SBR recovery, and CV of the background.
On the visual assessment, the shape, size, and clarity of striatal accumulation and homogeneity of the background were visually classified into five grades by a nuclear medicine physician and four radiological technologists (5= excellent, 4= good, 3= normal, 2=poor, and 1= extremely poor).
Statistical analysisThe comparison of SBRSPECT was performed
by examining SBR recovery and linearity in comparison with SBRtrue. The difference in SBR recovery was analyzed by Tukey-Kramer test. The linearity of the regression line was analyzed by calculating the correlation coefficient between SBRSPECT and SBRtrue. P-value less than 0.05 was considered statistically significant.
ResultsDetermination of reconstruction parameters
The most appropriate μ-value for Chang’s AC was determined to be 0.13 cm-1 for camera A-1, 0.09 cm-1 for camera A-2, and 0.12 cm-1 for cameras B-1 and B-2.
Figure 1 shows the relationship between the update number and SBR recovery at concentration
ratios of six and three. The SBR recovery on camera A-1 demonstrated slow convergence at update numbers 50 to 100, whereas the other three cameras showed early convergence at update numbers 30 to 50.
The images reconstructed using these update numbers were evaluated by visual assessment and CV of the background. According to these assessments, the number of iterations and subsets was determined as follows: 10i10s on camera 1, 10i5s on camera A-2, and 7i6s on cameras B-1 and B-2. These reconstruction parameters were used to evaluate the Gaussian filter.
The optimal FWHM of the Gaussian filter was determined to be 8.25 mm on all cameras, which was 2.5 times the pixel size, since maximum visual score of ≥ 3.5 was obtained with this FWHM in all cameras. The optimal reconstruction parameters determined in this study for each device and collimator are summarized in Table 2. Table 2 also includes parameters for FBP reconstruction, determined in our previous study (13).
Comparison of DaT SPECT between FBP and OSEM
Figure 2 shows the SPECT images reconstructed by FBP and OSEM, using the determined reconstruction parameters. Based on the comparison with FBP images, the background
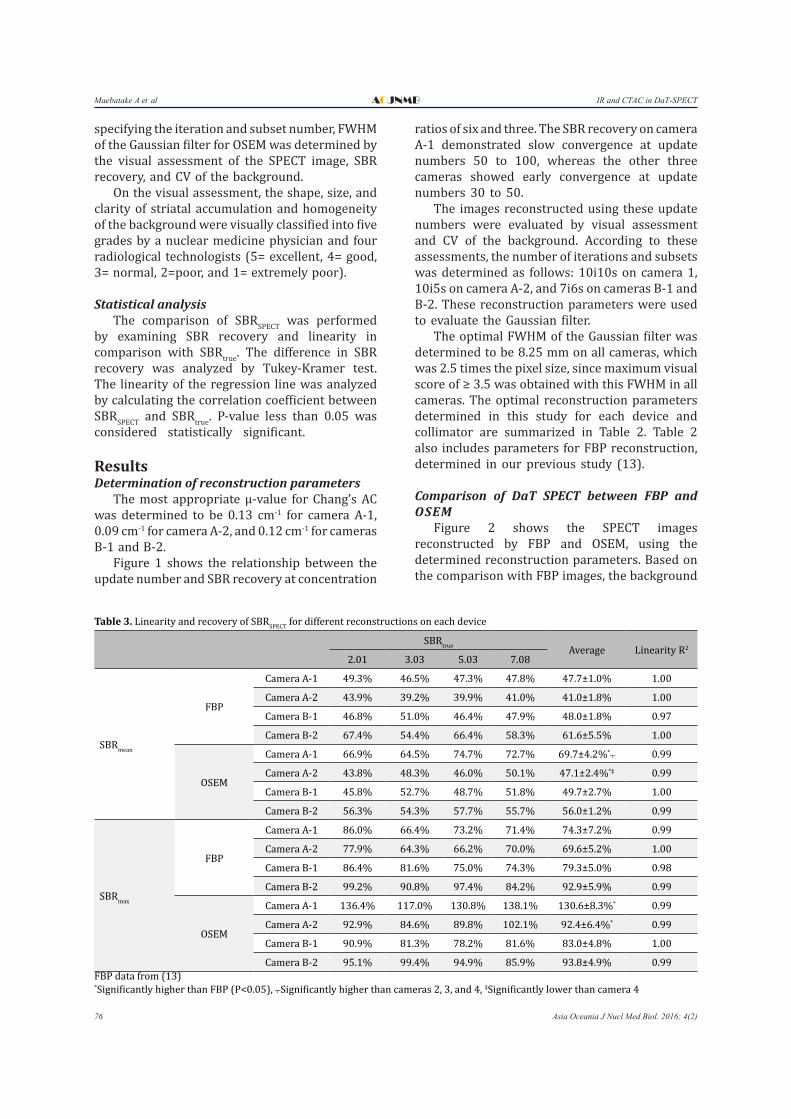
Table 3. Linearity and recovery of SBRSPECT for different reconstructions on each device
SBRtrue Average Linearity R2
2.01 3.03 5.03 7.08
SBRmean
FBP
Camera A-1 49.3% 46.5% 47.3% 47.8% 47.7±1.0% 1.00
Camera A-2 43.9% 39.2% 39.9% 41.0% 41.0±1.8% 1.00
Camera B-1 46.8% 51.0% 46.4% 47.9% 48.0±1.8% 0.97
Camera B-2 67.4% 54.4% 66.4% 58.3% 61.6±5.5% 1.00
OSEM
Camera A-1 66.9% 64.5% 74.7% 72.7% 69.7±4.2%*┬ 0.99
Camera A-2 43.8% 48.3% 46.0% 50.1% 47.1±2.4%*‡ 0.99
Camera B-1 45.8% 52.7% 48.7% 51.8% 49.7±2.7% 1.00
Camera B-2 56.3% 54.3% 57.7% 55.7% 56.0±1.2% 0.99
SBRmax
FBP
Camera A-1 86.0% 66.4% 73.2% 71.4% 74.3±7.2% 0.99
Camera A-2 77.9% 64.3% 66.2% 70.0% 69.6±5.2% 1.00
Camera B-1 86.4% 81.6% 75.0% 74.3% 79.3±5.0% 0.98
Camera B-2 99.2% 90.8% 97.4% 84.2% 92.9±5.9% 0.99
OSEM
Camera A-1 136.4% 117.0% 130.8% 138.1% 130.6±8.3%* 0.99
Camera A-2 92.9% 84.6% 89.8% 102.1% 92.4±6.4%* 0.99
Camera B-1 90.9% 81.3% 78.2% 81.6% 83.0±4.8% 1.00
Camera B-2 95.1% 99.4% 94.9% 85.9% 93.8±4.9% 0.99FBP data from (13)*Significantly higher than FBP (P<0.05), ┬Significantly higher than cameras 2, 3, and 4, ‡Significantly lower than camera 4
Maebatake A et alIR and CTAC in DaT-SPECT AOJNMB
77Asia Oceania J Nucl Med Biol. 2016; 4(2)
of OSEM-reconstructed images was homogeneous. On OSEM images of cameras A-1 and A-2, edge artifacts of high radioactivity delineation were observed. On images acquired by camera B-1, the shape of striatal uptake appeared to be broad and round.
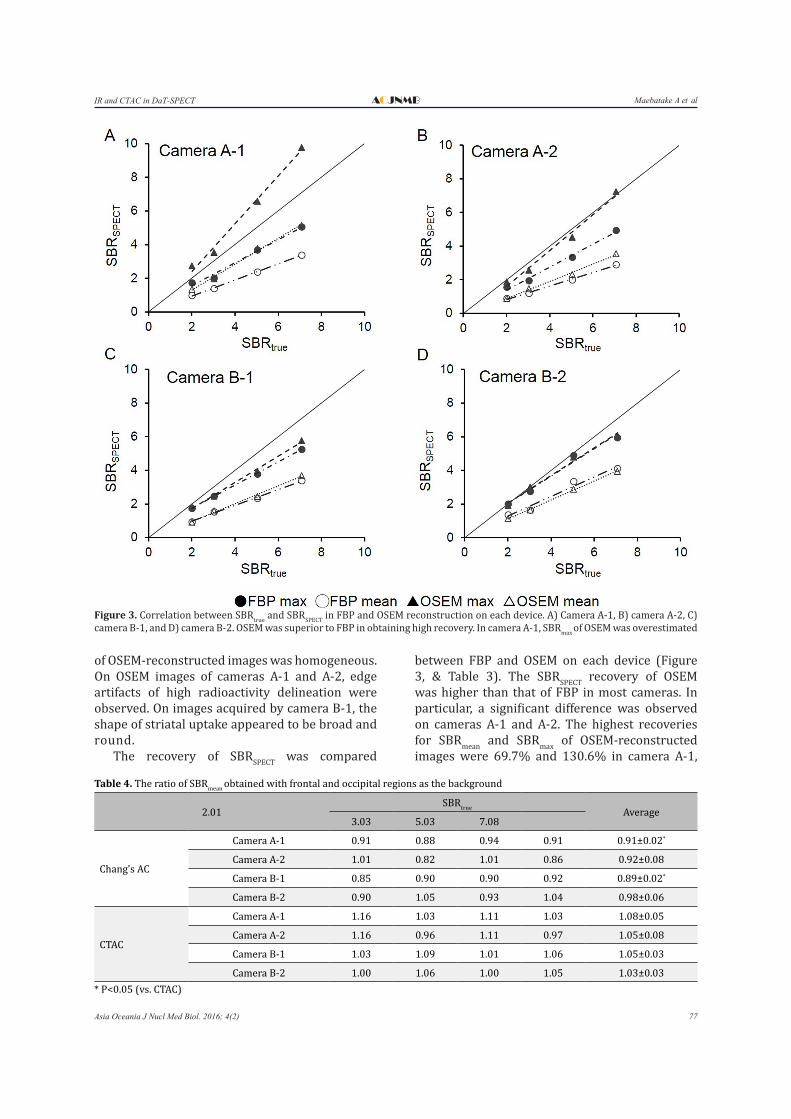
The recovery of SBRSPECT was compared
between FBP and OSEM on each device (Figure 3, & Table 3). The SBRSPECT recovery of OSEM was higher than that of FBP in most cameras. In particular, a significant difference was observed on cameras A-1 and A-2. The highest recoveries for SBRmean and SBRmax of OSEM-reconstructed images were 69.7% and 130.6% in camera A-1,
Figure 3. Correlation between SBRtrue and SBRSPECT in FBP and OSEM reconstruction on each device. A) Camera A-1, B) camera A-2, C) camera B-1, and D) camera B-2. OSEM was superior to FBP in obtaining high recovery. In camera A-1, SBRmax of OSEM was overestimated
Table 4. The ratio of SBRmean obtained with frontal and occipital regions as the background
2.01SBRtrue Average
3.03 5.03 7.08
Chang’s AC
Camera A-1 0.91 0.88 0.94 0.91 0.91±0.02*
Camera A-2 1.01 0.82 1.01 0.86 0.92±0.08
Camera B-1 0.85 0.90 0.90 0.92 0.89±0.02*
Camera B-2 0.90 1.05 0.93 1.04 0.98±0.06
CTAC
Camera A-1 1.16 1.03 1.11 1.03 1.08±0.05
Camera A-2 1.16 0.96 1.11 0.97 1.05±0.08
Camera B-1 1.03 1.09 1.01 1.06 1.05±0.03
Camera B-2 1.00 1.06 1.00 1.05 1.03±0.03* P<0.05 (vs. CTAC)
Maebatake A et al IR and CTAC in DaT-SPECTAOJNMB
78 Asia Oceania J Nucl Med Biol. 2016; 4(2)
respectively; however, SBRmax in camera A-1 using OSEM was overestimated (130.6%).
The second highest recoveries for SBRmean and SBRmax were 56.0% and 93.8% in camera B-2, respectively. In terms of SBRmax, camera A-2 improved using OSEM (92.4%), while use of FBP presented the least favorable result (69.6%). Good linearity of both SBRmax and SBRmean was observed on the images of all devices, reconstructed by both FBP and OSEM (R2>0.97).
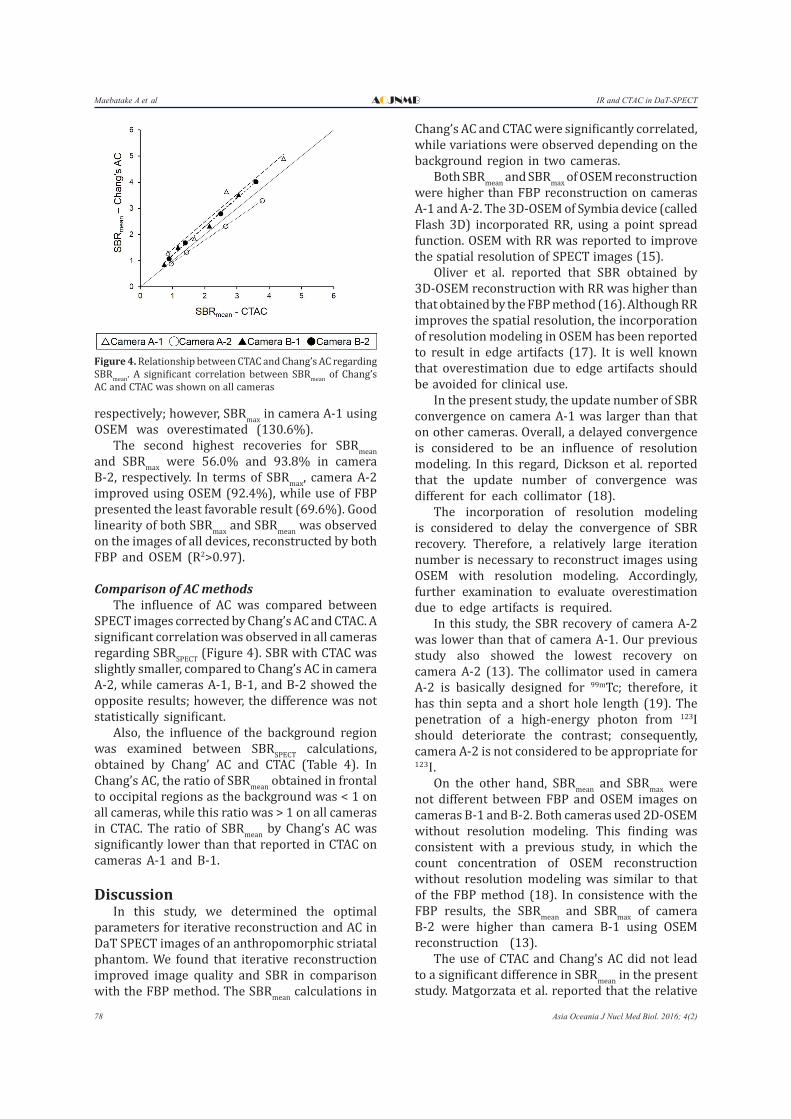
Comparison of AC methodsThe influence of AC was compared between
SPECT images corrected by Chang’s AC and CTAC. A significant correlation was observed in all cameras regarding SBRSPECT (Figure 4). SBR with CTAC was slightly smaller, compared to Chang’s AC in camera A-2, while cameras A-1, B-1, and B-2 showed the opposite results; however, the difference was not statistically significant.
Also, the influence of the background region was examined between SBRSPECT calculations, obtained by Chang’ AC and CTAC (Table 4). In Chang’s AC, the ratio of SBRmean obtained in frontal to occipital regions as the background was < 1 on all cameras, while this ratio was > 1 on all cameras in CTAC. The ratio of SBRmean by Chang’s AC was significantly lower than that reported in CTAC on cameras A-1 and B-1.
DiscussionIn this study, we determined the optimal
parameters for iterative reconstruction and AC in DaT SPECT images of an anthropomorphic striatal phantom. We found that iterative reconstruction improved image quality and SBR in comparison with the FBP method. The SBRmean calculations in
Chang’s AC and CTAC were significantly correlated, while variations were observed depending on the background region in two cameras.
Both SBRmean and SBRmax of OSEM reconstruction were higher than FBP reconstruction on cameras A-1 and A-2. The 3D-OSEM of Symbia device (called Flash 3D) incorporated RR, using a point spread function. OSEM with RR was reported to improve the spatial resolution of SPECT images (15).
Oliver et al. reported that SBR obtained by 3D-OSEM reconstruction with RR was higher than that obtained by the FBP method (16). Although RR improves the spatial resolution, the incorporation of resolution modeling in OSEM has been reported to result in edge artifacts (17). It is well known that overestimation due to edge artifacts should be avoided for clinical use.
In the present study, the update number of SBR convergence on camera A-1 was larger than that on other cameras. Overall, a delayed convergence is considered to be an influence of resolution modeling. In this regard, Dickson et al. reported that the update number of convergence was different for each collimator (18).
The incorporation of resolution modeling is considered to delay the convergence of SBR recovery. Therefore, a relatively large iteration number is necessary to reconstruct images using OSEM with resolution modeling. Accordingly, further examination to evaluate overestimation due to edge artifacts is required.
In this study, the SBR recovery of camera A-2 was lower than that of camera A-1. Our previous study also showed the lowest recovery on camera A-2 (13). The collimator used in camera A-2 is basically designed for 99mTc; therefore, it has thin septa and a short hole length (19). The penetration of a high-energy photon from 123I should deteriorate the contrast; consequently, camera A-2 is not considered to be appropriate for 123I.
On the other hand, SBRmean and SBRmax were not different between FBP and OSEM images on cameras B-1 and B-2. Both cameras used 2D-OSEM without resolution modeling. This finding was consistent with a previous study, in which the count concentration of OSEM reconstruction without resolution modeling was similar to that of the FBP method (18). In consistence with the FBP results, the SBRmean and SBRmax of camera B-2 were higher than camera B-1 using OSEM reconstruction (13).
The use of CTAC and Chang’s AC did not lead to a significant difference in SBRmean in the present study. Matgorzata et al. reported that the relative
Figure 4. Relationship between CTAC and Chang’s AC regarding SBRmean. A significant correlation between SBRmean of Chang’s AC and CTAC was shown on all cameras
Maebatake A et alIR and CTAC in DaT-SPECT AOJNMB
79Asia Oceania J Nucl Med Biol. 2016; 4(2)
uptake of striatum to non-specific uptake in DaT SPECT images, reconstructed with iterative reconstruction and CTAC, was higher than that in images reconstructed by FBP and Chang’s AC (20).
In the mentioned study, the difference in relative striatal uptake between OSEM reconstruction with CTAC and FBP method with Chang’s AC was 27% in normal images and 22% in abnormal images. This difference could not be associated with AC, since reconstruction methods in their study also varied.
According to a previous study, the comparison between AC methods using the same reconstruction method did not show a significant difference on the visual evaluation (21). In this study, camera A-2 showed that SBR with Chang’s AC was smaller than that with CTAC, while other cameras showed the opposite results. Although the difference was not statistically significant, the relatively small μ-value for Chang’s AC in camera A-2 seems to have resulted in this difference due to the large amount of penetration.
On the other hand, in the present study, use of different background regions resulted in different SBRs between reconstructions by CTAC and Chang’s AC. Ishii et al. reported increased frontal and decreased cerebellar count in Chang’s AC in comparison with CTAC (14); this difference is considered to be related to the head holder. Overall, Chang’s AC uses a uniform AC without considering the influence of the head holder. Therefore, SBRmean obtained with the occipital region as the background should be higher than that obtained with the frontal region in Chang’s AC.
This study had several limitations. First, we did not examine the fan beam collimator, which is recommended over parallel-hole collimators due to the advantageous trade-off between resolution and count rate capability (2). Second, this study was a phantom research. Therefore, the reconstruction parameters used for clinical examination should be further evaluated for each device and collimator.
ConclusionIn conclusion, iterative reconstruction
improved the image quality on all cameras, while edge artifacts were observed on cameras with RR. The SBR in OSEM reconstruction with RR was higher than the FBP method, while the SBR of OSEM without RR was equal to FBP. The SBRmean values of Chang’s AC and CTAC were significantly correlated, while the ratios varied with different background regions in cameras A-1 and B-1.
AcknowledgementsThe authors disclosed no potential conflicts of
interest.
References1. Djang DS, Janssen MJ, Bohnen N, Booij J, Henderson
TA, Herholz K, et al. SNM practice guideline for dopamine transporter imaging with 123I-ioflupane SPECT 1.0. J Nucl Med. 2012;53(1):154-63.
2. Darcourt J, Booij J, Tatsch K, Varrone A, Vander Borght T, Kapucu OL, et al. EANM procedure guidelines for brain neurotransmission SPECT using 123I-labelled dopamine transporter ligands, version 2. Eur J Nucl Med Mol Imaging. 2010;37(2):443-50.
3. O’Sullivan JD, Lees AJ. Nonparkinsonian tremors. Clin Neuropharmacol. 2000;23(5):233-8.
4. Furukawa Y, Kish SJ. Dopa-responsive dystonia: recent advances and remaining issues to be addressed. Mov Disord. 1999;14(5):709-15.
5. Tissingh G, Bergmans P, Booij J, Winogrodzka A, Stoof JC, Wolters EC, et al. [123I]beta-CIT single-photon emission tomography in Parkinson’s disease reveals a smaller decline in dopamine transporter s with age than in controls. Eur J Nucl Med. 1997;24(9):1171-4.
6. Lavalaye J, Booij J, Reneman L, Habraken JB, van Royen EA. Effect of age and gender on dopamine transporter imaging with [123I]-FP-CIT SPET in healthy volunteers. Eur J Nucl Med. 2000;27(7):867-9.
7. Tissingh G, Booij J, Bergmans P, Winogrodzka A, Janssen AG, van Royen EA, et al. Iodine-123-N-omega-fluoropropyl-2beta- carbomethoxy-3beta-(4-iod ophenyl)tropane SPECT in healthy controls and early-stage, drug-naive Parkinson’s disease. J Nucl Med. 1998;39(7):1143–8.
8. Booij J, Habraken JB, Bergmans P, Tissingh G, Winogrodzka A, Wolters EC, et al. Imaging of dopamine transporters with iodine-123-FP-CIT SPECT in healthy controls and patients with Parkinson’s disease. J Nucl Med. 1998;39(11):1879–84.
9. Seibyl JP, Marek K, Sheff K, Zoghbi S, Baldwin RM, Charney DS, et al. Iodine-123-beta-CIT and iodine-123-FPCIT SPECT measurement of dopamine transporters in healthy subjects and Parkinson’s patients. J Nucl Med. 1998;39(9):1500–8.
10. Badiavas K, Molyvda E, Iakovou I, Tsolaki M, Psarrakos K, Karatzas N. SPECT imaging evaluation in movement disorders: far beyond visual assessment. Eur J Nucl Med Mol Imaging. 2011;38(4):764–73.
11. Soret M, Koulibaly PM, Darcourt J, Hapdey S, Buvat I. Quantitative accuracy of dopaminergic neurotransmission imaging with (123)I SPECT. J Nucl Med. 2003;44(7):1184-93.
12. Pareto D, Cot A, Pavı´a J, Falcón C, Juvells I, Lomeña F, et al. Iterative reconstruction with correction of the spatially variant fan-beam collimator response in neurotransmission SPET imaging. Eur J Nucl
Maebatake A et al IR and CTAC in DaT-SPECTAOJNMB
80 Asia Oceania J Nucl Med Biol. 2016; 4(2)
Med Mol Imaging. 2003;30(10):1322–9. 13. Maebatake A, Sato M, Kagami R, Yamashita Y,
Komiya I, Himuro K, et al. An anthropomorphic phantom study of brain dopamine transporter SPECT images obtained using different SPECT/CT devices and collimators. J Nucl Med Technol. 2015;43(1):41-6.
14. Ishii K, Hanaoka K, Okada M, Kumano S, Komeya Y, Tsuchiya N, et al. Impact of CT attenuation correction by SPECT/CT in brain perfusion images. Ann Nucl Med. 2012;26(3):241-7.
15. Vija HA, Hawman EG, Engdahl JC. Analysis of a SPECT OSEM reconstruction method with 3D beam modeling and optional attenuation correction: phantom studies. IEEE Nucl Sci Symp Conf Record. 2003;4:2662-6.
16. Winz OH, Hellwig S, Mix M, Weber WA, Mottaghy FM, Schäfer WM, et al. Image quality and data quantification in dopamine transporter SPECT: advantage of 3-dimentional OSEM reconstruction? Clin Nucl Med. 2012;37(9):866-71.
17. Onishi H, Motomura N, Fujino K, Natsume T, Haramoto Y. Quantitative performance of advanced resolution recovery strategies on SPECT images:
evaluation with use of digital phantom models. Radiol Phys Technol. 2013;6(1):42-53.
18. Dickson JC, Tossici-Bolt L, Sera T, Erlandsson K, Varrone A, Tatsch K, et al. The impact of reconstruction method on the quantification of DaTSCAN images. Eur J Nucl Med Mol Imaging. 2010;37(1):23-35.
19. He X, Frey EC, Links JM, Song X, Tsui BM. Comparison of penetration and scatter effects on defects on defect contrast for GE and Siemens LEHR collimators in myocardial perfusion SPECT a simulation study. IEEE Trans Nucl Sci. 2005;52(5):1359-64.
20. Bieńkiewicz M, Górska-Chrzastek M, Siennicki J, Gajos A, Bogucki A, Mochecka-Thoelke A, et al. Impact of CT based attenuation correction on quantitative assessment of DaTSCAN ((123)I-Ioflupane) imaging in diagnosis of extrapyramidal diseases. Nucl Med Rev Cent East Eur. 2008;11(2):53-8.
21. Lange C, Seese A, Schwarzenböck S, Steinhoff K, Umland-Seidler B, Krause BJ, et al. CT-based attenuation correction in I-123-ioflupane SPECT. PLoS ONE. 2014;9(9):e108328.