evaluation of kissing bond in composite adhesive lap...
TRANSCRIPT
International Journal of Adhesion & Adhesives 42 (2013) 60–68
Contents lists available at SciVerse ScienceDirect
International Journal of Adhesion & Adhesives
0143-74
http://d
n Corr
E-m
journal homepage: www.elsevier.com/locate/ijadhadh
Evaluation of kissing bond in composite adhesive lap joints using digitalimage correlation: Preliminary studies
R.L. Vijaya Kumar n, M.R. Bhat, C.R.L. Murthy
Department of Aerospace Engineering, Indian Institute of Science, Bangalore-560012, India
a r t i c l e i n f o
Article history:
Accepted 20 December 2012The assembly of aerospace and automotive structures in recent years is increasingly carried out using
adhesives. Adhesive joints have advantages of uniform stress distribution and less stress concentration
Available online 16 January 2013Keywords:
Adhesive joints
Kissing bond
Digital image correlation
96/$ - see front matter & 2013 Elsevier Ltd. A
x.doi.org/10.1016/j.ijadhadh.2013.01.004
esponding author. Tel.: þ91 80 2293 3025;
ail address: [email protected] (R.L. Vija
a b s t r a c t
in the bonded region. Nevertheless, they may suffer due to the presence of defects in bond line and at
the interface or due to improper curing process. While defects like voids, cracks and delaminations
present in the adhesive bond line may be detected using different NDE methods, interfacial defects in
the form of kissing bond may go undetected. Attempts using advanced ultrasonic methods like
nonlinear ultrasound and guided wave inspection to detect kissing bond have met with limited success
stressing the need for alternate methods. This paper concerns the preliminary studies carried out on
detectability of dry contact kissing bonds in adhesive joints using the Digital Image Correlation (DIC)
technique. In this attempt, adhesive joint samples containing varied area of kissing bond were prepared
using the glass fiber reinforced composite (GFRP) as substrates and epoxy resin as the adhesive layer
joining them. The samples were also subjected to conventional and high power ultrasonic inspection.
Further, these samples were loaded till failure to determine the bond strength during which digital
images were recorded and analyzed using the DIC method. This noncontact method could indicate the
existence of kissing bonds at less than 50% failure load. Finite element studies carried out showed a
similar trend. Results obtained from these preliminary studies are encouraging and further tests need
to be done on a larger set of samples to study experimental uncertainties and scatter associated with
the method.
& 2013 Elsevier Ltd. All rights reserved.
1. Introduction
The need for stronger and lighter structures in aerospace andautomotive industry has driven the use of adhesive joints in theirassemblies. Adhesive bonding not only results in a uniform stressdistribution in joint structures but also allows the bonding ofdissimilar materials and assembly of composite structures. One ofthe major limiting factors of adhesive bonding is the nonavail-ability of a quantitative nondestructive technique that can detectand evaluate defects in the joint, particularly in the interfacialregion between substrate and adhesive layer. Also, degradation ofbonded joints in terms of loss of strength or other mechanicalproperties can be caused due to manufacturing errors or due toexposure of joints to moisture and temperature in service. Thisdegradation often results in change of adhesive elastic modulus.
Defects in adhesive joints can be classified into three broadcategories—internal gross defects, cohesive defects and adhesivedefects. Internal defects such as cracking, voids and porosity can
ll rights reserved.
fax: þ91 80 23600134.
ya Kumar).
be detected using conventional NDT inspection techniques suchas ultrasonics or X-ray [1–10]. Poor adhesion between theadhesive and the substrate is often difficult to detect usingconventional ultrasonic techniques as this thin interfacial layercould be orders of magnitude less than the wavelength used [11].These defects are often termed kissing bonds or zero volumebonds, where the two surfaces are held together by a compressivestress with no molecular forces acting between them [9]. Jiao andRose [10] have defined a kissing bond as a perfect contactbetween two surfaces which transmits no shear stress. Consider-able amount of literature is available on kissing bonds [9–14]. Thecombination of severity and detection difficulty of this type ofdefects in an adhesively bonded structure makes it of significantpractical importance.
Attempts by some researchers using advanced ultrasonictechniques like nonlinear acoustics for detecting and characteriz-ing kissing bonds have met with some success [15–18]. In caseof contacting surfaces the imperfect interface can introduce agreater degree of nonlinearity into the system. This nonlinearitycan be due to clapped surfaces with nonlinear stress–strainbehavior inherent in the contact leading to generation of harmo-nics of the interrogating ultrasonic frequency. These techniques
R.L. Vijaya Kumar et al. / International Journal of Adhesion & Adhesives 42 (2013) 60–68 61
are largely confined to laboratory owing to difficulties involvedin generating and propagating such waves in complex structures.Another NDE method viz., pulsed thermography also has beentried by some researchers to detect kissing bond defects [19,20].Waugh et al. [19] have shown that phase pulsed thermographycan be a potential tool to detect kissing bond defects in adhesivelybonded joints.
However, owing to the limited success of conventional NDTmethods in detection of kissing bonds, search for alternativemethods is on. Digital Image Correlation (DIC) apparently hasgood potential in this regard. The aim of this paper is to explorethe ability of this technique to detect and evaluate kissing bondsin adhesive joints. Thus, a set of glass fiber reinforced compositeadhesive lap joints were prepared with planted kissing bonds ofdifferent sizes. Nondestructive inspection tools such as ultraso-nics and X-ray imaging were also utilized as supplementarytechniques. The joints were then loaded in a testing machine tillfailure to find the correlation between the size of kissing bondand the resulting bond strength. Digital images were recorded atdifferent stages of loading and analyzed using the DIC software.Kissing bonds could be detected at loads lesser than 50% of failureload. Details of the experiments conducted and results obtainedare presented in this paper.
Table 1
2. Materials and samples
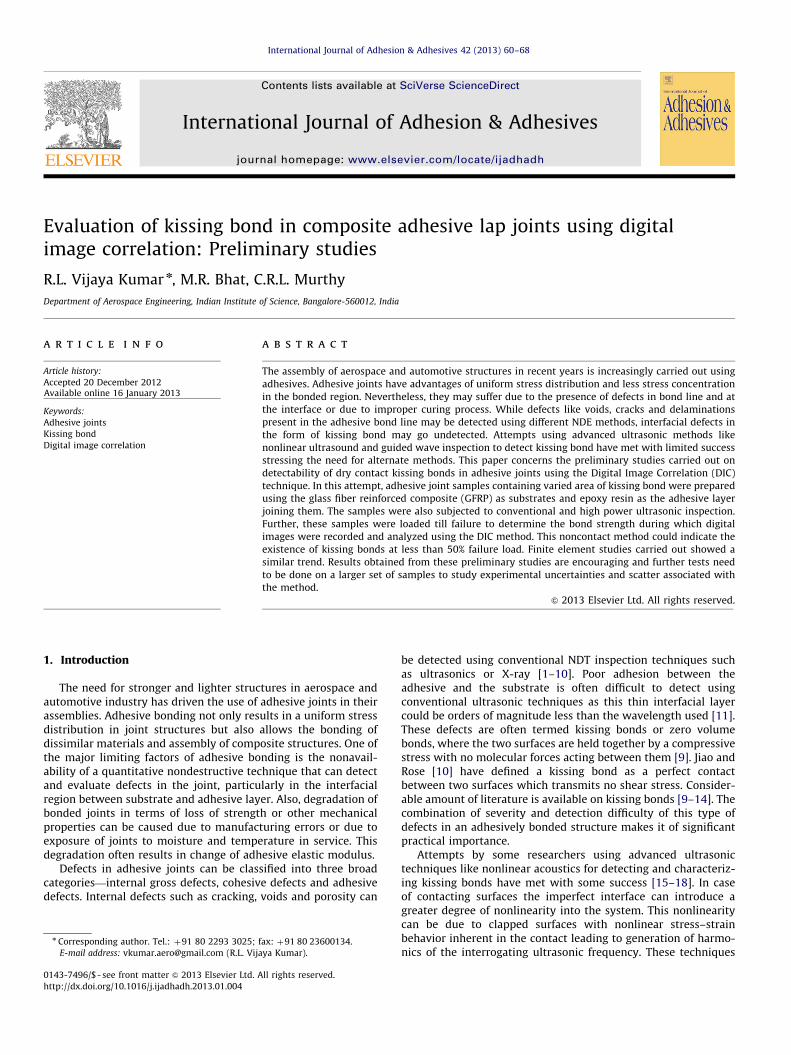
Glass fiber reinforced plastic (GFRP) composite laminates werefabricated with unidirectional (UD) E-glass fabric as reinforce-ment and thermoset epoxy resin LY556/HY 951 as the matrixwith a volume fraction of 65:35. The laminate was cured at roomtemperature with 14 layers of UD glass fabric all laid up in thesame direction. Single lap shear joint specimens (Fig. 1) wereprepared from strips cut out of unidirectional glass fiber rein-forced plastic (GFRP) laminates as substrates and a two partepoxy adhesive system (Araldite AV 138M and hardener HV 998)for the adhesive layer. Spacers were used to maintain a uniformthickness of 2.5 mm. The substrates were cut to the required sizeof 150�50 mm2, the surfaces to be joined were prepared accord-ing to ASTM D 2093 standard for surface preparation of plastics.Adhesive and the hardener were mixed in the ratio of 100:40 asper manufacturer’s recommendation.
Fig. 1. GFRP adhesive single lap joint sample.
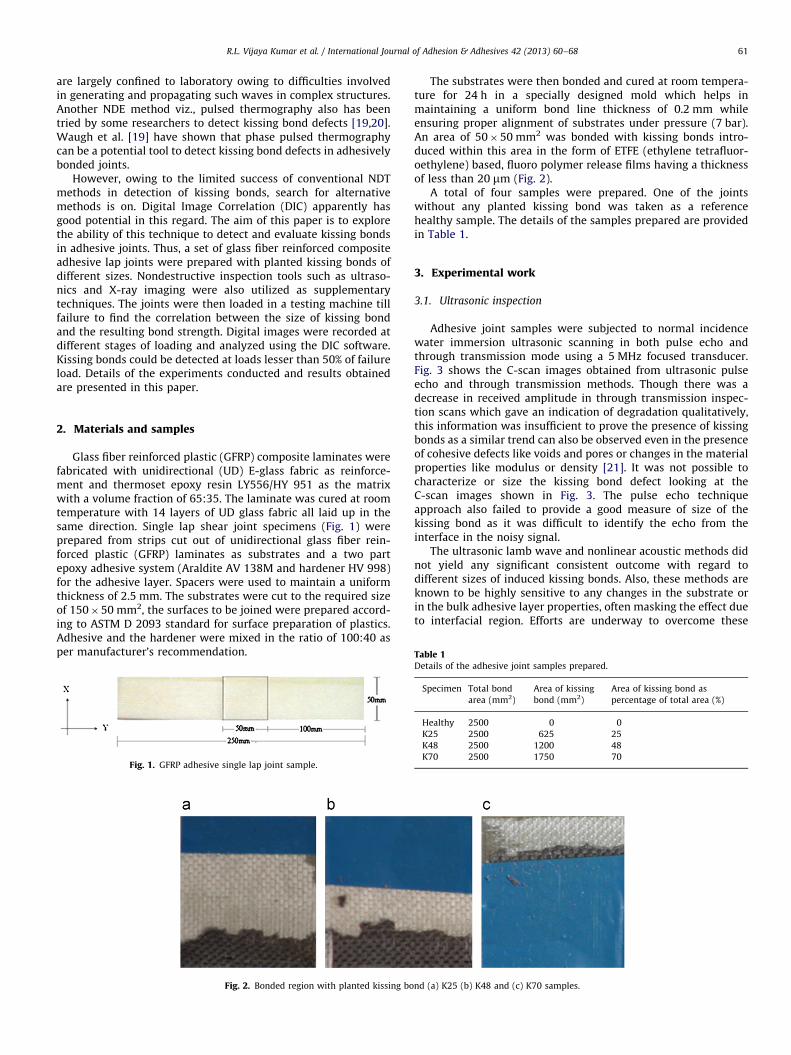
Fig. 2. Bonded region with planted kissing bo
The substrates were then bonded and cured at room tempera-ture for 24 h in a specially designed mold which helps inmaintaining a uniform bond line thickness of 0.2 mm whileensuring proper alignment of substrates under pressure (7 bar).An area of 50�50 mm2 was bonded with kissing bonds intro-duced within this area in the form of ETFE (ethylene tetrafluor-oethylene) based, fluoro polymer release films having a thicknessof less than 20 mm (Fig. 2).
A total of four samples were prepared. One of the jointswithout any planted kissing bond was taken as a referencehealthy sample. The details of the samples prepared are providedin Table 1.
3. Experimental work
3.1. Ultrasonic inspection
Adhesive joint samples were subjected to normal incidencewater immersion ultrasonic scanning in both pulse echo andthrough transmission mode using a 5 MHz focused transducer.Fig. 3 shows the C-scan images obtained from ultrasonic pulseecho and through transmission methods. Though there was adecrease in received amplitude in through transmission inspec-tion scans which gave an indication of degradation qualitatively,this information was insufficient to prove the presence of kissingbonds as a similar trend can also be observed even in the presenceof cohesive defects like voids and pores or changes in the materialproperties like modulus or density [21]. It was not possible tocharacterize or size the kissing bond defect looking at theC-scan images shown in Fig. 3. The pulse echo techniqueapproach also failed to provide a good measure of size of thekissing bond as it was difficult to identify the echo from theinterface in the noisy signal.
The ultrasonic lamb wave and nonlinear acoustic methods didnot yield any significant consistent outcome with regard todifferent sizes of induced kissing bonds. Also, these methods areknown to be highly sensitive to any changes in the substrate orin the bulk adhesive layer properties, often masking the effect dueto interfacial region. Efforts are underway to overcome these
nd (a) K25 (b) K48 and (c) K70 samples.
Details of the adhesive joint samples prepared.
Specimen Total bond
area (mm2)
Area of kissing
bond (mm2)
Area of kissing bond as
percentage of total area (%)
Healthy 2500 0 0
K25 2500 625 25
K48 2500 1200 48
K70 2500 1750 70
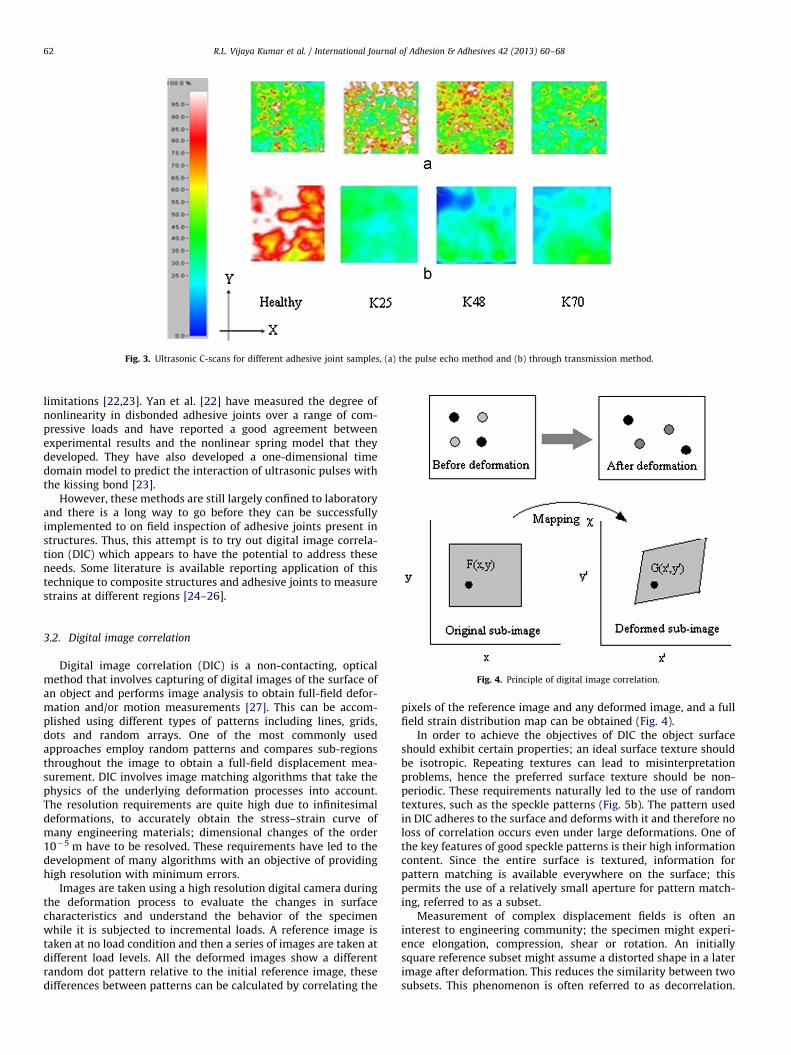
Fig. 3. Ultrasonic C-scans for different adhesive joint samples, (a) the pulse echo method and (b) through transmission method.
R.L. Vijaya Kumar et al. / International Journal of Adhesion & Adhesives 42 (2013) 60–6862
limitations [22,23]. Yan et al. [22] have measured the degree ofnonlinearity in disbonded adhesive joints over a range of com-pressive loads and have reported a good agreement betweenexperimental results and the nonlinear spring model that theydeveloped. They have also developed a one-dimensional timedomain model to predict the interaction of ultrasonic pulses withthe kissing bond [23].
However, these methods are still largely confined to laboratoryand there is a long way to go before they can be successfullyimplemented to on field inspection of adhesive joints present instructures. Thus, this attempt is to try out digital image correla-tion (DIC) which appears to have the potential to address theseneeds. Some literature is available reporting application of thistechnique to composite structures and adhesive joints to measurestrains at different regions [24–26].
Fig. 4. Principle of digital image correlation.
3.2. Digital image correlation
Digital image correlation (DIC) is a non-contacting, opticalmethod that involves capturing of digital images of the surface ofan object and performs image analysis to obtain full-field defor-mation and/or motion measurements [27]. This can be accom-plished using different types of patterns including lines, grids,dots and random arrays. One of the most commonly usedapproaches employ random patterns and compares sub-regionsthroughout the image to obtain a full-field displacement mea-surement. DIC involves image matching algorithms that take thephysics of the underlying deformation processes into account.The resolution requirements are quite high due to infinitesimaldeformations, to accurately obtain the stress–strain curve ofmany engineering materials; dimensional changes of the order10�5 m have to be resolved. These requirements have led to thedevelopment of many algorithms with an objective of providinghigh resolution with minimum errors.
Images are taken using a high resolution digital camera duringthe deformation process to evaluate the changes in surfacecharacteristics and understand the behavior of the specimenwhile it is subjected to incremental loads. A reference image istaken at no load condition and then a series of images are taken atdifferent load levels. All the deformed images show a differentrandom dot pattern relative to the initial reference image, thesedifferences between patterns can be calculated by correlating the
pixels of the reference image and any deformed image, and a fullfield strain distribution map can be obtained (Fig. 4).
In order to achieve the objectives of DIC the object surfaceshould exhibit certain properties; an ideal surface texture shouldbe isotropic. Repeating textures can lead to misinterpretationproblems, hence the preferred surface texture should be non-periodic. These requirements naturally led to the use of randomtextures, such as the speckle patterns (Fig. 5b). The pattern usedin DIC adheres to the surface and deforms with it and therefore noloss of correlation occurs even under large deformations. One ofthe key features of good speckle patterns is their high informationcontent. Since the entire surface is textured, information forpattern matching is available everywhere on the surface; thispermits the use of a relatively small aperture for pattern match-ing, referred to as a subset.
Measurement of complex displacement fields is often aninterest to engineering community; the specimen might experi-ence elongation, compression, shear or rotation. An initiallysquare reference subset might assume a distorted shape in a laterimage after deformation. This reduces the similarity between twosubsets. This phenomenon is often referred to as decorrelation.
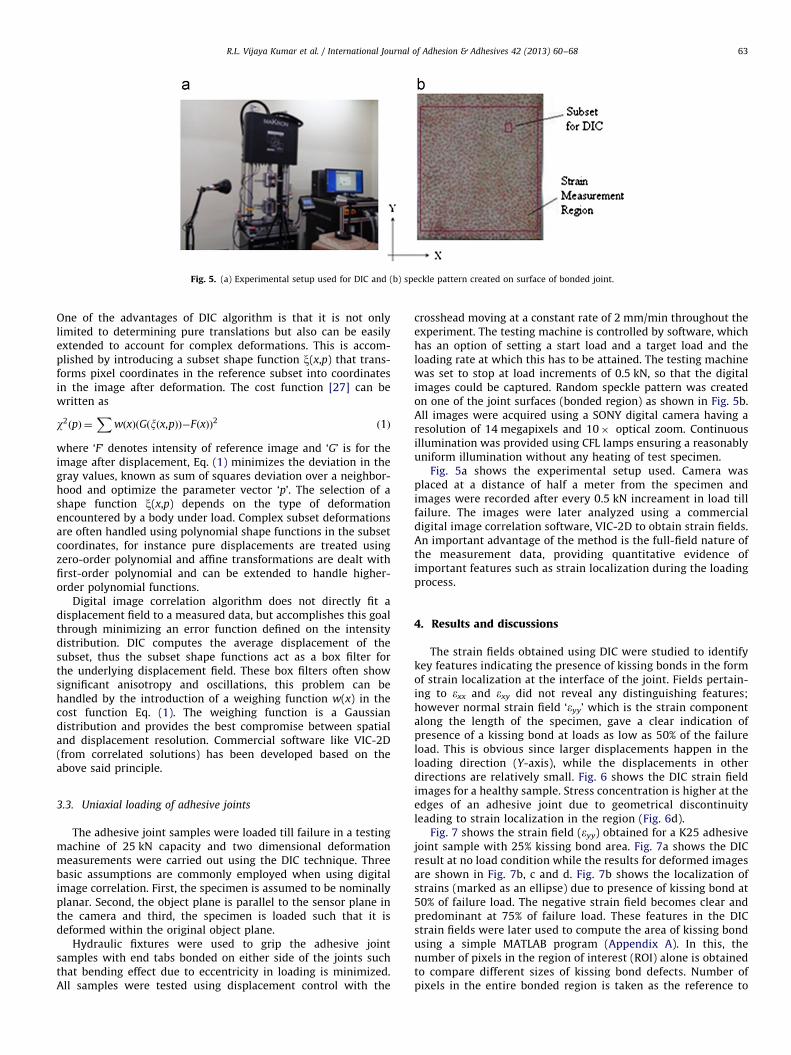
Fig. 5. (a) Experimental setup used for DIC and (b) speckle pattern created on surface of bonded joint.
R.L. Vijaya Kumar et al. / International Journal of Adhesion & Adhesives 42 (2013) 60–68 63
One of the advantages of DIC algorithm is that it is not onlylimited to determining pure translations but also can be easilyextended to account for complex deformations. This is accom-plished by introducing a subset shape function x(x,p) that trans-forms pixel coordinates in the reference subset into coordinatesin the image after deformation. The cost function [27] can bewritten as
w2ðpÞ ¼X
wðxÞðGðxðx,pÞÞ�FðxÞÞ2 ð1Þ
where ‘F’ denotes intensity of reference image and ‘G’ is for theimage after displacement, Eq. (1) minimizes the deviation in thegray values, known as sum of squares deviation over a neighbor-hood and optimize the parameter vector ‘p’. The selection of ashape function x(x,p) depends on the type of deformationencountered by a body under load. Complex subset deformationsare often handled using polynomial shape functions in the subsetcoordinates, for instance pure displacements are treated usingzero-order polynomial and affine transformations are dealt withfirst-order polynomial and can be extended to handle higher-order polynomial functions.
Digital image correlation algorithm does not directly fit adisplacement field to a measured data, but accomplishes this goalthrough minimizing an error function defined on the intensitydistribution. DIC computes the average displacement of thesubset, thus the subset shape functions act as a box filter forthe underlying displacement field. These box filters often showsignificant anisotropy and oscillations, this problem can behandled by the introduction of a weighing function w(x) in thecost function Eq. (1). The weighing function is a Gaussiandistribution and provides the best compromise between spatialand displacement resolution. Commercial software like VIC-2D(from correlated solutions) has been developed based on theabove said principle.
3.3. Uniaxial loading of adhesive joints
The adhesive joint samples were loaded till failure in a testingmachine of 25 kN capacity and two dimensional deformationmeasurements were carried out using the DIC technique. Threebasic assumptions are commonly employed when using digitalimage correlation. First, the specimen is assumed to be nominallyplanar. Second, the object plane is parallel to the sensor plane inthe camera and third, the specimen is loaded such that it isdeformed within the original object plane.
Hydraulic fixtures were used to grip the adhesive jointsamples with end tabs bonded on either side of the joints suchthat bending effect due to eccentricity in loading is minimized.All samples were tested using displacement control with the
crosshead moving at a constant rate of 2 mm/min throughout theexperiment. The testing machine is controlled by software, whichhas an option of setting a start load and a target load and theloading rate at which this has to be attained. The testing machinewas set to stop at load increments of 0.5 kN, so that the digitalimages could be captured. Random speckle pattern was createdon one of the joint surfaces (bonded region) as shown in Fig. 5b.All images were acquired using a SONY digital camera having aresolution of 14 megapixels and 10� optical zoom. Continuousillumination was provided using CFL lamps ensuring a reasonablyuniform illumination without any heating of test specimen.
Fig. 5a shows the experimental setup used. Camera wasplaced at a distance of half a meter from the specimen andimages were recorded after every 0.5 kN increament in load tillfailure. The images were later analyzed using a commercialdigital image correlation software, VIC-2D to obtain strain fields.An important advantage of the method is the full-field nature ofthe measurement data, providing quantitative evidence ofimportant features such as strain localization during the loadingprocess.
4. Results and discussions
The strain fields obtained using DIC were studied to identifykey features indicating the presence of kissing bonds in the formof strain localization at the interface of the joint. Fields pertain-ing to exx and exy did not reveal any distinguishing features;however normal strain field ‘eyy’ which is the strain componentalong the length of the specimen, gave a clear indication ofpresence of a kissing bond at loads as low as 50% of the failureload. This is obvious since larger displacements happen in theloading direction (Y-axis), while the displacements in otherdirections are relatively small. Fig. 6 shows the DIC strain fieldimages for a healthy sample. Stress concentration is higher at theedges of an adhesive joint due to geometrical discontinuityleading to strain localization in the region (Fig. 6d).
Fig. 7 shows the strain field (eyy) obtained for a K25 adhesivejoint sample with 25% kissing bond area. Fig. 7a shows the DICresult at no load condition while the results for deformed imagesare shown in Fig. 7b, c and d. Fig. 7b shows the localization ofstrains (marked as an ellipse) due to presence of kissing bond at50% of failure load. The negative strain field becomes clear andpredominant at 75% of failure load. These features in the DICstrain fields were later used to compute the area of kissing bondusing a simple MATLAB program (Appendix A). In this, thenumber of pixels in the region of interest (ROI) alone is obtainedto compare different sizes of kissing bond defects. Number ofpixels in the entire bonded region is taken as the reference to
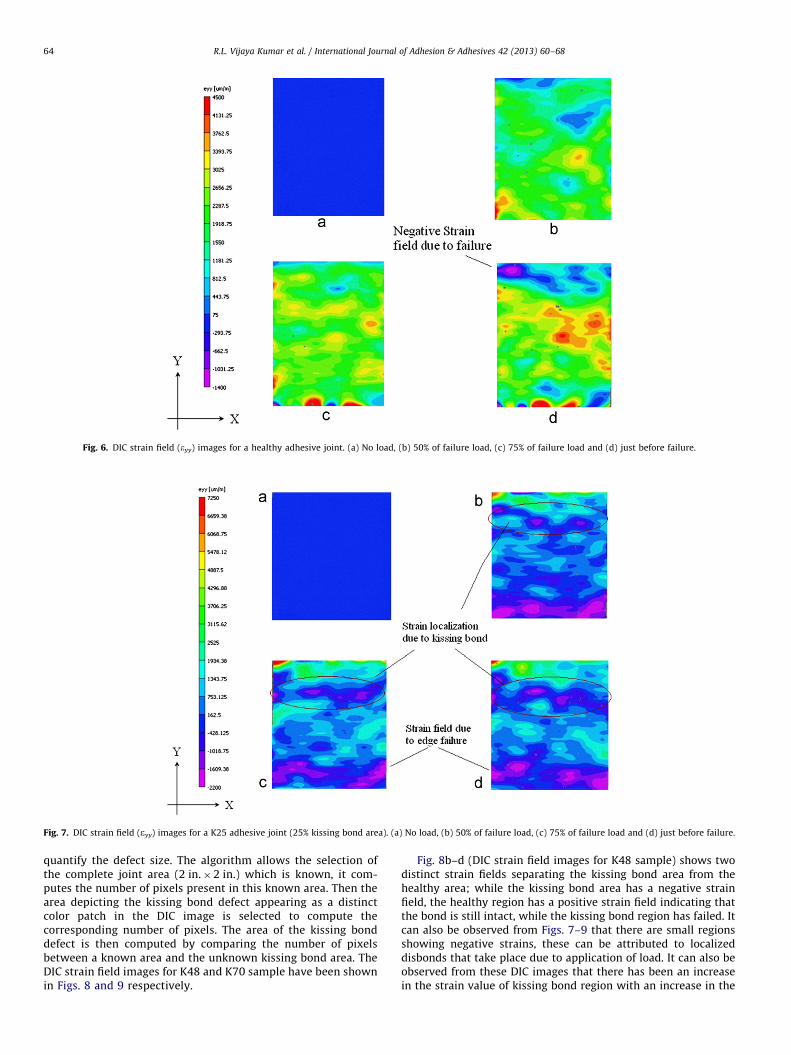
Fig. 6. DIC strain field (eyy) images for a healthy adhesive joint. (a) No load, (b) 50% of failure load, (c) 75% of failure load and (d) just before failure.
Fig. 7. DIC strain field (eyy) images for a K25 adhesive joint (25% kissing bond area). (a) No load, (b) 50% of failure load, (c) 75% of failure load and (d) just before failure.
R.L. Vijaya Kumar et al. / International Journal of Adhesion & Adhesives 42 (2013) 60–6864
quantify the defect size. The algorithm allows the selection ofthe complete joint area (2 in.�2 in.) which is known, it com-putes the number of pixels present in this known area. Then thearea depicting the kissing bond defect appearing as a distinctcolor patch in the DIC image is selected to compute thecorresponding number of pixels. The area of the kissing bonddefect is then computed by comparing the number of pixelsbetween a known area and the unknown kissing bond area. TheDIC strain field images for K48 and K70 sample have been shownin Figs. 8 and 9 respectively.
Fig. 8b–d (DIC strain field images for K48 sample) shows twodistinct strain fields separating the kissing bond area from thehealthy area; while the kissing bond area has a negative strainfield, the healthy region has a positive strain field indicating thatthe bond is still intact, while the kissing bond region has failed. Itcan also be observed from Figs. 7–9 that there are small regionsshowing negative strains, these can be attributed to localizeddisbonds that take place due to application of load. It can also beobserved from these DIC images that there has been an increasein the strain value of kissing bond region with an increase in the
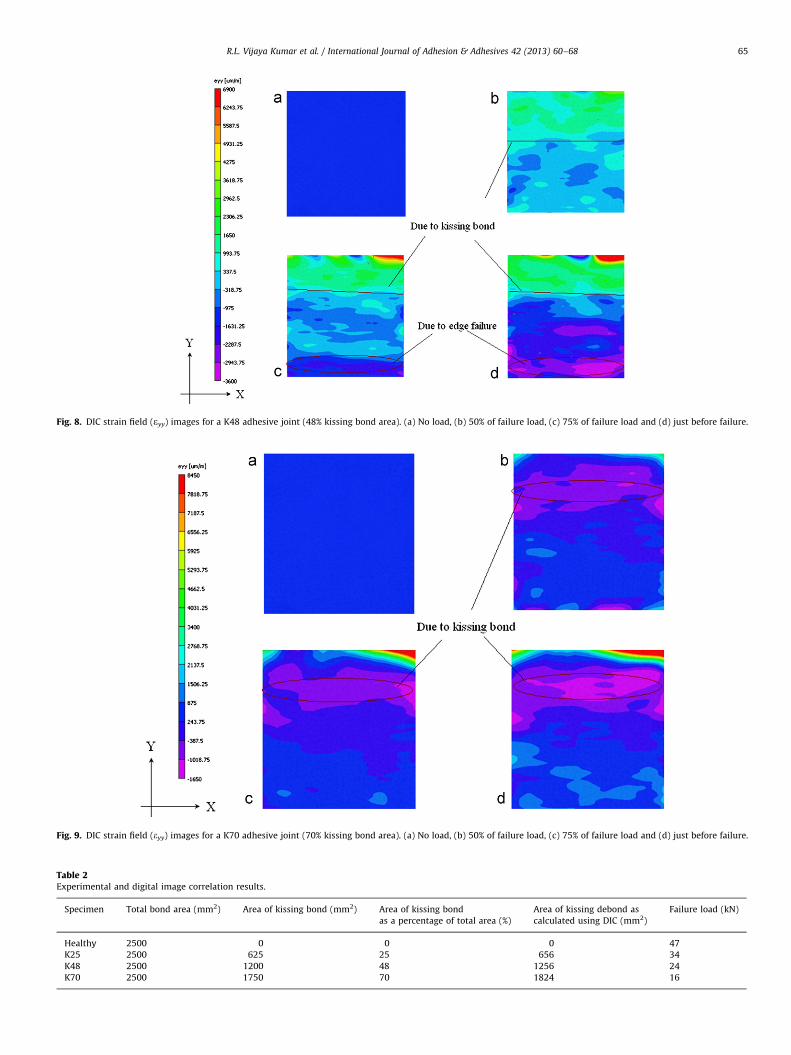
Fig. 8. DIC strain field (eyy) images for a K48 adhesive joint (48% kissing bond area). (a) No load, (b) 50% of failure load, (c) 75% of failure load and (d) just before failure.
Fig. 9. DIC strain field (eyy) images for a K70 adhesive joint (70% kissing bond area). (a) No load, (b) 50% of failure load, (c) 75% of failure load and (d) just before failure.
Table 2Experimental and digital image correlation results.
Specimen Total bond area (mm2) Area of kissing bond (mm2) Area of kissing bond
as a percentage of total area (%)
Area of kissing debond as
calculated using DIC (mm2)
Failure load (kN)
Healthy 2500 0 0 0 47
K25 2500 625 25 656 34
K48 2500 1200 48 1256 24
K70 2500 1750 70 1824 16
R.L. Vijaya Kumar et al. / International Journal of Adhesion & Adhesives 42 (2013) 60–68 65
R.L. Vijaya Kumar et al. / International Journal of Adhesion & Adhesives 42 (2013) 60–6866
applied load. This is evident from Fig. 9, where ‘eyy’ lies in therange from �387 to �1018 microstrains at 50% of failure load(Fig. 9b); however its value is largely in the range from �1018 to�1650 microstrains at failure load (Fig. 9d). This indicates anincrease in displacement component ‘v’ at or near failure load,however at 50% of failure load, the joint has higher resistance tothe applied load due to its bond strengh, which gradually reduceswith increase in applied load.
The results obtained for all the four samples are tabulated inTable 2. Healthy joint failed at a higher load of 47 kN, the failureload decreased with an increase of kissing bond area and a drasticreduction of 65% in failure load was observed for K70 adhesivejoint sample as compared to a healthy joint. The table also showsthe kissing bond area determined using DIC strain field images at50% of failure load for each sample, it can be observed that thereis a good agreement between actual kissing bond area and thatcomputed using DIC. However the area of kissing bond computedfrom DIC images using the algorithm can vary a bit, mainly due tovariation in selecting the regions defining kissing bond.
Table 3Material properties used in finite element analysis of adhesive joints.
Material EL (GPa) ET (GPa) uLT
GFRP(unidirectional) 45 10 0.25
Adhesive 4.7(E) – 0.38(u)
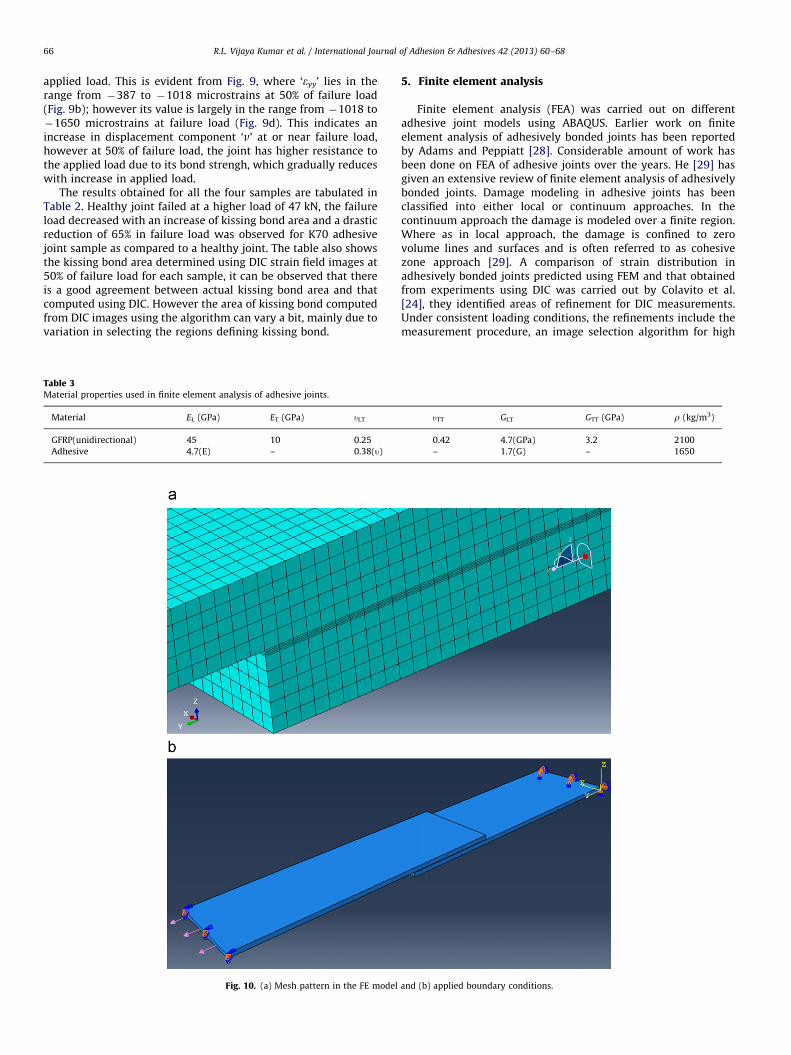
Fig. 10. (a) Mesh pattern in the FE model
5. Finite element analysis
Finite element analysis (FEA) was carried out on differentadhesive joint models using ABAQUS. Earlier work on finiteelement analysis of adhesively bonded joints has been reportedby Adams and Peppiatt [28]. Considerable amount of work hasbeen done on FEA of adhesive joints over the years. He [29] hasgiven an extensive review of finite element analysis of adhesivelybonded joints. Damage modeling in adhesive joints has beenclassified into either local or continuum approaches. In thecontinuum approach the damage is modeled over a finite region.Where as in local approach, the damage is confined to zerovolume lines and surfaces and is often referred to as cohesivezone approach [29]. A comparison of strain distribution inadhesively bonded joints predicted using FEM and that obtainedfrom experiments using DIC was carried out by Colavito et al.[24], they identified areas of refinement for DIC measurements.Under consistent loading conditions, the refinements include themeasurement procedure, an image selection algorithm for high
uTT GLT GTT (GPa) r (kg/m3)
0.42 4.7(GPa) 3.2 2100
– 1.7(G) – 1650
and (b) applied boundary conditions.
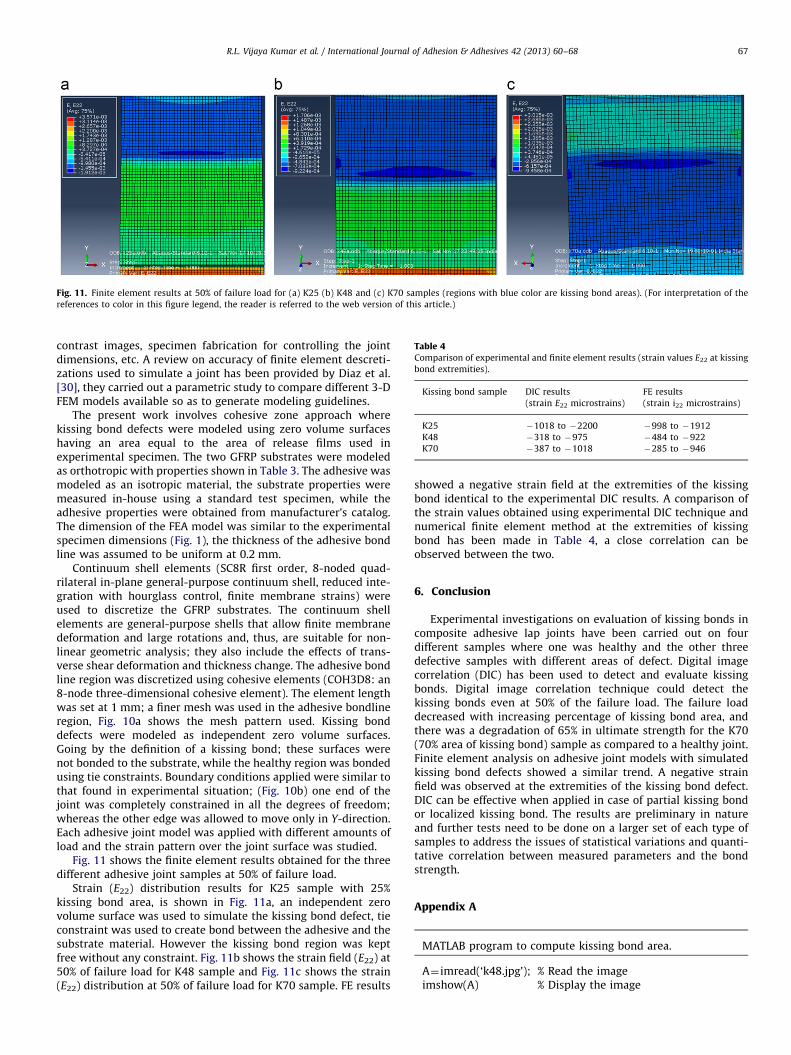
Fig. 11. Finite element results at 50% of failure load for (a) K25 (b) K48 and (c) K70 samples (regions with blue color are kissing bond areas). (For interpretation of the
references to color in this figure legend, the reader is referred to the web version of this article.)
Table 4Comparison of experimental and finite element results (strain values E22 at kissing
bond extremities).
Kissing bond sample DIC results
(strain E22 microstrains)
FE results
(strain i22 microstrains)
K25 �1018 to �2200 �998 to �1912
K48 �318 to �975 �484 to �922
K70 �387 to �1018 �285 to �946
R.L. Vijaya Kumar et al. / International Journal of Adhesion & Adhesives 42 (2013) 60–68 67
contrast images, specimen fabrication for controlling the jointdimensions, etc. A review on accuracy of finite element descreti-zations used to simulate a joint has been provided by Diaz et al.[30], they carried out a parametric study to compare different 3-DFEM models available so as to generate modeling guidelines.
The present work involves cohesive zone approach wherekissing bond defects were modeled using zero volume surfaceshaving an area equal to the area of release films used inexperimental specimen. The two GFRP substrates were modeledas orthotropic with properties shown in Table 3. The adhesive wasmodeled as an isotropic material, the substrate properties weremeasured in-house using a standard test specimen, while theadhesive properties were obtained from manufacturer’s catalog.The dimension of the FEA model was similar to the experimentalspecimen dimensions (Fig. 1), the thickness of the adhesive bondline was assumed to be uniform at 0.2 mm.
Continuum shell elements (SC8R first order, 8-noded quad-rilateral in-plane general-purpose continuum shell, reduced inte-gration with hourglass control, finite membrane strains) wereused to discretize the GFRP substrates. The continuum shellelements are general-purpose shells that allow finite membranedeformation and large rotations and, thus, are suitable for non-linear geometric analysis; they also include the effects of trans-verse shear deformation and thickness change. The adhesive bondline region was discretized using cohesive elements (COH3D8: an8-node three-dimensional cohesive element). The element lengthwas set at 1 mm; a finer mesh was used in the adhesive bondlineregion, Fig. 10a shows the mesh pattern used. Kissing bonddefects were modeled as independent zero volume surfaces.Going by the definition of a kissing bond; these surfaces werenot bonded to the substrate, while the healthy region was bondedusing tie constraints. Boundary conditions applied were similar tothat found in experimental situation; (Fig. 10b) one end of thejoint was completely constrained in all the degrees of freedom;whereas the other edge was allowed to move only in Y-direction.Each adhesive joint model was applied with different amounts ofload and the strain pattern over the joint surface was studied.
Fig. 11 shows the finite element results obtained for the threedifferent adhesive joint samples at 50% of failure load.
Strain (E22) distribution results for K25 sample with 25%kissing bond area, is shown in Fig. 11a, an independent zerovolume surface was used to simulate the kissing bond defect, tieconstraint was used to create bond between the adhesive and thesubstrate material. However the kissing bond region was keptfree without any constraint. Fig. 11b shows the strain field (E22) at50% of failure load for K48 sample and Fig. 11c shows the strain(E22) distribution at 50% of failure load for K70 sample. FE results
showed a negative strain field at the extremities of the kissingbond identical to the experimental DIC results. A comparison ofthe strain values obtained using experimental DIC technique andnumerical finite element method at the extremities of kissingbond has been made in Table 4, a close correlation can beobserved between the two.
6. Conclusion
Experimental investigations on evaluation of kissing bonds incomposite adhesive lap joints have been carried out on fourdifferent samples where one was healthy and the other threedefective samples with different areas of defect. Digital imagecorrelation (DIC) has been used to detect and evaluate kissingbonds. Digital image correlation technique could detect thekissing bonds even at 50% of the failure load. The failure loaddecreased with increasing percentage of kissing bond area, andthere was a degradation of 65% in ultimate strength for the K70(70% area of kissing bond) sample as compared to a healthy joint.Finite element analysis on adhesive joint models with simulatedkissing bond defects showed a similar trend. A negative strainfield was observed at the extremities of the kissing bond defect.DIC can be effective when applied in case of partial kissing bondor localized kissing bond. The results are preliminary in natureand further tests need to be done on a larger set of each type ofsamples to address the issues of statistical variations and quanti-tative correlation between measured parameters and the bondstrength.
Appendix A
MATLAB program to compute kissing bond area.
A¼ imread(‘k48.jpg’);
% Read the image imshow(A) % Display the image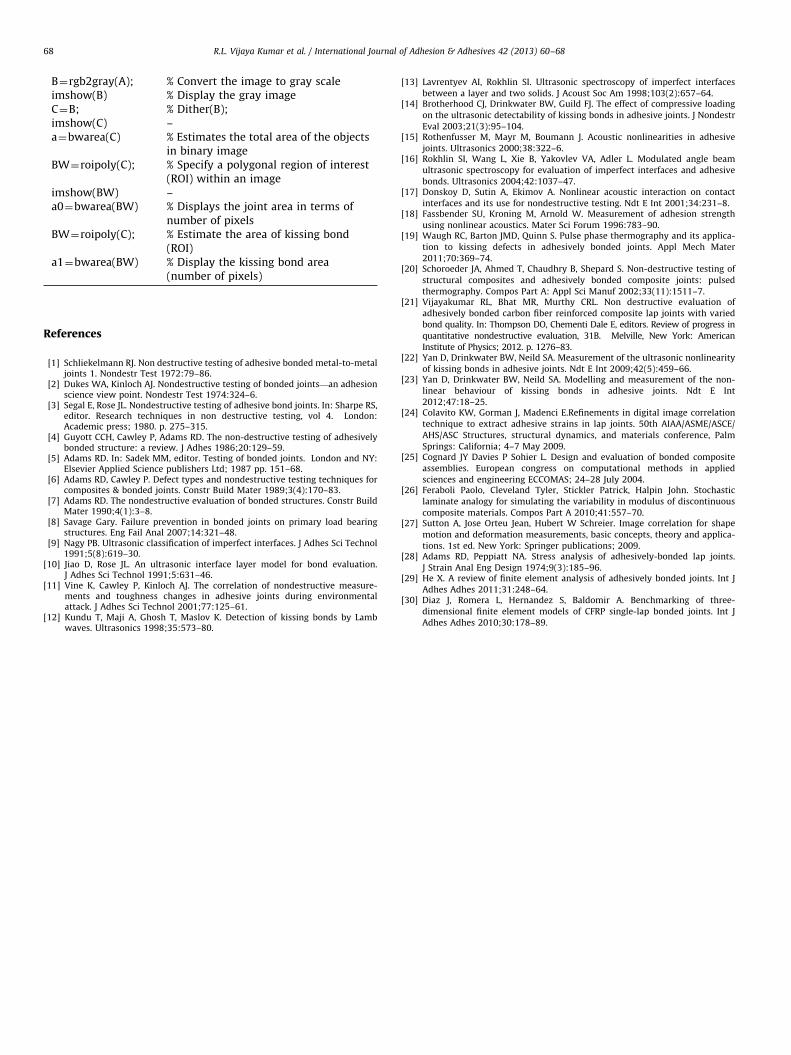
R.L. Vijaya Kumar et al. / International Journal of Adhesion & Adhesives 42 (2013) 60–6868
B¼rgb2gray(A);
% Convert the image to gray scale imshow(B) % Display the gray image C¼B; % Dither(B); imshow(C) – a¼bwarea(C) % Estimates the total area of the objectsin binary image
BW¼roipoly(C); % Specify a polygonal region of interest(ROI) within an image
imshow(BW) – a0¼bwarea(BW) % Displays the joint area in terms ofnumber of pixels
BW¼roipoly(C); % Estimate the area of kissing bond(ROI)
a1¼bwarea(BW) % Display the kissing bond area(number of pixels)
References
[1] Schliekelmann RJ. Non destructive testing of adhesive bonded metal-to-metaljoints 1. Nondestr Test 1972:79–86.
[2] Dukes WA, Kinloch AJ. Nondestructive testing of bonded joints—an adhesionscience view point. Nondestr Test 1974:324–6.
[3] Segal E, Rose JL. Nondestructive testing of adhesive bond joints. In: Sharpe RS,editor. Research techniques in non destructive testing, vol 4. London:Academic press; 1980. p. 275–315.
[4] Guyott CCH, Cawley P, Adams RD. The non-destructive testing of adhesivelybonded structure: a review. J Adhes 1986;20:129–59.
[5] Adams RD. In: Sadek MM, editor. Testing of bonded joints. London and NY:Elsevier Applied Science publishers Ltd; 1987 pp. 151–68.
[6] Adams RD, Cawley P. Defect types and nondestructive testing techniques forcomposites & bonded joints. Constr Build Mater 1989;3(4):170–83.
[7] Adams RD. The nondestructive evaluation of bonded structures. Constr BuildMater 1990;4(1):3–8.
[8] Savage Gary. Failure prevention in bonded joints on primary load bearingstructures. Eng Fail Anal 2007;14:321–48.
[9] Nagy PB. Ultrasonic classification of imperfect interfaces. J Adhes Sci Technol1991;5(8):619–30.
[10] Jiao D, Rose JL. An ultrasonic interface layer model for bond evaluation.J Adhes Sci Technol 1991;5:631–46.
[11] Vine K, Cawley P, Kinloch AJ. The correlation of nondestructive measure-ments and toughness changes in adhesive joints during environmentalattack. J Adhes Sci Technol 2001;77:125–61.
[12] Kundu T, Maji A, Ghosh T, Maslov K. Detection of kissing bonds by Lambwaves. Ultrasonics 1998;35:573–80.
[13] Lavrentyev AI, Rokhlin SI. Ultrasonic spectroscopy of imperfect interfacesbetween a layer and two solids. J Acoust Soc Am 1998;103(2):657–64.
[14] Brotherhood CJ, Drinkwater BW, Guild FJ. The effect of compressive loading
on the ultrasonic detectability of kissing bonds in adhesive joints. J NondestrEval 2003;21(3):95–104.
[15] Rothenfusser M, Mayr M, Boumann J. Acoustic nonlinearities in adhesivejoints. Ultrasonics 2000;38:322–6.
[16] Rokhlin SI, Wang L, Xie B, Yakovlev VA, Adler L. Modulated angle beamultrasonic spectroscopy for evaluation of imperfect interfaces and adhesivebonds. Ultrasonics 2004;42:1037–47.
[17] Donskoy D, Sutin A, Ekimov A. Nonlinear acoustic interaction on contactinterfaces and its use for nondestructive testing. Ndt E Int 2001;34:231–8.
[18] Fassbender SU, Kroning M, Arnold W. Measurement of adhesion strengthusing nonlinear acoustics. Mater Sci Forum 1996:783–90.
[19] Waugh RC, Barton JMD, Quinn S. Pulse phase thermography and its applica-tion to kissing defects in adhesively bonded joints. Appl Mech Mater
2011;70:369–74.[20] Schoroeder JA, Ahmed T, Chaudhry B, Shepard S. Non-destructive testing of
structural composites and adhesively bonded composite joints: pulsedthermography. Compos Part A: Appl Sci Manuf 2002;33(11):1511–7.
[21] Vijayakumar RL, Bhat MR, Murthy CRL. Non destructive evaluation ofadhesively bonded carbon fiber reinforced composite lap joints with variedbond quality. In: Thompson DO, Chementi Dale E, editors. Review of progress in
quantitative nondestructive evaluation, 31B. Melville, New York: AmericanInstitute of Physics; 2012. p. 1276–83.
[22] Yan D, Drinkwater BW, Neild SA. Measurement of the ultrasonic nonlinearityof kissing bonds in adhesive joints. Ndt E Int 2009;42(5):459–66.
[23] Yan D, Drinkwater BW, Neild SA. Modelling and measurement of the non-linear behaviour of kissing bonds in adhesive joints. Ndt E Int2012;47:18–25.
[24] Colavito KW, Gorman J, Madenci E.Refinements in digital image correlationtechnique to extract adhesive strains in lap joints. 50th AIAA/ASME/ASCE/
AHS/ASC Structures, structural dynamics, and materials conference, PalmSprings: California; 4–7 May 2009.
[25] Cognard JY Davies P Sohier L. Design and evaluation of bonded compositeassemblies. European congress on computational methods in appliedsciences and engineering ECCOMAS; 24–28 July 2004.
[26] Feraboli Paolo, Cleveland Tyler, Stickler Patrick, Halpin John. Stochasticlaminate analogy for simulating the variability in modulus of discontinuous
composite materials. Compos Part A 2010;41:557–70.[27] Sutton A, Jose Orteu Jean, Hubert W Schreier. Image correlation for shape
motion and deformation measurements, basic concepts, theory and applica-tions. 1st ed. New York: Springer publications; 2009.
[28] Adams RD, Peppiatt NA. Stress analysis of adhesively-bonded lap joints.J Strain Anal Eng Design 1974;9(3):185–96.
[29] He X. A review of finite element analysis of adhesively bonded joints. Int JAdhes Adhes 2011;31:248–64.
[30] Diaz J, Romera L, Hernandez S, Baldomir A. Benchmarking of three-dimensional finite element models of CFRP single-lap bonded joints. Int JAdhes Adhes 2010;30:178–89.