evaluation of living shoreline techniques of living shoreline techniques photo credit: jana davis,...
TRANSCRIPT
Conference Proceedings
��
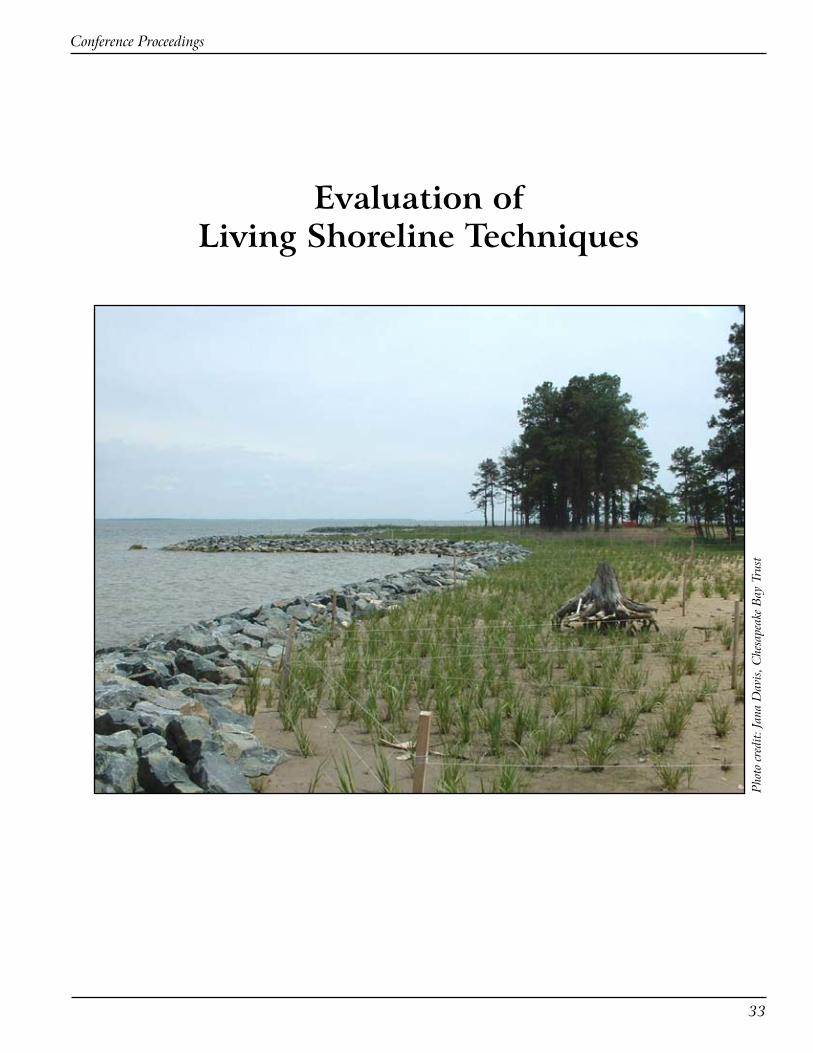
Evaluation ofLiving Shoreline Techniques
Pho
to c
redi
t: Ja
na D
avis
, Che
sape
ake
Bay
Tru
st

Living Shoreline Summit
��
Conference Proceedings
�5
Current Understanding of the Effectiveness of Nonstructural and Marsh Sill Approaches
Bhaskaran Subramanian1, Gene Slear2, Kevin M. Smith3, and Karen A. Duhring4
�Riparian and Wetland Restoration, Maryland Department of Natural Resources, Annapolis, MD ���0�, [email protected], �Environmental Concern, Inc., St. Michaels, MD, �Riparian and Wetland Restoration, Maryland Department of Natural Resources, Annapolis, MD ���0�, [email protected], and �Virginia Institute of Marine Sciences/ Center for Coastal Resources Management, Gloucester Point, VA, [email protected]
ABSTRACTA panel session at the Living Shorelines Summit in Williamsburg, Virginia was dedicated to the cur-
rent understanding of the effectiveness of nonstructural erosion protection methods and marsh sills. Four panelists described their professional experience with either design and construction or monitoring of proj-ects in tidal waters of Maryland and Virginia, including marsh edge stabilization (marsh toe revetments), marsh sills with sand fill, and planted marshes. Their collective experience revealed that planted tidal marshes and supporting structures can be effective alternatives to revetments and bulkheads. Site-specific engineering is required to ensure they provide functional ecological benefits, particularly in medium and high energy settings. Another important factor for effective projects is landowner acceptance of dynamic shoreline conditions and the level of protection provided. Additional project tracking and research is need-ed to further investigate positive and adverse effects of created tidal marshes and supporting structures.
INTRODUCTIONThe principle of living shorelines can be defined as “a shoreline restoration and protection concept that
emphasizes the use of natural materials including marsh plantings, shrubs and trees, low profile breakwa-ters/sills, strategically placed organic material, and other techniques that recreate the natural functions of a shoreline ecosystem” (1). The current paper is a summary of the presentations that were a part of the Living Shorelines Summit held in Williamsburg, VA from December 6 to 7, 2006, with Dr. Kevin Sellner as the facilitator. The most important goals for the panel were to be provocative, to challenge and inspire people about living shorelines projects, and to provide the most current information to increase under-standing of the effectiveness of nonstructural and marsh sill approaches. This paper is not a conventional manuscript; rather, it summarizes the collective experience of four shoreline professionals who were di-rectly involved with the design, construction, and monitoring of living shoreline projects. Their work and presentations are summarized below.
THE LIVING SHORELINE: MORE THAN SHORELINE STABILIZATION (Gene Slear)
Approximately 4.7 million cubic yards of sediment cloud the waters of the Chesapeake Bay every year. More than 57% of this sediment load is from tidal erosion, both shoreline and nearshore (2).
Historically, shoreline erosion was managed by installing a wood bulkhead or placing stone against the bank. In the early 1970’s, Environmental Concern (EC) constructed a salt marsh channelward of an erod-ing shoreline at a low-energy cove in Talbot County, Maryland. The marsh thrived, and shoreline erosion was reversed. Over the next two decades, scientists and engineers at EC refined and expanded the initial design, creating sustainable salt marshes in highly erosive environments.
Living Shoreline Summit
��
The advantages of the Living Shoreline over the traditional riprap or bulkhead are well-documented. In the interest of clarity, we have presented the advantages in four general categories:
ProductivityThe net primary productivity of the salt marsh exceeds that of most ecosystems (3). Tidal marshes
provide the primary food sources for the Bay’s living aquatic resources (4). Above-ground biomass in cre-ated Spartina alterniflora marshes on the Atlantic Coast or in Chesapeake Bay quickly reaches parity with natural marshes if basic conditions for marsh establishment and survival are employed (5).
Habitat Enhancement• 80% of America’s breeding bird population relies on coastal wetlands (4).
• 50% of the 800 species of protected migratory birds rely on coastal wetlands (4).
• Nearly all of the 190 species of amphibians in North America depend on coastal wetlands for breeding (6).
• The cost benefit for a living shoreline is significant. For every dollar spent to construct vegetative shoreline stabilization, as much as $1.75 is returned to the economy in the form of improvements to resources, including submerged aquatic vegetation (SAV), fish, benthic organisms, shellfish, wa-terfowl, and wetland habitat (7).
Water QualityThe salt marsh traps silt and pollutants, including nitrogen and phosphorus contained in stormwater
runoff and receiving waters (8, 9). However, only 30% of the nitrogen load is from surface runoff; the bal-ance moves unimpeded to the Bay’s waters via sub-surface flow and groundwater. When this flow encoun-ters a salt marsh, denitrification will likely occur. Denitrification is an important but little known marsh process. Simply stated, high productivity plants such as salt marsh vegetation move large amounts of biomass (carbon) below ground to provide electrons necessary to drive a process which converts elemental nitrogen to N2 (an inert gas), thereby dampening coastal eutrophication (10).
Shoreline StabilizationReduction of wave height (wave attenuation) and thus the severity of the impact at the upland bank is
a function of wave interaction with the bottom, wave interaction with the sill structure, and wave interac-tion with marsh vegetation. Knutson et al. (8) report that Spartina alterniflora (SA) marshes significantly reduced wave height and erosional energy. Wave height was reduced by 50% within the first 5 m of marsh and 95% after crossing 30 m of marsh.
A properly engineered living shoreline will provide as much or more protection than riprap or a bulk-head and will improve water quality and enhance habitat as well. Engineering is site specific. Additionally, SA living shoreline design does not always fit neatly into the regulatory guidelines. This can be frustrat-ing for the landowner who wants to protect the shoreline as quickly and as inexpensively as possible. In Maryland, the shoreline stabilization guidelines state that marsh creation is the preferred methodology and must be used wherever practicable (see new Maryland guideline details on page xiii ).
INTEGRATING HABITAT AND SHORELINE DYNAMICS INTO LIVING SHORELINE APPLICATIONS (Kevin Smith)
It is common knowledge that shorelines are not stable, but dynamic (11). With the growing number of people moving to coastal communities (12), it can be safely assumed that there will be an increasing demand for the stabilization of shorelines. Traditional methods of shoreline stabilization typically lack a habitat component. Therefore, if we are to preserve and maintain the important role that natural shore-lines provide, it is imperative that we develop solutions to address the need for erosion control, and to a
Conference Proceedings
��
greater extent, to address the historic and current loss of shoreline habitat. Living shoreline applications are a method to address this issue. The author defines living shorelines as “a concept based on an under-standing and appreciation of the dynamic and inherent values that our natural shoreline would provide and applying those natural principles to shoreline enhancement and restoration projects.”
The real challenge exists when we try to construct living shorelines in medium- and high-energy wave environments. Typically, this requires the use of some structural components. These structural compo-nents are often necessary to provide vegetation with an adequate growth environment. Further, we often overlook the fact that shorelines have been eroding naturally over time and this betrays a fundamental flaw with structured stabilizers (bulkheads and ripraps): What we see as a problem is actually a very im-portant natural process and something critical to the bay’s ecology. In some areas, the author notes that the Bay is sediment starved (in the case of sand), and erosion provides material to replenish shorelines and offshore bottoms. These sediments are critical to maintain existing beaches and near-shore sandy bottoms. Living shorelines offer the right balance between shoreline protection and the natural process of erosion. The concept of living shorelines is not a trouble-free strategy, particularly in medium and higher-energy environments (5). Determining adequate design for structures such as sills and breakwaters, while maintaining habitat function, can be very challenging and hence, is of great importance.
Structural components can be used successfully but must be constructed in a way that provides for habitat. Sills, for example, can do more harm to wildlife than good. Fish and crabs can get trapped be-hind sills and cannot escape when the tide ebbs. Hence, as above, project design must provide functional ecological benefits.
As with any project, it is imperative that landowners are involved in project goals and fully understand the project and performance they can expect. It is important to provide landowners with a reality check that, contrary to general beliefs, living shoreline projects may provide less protection than other more traditional approaches. They need to understand that shorelines are dynamic, requiring maintenance, such as the replacement of plants and/or sand, more commitment than traditional methods. Shoreline property owners need reasonable expectations within such a complex and dynamic system where success requires site-specific assessment prior to modifications and appropriate design for site characteristics. The key is to continue to develop, design, and place structures that are suitable for the environment, wildlife, and landowner goals.
NONSTRUCTURAL METHODS & MARSH SILLS: HOW EFFECTIVE ARE THEY IN VIRGINIA? (Karen Duhring)
Qualitative field evaluations of 36 tidal marsh protection structures were conducted in 2004 and 2005 in six localities on the Northern Neck and Middle Peninsula of Virginia. Twenty-eight structures were placed adjacent to natural tidal marshes for marsh edge stabilization (marsh toe revetments). Eight were marsh sill projects with sand fill and planted tidal marshes. All of the structures were made with quarry stone and two structures included gabions (wire mesh cages) to contain the stone. Most of these projects were constructed after 2000.
The created marshes were up to forty feet wide with a target slope of 10 to 1. A majority of the proj-ects were in low energy settings and most were in areas where the fetch was less than 0.5 mile. Some of these project sites also had considerable boat wake influence. Nine projects were in high energy settings, and 4 of these sites were in major tributaries with a fetch more than 5 miles. Baseline conditions before installation were not studied, but available information was obtained from permitting records (application drawings, photographs, environmental assessments).
Defining whether each project was effective or not was difficult because there were no standard param-eters. The actual need for the structure was determined based on the apparent level of erosion protection needed. Structural integrity was considered sound if there were no visible changes in rock placement, no evidence of eroded marsh edges or upland banks, and no significant changes in wetland slope. Other parameters used to determine project effectiveness were the apparent health of natural and planted marsh vegetation, physical evidence and observations of tidal exchange in and out of the marsh (e.g., wrack lines,

Living Shoreline Summit
��
dry and wet substrate), the crest height of the stone in relation to the mean high water elevation, and the vegetative transition between wetland and upland habitats.
The upland bank height was low (less than 5 feet) and baseline information indicated real or perceived erosion before installation in almost all of these projects. No active marsh or upland bank erosion was reported in only two cases where there was no apparent need to install any type of structure. Most of the stone structures remained in place with only minor structural damage or movement of rock. Sand place-ment remained stable with no visual signs of significant changes in marsh slope. Both the marsh edge stabilization structures and marsh sills were generally effective for reducing both marsh edge and upland bank erosion. Tidal exchange appeared to be adversely restricted at some of the large structures at medium energy settings. The marsh vegetation seemed to be healthy, but there were few physical indicators of tidal inundation and access for the movement of aquatic organisms was restricted along the entire length.
These projects were found to be most effective for fringing and embayed tidal marshes and less ef-fective for spit marsh features with open water on two sides. The baseline erosion condition of the spit marshes continued in spite of structures at the marsh edge and planted marsh vegetation also failed. It is not clear why these projects were not as effective for this marsh type.
In addition to the survey of marsh structures, two nonstructural methods were monitored between 2000 and 2006 during routine site inspections and shoreline advisory evaluations. Planted tidal marshes without structures were generally not as effective for reducing upland bank erosion as planted marshes with sills. Although tidal marsh vegetation was successfully established in the intertidal area in some cases, the planted marshes were apparently not wide enough for wave and erosion reduction. The planted vegetation failed at sites where regular high tides reached the upland bank and where overhanging trees cast too much shade. The time of year for planting also mattered. Planted marshes completed in early spring were more successful than those planted later in the summer, probably due to heat stress. Anec-dotal reports of grazing by mute swans were also received, similar to Canada geese.
Bank grading is another nonstructural practice in Virginia with and without erosion control structures at the toe of the graded banks. Presently, there are no guidelines for how to incorporate the intertidal area for a wide, planted marsh adjacent to graded upland banks. Boat wake and storm erosion continued at graded banks without a wide intertidal area. Functional riparian buffer habitats were not commonly re-stored on graded banks, although a dense cover of upland vegetation is recommended for additional bank stabilization and erosion protection particularly where storm waves may strike the bank.
The main finding from the study and observations mentioned was that low stone structures were the most effective for erosion protection where they were placed along the edge of wide, natural fringe marshes adjacent to low banks. Several practices were found to be less effective for reducing erosion or they adversely impacted habitat functions of the tidal marshes. For the marsh protection structures, tidal exchange within the marsh was sometimes restricted by tightly packed stone or the structure height. Structures placed adjacent to spit marsh features were also found to be less effective.
For the nonstructural methods, planted marshes were most successful where regular high tides do not reach the upland bank and when the vegetation was planted in early spring. Graded banks without a marsh terrace or a dense cover of riparian vegetation remained vulnerable to erosion and storm waves. Due diligence by property owners and contractors for routine inspections and repairs was another com-mon factor in effective projects, both structural and nonstructural.
EVALUATION OF MARSH SILLS, GROINS AND EDGING PROJECTS ON MARYLAND’S EASTERN SHORE: A PILOT STUDY OF TALBOT COUNTY (Bhaskaran Subramanian)
Maryland Eastern Shore RC&D Council, Inc. has been working on living shoreline projects for over 20 years (1987-2006) and has completed 258 projects. RC&D wanted to document the success of these proj-ects so as to expand the knowledge base for the concept of living shorelines techniques as a viable erosion control alternative to conventional bulkheads and ripraps. A pilot study of 35 projects (marsh sills, groins, and edging) in Talbot County was conducted as a part of the effort. Parameters included slope of the bank
Conference Proceedings
��
(steep or flat as compared to as-build), bank condition (undercut/slumping), marsh erosion, structure type (sills/groins/edging), structure condition (displacement, sinking, or no change), and the presence/absence of plant species (other than the ones that were planted initially) were studied to assess the success of all projects. The study also involved the development of a Geographical Information System (GIS) database that could aid in decision-making for future projects.
A Global Positioning System (GPS) unit was used in the field to collect and input data related to loca-tion and other parameters. A laser level was used to calculate the change in slope along the marsh fringes, and a camera was used to record the current status of the projects for comparative analysis.
After careful analysis of the data, it was found that 83% of banks inspected were stable (no undercut or slumping), and 74% of the marshes exhibited minimal erosion or no erosion. The stone structures in 71% of the projects were in excellent condition. Overall, 32 out of the 35 projects studied were ranked good or improved from initial conditions. Therefore, the pilot study results indicate that living shorelines have been used successfully for erosion control purposes. Further studies are needed to confirm the findings with additional data and analysis needed to determine impacts of fetch, energy of the system, and the role of design type to expand knowledge of living shoreline project success. Plans are in place to inspect the remaining projects in other counties.
PANEL CONCLUSIONIt can be concluded that design guidance for living shorelines projects is necessary for successful use of
this technology. If designed properly, living shorelines have shown to be an appropriate tool for address-ing erosion control issues in many cases. Project design is site specific and a combination of structural approaches (stone sills or breakwaters) with marsh plantings has been shown to be synergistically effective for both erosion protection and providing habitat for aquatic organisms. Though there is skepticism about using rock, it is imperative to understand that in most cases, rock acts as the first line of defense for marsh vegetation. A more robust database and further monitoring of existing projects are critical to understand-ing project design and possible site-specific success. Maintenance of living shorelines projects is critical. Overall, living shoreline technology can successfully be used for shoreline protection while providing es-sential habitat in many erosional areas.
REFERENCES1. Maryland Shorelines Online: Definitions; http://shorelines.dnr.state.md.us/definitions.asp
2. Chesapeake Bay Program. 2005. http://www.mgs.md.gov/coastal/pub/tidalerosionChesBay.pdf
3. Clark, J. 1974. The Conservation Foundation. Washington, D.C. 191 pp.
4. Kesselheim, A.S. and B.E. Slattery. 1995. WOW! The Wonders of Wetlands: An Educator’s Guide. Environmental Concern Inc.: St. Michaels, MD and The Watercourse: Bozeman, MT. 278 pp.
5. Matthews, G.A. and T.J. Minello. 1994. Technology and Success in Restoration, Creation, and Enhancement of Spartina alterniflora marshes in the United States: Volume 1 – Executive Summary and Annotated Bibliography. U.S. Department of Commerce: National Oceanic and Atmospheric Administration, Coastal Ocean Office. 71 pp.
6. Hammer, D.A. 1997. Creating Freshwater Wetlands. Lewis Publishers, Inc. Chelsea, MI. 298 pp.
7. U.S. Army Corps of Engineers. 1990. Chesapeake Bay Shoreline Erosion Study. Department of the Army, U.S. Army Corps of Engineers, Baltimore, MD, USA. 111 pp.
8. Knutson, P.L., R.A. Brochu, W.N. Seelig, and M. Inskeep. 1982. Wave Damping in Spartina alterniflora Marshes. Wetlands. 2:87-104.
Living Shoreline Summit
�0
9. Tiner, R.W. and D.G. Burke. 1995. Wetlands of Maryland. U.S. Fish and Wildlife Service, Ecological Services, Region 5, Hadley MA and Maryland Department of Natural Resources, Annapolis, MD. 193 pp.
10. Howes, B.L., P.K. Weiskel, D.D. Goehringer, and J.M. Teal. 1996. Interception of Freshwater and Nitrogen Transport from Uplands to Coastal Waters: The Role of Saltmarshes. In: “Estuarine Shores: Hydrological, Geomorphical, and Ecological Interactions” K. Nordstrom and C. Roman (eds.). Wiley Interscience. Sussex, England. pp. 287-310.
11. Hardaway, Jr., C.S. and R.J. Byrne. 1999. Shoreline Management in Chesapeake Bay. http://www2.vims.edu/seagrant/vasg-pubs-pdfs/shoreline.pdf
12. National Ocean Economics Program. 2007. Marine Policy. http://noep.mbari.org/Demographics/demogResults
Conference Proceedings
��
A Comparison of Structural and Nonstructural Methods for Erosion Control and Providing Habitat in
Virginia Salt Marshes
Karen A. Duhring
Center for Coastal Resources Management, Virginia Institute of Marine Science, P.O. Box ����, Gloucester Point, Virginia ��0��-����, [email protected]
ABSTRACTShoreline stabilization methods that emphasize the use of tidal marshes and riparian vegetation are
encouraged as a baseline defense for tidal shoreline erosion in Virginia. The effectiveness of three of these methods in preventing erosion and providing habitat was evaluated, including marsh stabilization struc-tures (marsh toe revetments and sills), planted tidal marshes, and bank grading. This evaluation includes results from a recent field survey of 36 tidal marsh stabilization structures, permitting records, and other monitoring data. Marsh structures effectively reduced erosion of fringing and embayed marshes but were not as effective for gradually disappearing spit marshes. Adverse impacts of restricted tidal exchange were observed where the revetment height was more than one foot above the mean high water elevation. The two nonstructural methods provided both habitat and erosion protection, but were generally not as effec-tive as marsh structures. Planted marshes were most effective where regular high tides do not reach the upland bank. Graded banks that included a flat area for marsh vegetation at the toe were more effective than banks graded steeply landward from the toe. Graded banks maintained as lawns were not as effec-tive for preventing storm erosion as densely vegetated slopes. Additional research is needed to investigate how sand fill and fiber materials can be used beneficially to enhance tidal salt marshes and beaches for erosion protection.
INTRODUCTIONErosion control structures are widely used on Virginia’s tidal shorelines to protect private and public
property. Flood reduction, improving riparian access and landscape aesthetics, improving navigation, and creating recreational beaches are other motivating factors for shoreline modifications. Shoreline armoring, or hardening, refers to the cumulative impact of fixed structures, such as vertical bulkheads, stone revet-ments, offshore breakwaters, groins, and jetties. These structures are effective for protecting the upland from wave attack and erosion, yet it is now apparent that they may not be appropriate for all shoreline types. Multiple structures installed in a piecemeal fashion degrade estuarine ecosystem conditions due to increased wave reflection and water depth, decreased sediment supply, tidal wetland and beach loss, and forest fragmentation (1-3).
Coastal erosion management programs generally discourage shoreline modifications unless they are absolutely necessary to protect property from coastal hazards. Where erosion must be stabilized, the “liv-ing shorelines” approach suggests using environmentally sensitive protection. Methods that enhance tidal shoreline habitats are encouraged where such methods offer effective stabilization (4,5).
Nonstructural methods such as planting tidal marshes, bank grading, and beach nourishment are fea-sible for shorelines experiencing mild erosion. These low energy shorelines tend to occur where the widest fetch is less than 1 mile (5-7). Planted marshes and other nonstructural methods are not as effective if the wave climate is excessive, the intertidal area is narrow, if there is no sand entrapment by the marsh, or there is regular boat wake influence (4,6).
Living Shoreline Summit
��
Some techniques include structures but also incorporate wetland and upland vegetation that acts as an erosion buffer and provides other ecological functions (8). These “hybrid” type projects, such as marsh toe revetments and marsh sills, incorporate both nonstructural and structural elements for successful stabilization. The strategically placed structure forces waves to break channelward from the upland bank with only minimal alteration to the wave climate. A dense vegetation cover or wide sand beach provides additional wave dissipation (6,8).
According to a database maintained by the Center for Coastal Resources Management at the Virginia Institute of Marine Science, 8.2 miles of tidal marsh stabilization structures were permitted in Virginia from 2001-2006. It is presumed that marsh structures are beneficial because they preserve eroding tidal marshes and make it possible to create new ones where they do not naturally exist (3). In order for these projects to effectively provide habitat functions, tidal exchange and the movement of aquatic animals into and out of the marsh cannot be severely restricted. Healthy tidal marsh vegetation requires ad-equate tidal inundation with complete drainage at low tide. Numerous aquatic organisms utilize fringing marshes along the channelward edge where these structures tend to be placed (9). The indirect effects of marsh stabilization structures on sediment transport, temperature regulation, and access to the marsh for habitat use are still not completely understood (8). The purpose of this study was to compare available information about two nonstructural methods (planted tidal marshes, bank grading) with the hybrid method of using marsh toe revetments and marsh sills. The relative need for the struc-tures and the effectiveness of each method for reducing visible erosion scarps and providing habitat were evaluated.
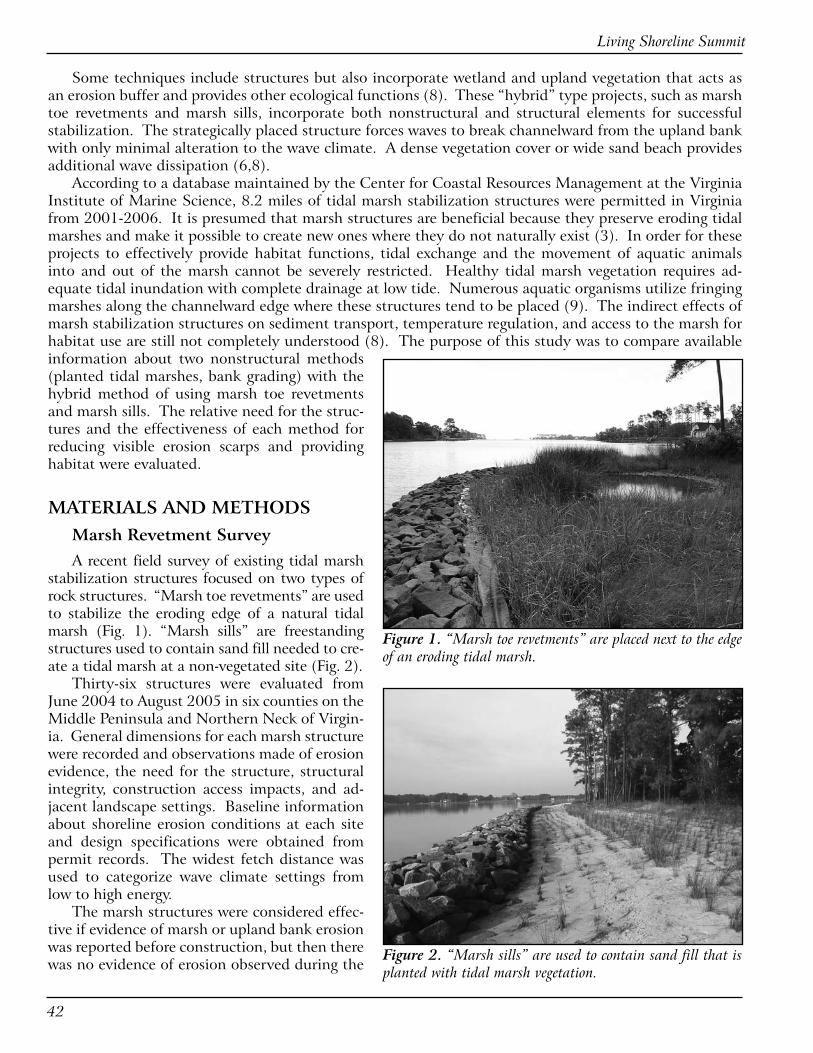
MATERIALS AND METHODSMarsh Revetment SurveyA recent field survey of existing tidal marsh
stabilization structures focused on two types of rock structures. “Marsh toe revetments” are used to stabilize the eroding edge of a natural tidal marsh (Fig. 1). “Marsh sills” are freestanding structures used to contain sand fill needed to cre-ate a tidal marsh at a non-vegetated site (Fig. 2).
Thirty-six structures were evaluated from June 2004 to August 2005 in six counties on the Middle Peninsula and Northern Neck of Virgin-ia. General dimensions for each marsh structure were recorded and observations made of erosion evidence, the need for the structure, structural integrity, construction access impacts, and ad-jacent landscape settings. Baseline information about shoreline erosion conditions at each site and design specifications were obtained from permit records. The widest fetch distance was used to categorize wave climate settings from low to high energy.
The marsh structures were considered effec-tive if evidence of marsh or upland bank erosion was reported before construction, but then there was no evidence of erosion observed during the
Figure 1. “Marsh toe revetments” are placed next to the edge of an eroding tidal marsh.
Figure 2. “Marsh sills” are used to contain sand fill that is planted with tidal marsh vegetation.

Conference Proceedings
��
field evaluation. Indicators of effective habitat functions included a healthy and diverse stand of tidal marsh vegetation with only minor dis-ruption of tidal exchange. Other positive indi-cators include a connected cover of vegetation between upland and wetland habitats plus evi-dence of wildlife utilization.
Planted Tidal Marshes and Bank
GradingInformation about planted tidal marshes
and bank grading was obtained from permitting records and shoreline evaluations performed as an advisory service to regulatory agencies and the general public. The planted tidal marshes in this study were relatively small, voluntary habi-tat restoration projects sponsored by grassroots organizations and individuals (Fig. 3). The pres-ence or absence of visible erosion scarps after planting, the local wave climate, water depth at the bank toe, and frequency of boat wakes were considered.
Numerous bank grading projects were tracked between 2000 and 2006 to monitor how effective this nonstructural method is over time (Fig. 4). Graded banks are effective if ac-tive erosion does not continue even with period-ic wave action and run up. The presence or ab-sence of dense herbaceous or woody vegetation was noted, particularly at the toe of the graded slope where storm waves are likely to strike.
RESULTSMarsh Revetment SurveyTen planted tidal marsh projects that did
not include stone structures were evaluated. All but 4 were constructed in the past 5 years. They were all constructed with quarry stone on filter cloth, including 2 projects that used gabions to contain the stone. A small stone size was used in most cases, permitting hand placement at marsh sites with limited access for heavy equipment.
The average revetment length was 271 feet and there were 17 structures that exceeded a 200-foot length. Ten of these long, continuous structures had tidal openings. The base width varied from 3-14 feet, with an average of 6.5 feet at low-energy settings. Four projects at high-energy locations had base widths ranging from 6 to 14 feet where the widest fetch was greater than 5 miles. The height of all the structures above the substrate was less than 4 feet and usually less than 3 feet. The top elevation was more than 1 foot above the mean high water elevation in 21 cases.
Planting tidal marsh vegetation on sand fill was included with 8 project designs. The created marsh width varied from a narrow fringe less than 5 feet wide to a 40-foot wide high marsh and low marsh com-bination at one of the high-energy sites. The plant species used were primarily Spartina alterniflora and S. patens. Only one of these planted marshes failed to establish.
Figure 3. A planted tidal marsh with Spartina alterniflora on the existing grade using natural marsh vegetation as a benchmark (foreground).
Figure 4. A previously vertical, eroding bluff was graded and planted with native and ornamental grasses.
Living Shoreline Summit
��
Where existing natural marshes were present, marsh erosion was almost always present before installa-tion. Three different types of eroding tidal marshes were targeted, including fringing marshes (n=18), spit marshes (n=12), and embayed marshes with tidal ponds (n=4). The natural marsh width was between 20-50 feet in 25 of these cases and greater than 50 feet wide at 3 sites. The upland banks adjacent to these structures were usually less than 5 feet high. Upland bank erosion was not always reported before construction.
Most of these marsh revetments were located in low energy settings where the widest fetch was less than 0.5 mile (n=20), although nonstructural methods should be sufficient if boat wakes are not frequent (6). There were 9 projects located on minor rivers and major tributaries where the widest fetch is between 1-5 miles. Four projects were located on major tributaries with Bay influence in high-energy settings with a fetch greater than 5 miles.
All 36 structures were structurally sound with a few exceptions, even though most of them were sub-jected to a coastal storm in 2003 just after construction (Tropical Storm Isabel). In a few older cases, the stone had settled into a wider and flatter profile than designed. Small stone was also scattered over the marsh surface in a few cases. Property owners reported only minor work was performed after storm events, such as replacing the scattered stone and removing tidal debris from the marshes.
The marsh toe revetments and marsh sills effectively reduced both upland and marsh erosion, particu-larly for fringing and embayed marshes. Both upland bank and marsh edge erosion were visibly reduced because of the structures and the wide tidal marshes they support. The pre-existing erosion trend was reversed in 4 cases where there was evidence of channelward marsh expansion. There was no obvious evidence of sediment accretion or sand entrapment because of these structures.
Erosion of spit marsh features continued even though marsh toe revetments were installed, especially for narrow spit features. Isolated areas of continuing marsh erosion were also observed at 8 sites where marsh toe revetments were placed more than 10 feet channelward from the marsh edge. “End-effect” ero-sion was observed in two cases where erosion of the untreated marsh edge at the end of the revetments appeared to have accelerated. Upland bank erosion was still evident where the revetment height was less than 1 foot above the mean high water elevation at medium and high-energy settings and also where the marsh width was less than 15 feet.
While the marsh vegetation usually appeared healthy, there was evidence that some structures were adversely interfering with other habitat conditions and functions. This was particularly true where the revetment height was more than one foot above the mean high water elevation. One marsh was perched well above the mean high water elevation due to the height of the stone, isolating it from tidal exchange. Macroalgae growth and dieback of planted S. alterniflora was observed where tidal exchange was restricted by tightly packed stone inside a long continuous gabion sill. There was no apparent loss of sand fill.
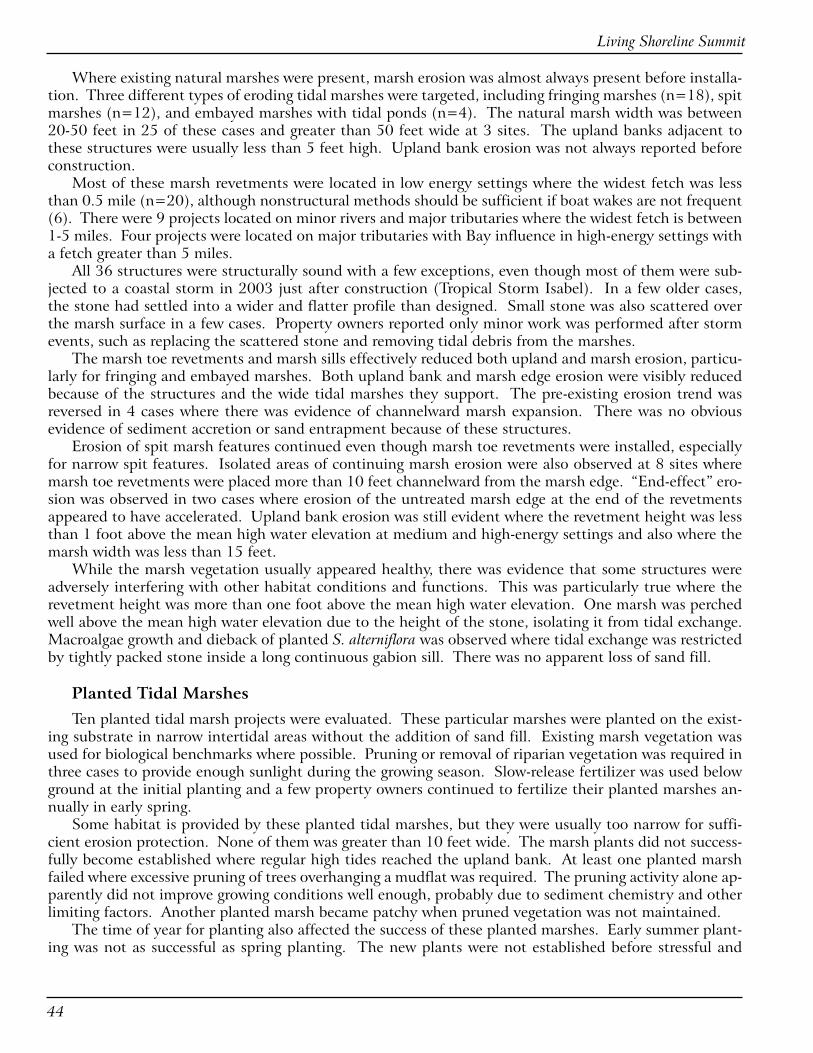
Planted Tidal Marshes Ten planted tidal marsh projects were evaluated. These particular marshes were planted on the exist-
ing substrate in narrow intertidal areas without the addition of sand fill. Existing marsh vegetation was used for biological benchmarks where possible. Pruning or removal of riparian vegetation was required in three cases to provide enough sunlight during the growing season. Slow-release fertilizer was used below ground at the initial planting and a few property owners continued to fertilize their planted marshes an-nually in early spring.
Some habitat is provided by these planted tidal marshes, but they were usually too narrow for suffi-cient erosion protection. None of them was greater than 10 feet wide. The marsh plants did not success-fully become established where regular high tides reached the upland bank. At least one planted marsh failed where excessive pruning of trees overhanging a mudflat was required. The pruning activity alone ap-parently did not improve growing conditions well enough, probably due to sediment chemistry and other limiting factors. Another planted marsh became patchy when pruned vegetation was not maintained.
The time of year for planting also affected the success of these planted marshes. Early summer plant-ing was not as successful as spring planting. The new plants were not established before stressful and

Conference Proceedings
�5
prolonged heat spells in June and July. There is also an increasing need for grazing exclusion devices in Virginia: resident Canadian geese and an expanding population of mute swans were attracted to the newly planted marsh vegetation.
Bank GradingThe most common bank grading plan extended landward from the bank toe without cut and fill chan-
nelward from the bank. Bulkheads and revetments were installed at the toe of some of these graded banks. Boat wake influence and continued erosion at the toe were cited as reasons for adding these structures.
Landscape restoration on graded banks typically does not include the recommended dense cover of deeply rooted vegetation that is not mowed frequently. In one case where a marsh flat was included with a graded bank, substantial erosion occurred above the marsh vegetation during a storm. This particular slope was routinely mowed and maintained as a lawn down to the planted marsh vegetation. The property owner decided to stop mowing so close to the water in order to extend the stabilizing vegetation buffer further up the graded bank instead of installing a rock revetment between the bank toe and the planted marsh. Other graded banks with a wide dense buffer of naturalized riparian vegetation experienced only minor storm damage.
DISCUSSIONMarsh toe revetments placed along the eroding edge of natural marshes were more common than
marsh sills with backfill and planted marshes. Most of the marsh structures were located where the widest fetch was less than 0.5 mile. The presence and effect of boat wakes was not included with this study, yet only one of these projects was determined to be excessive and unnecessary for erosion control purposes. Continued erosion and loss of valuable tidal marshes was expected if a structural, “hybrid” approach was not used. Sand fill was also not expected to remain on site without containment structures.
The wave breaking function of the structures depends on the crest height above the mean high water elevation, yet excessive height also restricts tidal exchange. The target height should be the mean high water elevation and up to 1 foot above mean high water where the fetch distance or boat wakes indicate that additional height is necessary. If additional height is needed, then tidal openings or a variable height should be provided without creating erosion hot spots or shoaling problems. Additional research on the effects of restricted tidal exchange should include temperature regulation and sediment transport.
Formerly vegetated marsh spits continued to disappear after marsh revetments were installed. Planted vegetation on marsh spits also failed, consistent with a previous conclusion that points of land reaching into a body of water are not suitable planting sites (10). It is not clear why these structures failed to pro-tect spits from continued erosion. Sand fill may be a necessary component for marsh spit restoration with strategically placed containment structures that enhance rather than restrict sand entrapment.
Marsh revetment projects that were determined to be effective for both reduced erosion and for sup-porting living resources had several characteristics in common, including:
• The marsh structure was necessary, i.e., a nonstructural approach would likely not be effective.
• A tidal marsh greater than 15 feet wide was the primary erosion buffer.
• No or only minor erosion of the upland bank and marsh edge was evident after the structure was installed.
• The structure was appropriately designed, with a revetment base width generally less than 8 feet at low energy settings, less than 14 feet at medium energy settings.
• Tidal exchange was provided either with a height <1 foot above the mean high water elevation and/or strategically placed tidal connections.
• Tidal wetland and riparian habitats were connected with a vegetation cover in a natural condition.
• There was evidence of habitat use by typical salt marsh species.
Living Shoreline Summit
��
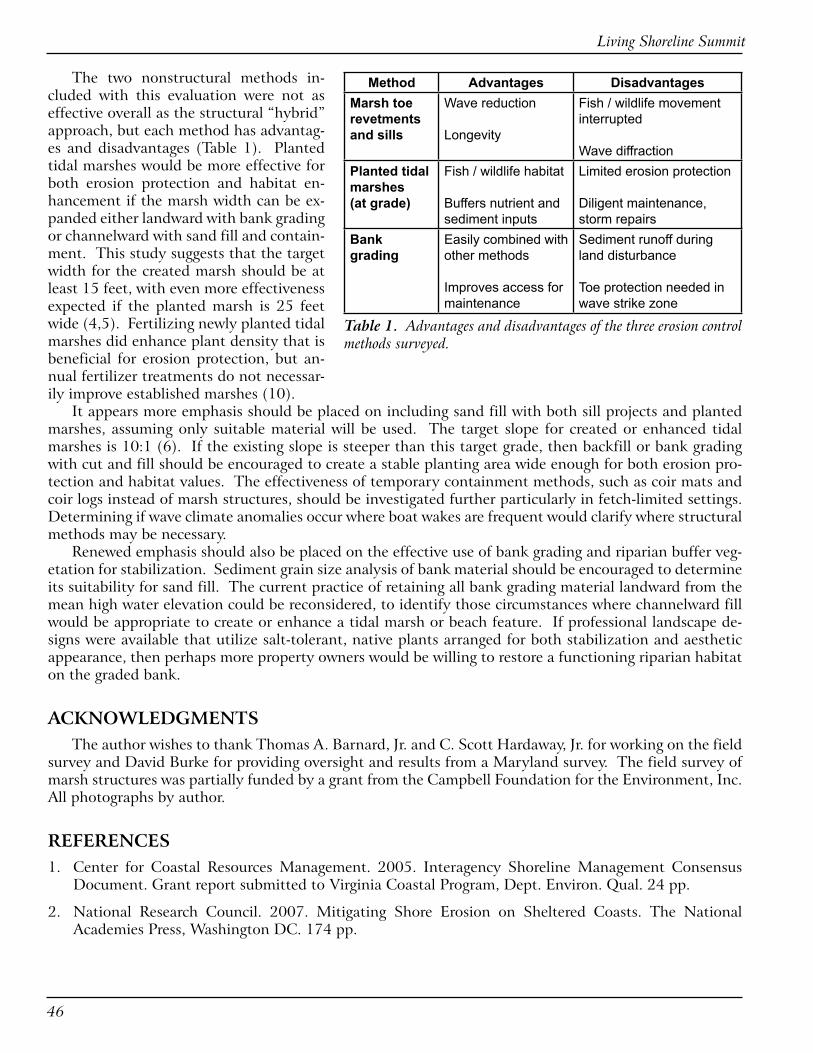
The two nonstructural methods in-cluded with this evaluation were not as effective overall as the structural “hybrid” approach, but each method has advantag-es and disadvantages (Table 1). Planted tidal marshes would be more effective for both erosion protection and habitat en-hancement if the marsh width can be ex-panded either landward with bank grading or channelward with sand fill and contain-ment. This study suggests that the target width for the created marsh should be at least 15 feet, with even more effectiveness expected if the planted marsh is 25 feet wide (4,5). Fertilizing newly planted tidal marshes did enhance plant density that is beneficial for erosion protection, but an-nual fertilizer treatments do not necessar-ily improve established marshes (10).
It appears more emphasis should be placed on including sand fill with both sill projects and planted marshes, assuming only suitable material will be used. The target slope for created or enhanced tidal marshes is 10:1 (6). If the existing slope is steeper than this target grade, then backfill or bank grading with cut and fill should be encouraged to create a stable planting area wide enough for both erosion pro-tection and habitat values. The effectiveness of temporary containment methods, such as coir mats and coir logs instead of marsh structures, should be investigated further particularly in fetch-limited settings. Determining if wave climate anomalies occur where boat wakes are frequent would clarify where structural methods may be necessary.
Renewed emphasis should also be placed on the effective use of bank grading and riparian buffer veg-etation for stabilization. Sediment grain size analysis of bank material should be encouraged to determine its suitability for sand fill. The current practice of retaining all bank grading material landward from the mean high water elevation could be reconsidered, to identify those circumstances where channelward fill would be appropriate to create or enhance a tidal marsh or beach feature. If professional landscape de-signs were available that utilize salt-tolerant, native plants arranged for both stabilization and aesthetic appearance, then perhaps more property owners would be willing to restore a functioning riparian habitat on the graded bank.
ACKNOWLEDGMENTSThe author wishes to thank Thomas A. Barnard, Jr. and C. Scott Hardaway, Jr. for working on the field
survey and David Burke for providing oversight and results from a Maryland survey. The field survey of marsh structures was partially funded by a grant from the Campbell Foundation for the Environment, Inc. All photographs by author.
REFERENCES1. Center for Coastal Resources Management. 2005. Interagency Shoreline Management Consensus
Document. Grant report submitted to Virginia Coastal Program, Dept. Environ. Qual. 24 pp.
2. National Research Council. 2007. Mitigating Shore Erosion on Sheltered Coasts. The National Academies Press, Washington DC. 174 pp.
Method Advantages DisadvantagesMarsh toe revetments and sills
Wave reduction
Longevity
Fish / wildlife movement interrupted
Wave diffractionPlanted tidal marshes (at grade)
Fish / wildlife habitat
Buffers nutrient and sediment inputs
Limited erosion protection
Diligent maintenance, storm repairs
Bank grading
Easily combined with other methods
Improves access for maintenance
Sediment runoff during land disturbance
Toe protection needed in wave strike zone
Table 1. Advantages and disadvantages of the three erosion control methods surveyed.
Conference Proceedings
��
3. North Carolina Division of Coastal Management. 2006. Recommendations for Appropriate Shoreline Stabilization Methods for the Different North Carolina Estuarine Shoreline Types. Report prepared for NC Coastal Resources Commission, Estuarine Shoreline Stabilization Committee. 55 pp.
4. Broome, S.W., S.M. Rogers, and E.D. Seneca. 1992. Shoreline Erosion Control Using Marsh Vegetation and Low-cost Structures. University of North Carolina Sea Grant College, UNC-SG-92-12. 20 pp.
5. Luscher, A. and C. Hollingsworth. 2005. Shore Erosion Control: The Natural Approach. Publication of the Maryland Coastal Zone Management Program, Dept. Natl. Res. 12 pp.
6. Garbisch, E.W. and J.L. Garbisch. 1994. Control of Upland Bank Erosion Through Tidal Marsh Construction on Restored Shores: Application in the Maryland Portion of Chesapeake Bay. Environ. Managemt. 18(5):677-691.
7. Hardaway, C.S. Jr. and R.J. Byrne. 1999. Shoreline Management in Chesapeake Bay. Special Report in Applied Marine Science and Ocean Engineering No. 356, Virginia Sea Grant Publication VSG-99-11. October 1999. 54 pp.
8. Burke, D.G., E.W. Koch, and J.C. Stevenson. 2005. Assessment of Hybrid Type Shore Erosion Control Projects in Maryland’s Chesapeake Bay – Phases I & II. Final report for Chesapeake Bay Trust, Annapolis, MD. March 2005. 69 pp.
9. Carroll, R.A. 2002. Nekton Utilization of Intertidal Fringing Salt Marsh and Revetment Hardened Shorelines. Master of Science thesis, Virginia Institute of Marine Science. 109 pp.
10. Perry, J.E., T.A. Barnard, Jr., J.G. Bradshaw, C.T. Friedrichs, K.J. Havens, P.A. Mason, W.I. Priest, III, and G.M. Silberhorn. 2001. Creating Tidal Salt Marshes in the Chesapeake Bay. J. Coastal Res. SI27:170-191.

Living Shoreline Summit
��

Conference Proceedings
��
Living Shorelines Projects in Maryland in the Past 20 Years
Bhaskaran Subramanian1, Johann Martinez2, Audra E. Luscher3, and David Wilson4
�Riparian and Wetland Restoration, Maryland Department of Natural Resources, Annapolis, MD ���0�, [email protected], �Maryland Eastern Shore RC&D Council, Inc., Easton, MD ���0�, [email protected], �NOAA Coastal Services Center, [email protected], �Maryland Eastern Shore RC&D Council, Inc., Easton, MD ���0�, [email protected]
ABSTRACTMaryland Eastern Shore RC&D Council, Inc. has been involved in living shorelines projects in the
coastal counties of Maryland for the past 20 years. Many of the projects are on private properties, while some projects have been completed on public lands including boat ramps, marina, and parks. This paper focuses on compiling information from these projects and creating baseline information of the benefits in these counties of Maryland. Nearly 258 projects at a total cost of $8.9 million were completed from 1987 to 2006. All the nonstructural projects have exhibited many benefits, such as reducing nitrogen and phosphorus inputs to the Bay, creating/preserving wetlands, and shoreline erosion control.
INTRODUCTIONAccording to the Maryland Geological Survey (2007), Maryland has a shoreline of approximately
7,532 miles (1). One of the most significant problems facing landowners along Maryland’s long coastal environment is shoreline erosion, a natural process (2), but also affected by human activities. With the current focus on hurricanes, floods, and other natural disasters, the need to protect people, land, and natural resources is of great importance. This paper deals with the use of “living shorelines” as a method of shoreline erosion control. The primary goal of this paper is to compile information from projects com-pleted on eroding shorelines, while creating baseline information of the benefits of these living shoreline projects in the coastal counties of Maryland, in comparison with other conventional practices.
There are many different types of waterfront property, some on small creeks, while others face open water. Some of these properties (public and private) are suffering the effects of steady erosion. Through the years, landowners and mangers have tried many different techniques to protect their properties. Some less than traditional techniques commonly used have been recycled concrete materials and old tires (2). Traditional erosion control techniques include groins, bulkheads, and riprap (2). For many years, in spite of the differences in shoreline types, there has mostly been a “one-size-fits-all” approach to shoreline protection (2). Bulkheads and riprap are called “structural methods” of shoreline erosion control tech-niques, good solutions in certain situations. However, even when carefully designed, these methods cause unintended consequences for people and wildlife and a number of problems such as aesthetic issues and elimination of valuable fringing wetlands and sand beaches that help improve water quality and support wildlife (2).
Nonstructural Approach In cases of creeks or coves that receive low energy waves, the shoreline can be protected by using
methods other than structural techniques. Examples include (re)planting wetland vegetation and beach replenishment (3). These methods are appropriate if the property has had a vegetated wetland or beach, or if neighboring shorelines currently have vegetated wetland shorelines or beaches. For these marsh res-
Living Shoreline Summit
50
toration projects, where no sand or sediment is added or removed, no regulatory permit may be needed, reducing both cost and time (3).
Hybrid Approaches In locations with greater exposure to waves, it may still be possible to maintain a mostly natural
shoreline with structural additions like near and offshore breakwaters, sills, and low profile rock groins (3). While the purpose of bulkheads and revetments is to reflect or absorb wave energy, sills, breakwaters, and low rock groins are placed within the intertidal zone, or beyond the low tide mark, to enhance sand buildup along the shoreline.
Living Shorelines ApproachDuring the mid-1980s, “soft” shoreline stabilization alternatives were referred to as “nonstructural
shore erosion control” which incorporated many elements of today’s “living shoreline” techniques (2). Hence, living shoreline approaches could be any kind of shoreline erosion control technique (nonstruc-tural and hybrid) as long as there was a “biological” component to the erosion control methods.
“Living shorelines” are an increasingly popular approach to erosion control that uses strategically placed plants, stone, and sand to reduce wave action, conserve soil, and provide critical shoreline habitat. Living shorelines often stand up to wave energy better than solid bulkheads or revetments. Living shore-line treatments are designed with the intention of maintaining or minimally disrupting normal coastal processes, such as sediment movement along the shore and protection and restoration of wetlands (2).
The Jefferson Patterson Park Museum (2) summarizes many benefits of living shorelines. For example, a variety of living shoreline treatments is possible in different situations. In subtidal waters, researchers are experimenting with stone or oyster shell breakwaters which are installed and then seeded with oyster spat to create living oyster reefs. In another study, scientists are introducing submerged aquatic vegeta-tion (SAV) that can enhance water quality, further dampen wave energy, and provide food and cover for a variety of wildlife. Although a spectrum of living shoreline treatments is possible, the most inexpensive technique is to plant marsh grass on eroding shorelines. This can be done along unvegetated, but pro-tected shorelines with limited wave action or boating activity. The marsh vegetation reduces erosion in several ways. They form a dense, flexible mass of stems that help dissipate wave energy as water moves through the marsh. As the wave energy decreases, sediment transported from shallow waters is deposited in the marsh causing build-up or “accretion” of the shoreline. The root matter from the plants forms dense root-rhizome mats building marsh elevation. This is especially important during the winter when plant stems provide much less resistance to waves. While marsh grass alone can control erosion along very low wave energy shorelines, structural support is needed to maintain a marsh in areas where fetch exposure exceeds 0.5 mile.
Effects of Living Shoreline Approach - Benefits and DrawbacksEven though the primary aim of hardened shorelines is to provide protection from storms, the concern
of the authors is that more homeowners in coastal areas are choosing to harden their shorelines even when they are in medium or low-energy areas (fewer problems compared to homeowners in high-energy regions). It is imperative that these homeowners realize that there are many benefits in choosing living shoreline approaches in these areas rather than bulkheads or ripraps.
BenefitsRecent studies have shown that hardened shorelines (bulkheads, rock revetments) have a lower abun-
dance of bottom-dwelling organisms offshore and lower numbers of juvenile fish and crabs when com-pared to shorelines with vegetated marsh (3). Seitz et al. (4) concluded that benthic abundance and diversity were higher in habitats adjacent to natural marsh than those adjacent to bulkheaded shorelines, and abundance and diversity were intermediate in riprapped shorelines. Predator density and diversity tended to be highest adjacent to natural marsh shorelines, and density of crabs was significantly higher in
Conference Proceedings
5�
natural marshes than in bulkheaded habitats, suggesting a crucial link between marshes, infaunal prey in subtidal habitats, and predator abundance (4). This is of great importance as miles of Maryland and Vir-ginia shorelines are hardened each year, thereby increasing the vulnerability of shorelines to storm damage and loss of valuable habitat for fish, crabs, and waterfowl (5).
Other major benefits of living shorelines include lower construction costs, maintaining a link be-tween aquatic and upland habitats, restoring or maintaining critical spawning and nursery areas for fish and crabs, maintaining natural shoreline dynamics and sand movement, reducing wave energy, absorbing storm surge and flood waters, and filtering nutrients and other pollutants from the water (6).
DrawbacksWhile there are many benefits associated with living shorelines, they are not effective in all conditions,
especially in high energy environments (6). Other drawbacks include low numbers of knowledgeable ma-rine contractors and the lack of information on the science behind the effectiveness of living shorelines for different types of shores and under different energy regimes and storm conditions (6).
RESULTS AND DISCUSSIONOver the past 20 years, RC&D along with the Maryland De-
partment of Natural Resources (DNR) Office of Shoreline Erosion Control Program, were involved in 258 shoreline erosion control projects (Table 1), worth approximately $8.9 million, in 10 coun-ties of Maryland (Table 2). Projects were constructed on both public and private properties, implemented mostly in areas with limited fetch and low-to-medium exposure.
Research carried out by RC&D indicates that these shoreline protection control projects have benefited the waters of our rivers and streams, and have helped the coastal environments of Mary-land. These shoreline erosion control projects have helped protect 117,208 linear feet of shoreline, with the highest in Talbot County (Table 2). Using the linear footage of shorelines saved, we can determine the amount of sediment not eroded and lost (Table 2) using an estimate of the long-term rate of linear retreat of the
Type of Project Number of Projects
Breakwater 22Edging 21Groins 131Sills 55Combination Projects* 27Others (Planting and Stream bank restoration:
2
*Combination projects include the following: a) Groins + Sills b) Groins + Edging c) Sills + Breakwaters d) Sill + Edging
Table 1. Summary of living shoreline projects based on project type
Counties of Maryland
Number of Projects
Total Project Length (ft)
Sediment saved (tons y-1)
N Saved (lbs y-1)
P Saved (lbs y-1)
Calvert 22 8,694 5,826 4,634 3,047Caroline 14 7,005 2,645 1,983 1,304Cecil 5 1,369 421 307 202Charles 6 3,600 2,320 2,149 1,413Dorchester 28 10,581 2,737 2,124 1,396Kent 28 11,714 3,863 2,931 1,927Queen Anne’s 58 34,791 17,941 16,030 10,540Talbot 91 37,605 13,695 11,316 7,441Wicomico 4 1,514 267 233 153Worcester 2 335 162 129 85Total 258 117,208 49,877 41,836 27,508
Table 2. Merits of living shoreline projects in coastal counties of Maryland in the past �0 years
Living Shoreline Summit
5�
shoreline due to shore erosion and the present bank height. Multiplying these factors together yields an estimate of volumes of sediment that are prevented from entering a waterway due to the completion of the vegetative shoreline stabilization project at the property; the range is from 162 tons annually in Worcester County to >16 thousand tons y-1 in Queen Anne’s County. Previous studies of historic shore erosion rates on the Chesapeake Bay in Maryland (7,8) have shown that the shore is eroding at an average rate of 1-2 ft y-1.
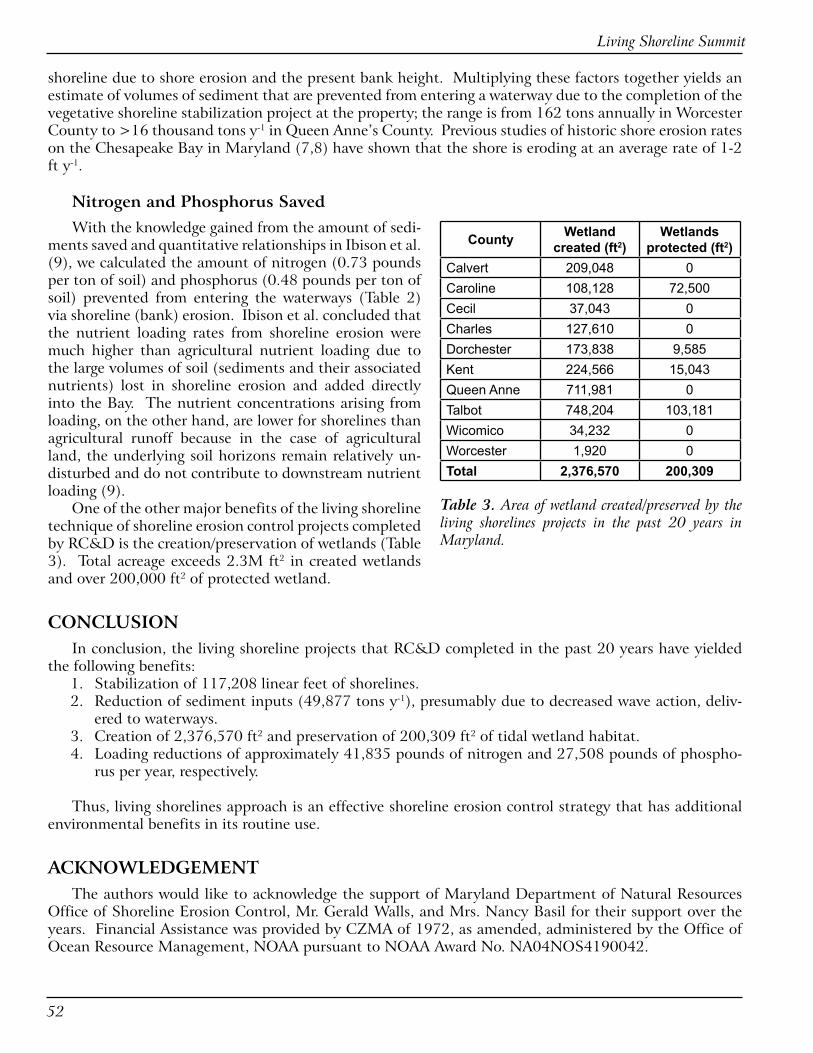
Nitrogen and Phosphorus SavedWith the knowledge gained from the amount of sedi-
ments saved and quantitative relationships in Ibison et al. (9), we calculated the amount of nitrogen (0.73 pounds per ton of soil) and phosphorus (0.48 pounds per ton of soil) prevented from entering the waterways (Table 2) via shoreline (bank) erosion. Ibison et al. concluded that the nutrient loading rates from shoreline erosion were much higher than agricultural nutrient loading due to the large volumes of soil (sediments and their associated nutrients) lost in shoreline erosion and added directly into the Bay. The nutrient concentrations arising from loading, on the other hand, are lower for shorelines than agricultural runoff because in the case of agricultural land, the underlying soil horizons remain relatively un-disturbed and do not contribute to downstream nutrient loading (9).
One of the other major benefits of the living shoreline technique of shoreline erosion control projects completed by RC&D is the creation/preservation of wetlands (Table 3). Total acreage exceeds 2.3M ft2 in created wetlands and over 200,000 ft2 of protected wetland.
CONCLUSIONIn conclusion, the living shoreline projects that RC&D completed in the past 20 years have yielded
the following benefits:1. Stabilization of 117,208 linear feet of shorelines.2. Reduction of sediment inputs (49,877 tons y-1), presumably due to decreased wave action, deliv-
ered to waterways.3. Creation of 2,376,570 ft2 and preservation of 200,309 ft2 of tidal wetland habitat. 4. Loading reductions of approximately 41,835 pounds of nitrogen and 27,508 pounds of phospho-
rus per year, respectively.
Thus, living shorelines approach is an effective shoreline erosion control strategy that has additional environmental benefits in its routine use.
ACKNOWLEDGEMENTThe authors would like to acknowledge the support of Maryland Department of Natural Resources
Office of Shoreline Erosion Control, Mr. Gerald Walls, and Mrs. Nancy Basil for their support over the years. Financial Assistance was provided by CZMA of 1972, as amended, administered by the Office of Ocean Resource Management, NOAA pursuant to NOAA Award No. NA04NOS4190042.
County Wetland created (ft2)
Wetlands protected (ft2)
Calvert 209,048 0Caroline 108,128 72,500Cecil 37,043 0Charles 127,610 0Dorchester 173,838 9,585Kent 224,566 15,043Queen Anne 711,981 0Talbot 748,204 103,181Wicomico 34,232 0Worcester 1,920 0Total 2,376,570 200,309
Table 3. Area of wetland created/preserved by the living shorelines projects in the past �0 years in Maryland.

Conference Proceedings
5�
REFERENCES1. Maryland Geological Survey. 2007. http://www.mgs.md.gov/esic/fs/fs2.html.
2. Jefferson Patterson Park and Museum. 2007. http://www.jefpat.org/Living%20Shorelines/lsmainpage.htm.
3. Wetlands Watch. 2007. http://www.wetlandswatch.org/mc_shore_alternatives.asp.
4. Seitz, R.D., R.N. Lipcius, N.H. Olmstead, M.S. Seebo, and D.M. Lambert. 2006. Influence of Shallow-water Habitats and Shoreline Development on Abundance, Biomass, and Diversity of Benthic Prey and Predators in Chesapeake Bay. Mar. Ecol. Prog. Ser. 326:11-27.
5. Lutz, L. 2007. http://www.bayjournal.com/article.cfm?article=2651&print=yes
6. National Oceanic and Atmospheric Administration. 2006. http://coastalmanagement.noaa.gov/initiatives/shoreline_stabilization.html (Accessed on February 14, 2007).
7. Singewald, J.T. and T.H. Slaughter. 1949. Shore Erosion in Tidewater Maryland. Maryland Geological Survey, Baltimore, MD. Bulletin No. 6, 141 pp.
8. Spoeri, R.K., C.F. Zabawa, and B. Coulombe. 1985. Statistical Modeling of Historic Shore Erosion Rates on the Chesapeake Bay in Maryland. Environ. Geol. Water Sci. 7(3):171-187.
9. Ibison, N.A., C.W. Frye, J.E. Frye, C.L. Hill, and N.H. Burger. 1990. Sediment and Nutrient Contributions of Selected Eroding Banks of the Chesapeake Bay Estuarine System (Technical Report to Council on the Environment for Coastal Zone Management Grant #NA88AA-DCZ092): Department of Conservation and Recreation, Division of Soil and Water Conservation, Shoreline Programs Bureau, Gloucester Point, Va., 71 pp. http://www.csc.noaa.gov/CZIC/document_Listing.html.

Living Shoreline Summit
5�
Conference Proceedings
55
Evaluating Ecological Impacts of Living Shorelines and Shoreline Habitat Elements:
An Example From the Upper Western Chesapeake Bay
Jana L. D. Davis1, Richard L.Takacs2, and Robert Schnabel3
�Chesapeake Bay Trust, �0 West St. Suite �05, Annapolis, MD ���0�, [email protected], �NOAA Res-toration Center, Annapolis, MD ���0�, [email protected], �Chesapeake Bay Foundation, Annapolis, MD ���0�, [email protected]
ABSTRACTLiving shorelines, or use of natural habitat elements in shoreline protection rather than hard shoreline
armor, have been used in the Chesapeake Bay for decades due to anticipated habitat and water quality benefits. The goal of this work is to begin to quantify how quickly living shorelines assume “natural” ecological function. On the upper Western Shore of the Chesapeake Bay, macrofauna at control marsh sites and bulkhead sites slated for living shoreline installation were sampled before and after construction (before-after control-impact design). Species with higher densities at marsh than bulkhead sites prior to bulkhead removal (e.g., mummichog (Fundulus heteroclitus), grass shrimp (Palaemonetes pugio), and spot (Leiostomus xanthurus)) were expected to increase after living shoreline installation, and those with higher densities at bulkheads (e.g., white perch (Morone americana)) were expected to decrease. Two months after restoration, densities of mummichog, grass shrimp, and pumpkinseed (Lepomis gibbosus) had increased at the experimental site relative to the control marsh, though densities of some marsh species had not. Results suggest that certain species can respond almost immediately to installation of living shorelines. Results also suggest that incorporation of multiple structural habitat elements may expand the functional value of living shorelines. In a second study element comparing assemblage structure in several struc-tural habitat types (riprap, oyster shell, vegetation, woody debris), vegetation served the greatest nursery function, oyster reef provided the greatest refuge for species like blue crabs, riprap hosted the greatest proportion of older life-history stages, and all four hosted different suites of species. Work to optimize living shoreline design relative to erosion control function is on-going in the management and engineering arenas. Similar efforts to correlate design elements to ecological function by the scientific and restoration communities will serve to maximize the benefits of living shorelines to estuarine biota.
INTRODUCTIONHard shoreline armor, such as riprap revetments, bulkheads, and seawalls, has been used to protect
soft estuarine shorelines for centuries. In some areas, more than half of the shoreline has been armored. For example, in San Diego Bay, armor makes up almost three-quarters of the shoreline, providing habitat for open-coast rocky intertidal species in the bay (1). Some of the sub-watersheds of the Chesapeake Bay are similarly armored (2).
Despite the widespread use of hard shoreline armor, only recently have questions begun to be ad-dressed about its ecological impacts and roles (e.g., 1,3). As a result of this concern, the technique of “living shorelines,” or the incorporation of natural habitat elements such as fringe marshes into shoreline stabilization, has been developed. This new technique is based on growing understanding of the value of marsh habitats (e.g., 4) and advances in the wetland restoration field that have refined restoration prac-tices (e.g., 5, 6).
Though the benefits of natural and created marsh habitats have been quantified, and therefore the benefits of living shorelines relative to artificial armor expected, ecological impacts of installing living
Living Shoreline Summit
5�
shorelines have not yet been quantified. Such quantification will help to justify use of living shorelines in place of armor, both in new shoreline protection and in replacement of existing armor with greener techniques. In addition, more information about ecological impacts will aid in the refinement of living shoreline techniques and designs, a field that is currently rapidly advancing.
The objectives of this study were threefold. First, we add to the discussion about ecological impacts of armor by comparing macrofaunal assemblages and habitat characteristics at armored sites relative to natural marsh sites. Second, we begin to quantify impacts of living shoreline techniques by conducting a before-after control-impact assessment of a living shoreline installation on a macrofaunal assemblage. In this case, a natural fringe marsh that remained unchanged over the course of the study served as the con-trol, and a bulkhead transformed into a living shoreline served as the impacted experimental site. Third, we provide information useful to living shoreline design by comparing macrofaunal assemblage charac-teristics (species densities, species diversity, and organism size) of four types of structural habitat (riprap, oyster shell, woody debris, and vegetation) that are often incorporated in the lower intertidal and subtidal elements of living shoreline restoration projects. We test the hypothesis that certain structural habitat types provide refuge, nursery, and other habitat for different types of species during different life-history stages. This information will help designers determine what types of structural habitat to include in living shoreline projects.
METHODSBulkhead Versus Natural Marsh Macrofaunal assemblages, sediment grain size, and bottom slope were quantified at two Maryland
sites slated for bulkhead removal and installation of living shoreline. The first, a 250-m section of bulk-head on College Creek, a tributary of the Severn River, was sampled in June 2006. The second, consisting of two 40-m sections of bulkhead on Norman’s Creek, a tributary of the West River, was sampled in May 2006. At each site, a natural fringe marsh within 500 m was sampled as well. We acknowledge that the fringe marshes used for comparison were in highly fragmented systems, and therefore likely have different characteristics than marshes in pristine areas. However, these fragmented marshes are similar in scale to living shorelines, and were the closest marsh habitat to use for comparison.
At College Creek, three 20-m sections along the bulkhead and along a natural fringe marsh on the opposite side of the creek were sampled for a total of six collections. Beach seines (10 m long, 2 m high, 0.6-cm mesh) were used to collect fishes, crabs, and shrimp, which were identified to species, counted, and measured. Sediment cores (30 cm high, 3.8 cm2 diameter) were collected at distances of 0, 4, and 8 m from shore along two cross-shore transects in each habitat type. Sediments were sieved into six size classes: gravel (#18 sieve), sands (#35, #60, #120, and #230 sieves), and silt/clay <63 µm. Water depths were measured every 2 m along six cross-shore transects per habitat type from 0-24 m from shore or until water depth exceeded 120 cm. At Norman’s Creek, sampling was the same except that two seine replicates were taken in each of two bulkhead sections and one marsh section for a total of six seines.
Densities of macrofaunal species were log-transformed to achieve normality and compared between bulkhead and fringe marsh using a two-way fixed effects ANOVA with habitat type and site as factors. Percent of sediment in three grain size categories (>500 µm, sand (63-500 µm), and silt/clay (<63 µm)) were arc-sin square root transformed and compared between marsh and bulkhead sites with two-way AN-COVAs (habitat type and site as factors) with depth as a covariate. Bottom slopes and intercepts at the shoreline were compared using t-tests following Zar (7).
Before-After ComparisonRemoval of bulkhead and installation of the living shoreline at College Creek took place in June-July
2006. Unfortunately, construction at the Norman’s Creek site was delayed until spring 2007, after sub-mission of this work. Post-construction macrofauna were sampled at College Creek in September 2006, two months after installation following the same procedures as above. The same sections used in June at the natural marsh were sampled again and serve as the controls in the before-after-control-impact study
Conference Proceedings
5�
design. Sections of the living shoreline as close to the original bulkhead sites as possible were sampled. Before-after changes in species densities were compared for the two habitat types (control marsh vs. bulk-head/living shoreline) with t-tests (8).
Structural Habitat Element ComparisonsMacrofauna were compared in blocks of habitat of five types: riprap, oyster shell, woody debris, veg-
etation, and bare sediment deployed at two locations in the Rhode River, located between the Severn and West Rivers on the Western Shore of the Bay. Eight blocks of each habitat type, 4 small (0.25 m2) and 4 large (0.75 m2), were placed at a mean 30 cm depth with tops exposed at mean low water. Riprap blocks of the small size category were created by stacking 10 granite rocks to mimic a low-intertidal sill. Small oyster shell blocks were created with about 200 shells. Small woody debris blocks consisted of three 50-cm long branches staked together. Vegetation blocks were artificial mimics of seagrass, created according to methods described elsewhere (9) with polypropylene ribbon (30 cm long, 5 cm wide) tied to mesh in a density of 2000 “shoots” per m2. Large blocks of each habitat type were created by placing three small blocks together.
Entire habitat blocks were sampled using 1.5 m x 0.5 m metal drop traps (with a metal dividing sheet inserted in the trap for small patches) deployed by two people, and all fishes, crabs, and shrimp present were collected by sweeping out the drop trap area, counted and measured. Molt stage of blue crabs was also identified. Blocks were deployed in March 2001 and sampled once per month from April to Septem-ber 2001. To test whether certain habitat types had species diversity (Simpson’s index) or higher densi-ties of each species than others, log-transformed densities in the different habitat types, block sizes, and months were compared using a three-factor (fixed effects) repeated measures ANOVA. For species with significant habitat type effect, Tukey post-hoc tests were used to test for differences among specific habitat types. To compare nursery function of each habitat type, organism size within species were also compared among habitat type. Organism size, because all species were not present during all months, could not be analyzed with repeated measures ANOVA which requires full replication. As a result, mean individuals sizes were compared, depending on occurrence of the species, with one-, two-, three-, or four-way ANOVAs with habitat type, size, month, and site as factors.
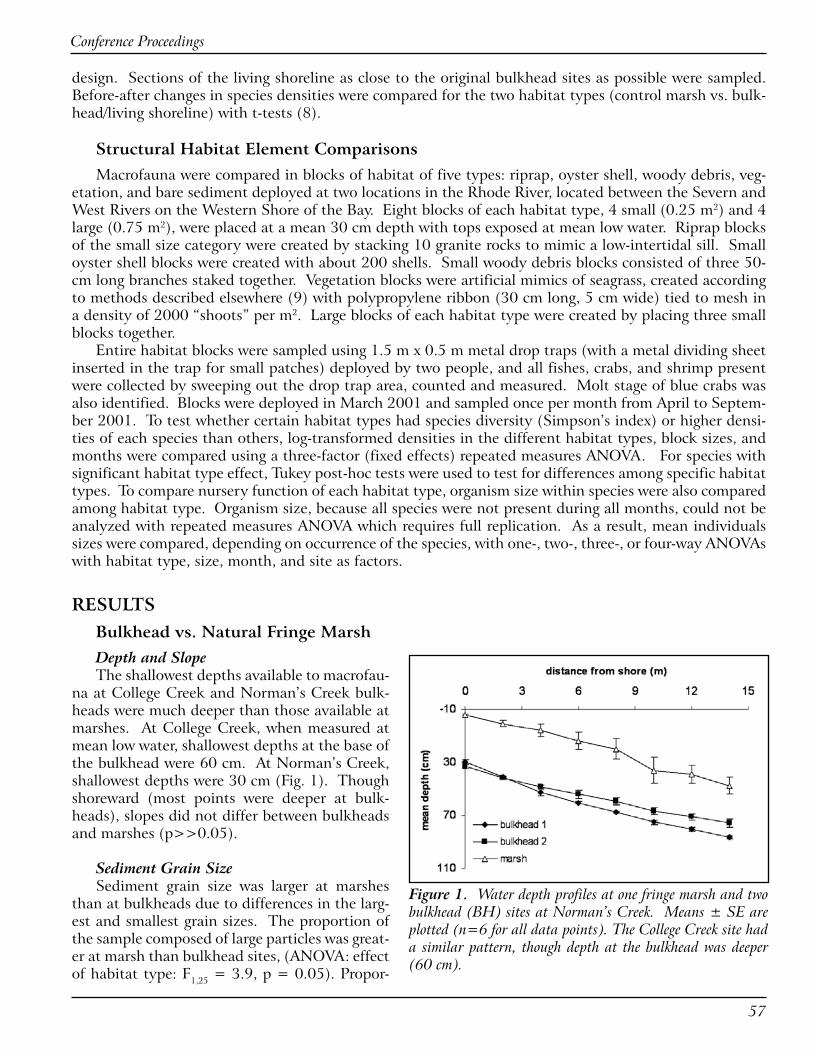
RESULTSBulkhead vs. Natural Fringe MarshDepth and SlopeThe shallowest depths available to macrofau-
na at College Creek and Norman’s Creek bulk-heads were much deeper than those available at marshes. At College Creek, when measured at mean low water, shallowest depths at the base of the bulkhead were 60 cm. At Norman’s Creek, shallowest depths were 30 cm (Fig. 1). Though shoreward (most points were deeper at bulk-heads), slopes did not differ between bulkheads and marshes (p>>0.05).
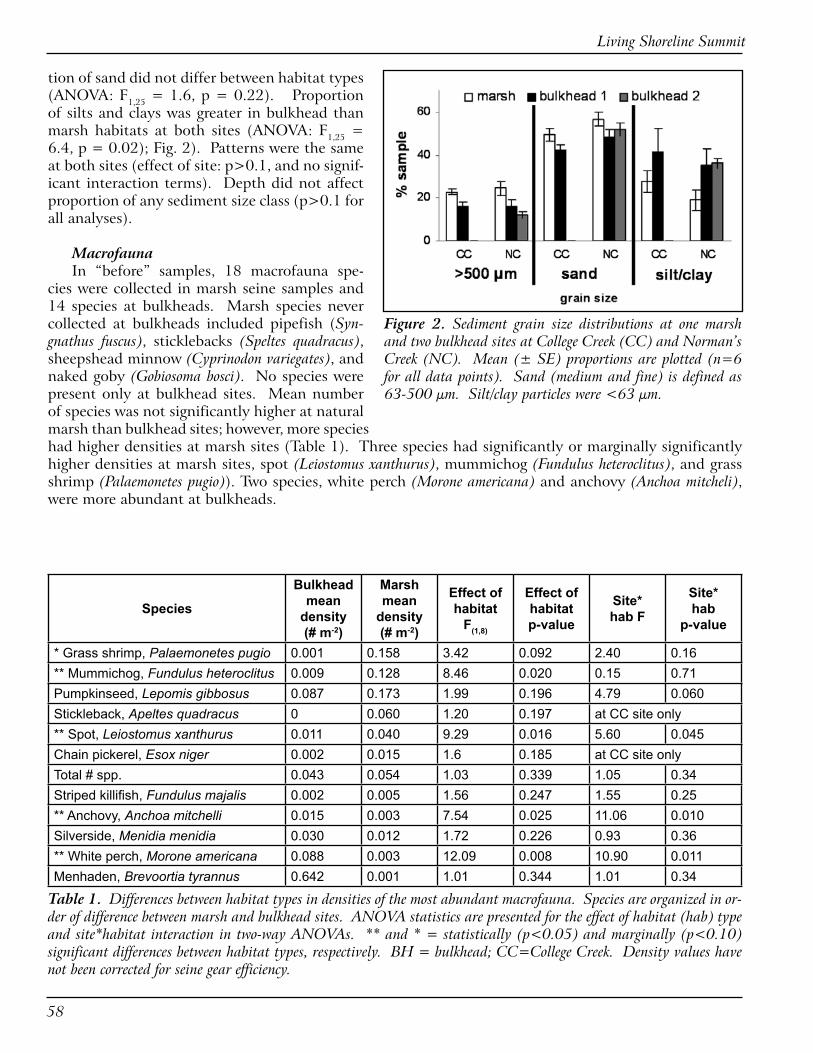
Sediment Grain SizeSediment grain size was larger at marshes
than at bulkheads due to differences in the larg-est and smallest grain sizes. The proportion of the sample composed of large particles was great-er at marsh than bulkhead sites, (ANOVA: effect of habitat type: F1,25 = 3.9, p = 0.05). Propor-
Figure 1. Water depth profiles at one fringe marsh and two bulkhead (BH) sites at Norman’s Creek. Means ± SE are plotted (n=� for all data points). The College Creek site had a similar pattern, though depth at the bulkhead was deeper (�0 cm).
Living Shoreline Summit
5�
Figure 2. Sediment grain size distributions at one marsh and two bulkhead sites at College Creek (CC) and Norman’s Creek (NC). Mean (± SE) proportions are plotted (n=� for all data points). Sand (medium and fine) is defined as ��-500 µm. Silt/clay particles were <�� µm.
tion of sand did not differ between habitat types (ANOVA: F1,25 = 1.6, p = 0.22). Proportion of silts and clays was greater in bulkhead than marsh habitats at both sites (ANOVA: F1,25 = 6.4, p = 0.02); Fig. 2). Patterns were the same at both sites (effect of site: p>0.1, and no signif-icant interaction terms). Depth did not affect proportion of any sediment size class (p>0.1 for all analyses).
MacrofaunaIn “before” samples, 18 macrofauna spe-
cies were collected in marsh seine samples and 14 species at bulkheads. Marsh species never collected at bulkheads included pipefish (Syn-gnathus fuscus), sticklebacks (Speltes quadracus), sheepshead minnow (Cyprinodon variegates), and naked goby (Gobiosoma bosci). No species were present only at bulkhead sites. Mean number of species was not significantly higher at natural marsh than bulkhead sites; however, more species had higher densities at marsh sites (Table 1). Three species had significantly or marginally significantly higher densities at marsh sites, spot (Leiostomus xanthurus), mummichog (Fundulus heteroclitus), and grass shrimp (Palaemonetes pugio)). Two species, white perch (Morone americana) and anchovy (Anchoa mitcheli), were more abundant at bulkheads.
Species
Bulkhead mean
density (# m-2)
Marsh mean
density (# m-2)
Effect of habitat
F(1,8)
Effect of habitat p-value
Site* hab F
Site* hab
p-value
* Grass shrimp, Palaemonetes pugio 0.001 0.158 3.42 0.092 2.40 0.16** Mummichog, Fundulus heteroclitus 0.009 0.128 8.46 0.020 0.15 0.71Pumpkinseed, Lepomis gibbosus 0.087 0.173 1.99 0.196 4.79 0.060Stickleback, Apeltes quadracus 0 0.060 1.20 0.197 at CC site only ** Spot, Leiostomus xanthurus 0.011 0.040 9.29 0.016 5.60 0.045Chain pickerel, Esox niger 0.002 0.015 1.6 0.185 at CC site only Total # spp. 0.043 0.054 1.03 0.339 1.05 0.34Striped killifish, Fundulus majalis 0.002 0.005 1.56 0.247 1.55 0.25** Anchovy, Anchoa mitchelli 0.015 0.003 7.54 0.025 11.06 0.010Silverside, Menidia menidia 0.030 0.012 1.72 0.226 0.93 0.36** White perch, Morone americana 0.088 0.003 12.09 0.008 10.90 0.011Menhaden, Brevoortia tyrannus 0.642 0.001 1.01 0.344 1.01 0.34
Table 1. Differences between habitat types in densities of the most abundant macrofauna. Species are organized in or-der of difference between marsh and bulkhead sites. ANOVA statistics are presented for the effect of habitat (hab) type and site*habitat interaction in two-way ANOVAs. ** and * = statistically (p<0.05) and marginally (p<0.�0) significant differences between habitat types, respectively. BH = bulkhead; CC=College Creek. Density values have not been corrected for seine gear efficiency.
Conference Proceedings
5�
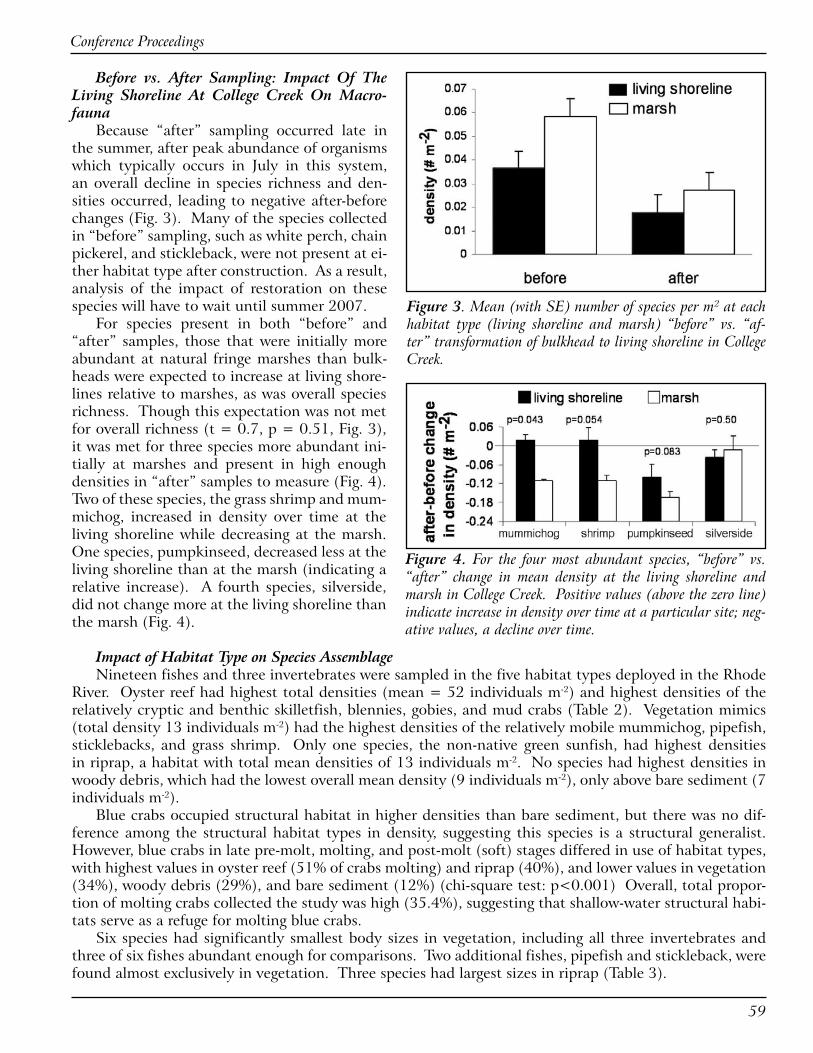
Figure 3. Mean (with SE) number of species per m� at each habitat type (living shoreline and marsh) “before” vs. “af-ter” transformation of bulkhead to living shoreline in College Creek.
Figure 4. For the four most abundant species, “before” vs. “after” change in mean density at the living shoreline and marsh in College Creek. Positive values (above the zero line) indicate increase in density over time at a particular site; neg-ative values, a decline over time.
Before vs. After Sampling: Impact Of The Living Shoreline At College Creek On Macro-fauna
Because “after” sampling occurred late in the summer, after peak abundance of organisms which typically occurs in July in this system, an overall decline in species richness and den-sities occurred, leading to negative after-before changes (Fig. 3). Many of the species collected in “before” sampling, such as white perch, chain pickerel, and stickleback, were not present at ei-ther habitat type after construction. As a result, analysis of the impact of restoration on these species will have to wait until summer 2007.
For species present in both “before” and “after” samples, those that were initially more abundant at natural fringe marshes than bulk-heads were expected to increase at living shore-lines relative to marshes, as was overall species richness. Though this expectation was not met for overall richness (t = 0.7, p = 0.51, Fig. 3), it was met for three species more abundant ini-tially at marshes and present in high enough densities in “after” samples to measure (Fig. 4). Two of these species, the grass shrimp and mum-michog, increased in density over time at the living shoreline while decreasing at the marsh. One species, pumpkinseed, decreased less at the living shoreline than at the marsh (indicating a relative increase). A fourth species, silverside, did not change more at the living shoreline than the marsh (Fig. 4).
Impact of Habitat Type on Species AssemblageNineteen fishes and three invertebrates were sampled in the five habitat types deployed in the Rhode
River. Oyster reef had highest total densities (mean = 52 individuals m-2) and highest densities of the relatively cryptic and benthic skilletfish, blennies, gobies, and mud crabs (Table 2). Vegetation mimics (total density 13 individuals m-2) had the highest densities of the relatively mobile mummichog, pipefish, sticklebacks, and grass shrimp. Only one species, the non-native green sunfish, had highest densities in riprap, a habitat with total mean densities of 13 individuals m-2. No species had highest densities in woody debris, which had the lowest overall mean density (9 individuals m-2), only above bare sediment (7 individuals m-2).
Blue crabs occupied structural habitat in higher densities than bare sediment, but there was no dif-ference among the structural habitat types in density, suggesting this species is a structural generalist. However, blue crabs in late pre-molt, molting, and post-molt (soft) stages differed in use of habitat types, with highest values in oyster reef (51% of crabs molting) and riprap (40%), and lower values in vegetation (34%), woody debris (29%), and bare sediment (12%) (chi-square test: p<0.001) Overall, total propor-tion of molting crabs collected the study was high (35.4%), suggesting that shallow-water structural habi-tats serve as a refuge for molting blue crabs.
Six species had significantly smallest body sizes in vegetation, including all three invertebrates and three of six fishes abundant enough for comparisons. Two additional fishes, pipefish and stickleback, were found almost exclusively in vegetation. Three species had largest sizes in riprap (Table 3).

Living Shoreline Summit
�0
DISCUSSIONWhile study of additional liv-
ing shoreline projects is needed to improve sample size, this ini-tial before-after control-impact (BACI) study suggests that some species’ responses to shoreline res-toration can be almost immediate. Some species responded within two months, increasing in abun-dance at the living shoreline site after installation relative to the marsh. The initial colonizing in-dividuals in this study were mostly adults due to timing of construc-tion, which was post-recruitment season for most species. Analysis of use of the living shoreline by juveniles during the next recruit-ment season will provide addition-al information about the role of this habitat for the assemblage.
The reasons for the relative in-crease in certain species’ densities at the transformed site (bulkhead to living shoreline) can be linked to aspects of the bulkhead habitat. In this study, bulkhead offered different habitat characteristics than fringe marshes and were used by different species. The amount of shallow area available to fauna was re-duced at bulkhead sites. At one site, College Creek, the shallowest areas available were 60 cm deep before the restoration, which is deeper than what is considered a refuge from subtidal predators (10). Bulkheads also unexpectedly had more small sediments. Because bulkheads reflect energy, they were hypothesized to lose more fine sediments than marshes, which slow wave energy and result in deposition. At both sites in this study, however, bulk-head sites were characterized by a hard-packed clay layer only a few cm below the sediment-water in-terface. Though infauna were not measured in this study, hard clay layers are generally impenetrable by infauna (e.g., 11).
Results from this study also suggest that living shoreline de-signs should include multiple habi-tat elements to maximize diversity and expand their functional value. In this study, oyster reef served as the greatest refuge for molting blue crabs. Vegetation served more of a nursery function than the other
Species Veg Rip-rap Oyster Wood Bare
sed. F4,30
Sp diversity 1.1a 1.1 a 0.4 b 0.8 c 0.1 c 6.6Goby 3.4 a 4.1 a 41.0 b 2.2 a 0.1 c 187Mud crab 387 a 121 b 599 c 110 b 11 d 60Blenny 0.2 a 0.6 a 2.6 b 0.1 a 0 c 63Skilletfish 0.4 a 1.1 b 3.9 c 1.7 b 0.1 a 8.7Mummichog 2.5 a 0.9 b 1.3 b 1.4 b 0.2 c 8.6Stickleback 1.6 a 0.01 b 0 c 0.3 d 0 c 16Gr. shrimp 247 a 87ba 98 b 98 b 4 c 31Pipefish 1.9 a 0.05 b 0.9 c 0.1 b 0.1 b 12Gr. sunfish 1.0 a 3.0 b 2.3 c 0.4 d 0 e 21Blue crab 0.8 a 0.5 a 0.4 a 0.7 a 0.1 b 4.8Silverside 2.1 3.5 1.6 3.1 5.0 1.2
Table 2. Densities (# m-�) of major assemblage members in the five habitat types, and effect of habitat type (riprap, vegetation, oyster, woody debris), a between-subjects fixed effect factor, in three-factor repeated measures ANO-VAs run for each species. F-statistics and degrees of freedom are presented. All p-values were <0.00� except silverside, for which p=0.���. Species diversity = Simpson’s species diversity index. Superscripted letters indicate statistically similar values determined by Tukey post-hoc tests. Habitats with highest densities are in bold.
Species Veg Rip-rap Oyster Wood F-statistic p-
valueMummich. 52 a 68 b 60 c 62 c F3,139 =3.4 0.03Mud crab 7.7 a 9.1 b 8.9 b 8.0 c F3,219 =6.5 0.001Gr. shrimp 29 a 35 b 30 c 31 c F3,239 =2.6 0.05Goby 33 a 37 b 42 c 36 b F3,136 =16 0.001Skilletfish 29 a 36 b 40 c 36 b F3,39 =4.8 0.01Blue crab 47 a 55 b 64 c 70 d F3,31 =3.4 0.03Blenny 51 a 50 a 50 a 51 a F3,46 =0.01 0.99Gr. sunfish 49 a 51 a 48 a 45 a F3,27 =2.0 0.13Silverside 50 a 46 a 42 a 47 a F3,44 =0.9 0.46
Table 3. Mean size (mm) of major assemblage members in the five habitat types, and effect of habitat type (riprap, vegetation, oyster, woody debris), a fixed effect factor in multi-way ANOVAs run for each species. F-statistics, degrees of freedom (df), and p-values are given. Error df differs among species due to presence in different numbers of habitat blocks. Superscripted letters indicate statistically similar values determined by Tukey post-hoc tests.

Conference Proceedings
��
habitat types, more often occupied by the smallest size classes, a result noted in other studies (12). Riprap had the largest individuals of several species, perhaps playing a refuge role for mating individuals. Future study to compare living shorelines with diverse habitat elements (such as the living shoreline at College Creek, which includes oyster shell, seagrass, emergent vegetation, and riprap) to those with just emergent vegetation will help to further address this question.
Many additional questions pertaining to impacts of living shoreline design on ecological function remain. For example, some designers advocate installing as many windows (also called tidal gates) as possible in sill living shoreline projects to allow maximum access to mobile fauna, without compromising erosion control function. Research is needed to identify how large and how numerous these windows should (from an ecological viewpoint) and can be (from an engineering and erosion control viewpoint). These improvements in design will benefit not just the Chesapeake Bay, but other estuaries to which living shoreline technology continues to expand.
ACKNOWLEDGEMENTSMany thanks to A. Thorton, R. Li, M. Jewell, A. Curtis, L. Tirpak, T. Pasco, K. Larson, and the Jef-
ferson United Methodist Youth Group for help in the field.
REFERENCES1. Davis, J.L.D., L.A. Levin, and S.M.Walther. 2002. Artificial Armored Shorelines: Sites for Open-coast
Species in a Southern California Bay. Mar. Biol. 140:1249-1262
2. Berman, M.R., H. Berquist, S. Dewing, J. Glover, C.H. Hershner, T. Rudnicky, D.E. Schatt, and K. Skunda. 2000. Mathews County Shoreline Situation Report, Special Report in Applied Marine Science and Ocean Engineering No. 364, Comprehensive Coastal Inventory Program, Virginia Institute of Marine Science, College of William and Mary, Virginia. 52 pp.
3. Seitz, R.D., R.N. Lipcius, N.H. Olmstead, M.S. Seebo, and D.M. Lambert. 2006. Influence of Shallow-water Habitats and Shoreline Development on Abundance, Biomass, and Diversity of Benthic Prey and Predators in Chesapeake Bay. Mar. Ecol. Prog. Ser. 326:11–27.
4. Boesch, D.F. and R.E. Turner. 1984. Dependence of Fishery Species on Salt Marshes: The Role of Food and Refuge. Estuaries 7:460-468.
5. Chamberlain, R.H. and R.A. Barnhart. 1993. Early Use by Fish of a Mitigation Salt Marsh, Humboldt Bay, California. Estuaries 16:769-783.
6. Jivoff, P.R. and K.A. Able. 2003. Evaluating Salt Marsh Restoration in Delaware Bay: The Response of Blue Crabs, Callinectes sapidus, at Former Salt Hay Farms. Estuaries 26:709–719.
7. Zar, J.H. 1998. Biostatical Analysis. Prentice Hall Inc., Upper Saddle River, NJ. 929 pp.
8. McDonald, T.L., W.P. Erickson, and L.L.McDonald. 2000. Analysis of Count Data from Before-after Control-impact Studies. J. Agr. Biol. Env. Stats. 5:262-279.
9. Bell, J.D., A.S. Steffe, and M. Wetoby. 1985. Artificial Seagrass: How Useful is it for Field Experiments on Fish and Macroinvertebrates? J. exp. mar. Biol. Ecol. 90:171-177.
10. Ruiz, G.M., A.H. Hines, and M.H. Posey. 1993. Shallow-water Refuge Habitat for Fish and Crustaceans in Non-vegetated Estuaries: An Example from Chesapeake Bay. Mar. Ecol. Prog. Ser. 99:1-16.
11. Skilleter, G.A. 1994. Refuges from Predation and the Persistence of Estuarine Clam Populations. Mar. Ecol. Prog. Ser. 109:29-42.
12. Heck, K.L. and T.A. Thoman. 1984. The Nursery Role of Seagrass Meadows in the Upper and Lower Reaches of the Chesapeake Bay. Estuaries 7:70-92.

Living Shoreline Summit
��

Conference Proceedings
��
Landscape-Level Impacts of Shoreline Development on Chesapeake Bay Benthos and Their Predators
Rochelle D. Seitz1 and Amanda S. Lawless2
�Virginia Institute of Marine Science, P.O. Box ����, Gloucester Point, VA ��0��, [email protected], �[email protected]
ABSTRACTWithin the coastal zone, waterfront development has caused severe loss of shallow-water habitats such
as salt marshes and seagrass beds. Little is known about the impact of habitat degradation and ecological value of subtidal shallow-water habitats, despite their prevalence. In coastal habitats, bivalves are domi-nant benthic organisms that can comprise over 50% of benthic prey biomass and are indicative of benthic production. We examined the effects of shoreline alteration in shallow habitats by contrasting the ben-thos of the subtidal areas adjacent to natural marsh, riprap, and bulkhead shorelines in three Chesapeake Bay subestuaries that differ in the level of shoreline development. In all cases, benthic abundance and di-versity were higher in subtidal habitats near natural marsh than those near bulkhead shorelines; however, abundance and diversity were intermediate near riprap shorelines, and appeared to depend on landscape features. In heavily impacted systems such as the Elizabeth-Lafayette system, benthos adjacent to riprap was depauperate, whereas in less-developed tributaries (York River and Broad Bay), benthos near riprap was abundant and was similar to that near natural marsh shorelines. Furthermore, predator density and diversity were highest adjacent to natural marsh, intermediate near riprap, and low near bulkhead shore-lines. There is thus a crucial link between natural marshes, benthic infaunal prey in subtidal habitats, and predator abundance. Restoration of living shoreline habitats is likely to have benefits for adjacent benthos and their predators. Protection and restoration of marsh habitats may be essential to the maintenance of high benthic production and consumer biomass in Chesapeake Bay. Moreover, the collective impacts of the system-wide, landscape-level features are felt from the benthos through higher trophic levels.
INTRODUCTIONMarine systems are suffering losses to biodiversity from overexploitation, introduction of invasive
species, global climate change, and most importantly habitat degradation and loss. Habitat degradation is the largest threat to biodiversity in terrestrial systems and one of the largest threats in marine systems (1). The disturbing effects of biodiversity loss on other ecosystem services have been noted: “…rates of resource collapse increased and recovery potential, stability, and water quality decreased with declining diversity” (2). Causes of marine habitat degradation are many, but here we focus on effects of shoreline development and the relationships with local landscape features. With increases in population abundance and the tendency for people to live near the water (approximately 60% of the U.S. population resides within 100 km of the coast; 1), shoreline development has been increasing at an alarming rate. For ex-ample, within the Chesapeake Bay region, the population within the watershed has tripled in the last century (3). Along with this elevation in population, the need for homeowners and businesses to protect against erosion has also increased, which comes at the detriment of marshes and other natural habitats. Estuaries are the most modified and threatened of aquatic environments (4), thus changes in associated marine systems due to habitat modifications can be great in estuaries.
Natural marshes serve important ecosystem functions including protecting uplands from wave action, filtering runoff, cycling nutrients, and housing multiple species of macrofauna. A diverse benthic com-munity resides within and adjacent to marshes, and these species provide essential habitat services (5).

Living Shoreline Summit
��
Nutrient cycling, filtering of water-column plankton, and serving as prey for predators are among the most important functions of benthic communities. Increased abundance within these communities may increase secondary and tertiary productivity of the system (6).
The Chesapeake Bay is a drowned river valley with 50% of the bay at <6.5 m in depth (7). Conse-quently, the shallow-water habitats, particularly the polyhaline regions, are prominent and important (8) and have been designated with better “benthic condition” than deeper areas that may go hypoxic (9). Moreover, the shallow (<1.5 m), subtidal habitats near natural marshes often support high biomass and diversity (8). Within the shallow-water zone, shoreline type further influences the abundance and diver-sity of organisms that reside in adjacent subtidal habitats.
Shoreline alteration and benthic community resources have been studied at large spatial scales to exam-ine regional patterns of land use and consequent impacts on benthos and predators. In a system with exten-sive bulkheading (Linkhorn Bay), there was low benthic diversity and abundance (10). At a regional scale, shoreline marshes were deemed important for bivalves (11). These benthic patterns likely translate to higher trophic levels, as predators of the benthos were negatively affected by altered shorelines (12, 13, 14).
We would expect higher-trophic-level predators (e.g., blue crabs) to be affected by benthos because their diet may include up to 50% bivalves (15). Moreover, crab densities are increased where prey densi-ties are elevated (i.e., bottom-up control of predators occurs) (16). We therefore examined the effects of shoreline development upon the benthic community and epibenthic predators in shallow subtidal areas of the Elizabeth-Lafayette River system, the York River, and Broad Bay (in the Lynnhaven River system).
The tributaries within Chesapeake Bay vary in degree of shoreline development, which may influence the relative abundance of benthos and predators within each system. In the York River, which is about 50 km long, ~86% of the distance along the shoreline is natural marsh, whereas ~6% is developed (riprap, bulkhead, groin, or miscellaneous) and ~8% is upland (17). The Lynnhaven system, including Broad Bay (about 2.5 km long), has a large percentage of shoreline with natural marsh (~78.4%), 11.2% developed with bulkhead only, and 5.2% developed with only riprap (P.G. Ross, pers. comm.). In contrast, the Eliza-beth-Lafayette system (about 8 km long) is highly impacted, with over 50% of its shoreline developed, and it has been described as “an urban, highly developed region… [where] few shoreline miles remain unaltered” (18). Thus, these three systems vary in shoreline development (Fig. 1) and provide an interest-ing contrast for examining impacts of shoreline development on benthos and predators. Our unique con-tribution is a synthesis of the importance of landscape features and variations in the degree of shoreline development among the three different systems that contribute to changes in benthos and predators.
METHODSUsing a random points program for ArcMap software, for
each river we chose 6-15 independent, subtidal sites in marsh creeks adjacent to (<5 m from shore) natural Spartina marsh-es, 6-8 sites adjacent to bulkhead (vertical seawall) structures, and 5-8 sites adjacent to riprap (rocks placed on a slope for erosion control) shoreline structures. For each site, we chose areas with >50 continuous m of the shoreline type. We had replicates of each shoreline type in each river system and a different number of total sampling sites for the Elizabeth-La-fayette system (18 sites), the York River (16 sites), and Broad Bay (31 sites). Trawling was conducted to collect predators at all sites in the York River and Elizabeth-Lafayette and 10 of the 31 sites in Broad Bay.
Bivalves were quantified using suction sampling gear, which samples 0.17 m2 surface area and penetrates 40-60 cm into the sediment. This is essential for accurate estimation of densities of large bivalves that dwell 30-40 cm deep and are sparse (19). On the suction apparatus, we used a 1-mm-mesh
Figure 1. Approximate percentage of shore-line comprised of natural marsh during sur-veys from ����-�00�.
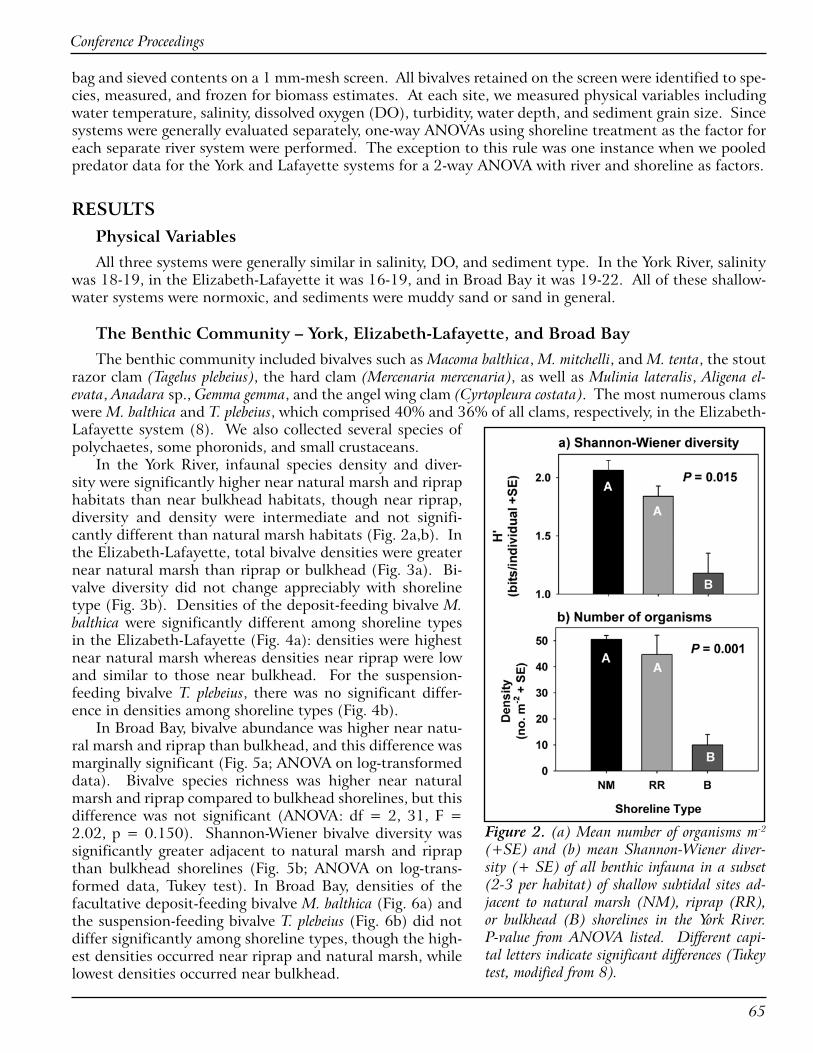
Conference Proceedings
�5
bag and sieved contents on a 1 mm-mesh screen. All bivalves retained on the screen were identified to spe-cies, measured, and frozen for biomass estimates. At each site, we measured physical variables including water temperature, salinity, dissolved oxygen (DO), turbidity, water depth, and sediment grain size. Since systems were generally evaluated separately, one-way ANOVAs using shoreline treatment as the factor for each separate river system were performed. The exception to this rule was one instance when we pooled predator data for the York and Lafayette systems for a 2-way ANOVA with river and shoreline as factors.
RESULTSPhysical Variables All three systems were generally similar in salinity, DO, and sediment type. In the York River, salinity
was 18-19, in the Elizabeth-Lafayette it was 16-19, and in Broad Bay it was 19-22. All of these shallow-water systems were normoxic, and sediments were muddy sand or sand in general.
The Benthic Community – York, Elizabeth-Lafayette, and Broad Bay The benthic community included bivalves such as Macoma balthica, M. mitchelli, and M. tenta, the stout
razor clam (Tagelus plebeius), the hard clam (Mercenaria mercenaria), as well as Mulinia lateralis, Aligena el-evata, Anadara sp., Gemma gemma, and the angel wing clam (Cyrtopleura costata). The most numerous clams were M. balthica and T. plebeius, which comprised 40% and 36% of all clams, respectively, in the Elizabeth-Lafayette system (8). We also collected several species of polychaetes, some phoronids, and small crustaceans.
In the York River, infaunal species density and diver-sity were significantly higher near natural marsh and riprap habitats than near bulkhead habitats, though near riprap, diversity and density were intermediate and not signifi-cantly different than natural marsh habitats (Fig. 2a,b). In the Elizabeth-Lafayette, total bivalve densities were greater near natural marsh than riprap or bulkhead (Fig. 3a). Bi-valve diversity did not change appreciably with shoreline type (Fig. 3b). Densities of the deposit-feeding bivalve M. balthica were significantly different among shoreline types in the Elizabeth-Lafayette (Fig. 4a): densities were highest near natural marsh whereas densities near riprap were low and similar to those near bulkhead. For the suspension-feeding bivalve T. plebeius, there was no significant differ-ence in densities among shoreline types (Fig. 4b).
In Broad Bay, bivalve abundance was higher near natu-ral marsh and riprap than bulkhead, and this difference was marginally significant (Fig. 5a; ANOVA on log-transformed data). Bivalve species richness was higher near natural marsh and riprap compared to bulkhead shorelines, but this difference was not significant (ANOVA: df = 2, 31, F = 2.02, p = 0.150). Shannon-Wiener bivalve diversity was significantly greater adjacent to natural marsh and riprap than bulkhead shorelines (Fig. 5b; ANOVA on log-trans-formed data, Tukey test). In Broad Bay, densities of the facultative deposit-feeding bivalve M. balthica (Fig. 6a) and the suspension-feeding bivalve T. plebeius (Fig. 6b) did not differ significantly among shoreline types, though the high-est densities occurred near riprap and natural marsh, while lowest densities occurred near bulkhead.
Figure 2. (a) Mean number of organisms m-� (+SE) and (b) mean Shannon-Wiener diver-sity (+ SE) of all benthic infauna in a subset (�-� per habitat) of shallow subtidal sites ad-jacent to natural marsh (NM), riprap (RR), or bulkhead (B) shorelines in the York River. P-value from ANOVA listed. Different capi-tal letters indicate significant differences (Tukey test, modified from �).
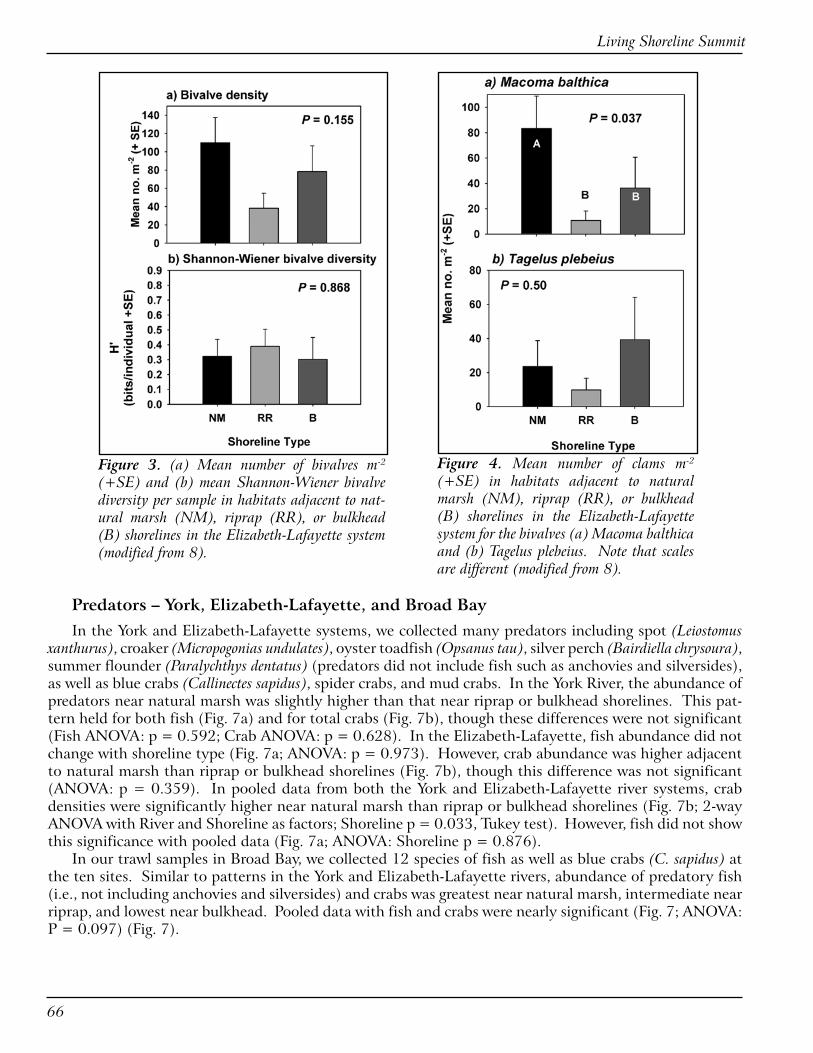
Living Shoreline Summit
��
Predators – York, Elizabeth-Lafayette, and Broad BayIn the York and Elizabeth-Lafayette systems, we collected many predators including spot (Leiostomus
xanthurus), croaker (Micropogonias undulates), oyster toadfish (Opsanus tau), silver perch (Bairdiella chrysoura), summer flounder (Paralychthys dentatus) (predators did not include fish such as anchovies and silversides), as well as blue crabs (Callinectes sapidus), spider crabs, and mud crabs. In the York River, the abundance of predators near natural marsh was slightly higher than that near riprap or bulkhead shorelines. This pat-tern held for both fish (Fig. 7a) and for total crabs (Fig. 7b), though these differences were not significant (Fish ANOVA: p = 0.592; Crab ANOVA: p = 0.628). In the Elizabeth-Lafayette, fish abundance did not change with shoreline type (Fig. 7a; ANOVA: p = 0.973). However, crab abundance was higher adjacent to natural marsh than riprap or bulkhead shorelines (Fig. 7b), though this difference was not significant (ANOVA: p = 0.359). In pooled data from both the York and Elizabeth-Lafayette river systems, crab densities were significantly higher near natural marsh than riprap or bulkhead shorelines (Fig. 7b; 2-way ANOVA with River and Shoreline as factors; Shoreline p = 0.033, Tukey test). However, fish did not show this significance with pooled data (Fig. 7a; ANOVA: Shoreline p = 0.876).
In our trawl samples in Broad Bay, we collected 12 species of fish as well as blue crabs (C. sapidus) at the ten sites. Similar to patterns in the York and Elizabeth-Lafayette rivers, abundance of predatory fish (i.e., not including anchovies and silversides) and crabs was greatest near natural marsh, intermediate near riprap, and lowest near bulkhead. Pooled data with fish and crabs were nearly significant (Fig. 7; ANOVA: P = 0.097) (Fig. 7).
Figure 3. (a) Mean number of bivalves m-� (+SE) and (b) mean Shannon-Wiener bivalve diversity per sample in habitats adjacent to nat-ural marsh (NM), riprap (RR), or bulkhead (B) shorelines in the Elizabeth-Lafayette system (modified from �).
Figure 4. Mean number of clams m-� (+SE) in habitats adjacent to natural marsh (NM), riprap (RR), or bulkhead (B) shorelines in the Elizabeth-Lafayette system for the bivalves (a) Macoma balthica and (b) Tagelus plebeius. Note that scales are different (modified from �).
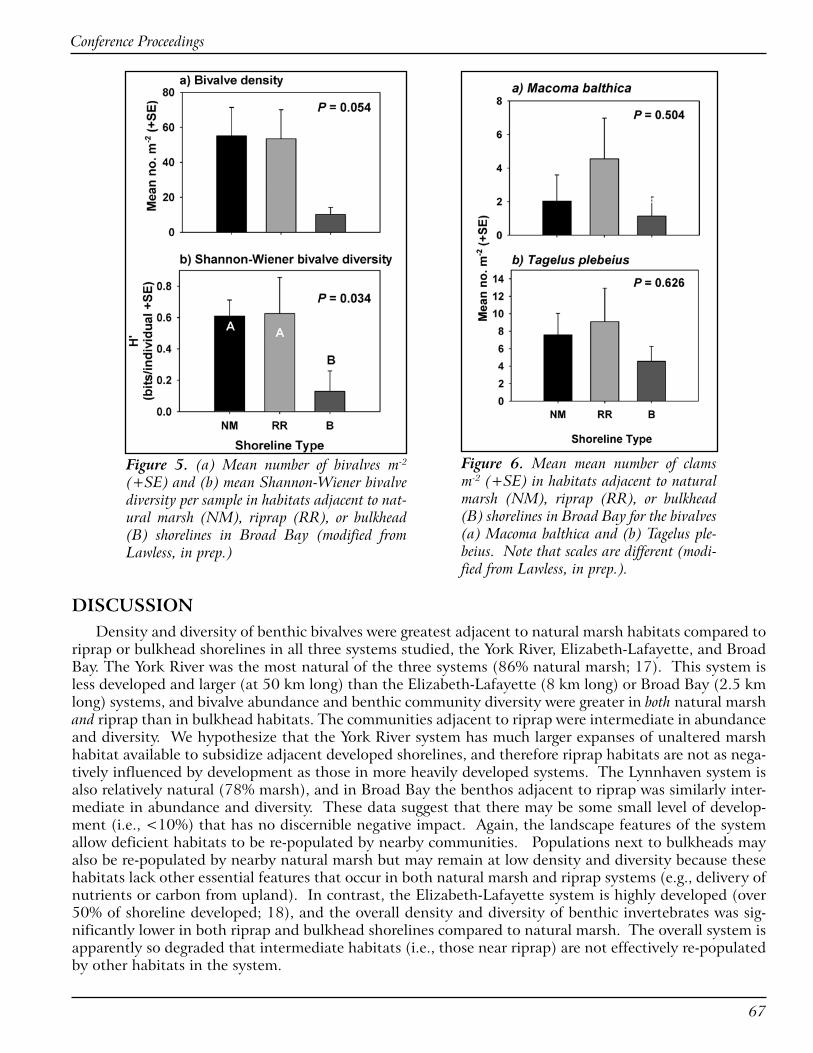
Conference Proceedings
��
DISCUSSIONDensity and diversity of benthic bivalves were greatest adjacent to natural marsh habitats compared to
riprap or bulkhead shorelines in all three systems studied, the York River, Elizabeth-Lafayette, and Broad Bay. The York River was the most natural of the three systems (86% natural marsh; 17). This system is less developed and larger (at 50 km long) than the Elizabeth-Lafayette (8 km long) or Broad Bay (2.5 km long) systems, and bivalve abundance and benthic community diversity were greater in both natural marsh and riprap than in bulkhead habitats. The communities adjacent to riprap were intermediate in abundance and diversity. We hypothesize that the York River system has much larger expanses of unaltered marsh habitat available to subsidize adjacent developed shorelines, and therefore riprap habitats are not as nega-tively influenced by development as those in more heavily developed systems. The Lynnhaven system is also relatively natural (78% marsh), and in Broad Bay the benthos adjacent to riprap was similarly inter-mediate in abundance and diversity. These data suggest that there may be some small level of develop-ment (i.e., <10%) that has no discernible negative impact. Again, the landscape features of the system allow deficient habitats to be re-populated by nearby communities. Populations next to bulkheads may also be re-populated by nearby natural marsh but may remain at low density and diversity because these habitats lack other essential features that occur in both natural marsh and riprap systems (e.g., delivery of nutrients or carbon from upland). In contrast, the Elizabeth-Lafayette system is highly developed (over 50% of shoreline developed; 18), and the overall density and diversity of benthic invertebrates was sig-nificantly lower in both riprap and bulkhead shorelines compared to natural marsh. The overall system is apparently so degraded that intermediate habitats (i.e., those near riprap) are not effectively re-populated by other habitats in the system.
Figure 5. (a) Mean number of bivalves m-� (+SE) and (b) mean Shannon-Wiener bivalve diversity per sample in habitats adjacent to nat-ural marsh (NM), riprap (RR), or bulkhead (B) shorelines in Broad Bay (modified from Lawless, in prep.)
Figure 6. Mean mean number of clams m-� (+SE) in habitats adjacent to natural marsh (NM), riprap (RR), or bulkhead (B) shorelines in Broad Bay for the bivalves (a) Macoma balthica and (b) Tagelus ple-beius. Note that scales are different (modi-fied from Lawless, in prep.).
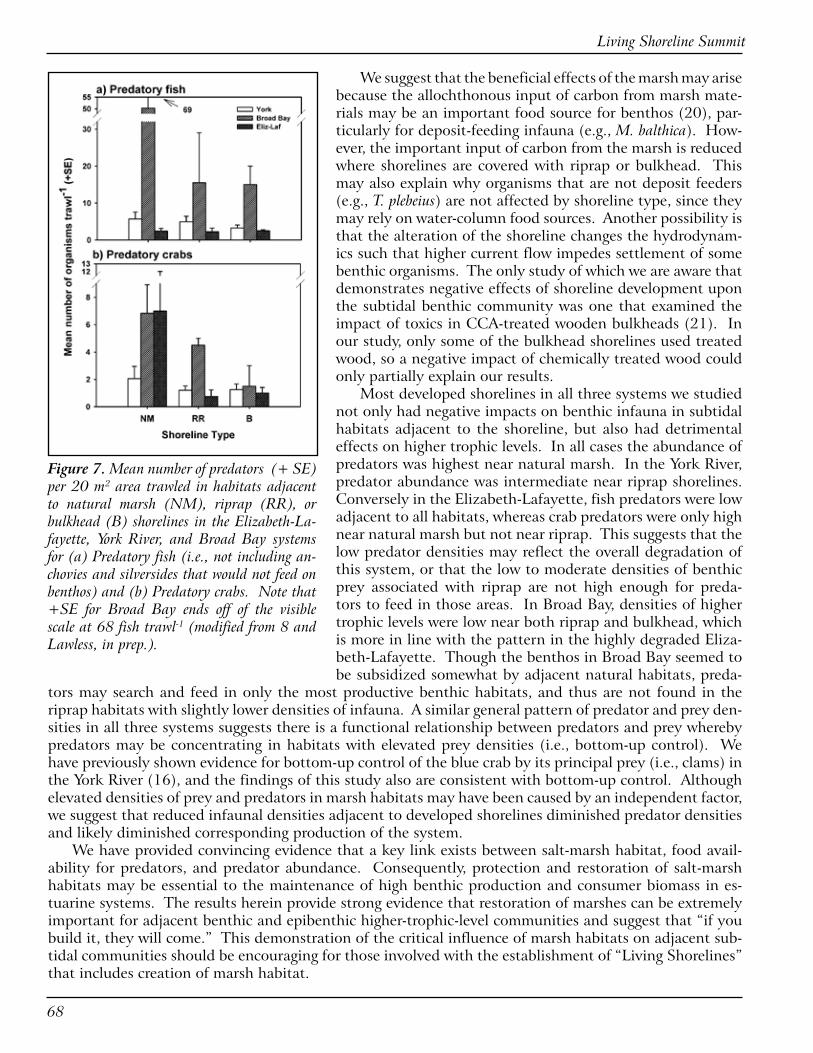
Living Shoreline Summit
��
We suggest that the beneficial effects of the marsh may arise because the allochthonous input of carbon from marsh mate-rials may be an important food source for benthos (20), par-ticularly for deposit-feeding infauna (e.g., M. balthica). How-ever, the important input of carbon from the marsh is reduced where shorelines are covered with riprap or bulkhead. This may also explain why organisms that are not deposit feeders (e.g., T. plebeius) are not affected by shoreline type, since they may rely on water-column food sources. Another possibility is that the alteration of the shoreline changes the hydrodynam-ics such that higher current flow impedes settlement of some benthic organisms. The only study of which we are aware that demonstrates negative effects of shoreline development upon the subtidal benthic community was one that examined the impact of toxics in CCA-treated wooden bulkheads (21). In our study, only some of the bulkhead shorelines used treated wood, so a negative impact of chemically treated wood could only partially explain our results.
Most developed shorelines in all three systems we studied not only had negative impacts on benthic infauna in subtidal habitats adjacent to the shoreline, but also had detrimental effects on higher trophic levels. In all cases the abundance of predators was highest near natural marsh. In the York River, predator abundance was intermediate near riprap shorelines. Conversely in the Elizabeth-Lafayette, fish predators were low adjacent to all habitats, whereas crab predators were only high near natural marsh but not near riprap. This suggests that the low predator densities may reflect the overall degradation of this system, or that the low to moderate densities of benthic prey associated with riprap are not high enough for preda-tors to feed in those areas. In Broad Bay, densities of higher trophic levels were low near both riprap and bulkhead, which is more in line with the pattern in the highly degraded Eliza-beth-Lafayette. Though the benthos in Broad Bay seemed to be subsidized somewhat by adjacent natural habitats, preda-
tors may search and feed in only the most productive benthic habitats, and thus are not found in the riprap habitats with slightly lower densities of infauna. A similar general pattern of predator and prey den-sities in all three systems suggests there is a functional relationship between predators and prey whereby predators may be concentrating in habitats with elevated prey densities (i.e., bottom-up control). We have previously shown evidence for bottom-up control of the blue crab by its principal prey (i.e., clams) in the York River (16), and the findings of this study also are consistent with bottom-up control. Although elevated densities of prey and predators in marsh habitats may have been caused by an independent factor, we suggest that reduced infaunal densities adjacent to developed shorelines diminished predator densities and likely diminished corresponding production of the system.
We have provided convincing evidence that a key link exists between salt-marsh habitat, food avail-ability for predators, and predator abundance. Consequently, protection and restoration of salt-marsh habitats may be essential to the maintenance of high benthic production and consumer biomass in es-tuarine systems. The results herein provide strong evidence that restoration of marshes can be extremely important for adjacent benthic and epibenthic higher-trophic-level communities and suggest that “if you build it, they will come.” This demonstration of the critical influence of marsh habitats on adjacent sub-tidal communities should be encouraging for those involved with the establishment of “Living Shorelines” that includes creation of marsh habitat.
Figure 7. Mean number of predators (+ SE) per �0 m� area trawled in habitats adjacent to natural marsh (NM), riprap (RR), or bulkhead (B) shorelines in the Elizabeth-La-fayette, York River, and Broad Bay systems for (a) Predatory fish (i.e., not including an-chovies and silversides that would not feed on benthos) and (b) Predatory crabs. Note that +SE for Broad Bay ends off of the visible scale at �� fish trawl-� (modified from � and Lawless, in prep.).
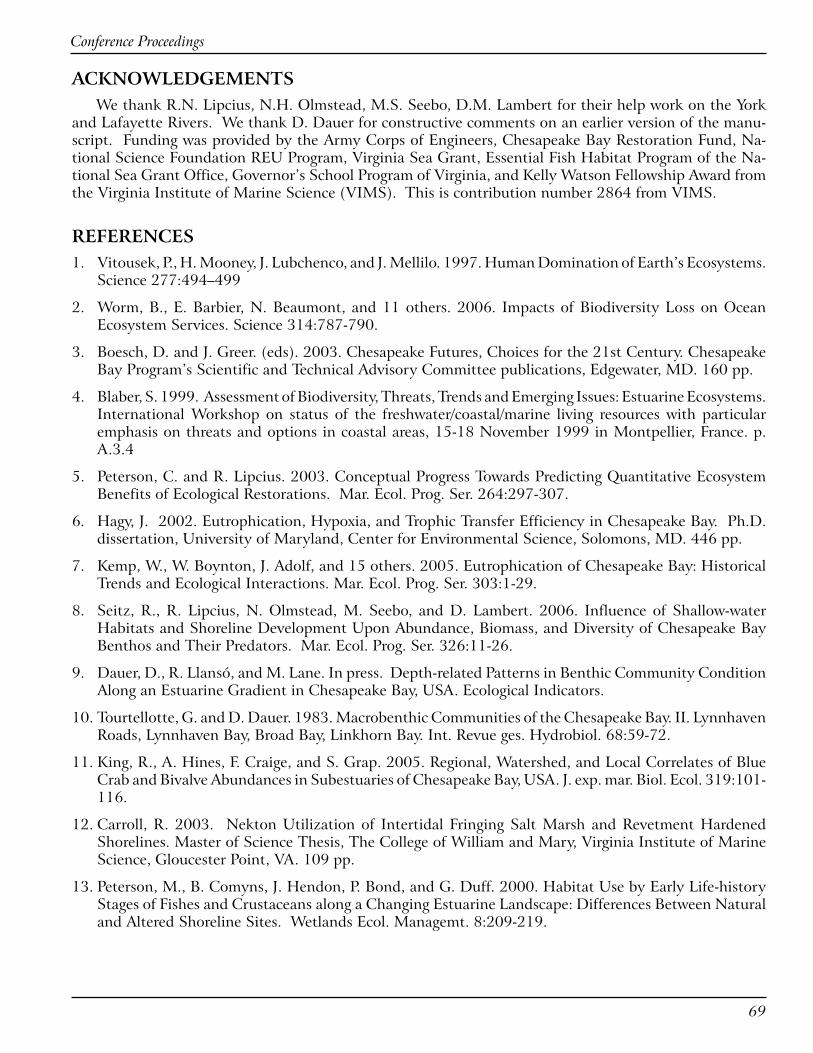
Conference Proceedings
��
ACKNOWLEDGEMENTSWe thank R.N. Lipcius, N.H. Olmstead, M.S. Seebo, D.M. Lambert for their help work on the York
and Lafayette Rivers. We thank D. Dauer for constructive comments on an earlier version of the manu-script. Funding was provided by the Army Corps of Engineers, Chesapeake Bay Restoration Fund, Na-tional Science Foundation REU Program, Virginia Sea Grant, Essential Fish Habitat Program of the Na-tional Sea Grant Office, Governor’s School Program of Virginia, and Kelly Watson Fellowship Award from the Virginia Institute of Marine Science (VIMS). This is contribution number 2864 from VIMS.
REFERENCES1. Vitousek, P., H. Mooney, J. Lubchenco, and J. Mellilo. 1997. Human Domination of Earth’s Ecosystems.
Science 277:494–499
2. Worm, B., E. Barbier, N. Beaumont, and 11 others. 2006. Impacts of Biodiversity Loss on Ocean Ecosystem Services. Science 314:787-790.
3. Boesch, D. and J. Greer. (eds). 2003. Chesapeake Futures, Choices for the 21st Century. Chesapeake Bay Program’s Scientific and Technical Advisory Committee publications, Edgewater, MD. 160 pp.
4. Blaber, S. 1999. Assessment of Biodiversity, Threats, Trends and Emerging Issues: Estuarine Ecosystems. International Workshop on status of the freshwater/coastal/marine living resources with particular emphasis on threats and options in coastal areas, 15-18 November 1999 in Montpellier, France. p. A.3.4
5. Peterson, C. and R. Lipcius. 2003. Conceptual Progress Towards Predicting Quantitative Ecosystem Benefits of Ecological Restorations. Mar. Ecol. Prog. Ser. 264:297-307.
6. Hagy, J. 2002. Eutrophication, Hypoxia, and Trophic Transfer Efficiency in Chesapeake Bay. Ph.D. dissertation, University of Maryland, Center for Environmental Science, Solomons, MD. 446 pp.
7. Kemp, W., W. Boynton, J. Adolf, and 15 others. 2005. Eutrophication of Chesapeake Bay: Historical Trends and Ecological Interactions. Mar. Ecol. Prog. Ser. 303:1-29.
8. Seitz, R., R. Lipcius, N. Olmstead, M. Seebo, and D. Lambert. 2006. Influence of Shallow-water Habitats and Shoreline Development Upon Abundance, Biomass, and Diversity of Chesapeake Bay Benthos and Their Predators. Mar. Ecol. Prog. Ser. 326:11-26.
9. Dauer, D., R. Llansó, and M. Lane. In press. Depth-related Patterns in Benthic Community Condition Along an Estuarine Gradient in Chesapeake Bay, USA. Ecological Indicators.
10. Tourtellotte, G. and D. Dauer. 1983. Macrobenthic Communities of the Chesapeake Bay. II. Lynnhaven Roads, Lynnhaven Bay, Broad Bay, Linkhorn Bay. Int. Revue ges. Hydrobiol. 68:59-72.
11. King, R., A. Hines, F. Craige, and S. Grap. 2005. Regional, Watershed, and Local Correlates of Blue Crab and Bivalve Abundances in Subestuaries of Chesapeake Bay, USA. J. exp. mar. Biol. Ecol. 319:101-116.
12. Carroll, R. 2003. Nekton Utilization of Intertidal Fringing Salt Marsh and Revetment Hardened Shorelines. Master of Science Thesis, The College of William and Mary, Virginia Institute of Marine Science, Gloucester Point, VA. 109 pp.
13. Peterson, M., B. Comyns, J. Hendon, P. Bond, and G. Duff. 2000. Habitat Use by Early Life-history Stages of Fishes and Crustaceans along a Changing Estuarine Landscape: Differences Between Natural and Altered Shoreline Sites. Wetlands Ecol. Managemt. 8:209-219.

Living Shoreline Summit
�0
14. Hendon, J., M. Peterson, and B. Comyns. 2000. Spatio-temporal Distribution of Larval Gobiosoma bosc in Waters Adjacent to Natural and Altered Marsh-edge Habitats of Mississippi Coastal Waters. Bull. Mar. Sci. 66:143-156.
15. Hines, A., A. Haddon, and L. Wiechert. 1990. Guild Structure and Foraging Impact of Blue Crabs and Epibenthic Fish in a Subestuary of Chesapeake Bay. Mar. Ecol. Prog. Ser. 67:105-126.
16. Seitz, R., R. Lipcius, W. Stockhausen, K. Delano, M. Seebo, and P. Gerdes. 2003. Potential Bottom-up Control of Blue Crab (C. sapidus) Distribution at Broad Spatial Scales. Bull. Mar. Sci. 72:471-490.
17. Berman, M., H. Berquist, S. Dewing, G. Thoman, and R. Laird. 1999. Gloucester County Shoreline and Tidal Marsh Inventory. Special Report in Applied Marine Science and Ocean Engineering, Number 351 of the Virginia Institute of Marine Science. RMAP.99.003.1. 110 pp.
18. Berman, M., H. Berquist, C. Hershner, S. Killeen, T. Rudnicky, D. Schatt, D. Weiss, and H. Woods. 2002. City of Norfolk – Shoreline Situation Report. Special Report in Applied Marine Science and Ocean Engineering, Number 378 of the Virginia Institute of Marine Science. 76 pp.
19. Hines, A. and K. Comtois. 1985. Vertical Distribution of Infauna in Sediments of a Subestuary of Central Chesapeake Bay. Estuaries 8:296-304.
20. Currin, C., S. Newell, and H. Pearl. 1995. The Role of Standing Dead Spartina alterniflora and Benthic Microalgae in Salt Marsh Food Webs: Considerations Based on Multiple Isotope Analysis. Mar. Ecol. Prog. Ser. 121:99-116.
21. Weis, J., P. Weis, and T. Proctor. 1998. The Extent of Benthic Impacts of CCA-treated Wood Structures in Atlantic Coast Estuaries. Arch. Env. Contamin. Tox. 34:313-322.