evaluation of macroinvertebrate assemblages in the marcellus shale region of the susquehanna river...
TRANSCRIPT

Evaluation of Macroinvertebrate Assemblages in the Marcellus Shale Region of the Susquehanna River Basin, 2011-2013
Luanne SteffySusquehanna River Basin Commission
Shale Network WorkshopMay 8, 2015

The Basin 27,510-square-mile watershed Comprises 43% of the Chesapeake
Bay watershed 4.2 million population 60% forested 32,000+ miles of waterways
The Susquehanna River 444 miles, largest tributary to the
Chesapeake Bay Supplies 18 million gallons a minute
to the bay
Natural gas shales under 85% of basin
Susquehanna River Basin

• Compilation of all SRBC program activities covering the shale gas industry through 2013
• Four-part Assessment – Water Acquisition– Water Quality– Compliance– Assessment
Results/Recommendations• Started – February 2014• Completion – Late Summer 2015
Assessment of Unconventional Gas Development in the Susquehanna
River Basin

Remote Water Quality Monitoring Network

Remote Water Quality Monitoring Network
ObjectivesEstablishing a real-time water quality monitoring network within areas of concern in the
Susquehanna River Basin• Establish baseline water quality conditions; • Determine if the natural gas well industry
and/or other activities are causing adverse impacts on local water quality;
• Form collaborative partnerships to improve monitoring technology and provide educational opportunities;
• Enhance protection for water supplies; and • Be responsive to public concerns.

The Evolution of the RWQMN• First monitoring stations deployed
– 2010• Macroinvertebrate sampling –
2011• Fish sampling – 2012• Rain gauges and pressure
transducers– 2013• Currently, 59 real-time monitoring
stations• Many opportunities for data
sharing, data usage, overlapping project goals

• PADEP Protocol– 6 D-frame kicks composited– 200 count subsample– identified to genus (Chironomidae to
family)• Sampled annually in October
– 2011: 50 sites sampled (13 in May)– 2012: 58 sites sampled– 2013: 59 sites sampled
• Analysis based on PA IBI, related metrics and community similarity
Macroinvertebrate sampling
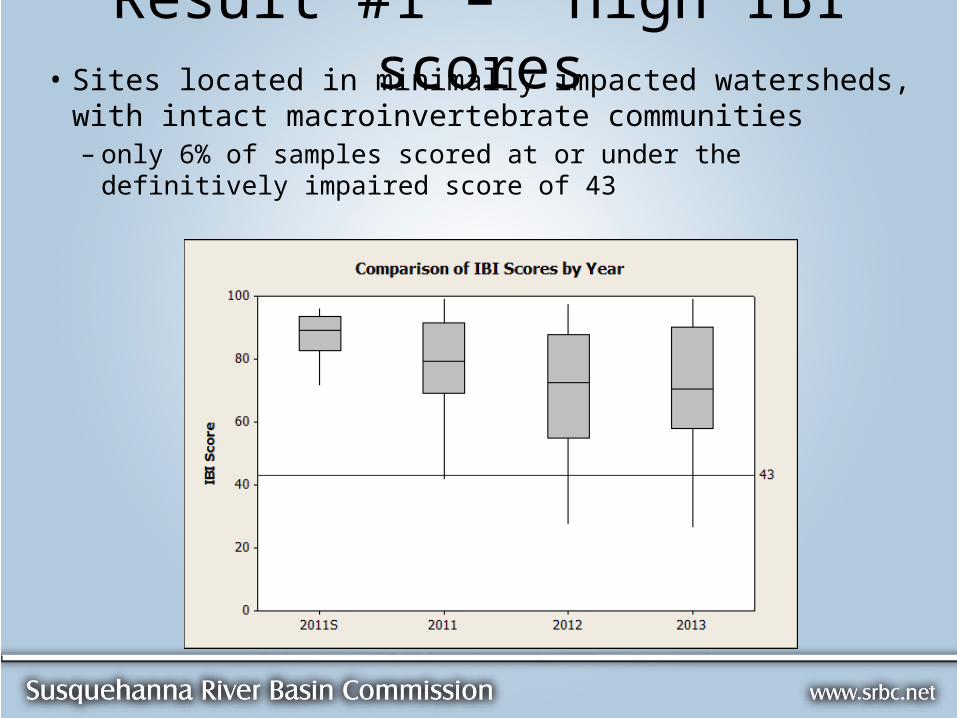
Result #1 – High IBI scores• Sites located in minimally impacted watersheds, with
intact macroinvertebrate communities– only 6% of samples scored at or under the definitively impaired
score of 43

What about ecoregions?

…and then what about gas development?

Result #2 Influence of well density

Result #3 2011 is different• Consistent grouping of 2011 apart from 2012 and 2013


Result #4 Similarity of Assemblages in Gas vs No Gas

Wrap Up• More of the variation in IBI scores is explained by habitat score than
by gas well metrics– gas well density– gas pad density– gas wells with a 4-mile radius of sampling location
• As of 2013 data, there is no significant difference in biological communities in watersheds with no gas activity and those with gas activity. – Healthy streams with sufficient habitat to support thriving
macroinvertebrate communities• NOT an indication that gas development can not or will not have
negative impacts on stream biota– Long term cumulative effects more likely, except for acute events such as
spills

Upcoming Work • 2014 macroinvertebrate samples are back• 2015 October sampling at all sites• 22 sites are on stream sections designated
as EV or HQ CWF– Sampling in April/May– Most designations came before Marcellus
drilling – Have things changed?
• More research into impacts of flow patterns on macroinvertebrate communities • Investigate other ways and scales to
evaluate gas development.

Questions?
• Luanne Steffy [email protected]
• General questions on RWQMN – Dawn Hintz, Project Manager [email protected]
• RWQMN Website http://mdw.srbc.net/remotewaterquality/