evaluation of mechanical liquid/solid manure separators · pdf fileevaluation of mechanical...
TRANSCRIPT
Evaluation of Mechanical Liquid/Solid ManureSeparators
Ron Fleming and Malcolm MacAlpineRidgetown College - University of Guelph
July 2003
Prepared for:Ontario Pork
Project Number 02/39
Evaluation of Manure Separators Fleming and MacAlpine Page: i
Evaluation of Mechanical Liquid/Solid Manure Separators
Ron Fleming and Malcolm MacAlpine
Executive Summary
A study was conducted during the summer and fall of 2002 to develop a standard test formechanical liquid manure separators. Part of the study involved using the test to investigate theeffectiveness of six mechanical manure separators. All separators were tested using three manure types,a low dry matter liquid hog manure, a medium dry matter liquid hog manure and liquid dairy manure. The liquid manures had similar characteristic for each type tested. Of the separators tested, three werepresently being used commercially on farms. The other three systems, although used for othercommercial applications, had not been designed for manure separation and could thus be calledprototypes. Standard reporting forms were developed to summarize the performance of the separators.Highlights of the study:
• The results for the six units gave quite a range of results. Also, there was a considerabledifference in performance depending on which of the three manures was being tested.
• The Maximizer had the highest capacity of the models tested, with a range of 306 to 590 L/min.
• There was a considerable range of values in the volume of manure separated per kW-h ofelectricity, from 94 L for the VSEP to 10,535 L for the Maximizer. The Surface to Surface wasdiesel powered, with an efficiency of 1226 L of manure per L of fuel.
• The particle size distribution in the manure and the separated liquids can give valuableinformation needed to properly design a system. The use of four screens should give theinformation needed - examples of sizes: 10 mesh, 50 mesh, 100 mesh and 325 mesh (i.e. 2.0,0.30, 0.15 and 0.045 mm hole sizes).
• More than one sample should be tested to establish the particle size distribution, to reduce thevariability of results.
• Most separators were effective at removing coarse manure particles i.e. those trapped by a 50mesh, or larger, screen.
• There was a wide range of values for the quantity: Percent initial solids removed into theseparated solids - ranging from < 0.1% to 100%. The high value was for the VSEP, where theseparated solids are still in a slurry form. The Maximizer and Surface to Surface achieved highsof 38% and 34%, respectively.
Evaluation of Manure Separators Fleming and MacAlpine Page: ii
• Removal of solids was very poor for Manure 1 (DM in range 0.34 to 0.84%) for four of the sixseparators.
• The removal of N into the separated solids followed the same pattern as removal of solids.
• The removal of P into the solids portion was similar, although there was less confidence in thevalues, since most concentrations were reported by the lab at only one significant digit.
• The VSEP unit removed all total coliform and E. coli bacteria. Other systems did not have asignificant impact on bacteria numbers.
• Labour needs to operate the six systems varied, but most systems have the ability to be fullyautomated for on-farm use.
• Odours from the separated liquids were similar to liquid manure in most separators tested. Theonly exceptions were the separated liquids from the VSEP separator, which were essentiallyodour free.
• Odours from the separated solids appeared to be dependant on the moisture level of the solidsafter separation. The separators most effective in drying the solids were also the most effectivein reducing or removing odours. This included the Surface to Surface, the SEI and theMaximizer systems.
Evaluation of Manure Separators Fleming and MacAlpine Page: iii
Table of Contents
Executive Summary . . . . . . . . . . . . . . . . . . . . . . . . . . . . . . . . . . . . . . . . . . . . . . . . . . . . . . . . . . . . . i
Table of Contents . . . . . . . . . . . . . . . . . . . . . . . . . . . . . . . . . . . . . . . . . . . . . . . . . . . . . . . . . . . . . . iii
Background . . . . . . . . . . . . . . . . . . . . . . . . . . . . . . . . . . . . . . . . . . . . . . . . . . . . . . . . . . . . . . . . . . . 1
Objectives . . . . . . . . . . . . . . . . . . . . . . . . . . . . . . . . . . . . . . . . . . . . . . . . . . . . . . . . . . . . . . . . . . . . 1
Literature Review . . . . . . . . . . . . . . . . . . . . . . . . . . . . . . . . . . . . . . . . . . . . . . . . . . . . . . . . . . . . . . . 2
Development of Test Procedure . . . . . . . . . . . . . . . . . . . . . . . . . . . . . . . . . . . . . . . . . . . . . . . . . . . . 3a) General . . . . . . . . . . . . . . . . . . . . . . . . . . . . . . . . . . . . . . . . . . . . . . . . . . . . . . . . . . . . . . 3b) Prior to separation . . . . . . . . . . . . . . . . . . . . . . . . . . . . . . . . . . . . . . . . . . . . . . . . . . . . . . 3c) During separation . . . . . . . . . . . . . . . . . . . . . . . . . . . . . . . . . . . . . . . . . . . . . . . . . . . . . . . 4d) Varying parameters during separation . . . . . . . . . . . . . . . . . . . . . . . . . . . . . . . . . . . . . . . . 5e) Additional Analysis of the Liquid and Solid Streams . . . . . . . . . . . . . . . . . . . . . . . . . . . . . 5
Equipment Testing . . . . . . . . . . . . . . . . . . . . . . . . . . . . . . . . . . . . . . . . . . . . . . . . . . . . . . . . . . . . . . 5a) Manure Characteristics . . . . . . . . . . . . . . . . . . . . . . . . . . . . . . . . . . . . . . . . . . . . . . . . . . . 6b) Data Collection . . . . . . . . . . . . . . . . . . . . . . . . . . . . . . . . . . . . . . . . . . . . . . . . . . . . . . . . 7c) Description of Mechanical Separators Tested . . . . . . . . . . . . . . . . . . . . . . . . . . . . . . . . . 9
Test Results . . . . . . . . . . . . . . . . . . . . . . . . . . . . . . . . . . . . . . . . . . . . . . . . . . . . . . . . . . . . . . . . . . 11a) Performance of Mechanical Separators - General . . . . . . . . . . . . . . . . . . . . . . . . . . . . . . 11b) Separator Capacity . . . . . . . . . . . . . . . . . . . . . . . . . . . . . . . . . . . . . . . . . . . . . . . . . . . . 11c) Power Requirements . . . . . . . . . . . . . . . . . . . . . . . . . . . . . . . . . . . . . . . . . . . . . . . . . . . 12d) Particle Size Distribution . . . . . . . . . . . . . . . . . . . . . . . . . . . . . . . . . . . . . . . . . . . . . . . . . 13e) Removal of Solids . . . . . . . . . . . . . . . . . . . . . . . . . . . . . . . . . . . . . . . . . . . . . . . . . . . . . 15f) Removal of Nutrients . . . . . . . . . . . . . . . . . . . . . . . . . . . . . . . . . . . . . . . . . . . . . . . . . . . 15g) Removal of Bacteria . . . . . . . . . . . . . . . . . . . . . . . . . . . . . . . . . . . . . . . . . . . . . . . . . . . . 17h) Labour Requirements . . . . . . . . . . . . . . . . . . . . . . . . . . . . . . . . . . . . . . . . . . . . . . . . . . . 18i) Odour Levels . . . . . . . . . . . . . . . . . . . . . . . . . . . . . . . . . . . . . . . . . . . . . . . . . . . . . . . . . 19j) Economics of Manure Separation . . . . . . . . . . . . . . . . . . . . . . . . . . . . . . . . . . . . . . . . . . 19
Summary and Conclusions . . . . . . . . . . . . . . . . . . . . . . . . . . . . . . . . . . . . . . . . . . . . . . . . . . . . . . . 20
Acknowledgements . . . . . . . . . . . . . . . . . . . . . . . . . . . . . . . . . . . . . . . . . . . . . . . . . . . . . . . . . . . . 21
References . . . . . . . . . . . . . . . . . . . . . . . . . . . . . . . . . . . . . . . . . . . . . . . . . . . . . . . . . . . . . . . . . . . 22
Appendix . . . . . . . . . . . . . . . . . . . . . . . . . . . . . . . . . . . . . . . . . . . . . . . . . . . . . . . . . . . . . . . . . . . . 22
Evaluation of Manure Separators Fleming and MacAlpine Page: iv
Evaluation of Manure Separators Fleming and MacAlpine Page: 1
Evaluation of Mechanical Liquid/Solid Manure Separators
Background
For several years, farmers have been interested in the idea of separating solids from liquids in aliquid manure system. In the past, the perceived benefits included:• an improvement in the handling, processing and storage properties of the manure - the liquid
effluent is much easier to agitate, there is much less risk of plugging transfer pipes, less power isneeded to pump the liquid; and
• the creation of a value-added product, such as bedding or feed.The industry has evolved, and the needs of the farmers have changed. The benefits listed above
still apply, but farmers need equipment to address the following additional challenges:• Farmers face greater manure transportation costs as facility sizes continue to increase and
manure must be transported greater distances. Reducing the N and P concentration in the liquideffluent would be an advantage.
• There is much greater attention placed on pathogens in manure and the potential risks of watercontamination during spreading. Separation, either by itself or with other processes, may helpreduce these risks.
• There is even greater pressure to reduce odours, and separation may help - again, either byitself or as part of a larger treatment system.
• The solids may be composted, or otherwise treated, to produce value-added products that maybe sold off the farm. The main methods of separation have included settling (gravity), chemical separation, and
mechanical separation. Each method has its place. The mechanical systems are viewed by many to berelatively expensive but the most compact and the quickest. There are performance differencesbetween the different methods and between mechanical separators. New equipment is on the marketnow, and technologies that have been very effective in the wastewater industry (e.g. membranesystems) are now being considered as part of manure treatment systems.
For the variety of mechanical separators being marketed today, it is not always possible to getaccurate and complete performance data. Even when this information is available, it is not in a standardformat, thus making comparisons between types of equipment difficult. Depending on the role of theseparator in a farmer’s manure system, the desired performance characteristics may be quite different.For example, one farmer may want a system that removes as much N and P as possible into the solidsportion, while another may want an effluent that can be used in a flushing system and may want a lessexpensive unit.
Objectives
A study was begun in 2002 to address the lack of information on test procedures andstandardized test results for mechanical separators. The objectives were: 1. Measure the effectiveness of several mechanical manure separators at removing solids from
Evaluation of Manure Separators Fleming and MacAlpine Page: 2
liquid swine manure.2. Compare the characteristics of the liquid and solid phases of separated manure using several
mechanical separators. 3. Develop a test procedure that can be used to perform standard tests of mechanical manure
separators to rate their effectiveness.The study was designed to be completed in three stages: a) a detailed literature review of
mechanical manure separation; b) development of a standard test protocol; c) testing of severalseparators using the new test and fine-tuning of the test procedure.
Literature Review
Highlights of the literature review (Ford and Fleming, 2002) are as follows:• Mechanical solid-liquid manure separators generally fall into three categories: screens,
centrifuges, and presses and may include combinations of these.• The most commonly used measures to evaluate a separator’s performance in the past have
been the separator throughput and the physical and chemical constituents of the separatedfractions in relation to the influent manure.
• The shortfall of many studies has been their limited focus on certain constituents. Someparameters which should be considered more often by researchers evaluating a particularseparator’s performance include: particle size distribution, maintenance requirements, odourobservations, energy consumption, and cost.
• The greatest single improvement to most separator test protocols would be the analysis of theparticle size distribution of the influent manure and the separated liquid effluent. The profile ofsolids in the influent manure would allow for the selection of the most appropriate screen size.Comparison of the separated liquid and the unseparated manure would reveal the efficiency ofa particular separator at removing solid particles within a specific range.
• Various calculations have been used to determine a separator’s efficiency. It is important thatresearchers clearly state or derive how they calculated the separation efficiency.
• The measure of separation efficiency referred to as the “percent removal efficiency”, is acommonly used indicator of separator performance and is simple to calculate. It providesuseful information to a researcher testing a separator or to an individual determining thefeasibility of a certain unit in their manure handling system. The second measure of separationefficiency, which considers the concentrations of parameters in the separated solids fraction,should also be used, regardless of the goal of the testing.
• Many studies have not reported or measured enough parameters to conduct a mass balance. The flow rate of the influent and liquid effluent streams should be reported, to make massbalance calculations possible.
• Chemical and physical analysis of constituents in the different separated streams and the influentmanure have been highly variable. The top three reported parameters for the percent removalefficiency were Total Solids (TS), chemical oxygen demand (COD), and phosphorus (P),respectively. The concentrations of these three constituents were measured both in the
Evaluation of Manure Separators Fleming and MacAlpine Page: 3
separated liquid and the influent manure. The top four reported concentrations of parameters inthe separated solids fraction included TS, P, K, and VS, respectively.
• Great variability in the test conditions existed in the manure type and dilution, influent flow rate,operational parameters, and the length of testing. Because of this variability, it is very difficult todraw general conclusions about the performance of generic separator types.
• Sand bedding in free stall barns presents a challenge to the dairy industry since sand is veryabrasive to mechanical manure system components, including separation units. Manure fromfree stall barns with sand bedding has been used in the testing of a stationary inclined screen. Other separator types, however, have not been tested with manure containing sand bedding.
• There is a misconception that phosphorus can be easily concentrated in the separated solidsportion. In all but one of the studies reviewed, less than 30 % of the P was removed into thesolids fraction for swine and dairy manure of varying dilutions and influent flow rates.
Development of Test Procedure
Based on the results of the literature review and the perceived information needs of farmers andsystem designers, a test procedure was developed. Most of the measurements seem like common sensebut some were nevertheless omitted from several of the tests reviewed in the literature. Some of thetests that have been carried out in the past involved on-farm installations and monitoring for longperiods of time. While this has advantages, it is often difficult to achieve. A compromise was proposedwhere smaller volumes of manure would be evaluated but more than one manure type would beexamined. This has the advantage that it gives information about a range of manure types,acknowledging that a separator may work very well with one type of manure or specific range of drymatter contents, but may not perform equally well with all manures.
For reporting the test results, a standard reporting format was developed. The test reports forall six of the units in the study are attached in the appendix of this report. A summary of the testprocedure used in this study follows:
a) General• Test at least three different manures - representing a range of dry matter contents and livestock
types (reflecting the target livestock groups)• Test at least 20,000 L of each manure. For smaller separators (e.g. prototypes), test the
machine based on a time limit - aim for at least four hours of operation for each manure type.
b) Prior to separation• Characterise the influent manure:
• consider the length of time the manure was stored before separation• consider how fine the grain in the feed has been ground
• List the energy requirements of the separator and the energy requirements of any additionalimplements necessary for the operation of the separator (e.g. lift pumps, etc.)
Evaluation of Manure Separators Fleming and MacAlpine Page: 4
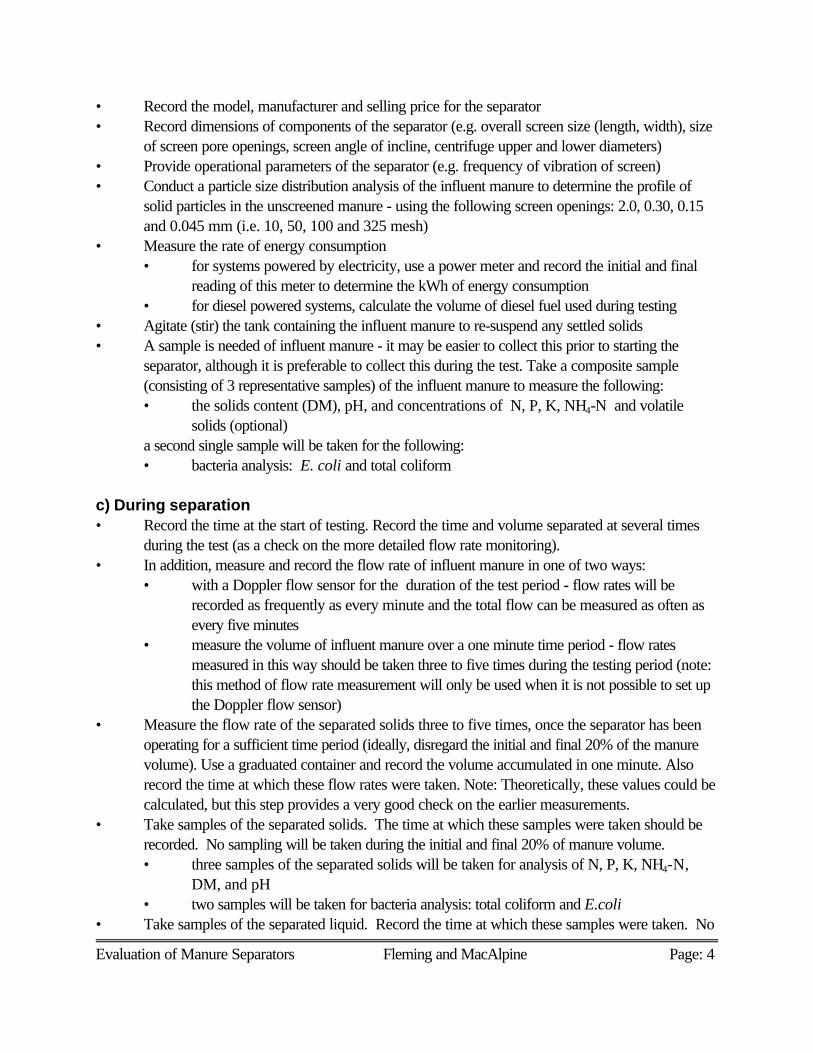
• Record the model, manufacturer and selling price for the separator• Record dimensions of components of the separator (e.g. overall screen size (length, width), size
of screen pore openings, screen angle of incline, centrifuge upper and lower diameters)• Provide operational parameters of the separator (e.g. frequency of vibration of screen) • Conduct a particle size distribution analysis of the influent manure to determine the profile of
solid particles in the unscreened manure - using the following screen openings: 2.0, 0.30, 0.15and 0.045 mm (i.e. 10, 50, 100 and 325 mesh)
• Measure the rate of energy consumption• for systems powered by electricity, use a power meter and record the initial and final
reading of this meter to determine the kWh of energy consumption• for diesel powered systems, calculate the volume of diesel fuel used during testing
• Agitate (stir) the tank containing the influent manure to re-suspend any settled solids• A sample is needed of influent manure - it may be easier to collect this prior to starting the
separator, although it is preferable to collect this during the test. Take a composite sample(consisting of 3 representative samples) of the influent manure to measure the following:• the solids content (DM), pH, and concentrations of N, P, K, NH4-N and volatile
solids (optional) a second single sample will be taken for the following:• bacteria analysis: E. coli and total coliform
c) During separation• Record the time at the start of testing. Record the time and volume separated at several times
during the test (as a check on the more detailed flow rate monitoring). • In addition, measure and record the flow rate of influent manure in one of two ways:
• with a Doppler flow sensor for the duration of the test period - flow rates will berecorded as frequently as every minute and the total flow can be measured as often asevery five minutes
• measure the volume of influent manure over a one minute time period - flow ratesmeasured in this way should be taken three to five times during the testing period (note:this method of flow rate measurement will only be used when it is not possible to set upthe Doppler flow sensor)
• Measure the flow rate of the separated solids three to five times, once the separator has beenoperating for a sufficient time period (ideally, disregard the initial and final 20% of the manurevolume). Use a graduated container and record the volume accumulated in one minute. Alsorecord the time at which these flow rates were taken. Note: Theoretically, these values could becalculated, but this step provides a very good check on the earlier measurements.
• Take samples of the separated solids. The time at which these samples were taken should berecorded. No sampling will be taken during the initial and final 20% of manure volume.• three samples of the separated solids will be taken for analysis of N, P, K, NH4-N,
DM, and pH• two samples will be taken for bacteria analysis: total coliform and E.coli
• Take samples of the separated liquid. Record the time at which these samples were taken. No
Evaluation of Manure Separators Fleming and MacAlpine Page: 5
sampling will be taken during the initial and final 20% of manure volume. • three samples will be taken for analysis of N, P, K, NH4-N, DM, and pH• two samples will be taken for bacteria analysis including, total coliform and E. coli• do a particle size distribution on this liquid, similar to that done for the influent
• The following should be monitored throughout the testing period:• labour/maintenance requirements - this should be considered in both a qualitative and
quantitative sense - e.g. what type of maintenance management is required and theapproximate length of time required to adequately complete these maintenance tasks(the amount of labour required by one person per unit volume of manure can then bedetermined)
• Record the time the testing was completed and the total volume of influent manure processed
d) Varying parameters during separationIf parameters on the separator can be varied (such as flow rate and screen opening), more than one testwill be needed (e.g. a vibrating screen may be run in the first test with a 40 mesh screen and in thesecond test this screen will be replaced by 60 mesh screen).
e) Additional Analysis of the Liquid and Solid Streams• make qualitative odour observations of the odour levels of effluent and separated solids (relative
to the influent manure)• determine the volume and mass of the separated solids
Equipment Testing
Six liquid manure separators were selected to evaluate their relative performance. Not allseparators were designed to perform in the same fashion. However, every attempt was made to keepas many factors as possible constant and to monitor the same parameters. Some separators were lab-scale machines and others were farm-scale machines with large capacities. Some were prototypeswhile others had a proven history of use on farms. The standard test was deemed to be a useful tool inthe development and testing of new separators, so including some prototype machines was deemedappropriate. A few extra pre-test steps were needed for the prototypes, however. With someprototypes, not enough experience was available to allow setup in order to achieve the optimumperformance (i.e. this standard had not been determined). In these cases, setup and adjustments werebased on the advise of the equipment suppliers.

Evaluation of Manure Separators Fleming and MacAlpine Page: 6
a) Manure CharacteristicsTesting was based on how the six separators performed with three manure types. They were:
i) a liquid hog manure with about 1% dry matter, ii) a liquid hog manure with a dry matter in the rangeof 2% to 4%, and iii) a liquid dairy manure with less than 5% dry matter. Each separator was testedusing approximately 19,000 litres of liquid manure per manure tested. For the laboratory scale systems,a test was run for up to 4.75 hours .
The sources of the “low dry matter” liquid hog manure were a local farmer and from theRidgetown College swine finishing herd. Manure characteristic were similar from both sources. Therewas no bedding used in either barn and feed was ground to 4.7 mm (3/16"). The manure was takenfrom long term storages (outside storage tanks). The tanks had been pumped out about six monthsearlier and fresh manure had been added periodically. Only limited agitation could be used in thesetanks during the study.
The second DM level of liquid hog manure came from two local hog farms, both using wet/dryfeeders. Manure characteristics and dry matters were similar from both of these farms. There was nobedding used in the barns. Feed was ground to 4.7 mm (3/16"). The manure was taken from long termstorages that would have fresh manure flushed into them from smaller storages under the barns. Thetanks were pumped out up to six months earlier, and some fresh manure was added periodically. Thismanure was agitated prior to testing to suspend the solids.
The dairy manure was taken from a large liquid manure storage tank at Ridgetown College. This manure was from a long term storage (the tank was pumped out up to six months earlier) with thedaily addition of about 5,000 to 10,000 L of fresh manure. The manure contained bedding from thecattle as well as water added to help with agitation of the tank. Milk-house wastewater was added tothe tank. The tank had limited agitation during the tests, but an effort was made to agitate the area of thetank serving as the manure source.
One of the separators (the Maximizer) was tested using fresh manure from a 300 milking cowdairy farm. The manure storage contained liquid dairy manure and milk-house wastewater produced onthe farm. In this case, the separated manure was still relatively fresh (i.e. separated before any solidsstarted to break down in storage), thus potentially improving the measured efficiency of the separator.
Tables 1 and 2 give examples of influent manure nutrient and bacteria data for one of the tests.
Table 1 - Nutrient levels in influent manure for Surface to Surface equipment test
DM(%)
N(%)
P (%)
K(%)
NH4-N(mg/L)
VS(%, DM
basis)
C(%) pH
M1 0.6 0.08 0.01 0.06 3272 67.6 0.41 7.7
M2 3.79 0.4 0.05 0.26 912 69.7 2.64 7.5
M3 1.32 0.18 0.01 0.14 811 64.5 0.85 7.4where M1 and M2 are liquid swine manure, M3 is liquid dairy manure
Evaluation of Manure Separators Fleming and MacAlpine Page: 7
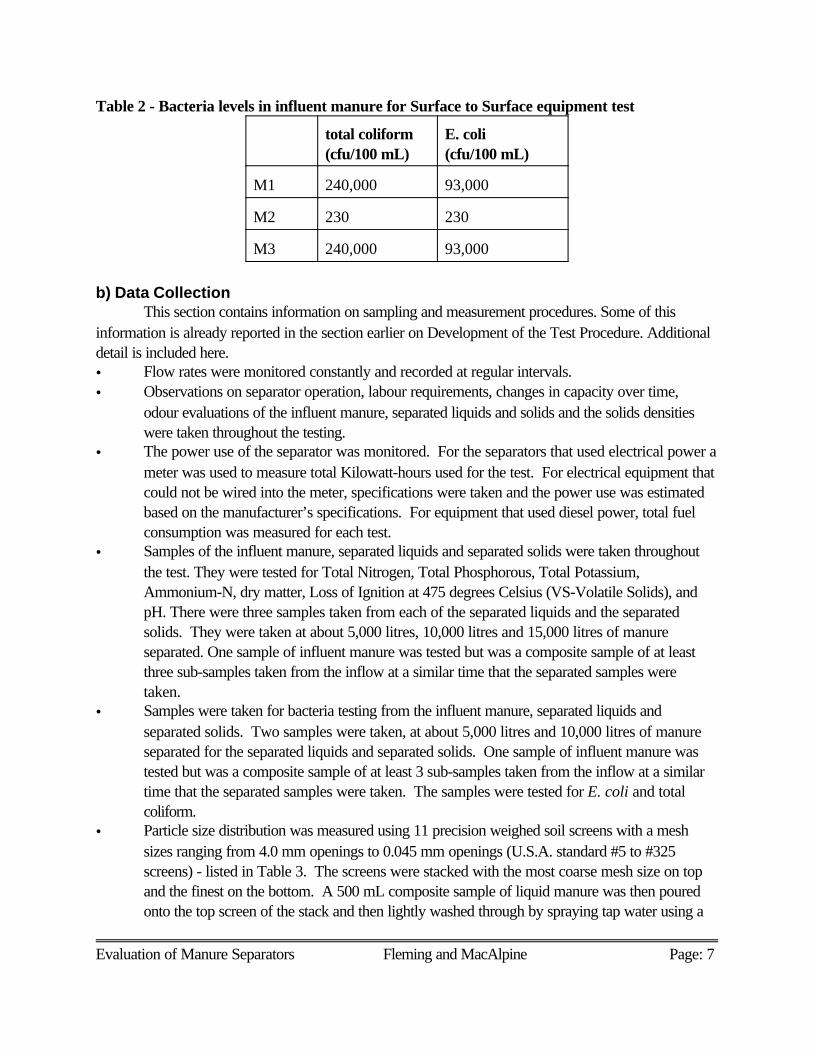
Table 2 - Bacteria levels in influent manure for Surface to Surface equipment test
total coliform(cfu/100 mL)
E. coli(cfu/100 mL)
M1 240,000 93,000
M2 230 230
M3 240,000 93,000
b) Data CollectionThis section contains information on sampling and measurement procedures. Some of this
information is already reported in the section earlier on Development of the Test Procedure. Additionaldetail is included here.• Flow rates were monitored constantly and recorded at regular intervals. • Observations on separator operation, labour requirements, changes in capacity over time,
odour evaluations of the influent manure, separated liquids and solids and the solids densitieswere taken throughout the testing.
• The power use of the separator was monitored. For the separators that used electrical power ameter was used to measure total Kilowatt-hours used for the test. For electrical equipment thatcould not be wired into the meter, specifications were taken and the power use was estimatedbased on the manufacturer’s specifications. For equipment that used diesel power, total fuelconsumption was measured for each test.
• Samples of the influent manure, separated liquids and separated solids were taken throughoutthe test. They were tested for Total Nitrogen, Total Phosphorous, Total Potassium,Ammonium-N, dry matter, Loss of Ignition at 475 degrees Celsius (VS-Volatile Solids), andpH. There were three samples taken from each of the separated liquids and the separatedsolids. They were taken at about 5,000 litres, 10,000 litres and 15,000 litres of manureseparated. One sample of influent manure was tested but was a composite sample of at leastthree sub-samples taken from the inflow at a similar time that the separated samples weretaken.
• Samples were taken for bacteria testing from the influent manure, separated liquids andseparated solids. Two samples were taken, at about 5,000 litres and 10,000 litres of manureseparated for the separated liquids and separated solids. One sample of influent manure wastested but was a composite sample of at least 3 sub-samples taken from the inflow at a similartime that the separated samples were taken. The samples were tested for E. coli and totalcoliform.
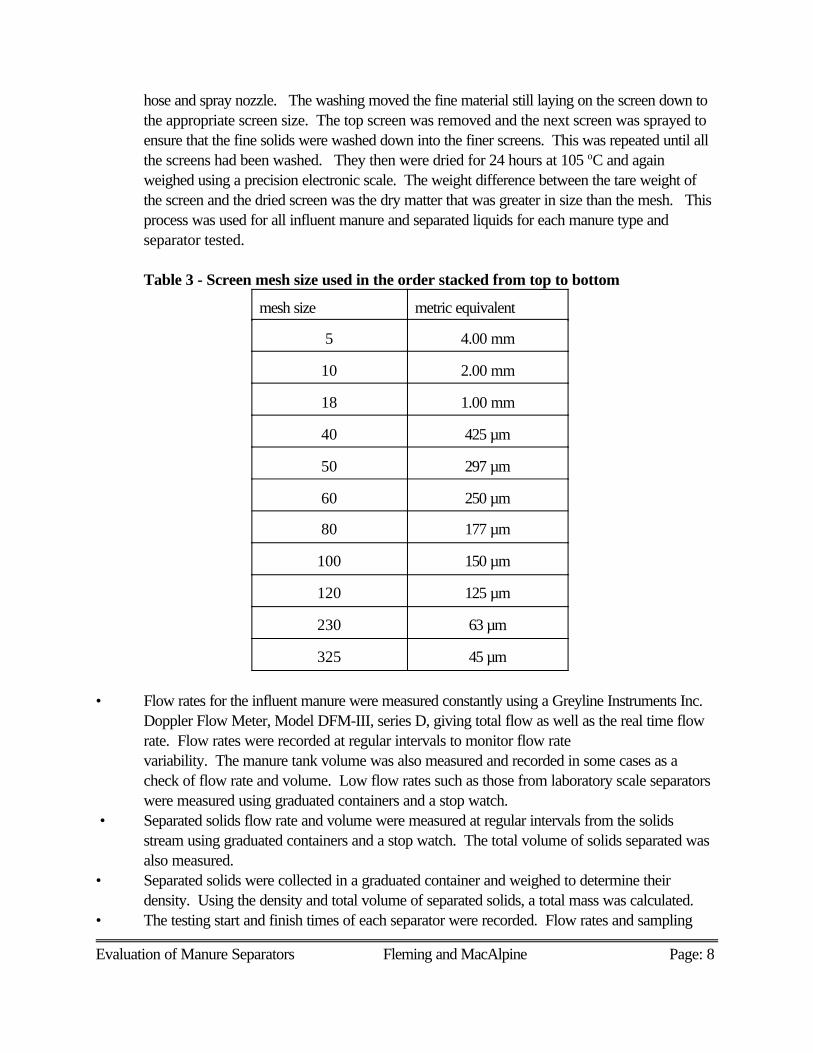
• Particle size distribution was measured using 11 precision weighed soil screens with a meshsizes ranging from 4.0 mm openings to 0.045 mm openings (U.S.A. standard #5 to #325screens) - listed in Table 3. The screens were stacked with the most coarse mesh size on topand the finest on the bottom. A 500 mL composite sample of liquid manure was then pouredonto the top screen of the stack and then lightly washed through by spraying tap water using a
Evaluation of Manure Separators Fleming and MacAlpine Page: 8
hose and spray nozzle. The washing moved the fine material still laying on the screen down tothe appropriate screen size. The top screen was removed and the next screen was sprayed toensure that the fine solids were washed down into the finer screens. This was repeated until allthe screens had been washed. They then were dried for 24 hours at 105 oC and againweighed using a precision electronic scale. The weight difference between the tare weight ofthe screen and the dried screen was the dry matter that was greater in size than the mesh. Thisprocess was used for all influent manure and separated liquids for each manure type andseparator tested.
Table 3 - Screen mesh size used in the order stacked from top to bottom
mesh size metric equivalent
5 4.00 mm
10 2.00 mm
18 1.00 mm
40 425 µm
50 297 µm
60 250 µm
80 177 µm
100 150 µm
120 125 µm
230 63 µm
325 45 µm
• Flow rates for the influent manure were measured constantly using a Greyline Instruments Inc.Doppler Flow Meter, Model DFM-III, series D, giving total flow as well as the real time flowrate. Flow rates were recorded at regular intervals to monitor flow ratevariability. The manure tank volume was also measured and recorded in some cases as acheck of flow rate and volume. Low flow rates such as those from laboratory scale separatorswere measured using graduated containers and a stop watch.
• Separated solids flow rate and volume were measured at regular intervals from the solidsstream using graduated containers and a stop watch. The total volume of solids separated wasalso measured.
• Separated solids were collected in a graduated container and weighed to determine theirdensity. Using the density and total volume of separated solids, a total mass was calculated.
• The testing start and finish times of each separator were recorded. Flow rates and sampling

Evaluation of Manure Separators Fleming and MacAlpine Page: 9
times were recorded. Comments on the operation of the separators throughout the test werealso recorded.
• Odour assessments were taken throughout the time of the testing. Odour ratings weresubjective and related the relative odour of the separated liquids and solids to the influentmanure being tested. Ratings were based on presence or absence of odour and odourcharacter.
c) Description of Mechanical Separators Tested The systems tested were separators from the region that were either developed to separate
livestock manure or had the potential to handle liquid livestock manure. They included a screw press, acombination inclined screen and screw press, a round vibrating screen, a two stage rectangular vibratingscreen and hydrocylones, a drum type screen and a membrane filter system (reverse osmosis).Following is a short description of each system:
i) Key Dollar Cab - model 100 (supplied by Verellen Optimized Energy) - This is a rotatingdrum separator. The machine evaluated was a prototype, originally developed for use in thefood processing industry. It was deemed to have potential to remove solids from liquidlivestock manures. It consists of a drum screen that rotates partly submerged in a tank of liquidmanure. All metal parts are stainless steel. Liquids migrate into the drum screen as it rotates andthe solids that accumulate on the outside of the screen are flushed out using a high pressurespray from inside the drum. A portion of the manure effluent (or clean water) is pressurizedusing a 0.38 kW jet pump producing 275 kilopascals pressure (40 psi). This is sprayed fromthe inside of the drum to keep the screen clean. Fine solids are collected in a trough anddrained to a holding tank. Some coarse solids settle in the tank in which the drum rotates, to beremoved later, though no system had been designed to remove these solids. A 0.38 kW electricmotor driving a reduction gear drive rotates the drum.
ii) Maximizer Separator (supplied by Ballagh Liquid Technologies Inc.) - This is acombination of an inclined screen with a rubber-paddled flighted conveyor plus a screw pressto further de-water the solids. The conveyor is 7.3 metres long, elevated at one end above theground to 4.72 metres with screens the full length of the conveyor. The conveyor screen holesizes may be changed, depending on the manure (e.g. 0.8, 1.6 or 3.2 mm round holes). Thescrew press has a 203 mm diameter auger and screen, with the screen 305 mm long having 1.6mm or 3.2 mm holes. A spring-loaded (adjustable) cantilevered door provides resistancepressure to squeeze out excess liquids. The separator metal parts are all stainless steelconstruction. This system is currently being used on farms.
iii) Surface to Surface, 280 Centre St., Petrolia, Ontario. This is a prototype manureseparator, comprised of a combination of a two-level vibrating screen and four hydrocyclones.Coarse solids are first removed by the lower screen and discharged off the end of the screen.Separated liquids are pumped from a tank below the coarse screen through four hydrocyclonesonto a fine screen for further separation. Liquids are then pumped to a storage tank. The system

Evaluation of Manure Separators Fleming and MacAlpine Page: 10
is powered by a diesel engine running a hydraulic pump that operates the hydrostatic drivesused on the separator. All metal parts are either stainless steel or painted steel.
iv) SEI Dewatering System (Manufactured by Sleegers Machine and Fabrication Inc.) -This is a screw press system. It has a design capacity of between 90 to 909 L/min. It isconstructed of carbon steel, weighing 426 kg. It is powered by a single phase, 5.6 kW, 220volt, 40 amp electric motor driving a reduction gear drive that turns the 26.0 cm diameter, 108cm long stainless steel auger with a 59 cm long flighting. The auger had single flighting for dairymanure and double flighting for liquid swine manure. Nylon brushes were mounted on theflighting to keep the screens clean. The auger rotated inside a 52 cm long stainless steel axialwire screen (slot size 1.0 mm for dairy manure and 0.25 mm for swine manure) that wasmounted inside the exterior housing. The auger was supported by a bearing on each end,allowing close tolerances with the screen. The opening for the solids discharge had a springloaded plug with a solids cutter, that mounted on the auger shaft and could be adjusted to givethe desired solids dry matter level. This system is currently being used on farms.
v) SWECO - LS18-53 (lab scale tester) - This is a round vibrating screen using two eccentricweights on an electric motor to produce a vibration that spirals coarse solids around the screenfrom the centre to the outside, where they are discharged. The coarse materials stay on top ofthe screen and fine solids and liquids fall through to the lower level to exit through a spout. Thesystem is self cleaning. Metal parts are all stainless steel construction. This system was designedto process a large range of products, including dry industrial material, sewage, vegetableprocessing waste, liquid wastes with coarse solids as well as liquid manure.
vi) VSEP - Series LP (New Logic, Emeryville, California) - This is a membrane filter, set upfor this test with reverse osmosis filters. The unit evaluated was a “lab” scale model (a largerunit has been operating on a swine farm in Korea). The Vibrating Shear Enhanced Process(VSEP) uses a vibrating stack of 18 reverse osmosis membranes, high pressure and a timed(open and closed) outlet valve to remove water from liquid manure. The stack of membraneswas vibrated using an electric motor with an eccentric weight, vibrating a heavy metal plate(seismic mass) transferring the motion up a tubular tuned torsion spring to the reverse osmosishead. The vibration creates a shear force that prevents fouling of the membranes with solids. Itis powered by two electric motors - a 1.1 kW electric motor for the vibration system and a2.25 kW electric motor for a diaphragm pump to pump the influent manure and pressurize thesystem to 3100 kilopascals (450 psi). Influent manure flowed from a 40 litre tank via a 38 mmdiameter plastic hose through an in-line 0.297 mm (50 mesh) screen to the pressure pump.Pressurized manure was pumped through a 12.7 mm braided steel, high pressure hose to thetop of the vibrating filter head. Clean water (permeate) exits the centre top of the filter head,through a clear 12.7 mm vinyl hose into a storage tank. Concentrate exits through the bottom ofthe filter head via a 12.7 mm metal tube, through pressure and flow control valves into anotherstorage tank. Concentrate passed through an automated valve that is opened and closeddepending on the setting of the timer (controlling the permeate recovery percentage - the longer
Evaluation of Manure Separators Fleming and MacAlpine Page: 11
it was closed the higher the recovery rate).
Test Results
a) Performance of Mechanical Separators - GeneralThe test procedure outlined earlier was followed as closely as possible for the testing of each of
the six separators. Test reports for each of the units evaluated are attached in the appendix of thisreport. Two of the separators (VSEP and Key Dollar Cab) required pre-screening of the manure toremove coarse solids.
As expected, the results of testing for the six units gave quite a range of results. Also, there wasa considerable difference in performance among the three manures tested. The following sections willexamine these differences in detail.
b) Separator CapacityThree of the manure separators tested were farm scale systems, the Maximizer, the Surface to
Surface separator and the SEI Dewatering System. The other three separators, the Key Dollar CabDrum, the SWECO screen and the VSEP (reverse osmosis) were laboratory scale systems. Separator capacities were quite variable and changed with the manure separated.
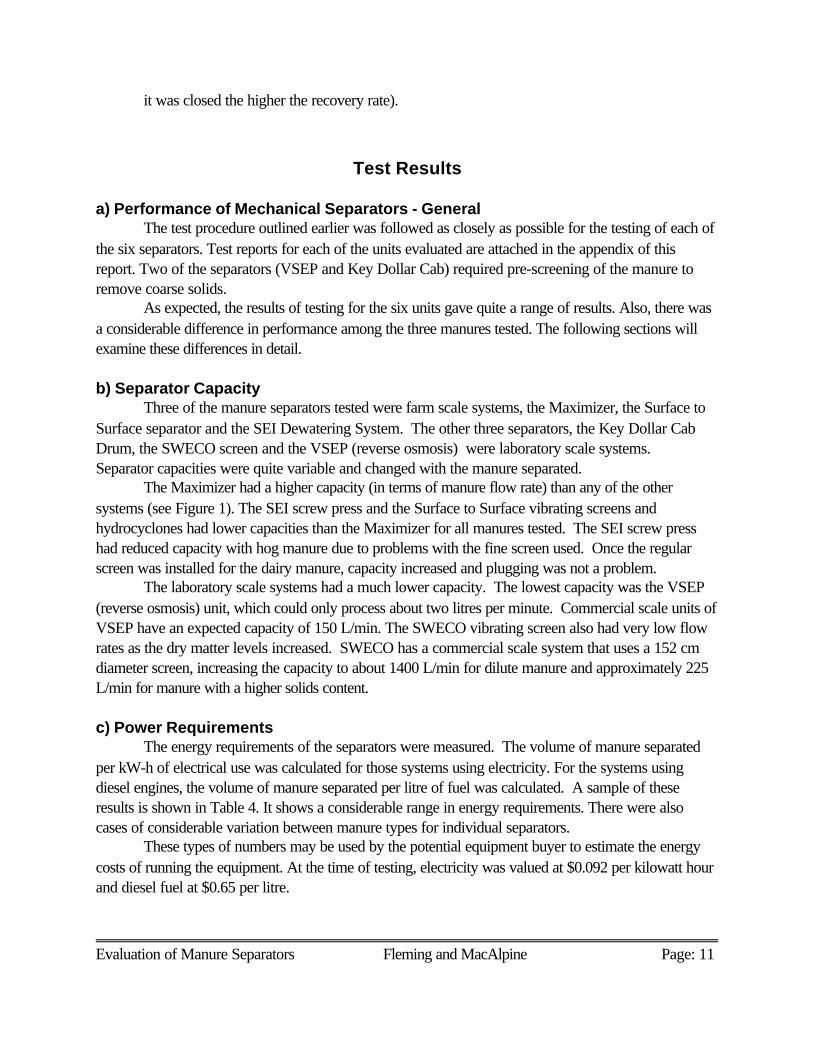
The Maximizer had a higher capacity (in terms of manure flow rate) than any of the othersystems (see Figure 1). The SEI screw press and the Surface to Surface vibrating screens andhydrocyclones had lower capacities than the Maximizer for all manures tested. The SEI screw presshad reduced capacity with hog manure due to problems with the fine screen used. Once the regularscreen was installed for the dairy manure, capacity increased and plugging was not a problem.
The laboratory scale systems had a much lower capacity. The lowest capacity was the VSEP(reverse osmosis) unit, which could only process about two litres per minute. Commercial scale units ofVSEP have an expected capacity of 150 L/min. The SWECO vibrating screen also had very low flowrates as the dry matter levels increased. SWECO has a commercial scale system that uses a 152 cmdiameter screen, increasing the capacity to about 1400 L/min for dilute manure and approximately 225L/min for manure with a higher solids content.
c) Power Requirements The energy requirements of the separators were measured. The volume of manure separated
per kW-h of electrical use was calculated for those systems using electricity. For the systems usingdiesel engines, the volume of manure separated per litre of fuel was calculated. A sample of theseresults is shown in Table 4. It shows a considerable range in energy requirements. There were alsocases of considerable variation between manure types for individual separators.
These types of numbers may be used by the potential equipment buyer to estimate the energycosts of running the equipment. At the time of testing, electricity was valued at $0.092 per kilowatt hourand diesel fuel at $0.65 per litre.
Evaluation of Manure Separators Fleming and MacAlpine Page: 12
0
100
200
300
400
500
600
Flow
rate
(L/m
in)
Key Dollar Maximizer S to S SEI SWECO VSEPSeparator
Manure 1 Manure 2 Manure 3
Figure 1 Manure flow rates for the 6 separators and the 3 manure types tested
Table 4 - Energy requirements for each separator for the dairy manure testSeparator Manure volume separated
per kW-h electricity (L)Manure volume separatedper L fuel (L)
Key Dollar 4342Maximizer 10535S to S 1226SEI 4800SWECO 3030VSEP 94
* The Key Dollar and the VSEP needed pre-screening of manure - the energy associated with this stepis not included in the above table
d) Particle Size DistributionAll influent manure and separated liquids were screened to develop a particle size distribution
profile. The rationale was that the larger the manure particles, the easier it would be to remove themfrom the manure. If a manure was comprised mainly of very tiny particles, the separator would not beas effective at removing solids (at least certain types of separators). In fact, most of the separatorstested relied on screening as part of the process.
Eleven screens were used to profile the particle size distribution. The process proved to belabour-intensive. Only two samples of each manure were tested - one influent sample and one effluent(separated liquids) sample. Figure 2 shows the kind of comparison that was possible between influent

Evaluation of Manure Separators Fleming and MacAlpine Page: 13
0
0.5
1
1.5
2
Sol
ids
(g)
5 10 18 40 50 60 80 100 120 230 325Screen Mesh Size
Influent Effluent
Figure 2 Particle size distribution for SEI (screw press) separator andManure 2 (swine manure)
and effluent particle sizes. It demonstrates that the coarse solids (i.e. those trapped by the 5 and 10mesh screens), were removed by the separator and the remaining solids passed through the machineuntouched. Unfortunately, not all graphs showed as clear a trend as this. There was a great deal ofvariability in the numbers. This suggested that either: there were too many screens used, or there weretoo few manure samples tested, or the test itself was difficult to carry out in a consistent manner. Ofcourse, there could have been a combination of these factors.
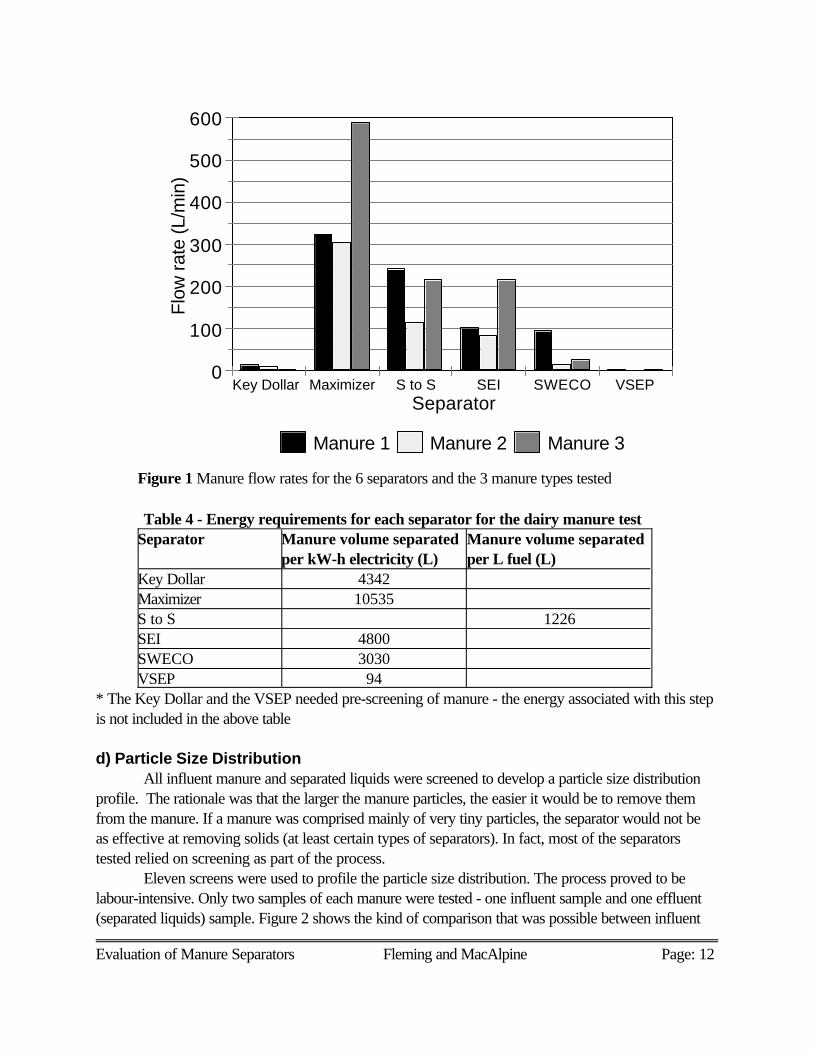
The reasonable approach seemed to be to simplify the test by using only four representativescreen sizes, and to ensure that in future tests, two or three samples of influent and effluent aremeasured, instead if one. Figure 3 shows the distribution graph for the Maximizer separator, for thedairy manure test. It summarizes the data so that there are only four screen sizes, making the grapheasier to interpret, especially in those cases where the numbers are more variable. Once again, it showsthat the removal of solids was in the larger particles (i.e. those trapped by a 50 mesh, or larger, screen).
It appeared that some of the “screen” separators removed particles smaller than their screensize due to a smearing of the manure over the screen holes (thus reducing their size). The Maximizerseparator was designed to take advantage of this to improve the effectiveness of the separation. Rubber paddles smear the manure over the holes but also act as a squeegee to force liquids through theholes.
Evaluation of Manure Separators Fleming and MacAlpine Page: 14
0
0.5
1
1.5
2
2.5
Mas
s (g
)
to 10 mesh 10 to 50 50 to 100 100 to 325Screen Mesh Size
Influent Effluent
Figure 3 Particle size distribution for the Maximizer separatorand dairy manure
e) Removal of SolidsSeveral methods have been used to express the efficiency of separators in removing solids from
the influent manure. The calculation that appears to serve the greatest variety of design needs is asfollows:
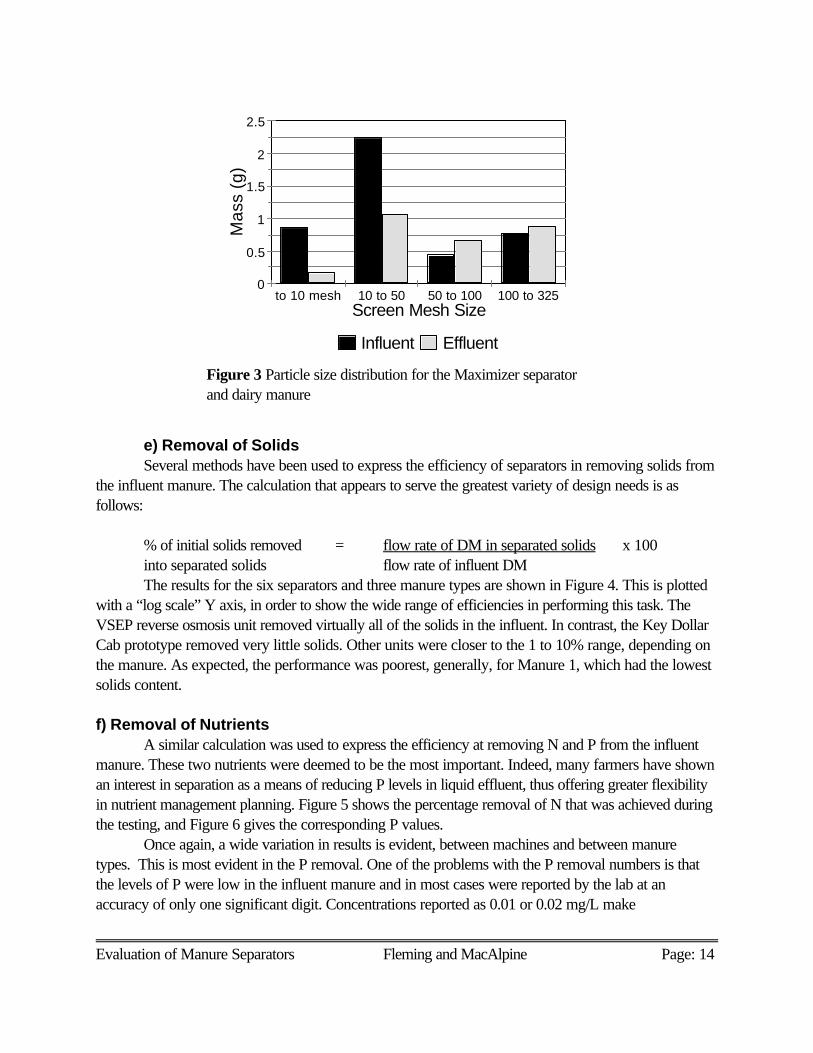
% of initial solids removed = flow rate of DM in separated solids x 100into separated solids flow rate of influent DMThe results for the six separators and three manure types are shown in Figure 4. This is plotted
with a “log scale” Y axis, in order to show the wide range of efficiencies in performing this task. TheVSEP reverse osmosis unit removed virtually all of the solids in the influent. In contrast, the Key DollarCab prototype removed very little solids. Other units were closer to the 1 to 10% range, depending onthe manure. As expected, the performance was poorest, generally, for Manure 1, which had the lowestsolids content.
f) Removal of NutrientsA similar calculation was used to express the efficiency at removing N and P from the influent
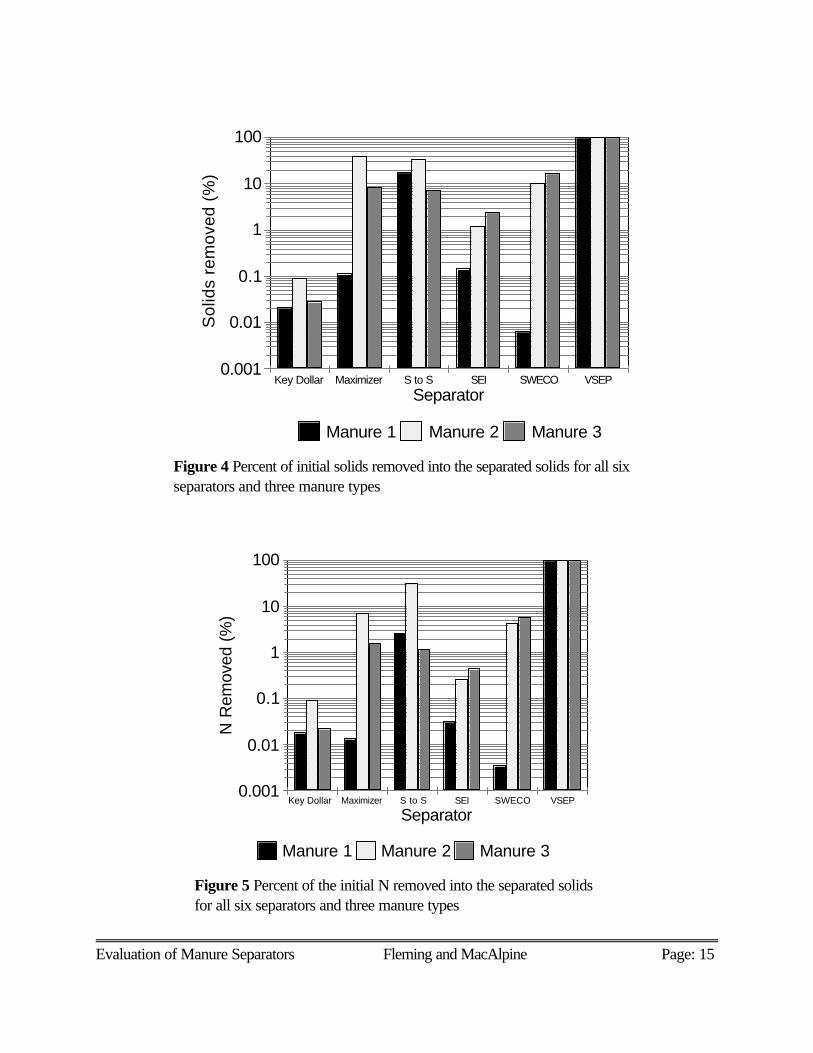
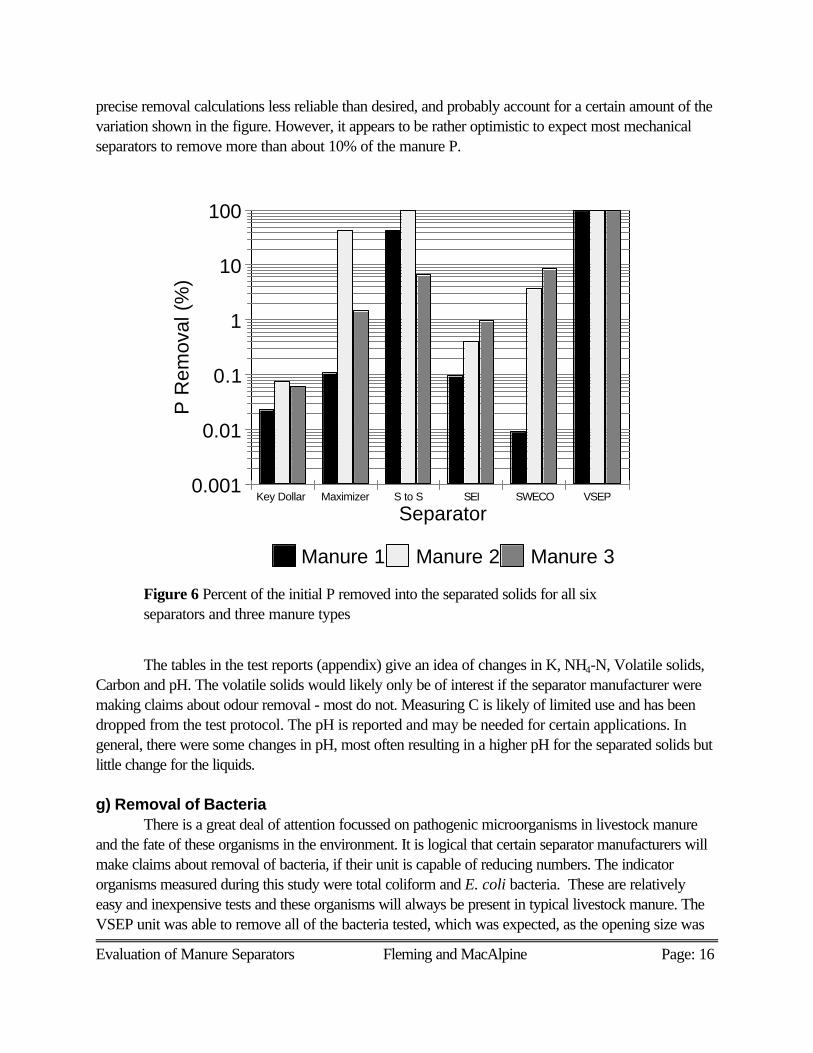
manure. These two nutrients were deemed to be the most important. Indeed, many farmers have shownan interest in separation as a means of reducing P levels in liquid effluent, thus offering greater flexibilityin nutrient management planning. Figure 5 shows the percentage removal of N that was achieved duringthe testing, and Figure 6 gives the corresponding P values.
Once again, a wide variation in results is evident, between machines and between manuretypes. This is most evident in the P removal. One of the problems with the P removal numbers is thatthe levels of P were low in the influent manure and in most cases were reported by the lab at anaccuracy of only one significant digit. Concentrations reported as 0.01 or 0.02 mg/L make
Evaluation of Manure Separators Fleming and MacAlpine Page: 15
0.001
0.01
0.1
1
10
100
Sol
ids
rem
oved
(%
)
Key Dollar Maximizer S to S SEI SWECO VSEPSeparator
Manure 1 Manure 2 Manure 3
Figure 4 Percent of initial solids removed into the separated solids for all sixseparators and three manure types
0.001
0.01
0.1
1
10
100
N R
emov
ed (
%)
Key Dollar Maximizer S to S SEI SWECO VSEP
Separator
Manure 1 Manure 2 Manure 3
Figure 5 Percent of the initial N removed into the separated solidsfor all six separators and three manure types
Evaluation of Manure Separators Fleming and MacAlpine Page: 16
0.001
0.01
0.1
1
10
100P
Rem
oval
(%
)
Key Dollar Maximizer S to S SEI SWECO VSEP
Separator
Manure 1 Manure 2 Manure 3
Figure 6 Percent of the initial P removed into the separated solids for all sixseparators and three manure types
precise removal calculations less reliable than desired, and probably account for a certain amount of thevariation shown in the figure. However, it appears to be rather optimistic to expect most mechanicalseparators to remove more than about 10% of the manure P.
The tables in the test reports (appendix) give an idea of changes in K, NH4-N, Volatile solids,Carbon and pH. The volatile solids would likely only be of interest if the separator manufacturer weremaking claims about odour removal - most do not. Measuring C is likely of limited use and has beendropped from the test protocol. The pH is reported and may be needed for certain applications. Ingeneral, there were some changes in pH, most often resulting in a higher pH for the separated solids butlittle change for the liquids.
g) Removal of BacteriaThere is a great deal of attention focussed on pathogenic microorganisms in livestock manure
and the fate of these organisms in the environment. It is logical that certain separator manufacturers willmake claims about removal of bacteria, if their unit is capable of reducing numbers. The indicatororganisms measured during this study were total coliform and E. coli bacteria. These are relativelyeasy and inexpensive tests and these organisms will always be present in typical livestock manure. TheVSEP unit was able to remove all of the bacteria tested, which was expected, as the opening size was
Evaluation of Manure Separators Fleming and MacAlpine Page: 17
smaller than the size of organisms. None of the other separators showed any consistent removal ofsignificant amounts of bacteria into the separated solids. In other words, the units were not effective atsignificantly reducing bacteria levels in the separated liquids. Tables containing bacteria values areincluded in the appended test reports.
h) Labour RequirementsPart of the test protocol involved recording the labour needed to run the test and projecting the
labour needs to operate the unit on a farm. Most of the systems tested required at least one operator torun them properly. All systems tested have the ability to be run fully automated, thus reducing labourneeds. The Maximizer, for example, required one operator during the testing. However, with the use ofa system of floats and switches and a simple logic board it became fully automatic, requiring onlyperiodic maintenance visits when placed on a farm. The more simple the separator design, the easier itwould be to automate. The VSEP was the most complicated unit to set up and operate, requiringregular cleaning of the filter pack and prefilter. It also required more operator monitoring duringseparation to ensure it was running as desired.
Maintenance for all of the tested separators would be minimal. Examples of the types ofmaintenance needed:• The SEI screw press requires periodic greasing of two fittings and occasional servicing to
check on the screen, solids plug, auger, electric motor and drive system. . • The Maximizer has no grease fittings that require regular greasing but the seals between the
holding tank at the base of the inclined screen and flighted conveyor system and the separatedliquids tank must be checked for leaks, the conveyor paddles and screens for wear, the screwpress for proper operation and plugging and check the electric motors.
• The SWECO screen has no parts to lubricate but may require periodic servicing to check onthe screen, screen cleaners, bearings, springs and the electric motor that produces the vibration.
• For the Surface to Surface separator, the operator would have to check on the diesel motor forfuel, oil, coolant belts and proper operation, as well as monitor the hydraulic system includingoil levels, pumps, hoses and motors. The separator has screens, manure pumps and hydrocyclones to monitor occasionally.
• The Key Dollar Cab Drum separator would require monitoring of the electric drive motor, thedrive chain, reduction gear transmission, and the pressure pump and system. A system wouldalso be required to pre-screen the manure and also to remove any solids that precipitate fromthe influent manure in the tank.
• The VSEP requires the greatest amount of regular maintenance. The manure must be pre-screened to remove coarse solids so there would be another system to monitor, as well as theVSEP. The pre-filtration system must be monitored to detect plugging. The pressure system(pump, high pressure hoses, flow and pressure control valves) must be regularly checked. Thevibration system, the motor, seismic mass, tuned torsion spring, and filter pack require regularmonitoring. The filter pack bolts and nuts must be torqued regularly. The electronic controlsmust be adjusted as needed to the required settings and the filter pack must be flushed withfresh water, an acid wash, a fresh water flush, a caustic wash and a fresh water flush after about
Evaluation of Manure Separators Fleming and MacAlpine Page: 18
48 hours of operation or when flow starts declining. The commercial systems are fullyautomated, removing the need for most of this maintenance. For all of these systems the operator would also have to monitor the operation of pumps
delivering manure to the separators. The separated liquids would likely flow by gravity to storage.Otherwise, this pumping system would also require monitoring.
i) Odour LevelsSome separators are marketed with claims that they can reduce odours in the liquid effluent
(perhaps also the separated solids). During the testing, odour assessment were made for the effluentand separated solids. These were compared to odour levels in the influent manure. The ratings werevery subjective, not using any instruments to measure the concentration of odours, but simply using thehuman nose to evaluate relative levels of odour and how offensive the odours were. A more formal testprocedure should be used in cases where odour control is a primary concern.
The separation process appeared to have at least some impact on odours from the separatedliquids and solids. In all cases except for the VSEP, odours from the separated liquids were similar tothose from the influent manure (i.e. based on odour, this liquid could not be distinguished from influentmanure). The VSEP unit removed most of the odours leaving only a slight ammonia and sulphur smell inthe effluent. The odours were not detectable after a few hours of exposure to the air.
The odours from the separated solids were reduced in certain cases. The level of odourreduction seemed to be dependant on the amount of moisture still in the separated solids, so theseparators most effective in drying the solids had the greatest impact on odours. The concentrations ofvolatile solids were measured, with the expectation that these numbers would be a predictor of odoursuppression. This did not seem to be as good an indicator, however, as the dry matter content ofseparated solids. The most effective in this regard were the Surface to Surface, the SEI and theMaximizer systems. The other separators did not appreciably reduce odours in the separated solids.
j) Economics of Manure SeparationThere are a number of issues to look at when determining the relative economics and costs of
manure separation. There is an initial capital investment to purchase and set up each of the separators.There are operating costs which are influenced by the separator’s capacity, energy use, maintenance,reliability, labour and availability of parts and service. Other factors are the economics associated withpossible reduced environmental risks, changes in manure volumes, potential for creation of value-addedproducts, relative ease of meeting Nutrient Management targets (mandated in Ontario and elsewhere).
Estimated capital costs of the separators evaluated were:• SWECO vibrating screen (152 cm diameter) $21,498.00• SEI Dewatering System screw press $26,900.00• Key Dollar Cab Inc. rotating drum screen $30,000.00 to $40,000.00• Maximizer screen + flighted conveyor + screw press $53,037.00• Surface to Surface vibrating screen + hydro cyclones $100,000.00 • VSEP reverse osmosis (farm scale system) $409,000.00
Most of the separators would need a shelter to protect them from the environment andfreezing. All systems except the SEI screw press should be in a heated shelter (assuming winter
Evaluation of Manure Separators Fleming and MacAlpine Page: 19
operation). All separators are prone to corrosion, though some have gone to greater lengths to reducethis. All separators using screens are subject to mineral deposits on the screens over time. Regularcleaning will be needed. Separators that are run seasonally will require a proper shut down betweenoperations and a proper startup to prevent equipment from seizing up, rust from developing on partsand mechanical equipment from failing.
Summary and Conclusions
A study was conducted during the summer and fall of 2002 to develop a standard test formechanical liquid manure separators. Part of the study involved using the test to investigate theeffectiveness of six mechanical manure separators. All separators were tested using three manure types,a low dry matter liquid hog manure, a medium dry matter liquid hog manure and liquid dairy manure. The liquid manures had similar characteristic for each type tested. Of the separators tested, three werepresently being used commercially on farms. The other three systems, although used for othercommercial applications, had not been designed for manure separation and could thus be calledprototypes. Standard reporting forms were developed to summarize the performance of the separators.Highlights of the study:
• The results for the six units gave quite a range of results. Also, there was a considerabledifference in performance depending on which of the three manures was being tested.
• The Maximizer had the highest capacity of the models tested, with a range of 306 to 590 L/min.
• There was a considerable range of values in the volume of manure separated per kW-h ofelectricity, from 94 L for the VSEP to 10,535 L for the Maximizer. The Surface to Surface wasdiesel powered, with an efficiency of 1226 L of manure per L of fuel.
• The particle size distribution in the manure and the separated liquids can give valuableinformation needed to properly design a system. The use of four screens should give theinformation needed - examples of sizes: 10 mesh, 50 mesh, 100 mesh and 325 mesh (i.e. 2.0,0.30, 0.15 and 0.045 mm hole sizes).
• More than one sample should be tested to establish the particle size distribution, to reduce thevariability of results.
• Most separators were effective at removing coarse manure particles i.e. those trapped by a 50mesh, or larger, screen.
• There was a wide range of values for the quantity: Percent initial solids removed into the

Evaluation of Manure Separators Fleming and MacAlpine Page: 20
separated solids - ranging from < 0.1% to 100%. The high value was for the VSEP, where theseparated solids are still in a slurry form. The Maximizer and Surface to Surface achieved highsof 38% and 34%, respectively.
• Removal of solids was very poor for Manure 1 (DM in range 0.34 to 0.84%) for four of the sixseparators.
• The removal of N into the separated solids followed the same pattern as removal of solids.
• The removal of P into the solids portion was similar, although there was less confidence in thevalues, since most concentrations were reported by the lab at only one significant digit.
• The VSEP unit removed all total coliform and E. coli bacteria. Other systems did not have asignificant impact on bacteria numbers.
• Labour needs to operate the six systems varied, but most systems have the ability to be fullyautomated for on-farm use.
• Odours from the separated liquids were similar to liquid manure in most separators tested. Theonly exceptions were the separated liquids from the VSEP separator, which were essentiallyodour free.
• Odours from the separated solids appeared to be dependant on the moisture level of the solidsafter separation. The separators most effective in drying the solids were also the most effectivein reducing or removing odours. This included the Surface to Surface, the SEI and theMaximizer systems.
Acknowledgements
The authors would like to acknowledge the support for this project from Ontario Pork. Theproject also relied on the generous donation of the separators tested by the suppliers noted .
1. SEI Dewatering System screw press manufactured and supplied by Sleegers Machine andFabrication Inc., London, Ontario
2. The Maximizer, a combination inclined screen with a flighted conveyor and a screw press,supplied by Ballagh Liquid Technologies, Wingham, Ontario
3. SWECO vibrating screen supplied by Canada Process Equipment, Mississauga Ontario 4. Surface to Surface combination vibrating screen and hydro cyclone system, manufactured and
supplied by Surface to Surface Inc., Watford, Ontario5. Key Dollar Cab Inc. rotating drum screen, supplied by Verellen Optimized Energy Inc.,
Shedden, Ontario
Evaluation of Manure Separators Fleming and MacAlpine Page: 21
6. VSEP reverse osmosis system manufactured by New Logic and supplied by RondeauAnaerobics, Ridgetown, Ontario
References
Ford, M. and Fleming, R. 2002. Mechanical Solid-Liquid Separation of Livestock Manure - LiteratureReview. Report to Ontario Pork. Ridgetown College, University of Guelph. 49 pages +appendix
Appendix
Attachments include:
a) Mechanical Solid-Liquid Separation of Livestock Manure - Test Procedure -October 2002
b) Test Report - Key Dollar Cab
c) Test Report - Maximizer
d) Test Report - Surface to Surface
e) Test Report - SEI
f) Test Report - SWECO
g) Test Report - VSEP
Mechanical Solid-Liquid Separation of Livestock Manure- Test Procedure -
October 2002
General:• Test at least three different manures - representing a range of dry matter contents and livestock
types (reflecting the target livestock groups)• Test at least 20,000 L of each manure
Prior to separation:• Characterise the influent manure:
• consider the length of time the manure was stored before separation• consider how fine the grain in the feed has been ground
• List the energy requirements of the separator and the energy requirements of any additionalimplements necessary for the operation of the separator (e.g. lift pumps, etc.)
• Record the model, manufacturer and selling price for the separator• Record dimensions of components of the separator (e.g. overall screen size (length, width), size
of screen pore openings, screen angle of incline, centrifuge upper and lower diameters)• Provide operational parameters of the separator (e.g. frequency of vibration of screen) • Conduct a particle size distribution analysis of the influent manure to determine the profile of
solid particles in the unscreened manure - using the following screen openings: 2.0, 0.30, 0.15and 0.045 mm (i.e. 10, 50, 100 and 325 mesh)
• Measure the rate of energy consumption• for systems powered by electricity, use a power meter and record the initial and final
reading of this meter to determine the kWh of energy consumption• for diesel powered systems, calculate the volume of diesel fuel used during testing
• Agitate (stir) the tank containing the influent manure to re-suspend any settled solids• A sample is needed of influent manure - it may be easier to collect this prior to starting the
separator, although it is preferable to collect this during the test. Take a composite sample(consisting of 3 representative samples) of the influent manure to measure the following:• the solids content (DM), pH, and concentrations of N, P, K, NH4-N and volatile
solids (optional - measure if there are claims about odour control) a second single sample will be taken for the following:• bacteria analysis: E. coli and total coliform
During separation:• Record the time at the start of testing. Record the time and volume separated at several times
during the test (as a check on the more detailed flow rate monitoring). • In addition, measure and record the flow rate of influent manure in one of two ways:
• with a doppler flow sensor for the duration of the test period - flow rates will berecorded as frequently as every minute and the total flow can be measured as often asevery five minutes
• measure the volume of influent manure over a one minute time period - flow rates
measured in this way should be taken from three to five times during the testing period(note: this method of flow rate measurement will only be used when it is not possible toset up the doppler flow sensor)
• Measure the flow rate of the separated solids three to five times, once the separator has beenoperating for a sufficient time period (disregard the initial and final 20% of the manure volume).Use a graduated bucket and record the volume accumulated in one minute. Also record thetime at which these flow rates were taken. Note: Theoretically, these values could becalculated, but this step provides a very good check on the earlier measurements.
• Take samples of the separated solids. The time at which these samples were taken should berecorded. No sampling will be taken during the initial and final 20% of manure volume.• three samples of the separated solids will be taken for analysis of N, P, K, NH4-N,
DM, and pH• two samples will be taken for bacteria analysis: total coliform and E.coli
• Take samples of the separated liquid. Record the time at which these samples were taken. Nosampling will be taken during the initial and final 20% of manure volume. • three samples will be taken for analysis of N, P, K, NH4-N, DM, and pH• two samples will be taken for bacteria analysis including, total coliform and E. coli• do a particle size distribution on this liquid, similar to that done for the influent
• The following should be monitored throughout the testing period:• labour/maintenance requirements - this should be considered in both a qualitative and
quantitative sense - e.g., what type of maintenance management is required and theapproximate length of time required to adequately complete these maintenance tasks(the amount of labour required by one person per unit volume of manure can then bedetermined)
• Record the time the testing was completed and the total volume of influent manure processed
Varying parameters during separation:If parameters on the separator can be varied (such as flow rate and screen opening), more than one testwill be needed (e.g. a vibrating screen may be run in the first test with a 40 mesh screen and in thesecond test this screen will be replaced by 60 mesh screen).
Additional Analysis of the Liquid and Solid Streams• make qualitative odour observations of the odour levels of effluent and separated solids (relative
to the influent manure)• determine the volume and mass of the separated solids
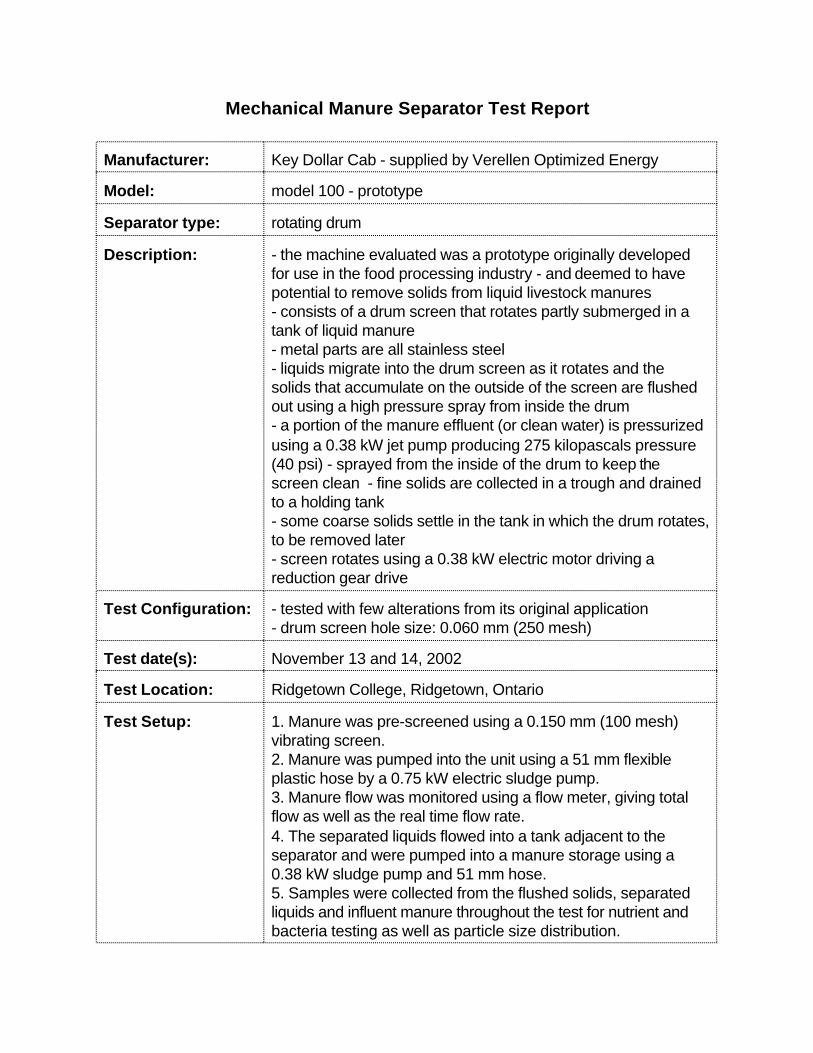
Mechanical Manure Separator Test Report
Manufacturer: Key Dollar Cab - supplied by Verellen Optimized Energy
Model: model 100 - prototype
Separator type: rotating drum
Description: - the machine evaluated was a prototype originally developedfor use in the food processing industry - and deemed to havepotential to remove solids from liquid livestock manures - consists of a drum screen that rotates partly submerged in atank of liquid manure - metal parts are all stainless steel - liquids migrate into the drum screen as it rotates and thesolids that accumulate on the outside of the screen are flushedout using a high pressure spray from inside the drum- a portion of the manure effluent (or clean water) is pressurizedusing a 0.38 kW jet pump producing 275 kilopascals pressure(40 psi) - sprayed from the inside of the drum to keep thescreen clean - fine solids are collected in a trough and drainedto a holding tank - some coarse solids settle in the tank in which the drum rotates,to be removed later - screen rotates using a 0.38 kW electric motor driving areduction gear drive
Test Configuration: - tested with few alterations from its original application- drum screen hole size: 0.060 mm (250 mesh)
Test date(s): November 13 and 14, 2002
Test Location: Ridgetown College, Ridgetown, Ontario
Test Setup: 1. Manure was pre-screened using a 0.150 mm (100 mesh)vibrating screen.2. Manure was pumped into the unit using a 51 mm flexibleplastic hose by a 0.75 kW electric sludge pump. 3. Manure flow was monitored using a flow meter, giving totalflow as well as the real time flow rate. 4. The separated liquids flowed into a tank adjacent to theseparator and were pumped into a manure storage using a0.38 kW sludge pump and 51 mm hose.5. Samples were collected from the flushed solids, separatedliquids and influent manure throughout the test for nutrient andbacteria testing as well as particle size distribution.
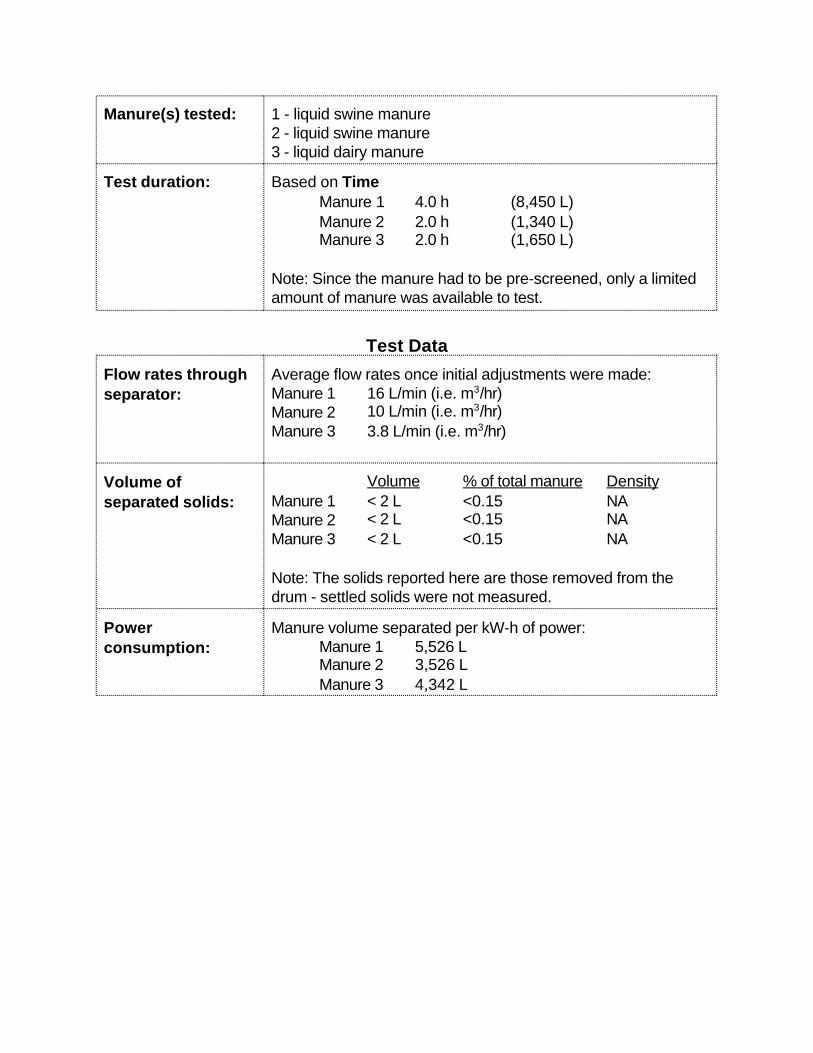
Manure(s) tested: 1 - liquid swine manure 2 - liquid swine manure3 - liquid dairy manure
Test duration: Based on TimeManure 1 4.0 h (8,450 L)Manure 2 2.0 h (1,340 L)Manure 3 2.0 h (1,650 L)
Note: Since the manure had to be pre-screened, only a limitedamount of manure was available to test.
Test Data
Flow rates throughseparator:
Average flow rates once initial adjustments were made:Manure 1 16 L/min (i.e. m3/hr)Manure 2 10 L/min (i.e. m3/hr)Manure 3 3.8 L/min (i.e. m3/hr)
Volume ofseparated solids:
Volume % of total manure DensityManure 1 < 2 L <0.15 NAManure 2 < 2 L <0.15 NAManure 3 < 2 L <0.15 NA
Note: The solids reported here are those removed from thedrum - settled solids were not measured.
Powerconsumption:
Manure volume separated per kW-h of power:Manure 1 5,526 LManure 2 3,526 L Manure 3 4,342 L
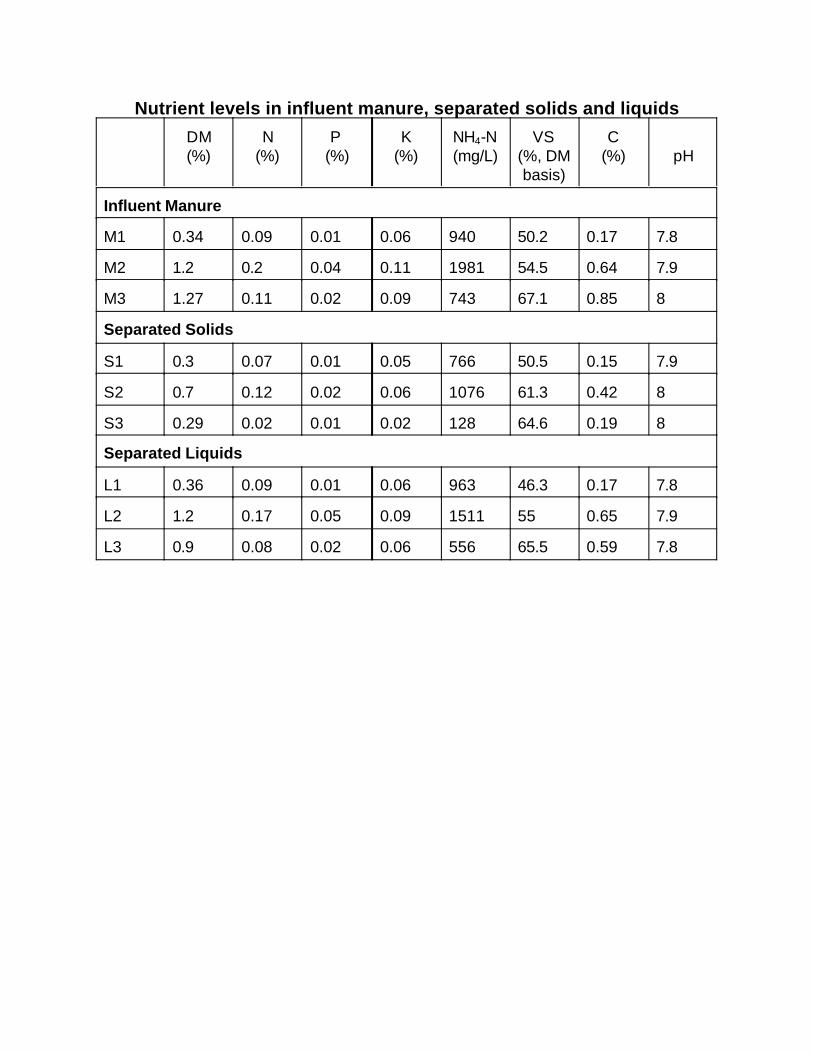
Nutrient levels in influent manure, separated solids and liquids
DM(%)
N(%)
P (%)
K(%)
NH4-N(mg/L)
VS(%, DMbasis)
C(%) pH
Influent Manure
M1 0.34 0.09 0.01 0.06 940 50.2 0.17 7.8
M2 1.2 0.2 0.04 0.11 1981 54.5 0.64 7.9
M3 1.27 0.11 0.02 0.09 743 67.1 0.85 8
Separated Solids
S1 0.3 0.07 0.01 0.05 766 50.5 0.15 7.9
S2 0.7 0.12 0.02 0.06 1076 61.3 0.42 8
S3 0.29 0.02 0.01 0.02 128 64.6 0.19 8
Separated Liquids
L1 0.36 0.09 0.01 0.06 963 46.3 0.17 7.8
L2 1.2 0.17 0.05 0.09 1511 55 0.65 7.9
L3 0.9 0.08 0.02 0.06 556 65.5 0.59 7.8
0
0.10.20.30.40.50.60.7
Mas
s (g
)
to 10 mesh 10 to 50 50 to 100 100 to 325Screen Mesh Size
Influent Effluent
Manure 1
0
0.10.2
0.3
0.4
0.50.6
0.7
Mas
s (g
)
to 10 mesh 10 to 50 50 to 100 100 to 325Screen Mesh Size
Influent Effluent
Manure 2
0
0.2
0.4
0.6
0.8
1
1.2
Mas
s (g
)
to 10 mesh 10 to 50 50 to 100 100 to 325Screen Mesh Size
Influent Effluent
Manure 3
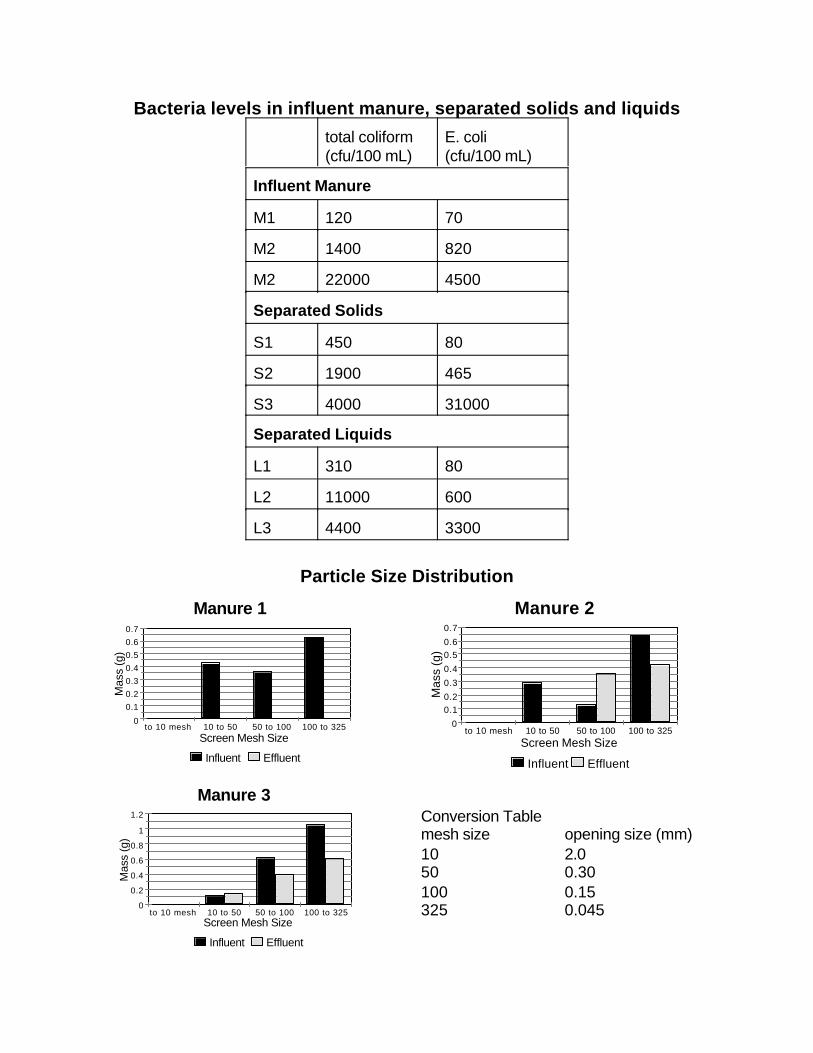
Bacteria levels in influent manure, separated solids and liquids
total coliform(cfu/100 mL)
E. coli(cfu/100 mL)
Influent Manure
M1 120 70
M2 1400 820
M2 22000 4500
Separated Solids
S1 450 80
S2 1900 465
S3 4000 31000
Separated Liquids
L1 310 80
L2 11000 600
L3 4400 3300
Particle Size Distribution
Conversion Tablemesh size opening size (mm)10 2.050 0.30100 0.15325 0.045
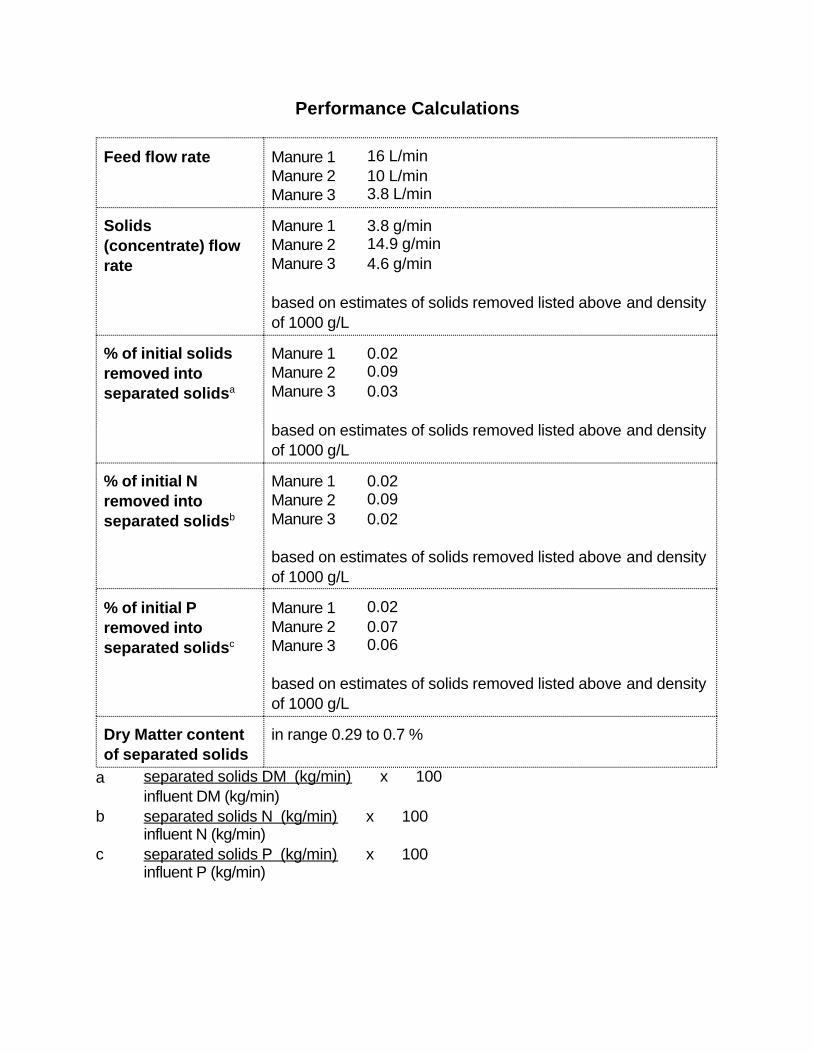
Performance Calculations
Feed flow rate Manure 1 16 L/minManure 2 10 L/minManure 3 3.8 L/min
Solids(concentrate) flowrate
Manure 1 3.8 g/minManure 2 14.9 g/minManure 3 4.6 g/min
based on estimates of solids removed listed above and densityof 1000 g/L
% of initial solidsremoved intoseparated solidsa
Manure 1 0.02Manure 2 0.09Manure 3 0.03
based on estimates of solids removed listed above and densityof 1000 g/L
% of initial Nremoved intoseparated solidsb
Manure 1 0.02Manure 2 0.09Manure 3 0.02
based on estimates of solids removed listed above and densityof 1000 g/L
% of initial Premoved intoseparated solidsc
Manure 1 0.02Manure 2 0.07Manure 3 0.06
based on estimates of solids removed listed above and densityof 1000 g/L
Dry Matter contentof separated solids
in range 0.29 to 0.7 %
a separated solids DM (kg/min) x 100influent DM (kg/min)
b separated solids N (kg/min) x 100influent N (kg/min)
c separated solids P (kg/min) x 100influent P (kg/min)
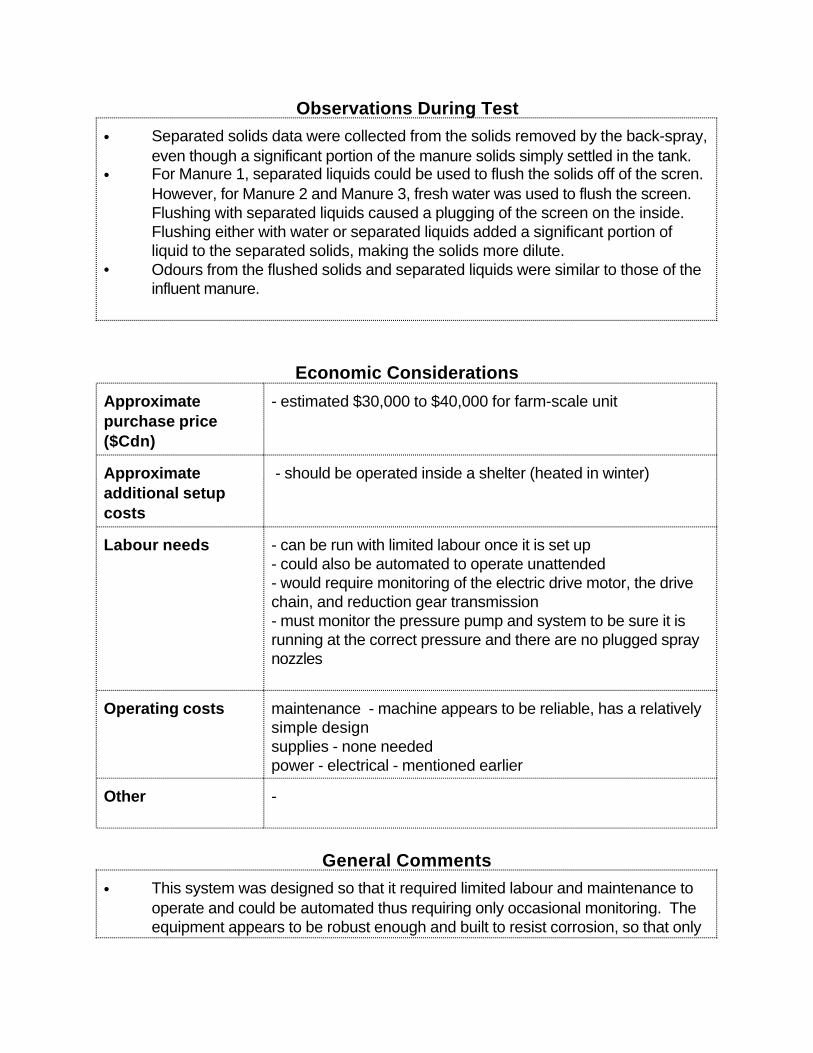
Observations During Test
• Separated solids data were collected from the solids removed by the back-spray,even though a significant portion of the manure solids simply settled in the tank.
• For Manure 1, separated liquids could be used to flush the solids off of the scren.However, for Manure 2 and Manure 3, fresh water was used to flush the screen.Flushing with separated liquids caused a plugging of the screen on the inside.Flushing either with water or separated liquids added a significant portion ofliquid to the separated solids, making the solids more dilute.
• Odours from the flushed solids and separated liquids were similar to those of theinfluent manure.
Economic Considerations
Approximatepurchase price($Cdn)
- estimated $30,000 to $40,000 for farm-scale unit
Approximateadditional setupcosts
- should be operated inside a shelter (heated in winter)
Labour needs - can be run with limited labour once it is set up- could also be automated to operate unattended- would require monitoring of the electric drive motor, the drivechain, and reduction gear transmission- must monitor the pressure pump and system to be sure it isrunning at the correct pressure and there are no plugged spraynozzles
Operating costs maintenance - machine appears to be reliable, has a relativelysimple designsupplies - none neededpower - electrical - mentioned earlier
Other -
General Comments
• This system was designed so that it required limited labour and maintenance tooperate and could be automated thus requiring only occasional monitoring. Theequipment appears to be robust enough and built to resist corrosion, so that only
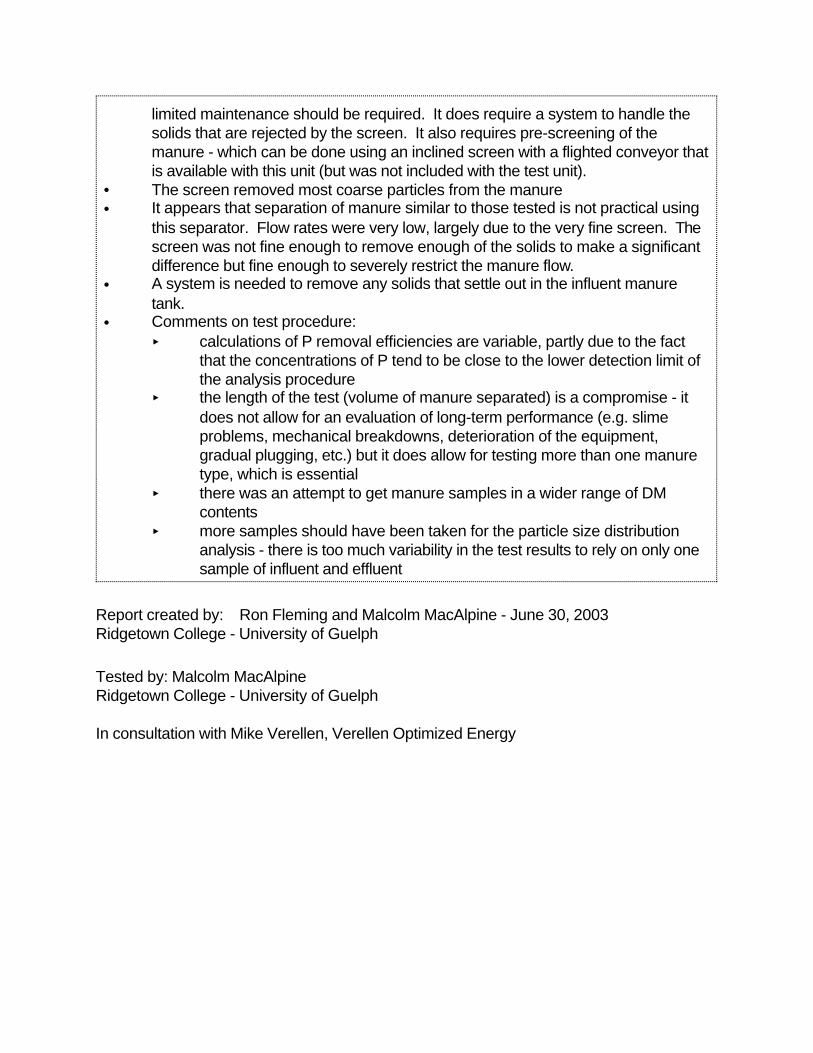
limited maintenance should be required. It does require a system to handle thesolids that are rejected by the screen. It also requires pre-screening of themanure - which can be done using an inclined screen with a flighted conveyor thatis available with this unit (but was not included with the test unit).
• The screen removed most coarse particles from the manure • It appears that separation of manure similar to those tested is not practical using
this separator. Flow rates were very low, largely due to the very fine screen. Thescreen was not fine enough to remove enough of the solids to make a significantdifference but fine enough to severely restrict the manure flow.
• A system is needed to remove any solids that settle out in the influent manuretank.
• Comments on test procedure: < calculations of P removal efficiencies are variable, partly due to the fact
that the concentrations of P tend to be close to the lower detection limit ofthe analysis procedure
< the length of the test (volume of manure separated) is a compromise - itdoes not allow for an evaluation of long-term performance (e.g. slimeproblems, mechanical breakdowns, deterioration of the equipment,gradual plugging, etc.) but it does allow for testing more than one manuretype, which is essential
< there was an attempt to get manure samples in a wider range of DMcontents
< more samples should have been taken for the particle size distributionanalysis - there is too much variability in the test results to rely on only onesample of influent and effluent
Report created by: Ron Fleming and Malcolm MacAlpine - June 30, 2003Ridgetown College - University of Guelph
Tested by: Malcolm MacAlpineRidgetown College - University of Guelph
In consultation with Mike Verellen, Verellen Optimized Energy
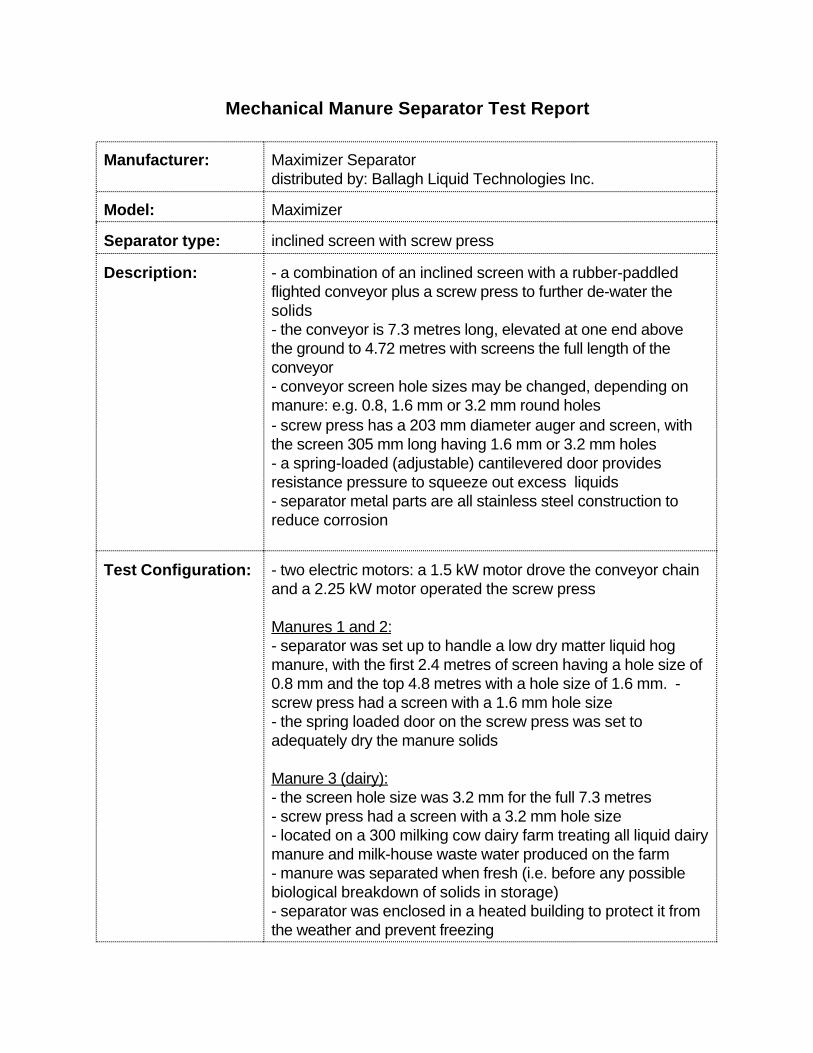
Mechanical Manure Separator Test Report
Manufacturer: Maximizer Separator distributed by: Ballagh Liquid Technologies Inc.
Model: Maximizer
Separator type: inclined screen with screw press
Description: - a combination of an inclined screen with a rubber-paddledflighted conveyor plus a screw press to further de-water thesolids- the conveyor is 7.3 metres long, elevated at one end abovethe ground to 4.72 metres with screens the full length of theconveyor - conveyor screen hole sizes may be changed, depending onmanure: e.g. 0.8, 1.6 mm or 3.2 mm round holes - screw press has a 203 mm diameter auger and screen, withthe screen 305 mm long having 1.6 mm or 3.2 mm holes- a spring-loaded (adjustable) cantilevered door providesresistance pressure to squeeze out excess liquids- separator metal parts are all stainless steel construction toreduce corrosion
Test Configuration: - two electric motors: a 1.5 kW motor drove the conveyor chainand a 2.25 kW motor operated the screw press
Manures 1 and 2:- separator was set up to handle a low dry matter liquid hogmanure, with the first 2.4 metres of screen having a hole size of0.8 mm and the top 4.8 metres with a hole size of 1.6 mm. -screw press had a screen with a 1.6 mm hole size- the spring loaded door on the screw press was set toadequately dry the manure solids
Manure 3 (dairy):- the screen hole size was 3.2 mm for the full 7.3 metres- screw press had a screen with a 3.2 mm hole size- located on a 300 milking cow dairy farm treating all liquid dairymanure and milk-house waste water produced on the farm- manure was separated when fresh (i.e. before any possiblebiological breakdown of solids in storage)- separator was enclosed in a heated building to protect it fromthe weather and prevent freezing

- manure flowed from a pull plug system in the manure and milk-house waste storages into a holding tank that held the flushedmanure- a float mechanism initiated a cycle that started a sludge pumpin the holding tank, pumping manure into the Maximizer- a float in the Maximizer tank started the separator and alsoshut off the flow of fresh manure into the tank once filled- the pump was cycled on and off as needed to keep themanure at the required levels
Test date(s): December 4, 5 and 21, 2002 (1 manure type each day)
Test Location: - Ridgetown College, Ridgetown, Ontario - Manures 1 and 2- On-site at a dairy farm - Manure 3
Test Setup: Manures 1 and 2:1. The manure was pumped into the unit using a 51 mm flexibleplastic hose using a 0.75 kW cutter pump. Manure flow wasmonitored using a flow meter, giving total flow as well as flowrate. This manure was agitated during the test.2. The influent manure was pumped into a tank at the bottom ofthe inclined screens. 3. The separated liquids drained through the screen into aseparated liquids tank.4. The separated liquids were pumped off the surface of thetank into a liquid manure spreader using a 0.38 kW sludgepump and a 51 mm hose. 5. The solids were pushed out the end of the screw pressseparator into a front end loader bucket or a truck box. Thesolids flow rate was monitored by measuring the solids volumeand mass extruded.6. Samples from the separated solids were collected at thecompletion of the test. 7. Separated liquid and influent manure samples were collectedthroughout the test for nutrient and bacteria testing as well asparticle size distribution.
Manure 3:1. Similar to above, but using the on-farm system of pumpinginto the separator. The separated liquids flowed off the top ofthe separated liquids tank on the Maximizer into a series ofthree settling tanks (gravity settling).
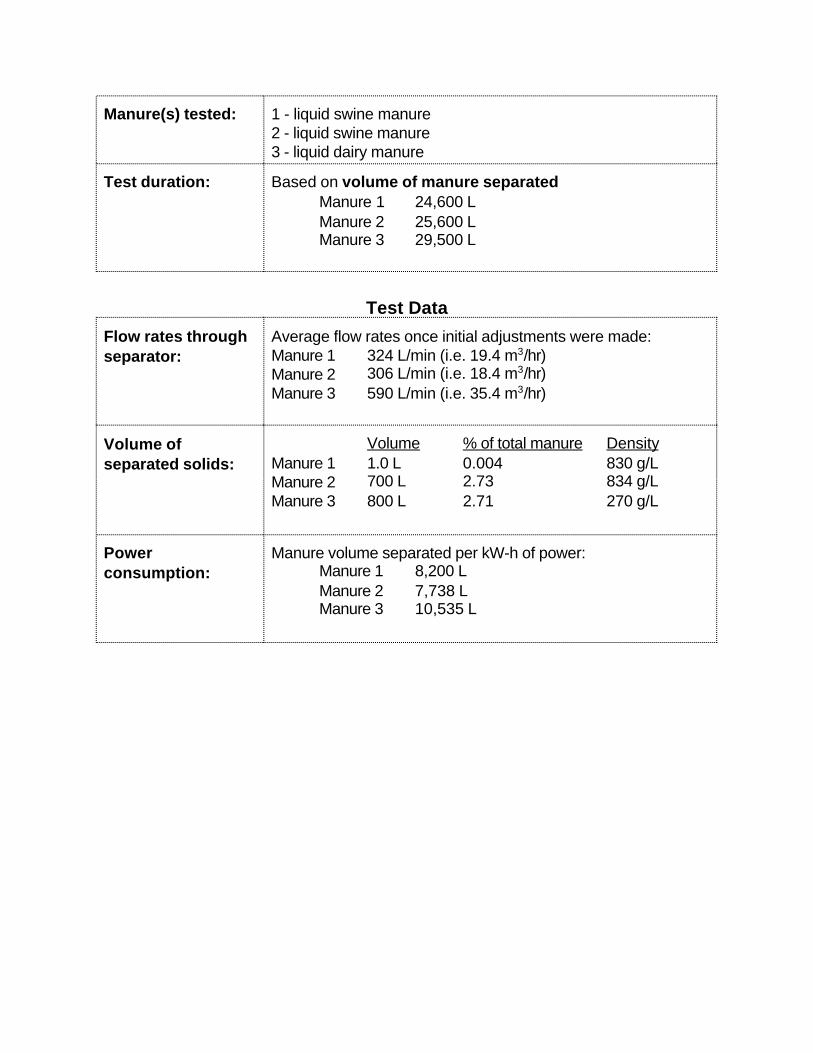
Manure(s) tested: 1 - liquid swine manure 2 - liquid swine manure3 - liquid dairy manure
Test duration: Based on volume of manure separatedManure 1 24,600 LManure 2 25,600 LManure 3 29,500 L
Test Data
Flow rates throughseparator:
Average flow rates once initial adjustments were made:Manure 1 324 L/min (i.e. 19.4 m3/hr)Manure 2 306 L/min (i.e. 18.4 m3/hr)Manure 3 590 L/min (i.e. 35.4 m3/hr)
Volume ofseparated solids:
Volume % of total manure DensityManure 1 1.0 L 0.004 830 g/LManure 2 700 L 2.73 834 g/LManure 3 800 L 2.71 270 g/L
Powerconsumption:
Manure volume separated per kW-h of power:Manure 1 8,200 LManure 2 7,738 L Manure 3 10,535 L
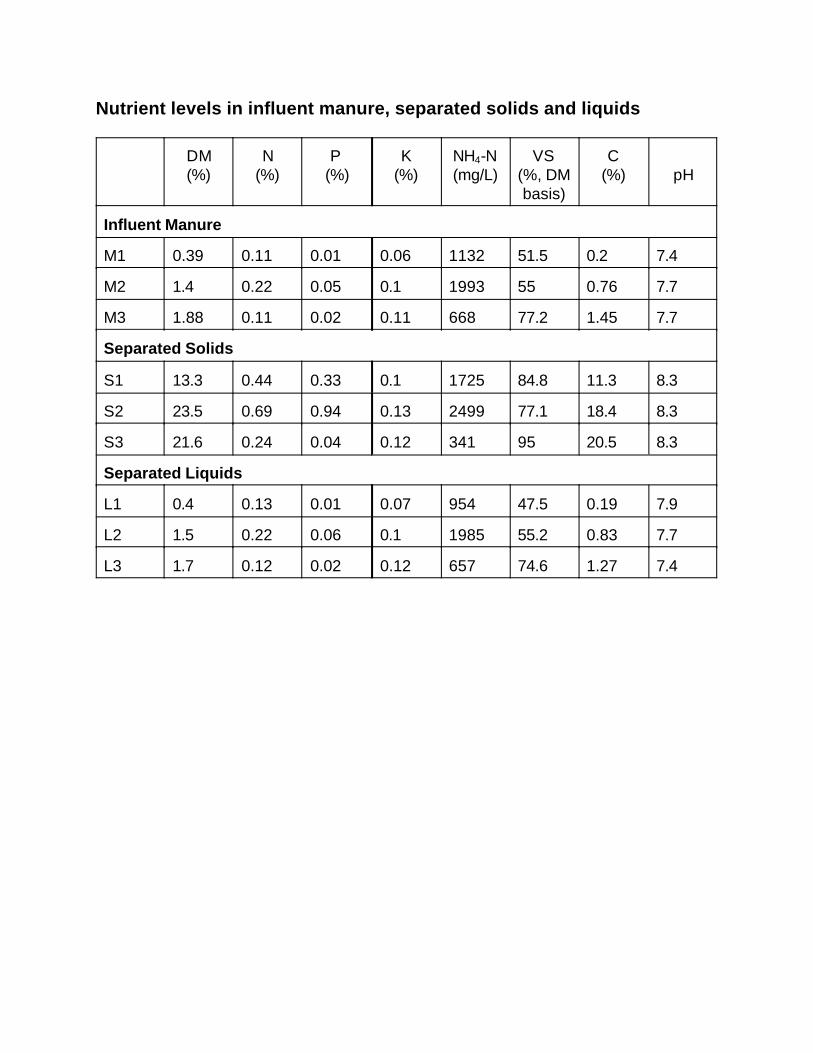
Nutrient levels in influent manure, separated solids and liquids
DM(%)
N(%)
P (%)
K(%)
NH4-N(mg/L)
VS(%, DMbasis)
C(%) pH
Influent Manure
M1 0.39 0.11 0.01 0.06 1132 51.5 0.2 7.4
M2 1.4 0.22 0.05 0.1 1993 55 0.76 7.7
M3 1.88 0.11 0.02 0.11 668 77.2 1.45 7.7
Separated Solids
S1 13.3 0.44 0.33 0.1 1725 84.8 11.3 8.3
S2 23.5 0.69 0.94 0.13 2499 77.1 18.4 8.3
S3 21.6 0.24 0.04 0.12 341 95 20.5 8.3
Separated Liquids
L1 0.4 0.13 0.01 0.07 954 47.5 0.19 7.9
L2 1.5 0.22 0.06 0.1 1985 55.2 0.83 7.7
L3 1.7 0.12 0.02 0.12 657 74.6 1.27 7.4

00.2
0.4
0.6
0.8
1
1.2
1.4
Mas
s (g
)
to 10 mesh 10 to 50 50 to 100 100 to 325Screen Mesh Size
Influent Effluent
Manure 2
0
0.1
0.2
0.3
0.4
0.5
Mas
s (g
)
to 10 mesh 50 to 100Screen Mesh Size
Influent Effluent
Manure 1
0
0.5
1
1.5
2
2.5
Mas
s (g
)
to 10 mesh 10 to 50 50 to 100 100 to 325Screen Mesh Size
Influent Effluent
Manure 3
Bacteria levels in influent manure, separated solids and liquids
total coliform(cfu/100 mL)
E. coli(cfu/100 mL)
Influent Manure
M1 8200 9300
M2 1400 950
M3 320000 290000
Separated Solids
S1 13000 6900
S2 80000 38000
S3 210000 180000
Separated Liquids
L1 4300 3800
L2 1200 690
L3 270000 240000
Particle Size Distribution
Conversion Tablemesh size opening size (mm)10 2.050 0.30100 0.15325 0.045
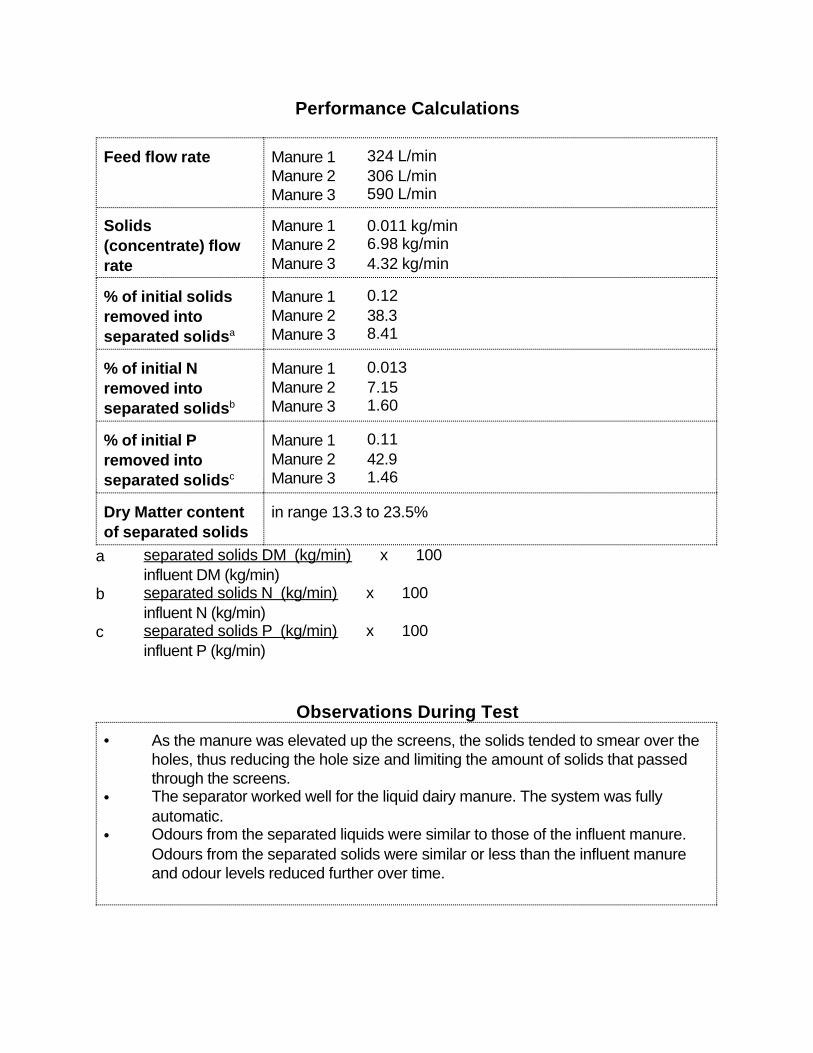
Performance Calculations
Feed flow rate Manure 1 324 L/minManure 2 306 L/minManure 3 590 L/min
Solids(concentrate) flowrate
Manure 1 0.011 kg/minManure 2 6.98 kg/minManure 3 4.32 kg/min
% of initial solidsremoved intoseparated solidsa
Manure 1 0.12Manure 2 38.3Manure 3 8.41
% of initial Nremoved intoseparated solidsb
Manure 1 0.013Manure 2 7.15Manure 3 1.60
% of initial Premoved intoseparated solidsc
Manure 1 0.11Manure 2 42.9Manure 3 1.46
Dry Matter contentof separated solids
in range 13.3 to 23.5%
a separated solids DM (kg/min) x 100influent DM (kg/min)
b separated solids N (kg/min) x 100influent N (kg/min)
c separated solids P (kg/min) x 100influent P (kg/min)
Observations During Test
• As the manure was elevated up the screens, the solids tended to smear over theholes, thus reducing the hole size and limiting the amount of solids that passedthrough the screens.
• The separator worked well for the liquid dairy manure. The system was fullyautomatic.
• Odours from the separated liquids were similar to those of the influent manure. Odours from the separated solids were similar or less than the influent manure and odour levels reduced further over time.
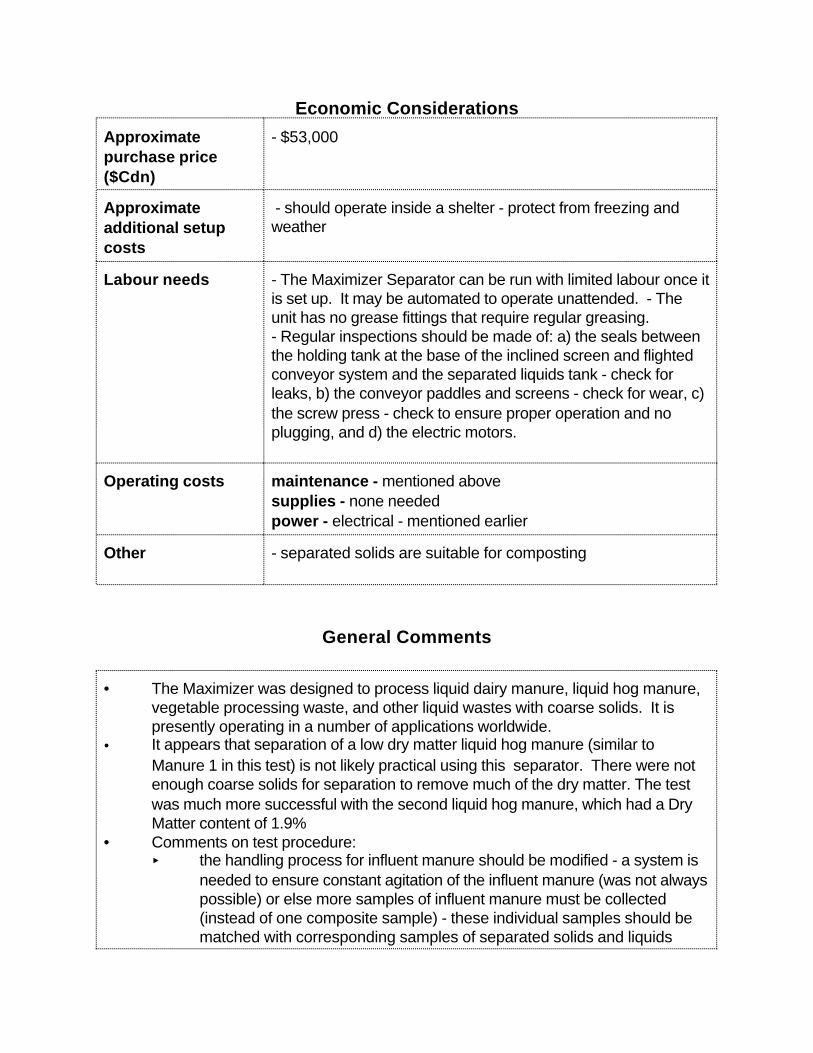
Economic Considerations
Approximatepurchase price($Cdn)
- $53,000
Approximateadditional setupcosts
- should operate inside a shelter - protect from freezing andweather
Labour needs - The Maximizer Separator can be run with limited labour once itis set up. It may be automated to operate unattended. - Theunit has no grease fittings that require regular greasing. - Regular inspections should be made of: a) the seals betweenthe holding tank at the base of the inclined screen and flightedconveyor system and the separated liquids tank - check forleaks, b) the conveyor paddles and screens - check for wear, c)the screw press - check to ensure proper operation and noplugging, and d) the electric motors.
Operating costs maintenance - mentioned abovesupplies - none neededpower - electrical - mentioned earlier
Other - separated solids are suitable for composting
General Comments
• The Maximizer was designed to process liquid dairy manure, liquid hog manure,vegetable processing waste, and other liquid wastes with coarse solids. It ispresently operating in a number of applications worldwide.
• It appears that separation of a low dry matter liquid hog manure (similar toManure 1 in this test) is not likely practical using this separator. There were notenough coarse solids for separation to remove much of the dry matter. The testwas much more successful with the second liquid hog manure, which had a DryMatter content of 1.9%
• Comments on test procedure: < the handling process for influent manure should be modified - a system is
needed to ensure constant agitation of the influent manure (was not alwayspossible) or else more samples of influent manure must be collected(instead of one composite sample) - these individual samples should bematched with corresponding samples of separated solids and liquids
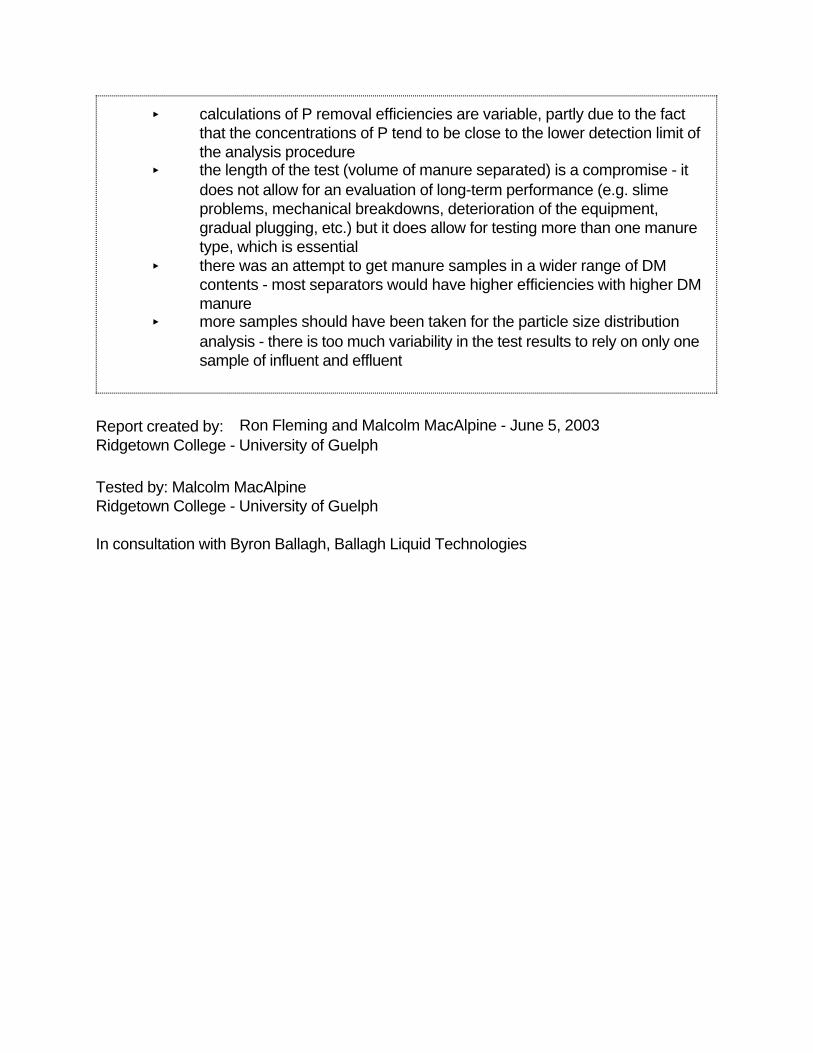
< calculations of P removal efficiencies are variable, partly due to the factthat the concentrations of P tend to be close to the lower detection limit ofthe analysis procedure
< the length of the test (volume of manure separated) is a compromise - itdoes not allow for an evaluation of long-term performance (e.g. slimeproblems, mechanical breakdowns, deterioration of the equipment,gradual plugging, etc.) but it does allow for testing more than one manuretype, which is essential
< there was an attempt to get manure samples in a wider range of DMcontents - most separators would have higher efficiencies with higher DMmanure
< more samples should have been taken for the particle size distributionanalysis - there is too much variability in the test results to rely on only onesample of influent and effluent
Report created by: Ron Fleming and Malcolm MacAlpine - June 5, 2003Ridgetown College - University of Guelph
Tested by: Malcolm MacAlpineRidgetown College - University of Guelph
In consultation with Byron Ballagh, Ballagh Liquid Technologies
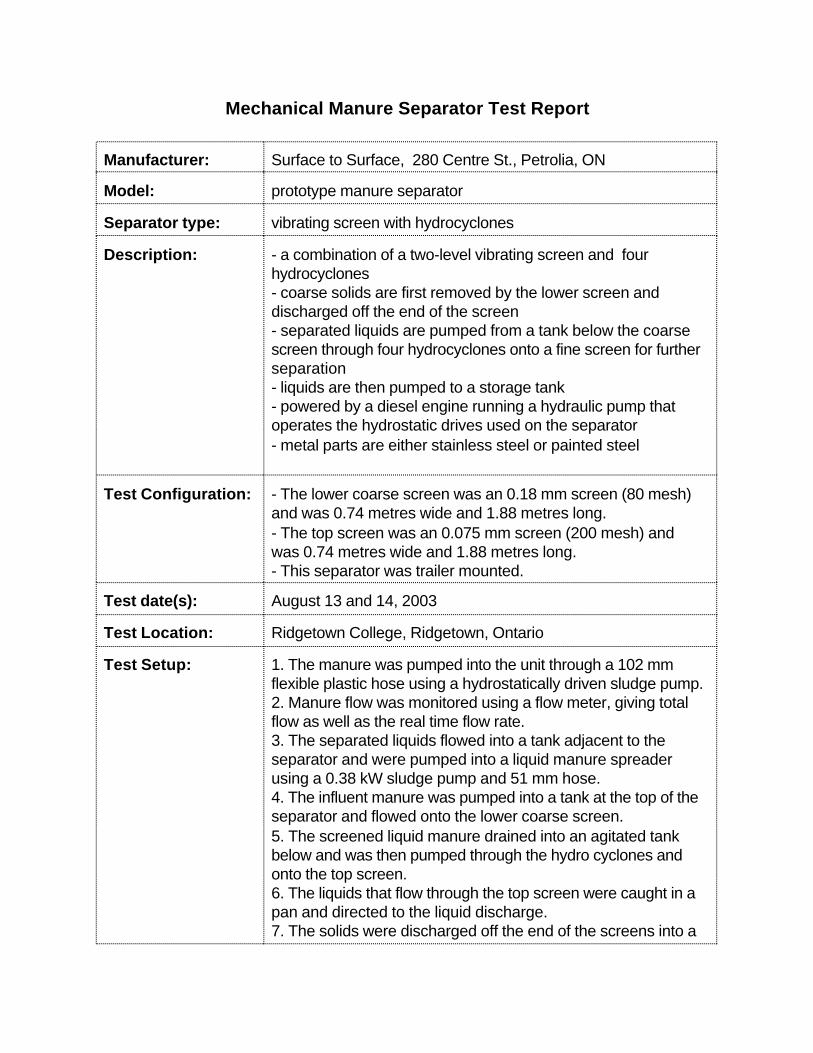
Mechanical Manure Separator Test Report
Manufacturer: Surface to Surface, 280 Centre St., Petrolia, ON
Model: prototype manure separator
Separator type: vibrating screen with hydrocyclones
Description: - a combination of a two-level vibrating screen and fourhydrocyclones- coarse solids are first removed by the lower screen anddischarged off the end of the screen- separated liquids are pumped from a tank below the coarsescreen through four hydrocyclones onto a fine screen for furtherseparation- liquids are then pumped to a storage tank- powered by a diesel engine running a hydraulic pump thatoperates the hydrostatic drives used on the separator- metal parts are either stainless steel or painted steel
Test Configuration: - The lower coarse screen was an 0.18 mm screen (80 mesh)and was 0.74 metres wide and 1.88 metres long. - The top screen was an 0.075 mm screen (200 mesh) and was 0.74 metres wide and 1.88 metres long. - This separator was trailer mounted.
Test date(s): August 13 and 14, 2003
Test Location: Ridgetown College, Ridgetown, Ontario
Test Setup: 1. The manure was pumped into the unit through a 102 mmflexible plastic hose using a hydrostatically driven sludge pump. 2. Manure flow was monitored using a flow meter, giving totalflow as well as the real time flow rate. 3. The separated liquids flowed into a tank adjacent to theseparator and were pumped into a liquid manure spreaderusing a 0.38 kW sludge pump and 51 mm hose.4. The influent manure was pumped into a tank at the top of theseparator and flowed onto the lower coarse screen.5. The screened liquid manure drained into an agitated tankbelow and was then pumped through the hydro cyclones andonto the top screen. 6. The liquids that flow through the top screen were caught in apan and directed to the liquid discharge. 7. The solids were discharged off the end of the screens into a
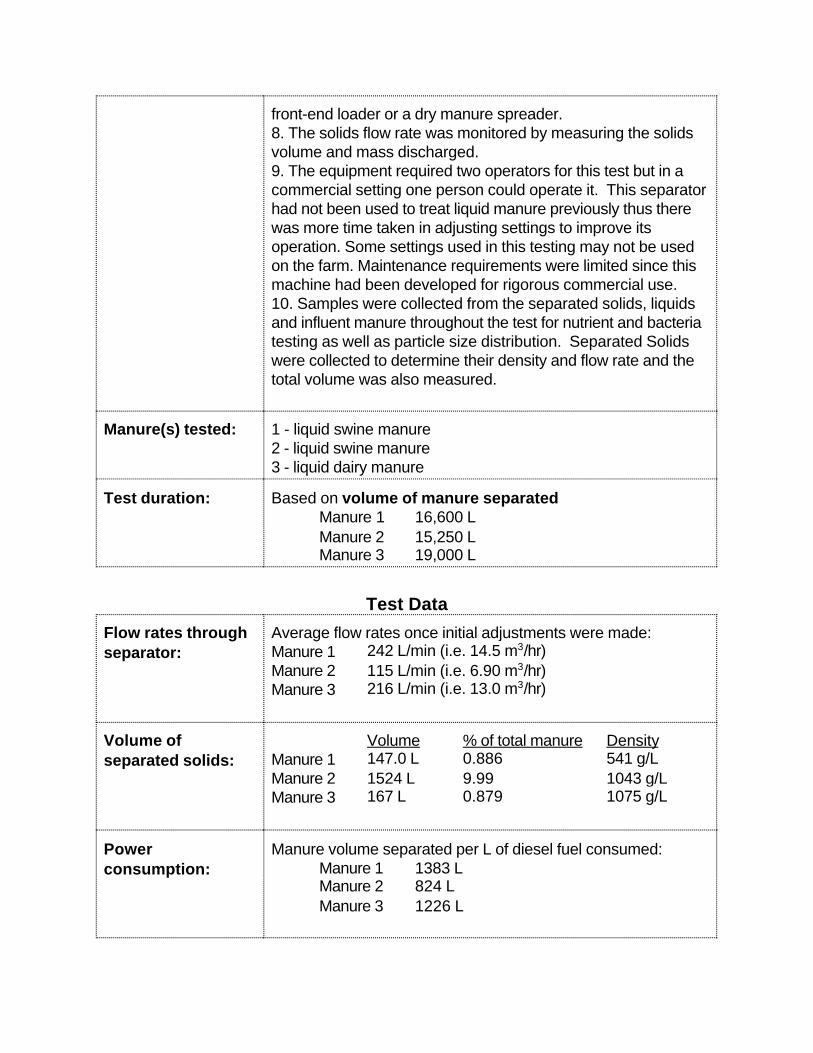
front-end loader or a dry manure spreader. 8. The solids flow rate was monitored by measuring the solidsvolume and mass discharged.9. The equipment required two operators for this test but in acommercial setting one person could operate it. This separatorhad not been used to treat liquid manure previously thus therewas more time taken in adjusting settings to improve itsoperation. Some settings used in this testing may not be usedon the farm. Maintenance requirements were limited since thismachine had been developed for rigorous commercial use.10. Samples were collected from the separated solids, liquidsand influent manure throughout the test for nutrient and bacteriatesting as well as particle size distribution. Separated Solidswere collected to determine their density and flow rate and thetotal volume was also measured.
Manure(s) tested: 1 - liquid swine manure 2 - liquid swine manure3 - liquid dairy manure
Test duration: Based on volume of manure separatedManure 1 16,600 LManure 2 15,250 LManure 3 19,000 L
Test Data
Flow rates throughseparator:
Average flow rates once initial adjustments were made:Manure 1 242 L/min (i.e. 14.5 m3/hr)Manure 2 115 L/min (i.e. 6.90 m3/hr)Manure 3 216 L/min (i.e. 13.0 m3/hr)
Volume ofseparated solids:
Volume % of total manure DensityManure 1 147.0 L 0.886 541 g/LManure 2 1524 L 9.99 1043 g/LManure 3 167 L 0.879 1075 g/L
Powerconsumption:
Manure volume separated per L of diesel fuel consumed:Manure 1 1383 LManure 2 824 L Manure 3 1226 L

Nutrient levels in influent manure, separated solids and liquids
DM(%)
N(%)
P (%)
K(%)
NH4-N(mg/L)
VS(%, DMbasis)
C(%) pH
Influent Manure
M1 0.6 0.08 0.01 0.06 3272 67.6 0.41 7.7
M2 3.79 0.4 0.05 0.26 912 69.7 2.64 7.5
M3 1.32 0.18 0.01 0.14 811 64.5 0.85 7.4
Separated Solids
S1 21.8 0.44 0.89 0.07 2377 35.2 7.5 8.4
S2 12.43 1.21 0.6 0.58 3984 45.6 5.97 8.1
S3 10.24 0.22 0.07 0.13 1185 46 4.75 8.4
Separated Liquids
L1 0.6 0.12 0.02 0.06 1185 61.4 0.37 7.6
L2 3.74 0.42 0.17 0.26 2902 64.7 2.42 7.8
L3 1.11 0.1 0.01 0.13 850 64.1 0.71 7.7
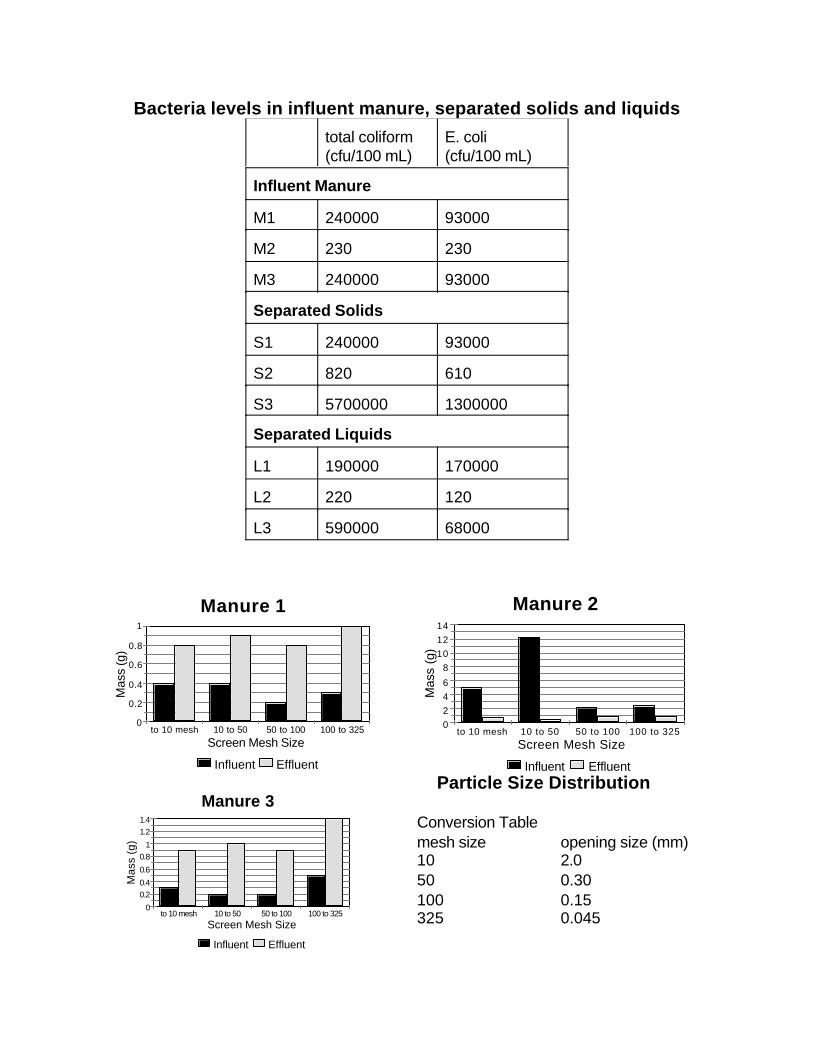
0246
8101214
Mas
s (g
)
to 10 mesh 10 to 50 50 to 100 100 to 325Screen Mesh Size
Influent Effluent
Manure 2
0
0.2
0.4
0.6
0.8
1
Mas
s (g
)
to 10 mesh 10 to 50 50 to 100 100 to 325Screen Mesh Size
Influent Effluent
Manure 1
0
0.20.4
0.6
0.81
1.21.4
Mas
s (g
)
to 10 mesh 10 to 50 50 to 100 100 to 325Screen Mesh Size
Influent Effluent
Manure 3
Bacteria levels in influent manure, separated solids and liquids
total coliform(cfu/100 mL)
E. coli(cfu/100 mL)
Influent Manure
M1 240000 93000
M2 230 230
M3 240000 93000
Separated Solids
S1 240000 93000
S2 820 610
S3 5700000 1300000
Separated Liquids
L1 190000 170000
L2 220 120
L3 590000 68000
Particle Size Distribution
Conversion Tablemesh size opening size (mm)10 2.050 0.30100 0.15325 0.045
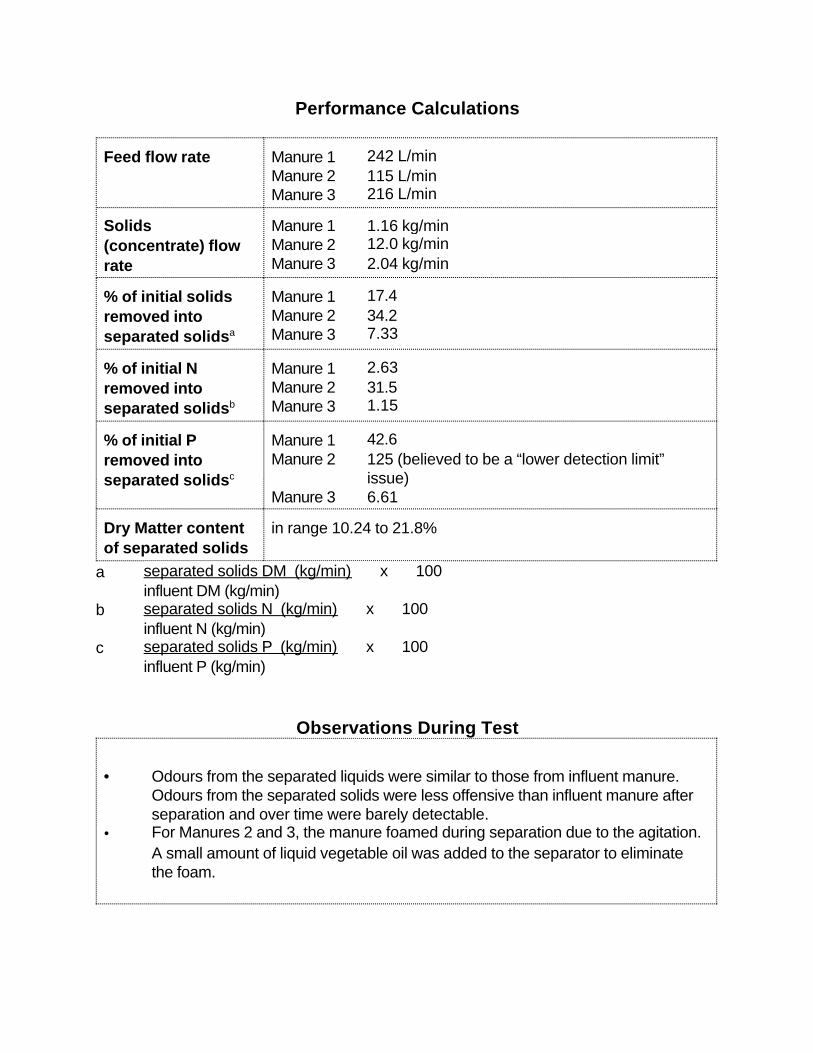
Performance Calculations
Feed flow rate Manure 1 242 L/minManure 2 115 L/minManure 3 216 L/min
Solids(concentrate) flowrate
Manure 1 1.16 kg/minManure 2 12.0 kg/minManure 3 2.04 kg/min
% of initial solidsremoved intoseparated solidsa
Manure 1 17.4Manure 2 34.2Manure 3 7.33
% of initial Nremoved intoseparated solidsb
Manure 1 2.63Manure 2 31.5Manure 3 1.15
% of initial Premoved intoseparated solidsc
Manure 1 42.6Manure 2 125 (believed to be a “lower detection limit”
issue)Manure 3 6.61
Dry Matter contentof separated solids
in range 10.24 to 21.8%
a separated solids DM (kg/min) x 100influent DM (kg/min)
b separated solids N (kg/min) x 100influent N (kg/min)
c separated solids P (kg/min) x 100influent P (kg/min)
Observations During Test
• Odours from the separated liquids were similar to those from influent manure. Odours from the separated solids were less offensive than influent manure afterseparation and over time were barely detectable.
• For Manures 2 and 3, the manure foamed during separation due to the agitation.A small amount of liquid vegetable oil was added to the separator to eliminatethe foam.
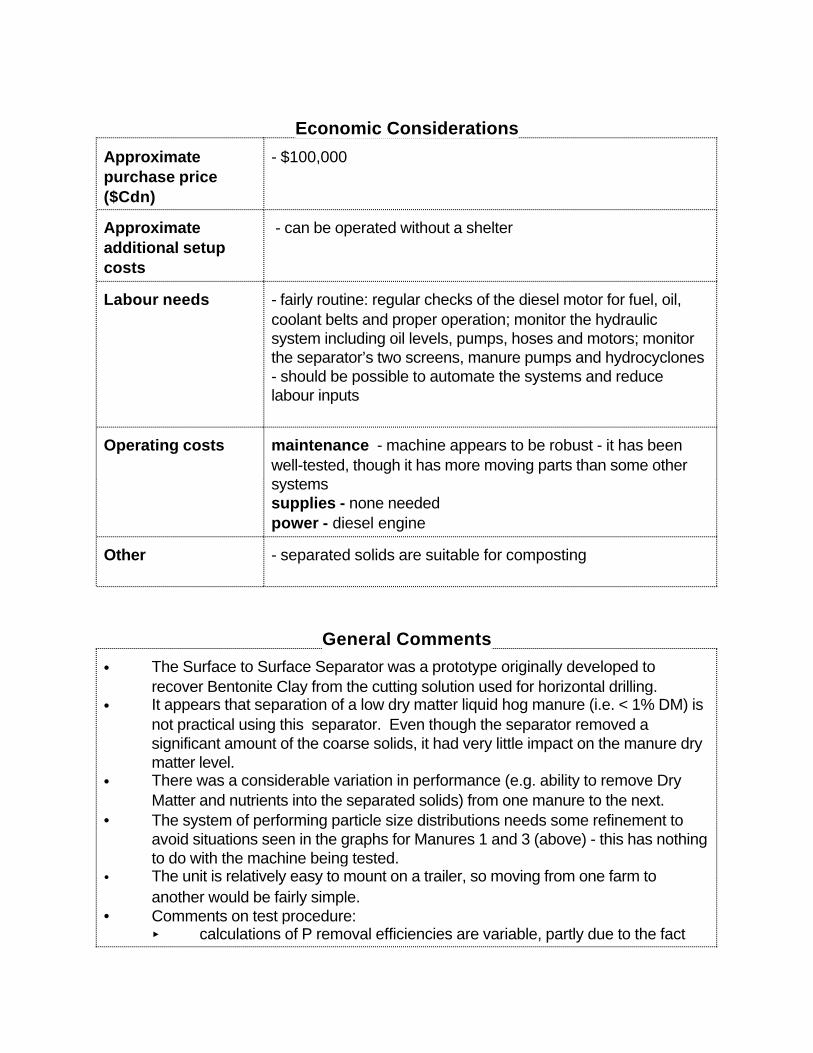
Economic Considerations
Approximatepurchase price($Cdn)
- $100,000
Approximateadditional setupcosts
- can be operated without a shelter
Labour needs - fairly routine: regular checks of the diesel motor for fuel, oil,coolant belts and proper operation; monitor the hydraulicsystem including oil levels, pumps, hoses and motors; monitorthe separator’s two screens, manure pumps and hydrocyclones- should be possible to automate the systems and reducelabour inputs
Operating costs maintenance - machine appears to be robust - it has beenwell-tested, though it has more moving parts than some othersystemssupplies - none neededpower - diesel engine
Other - separated solids are suitable for composting
General Comments
• The Surface to Surface Separator was a prototype originally developed torecover Bentonite Clay from the cutting solution used for horizontal drilling.
• It appears that separation of a low dry matter liquid hog manure (i.e. < 1% DM) isnot practical using this separator. Even though the separator removed asignificant amount of the coarse solids, it had very little impact on the manure drymatter level.
• There was a considerable variation in performance (e.g. ability to remove DryMatter and nutrients into the separated solids) from one manure to the next.
• The system of performing particle size distributions needs some refinement toavoid situations seen in the graphs for Manures 1 and 3 (above) - this has nothingto do with the machine being tested.
• The unit is relatively easy to mount on a trailer, so moving from one farm toanother would be fairly simple.
• Comments on test procedure: < calculations of P removal efficiencies are variable, partly due to the fact
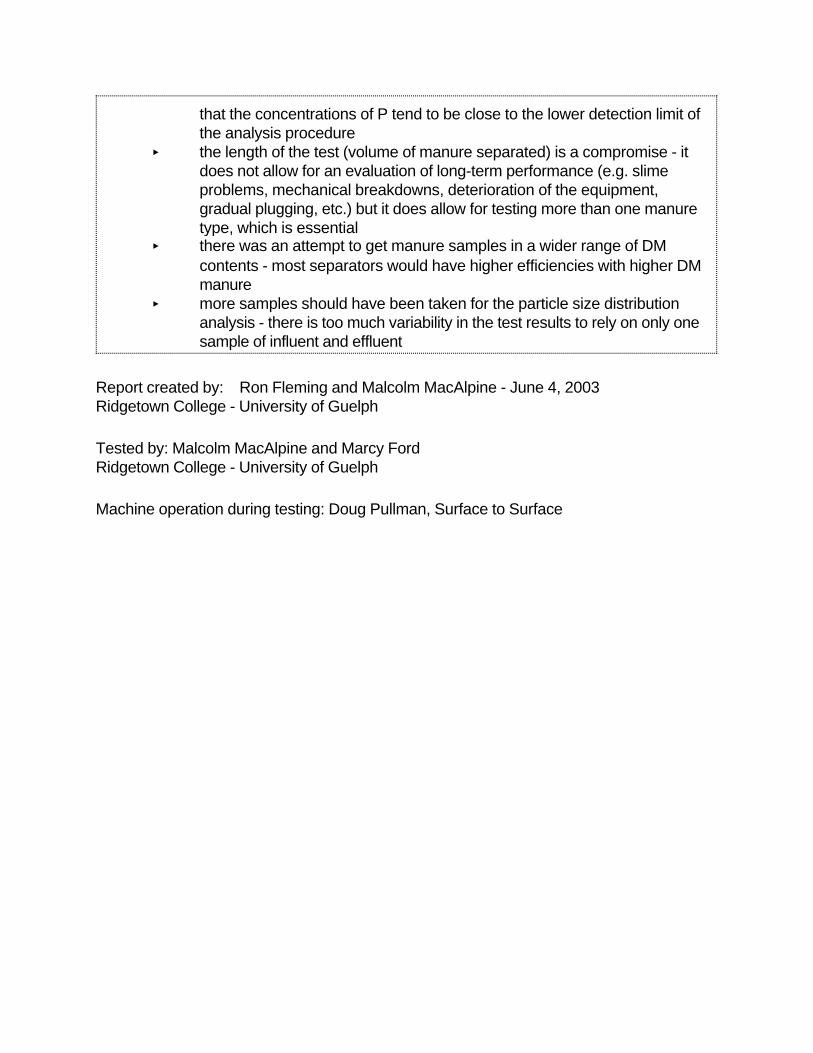
that the concentrations of P tend to be close to the lower detection limit ofthe analysis procedure
< the length of the test (volume of manure separated) is a compromise - itdoes not allow for an evaluation of long-term performance (e.g. slimeproblems, mechanical breakdowns, deterioration of the equipment,gradual plugging, etc.) but it does allow for testing more than one manuretype, which is essential
< there was an attempt to get manure samples in a wider range of DMcontents - most separators would have higher efficiencies with higher DMmanure
< more samples should have been taken for the particle size distributionanalysis - there is too much variability in the test results to rely on only onesample of influent and effluent
Report created by: Ron Fleming and Malcolm MacAlpine - June 4, 2003Ridgetown College - University of Guelph
Tested by: Malcolm MacAlpine and Marcy FordRidgetown College - University of Guelph
Machine operation during testing: Doug Pullman, Surface to Surface

Mechanical Manure Separator Test Report
Manufacturer: Sleegers Machine and Fabrication Inc.
Model: SEI Dewatering System
Separator type: Screw Press
Description: - design capacity: 90 to 909 L/min.- made of carbon steel, weighing 426 kg - powered by a single phase, 5.6 kW, 220 volt, 40 amp electricmotor driving a reduction gear drive that turns the 26.0 cmdiameter, 108 cm long stainless steel auger with a 59 cm longflighting- auger had single flighting for dairy manure and double flightingfor liquid swine manure - nylon brushes mounted on the flighting to keep the screensclean- auger rotated inside a 52 cm long stainless steel axial wirescreen (slot size 1.0 mm for dairy manure and 0.25 mm forswine manure) that was mounted inside the exterior housing - auger supported by a bearing on each end, allowing closetolerances with the screen- opening for the solids discharge had a spring loaded plug witha solids cutter, that mounted on the auger shaft and could beadjusted to give the desired solids dry matter level
Test Configuration: Manures 1 & 2: - double flighted auger, with brushes attached to the augerflighting - 0.25 mm stainless steel axial wire screen- a coarse fibre plug made of partially cured compost wasinserted into the solids discharge prior to starting- the metal solids discharge plug was then pushed into placeand the discharge resistance pressure set
Manure 3: similar to above, except- single flighted auger, with brushes attached to the augerflighting - 1.0 mm slot size bar screen
Test date(s): October 2, October 16 and November 5, 2002 (1 manure typeeach day)
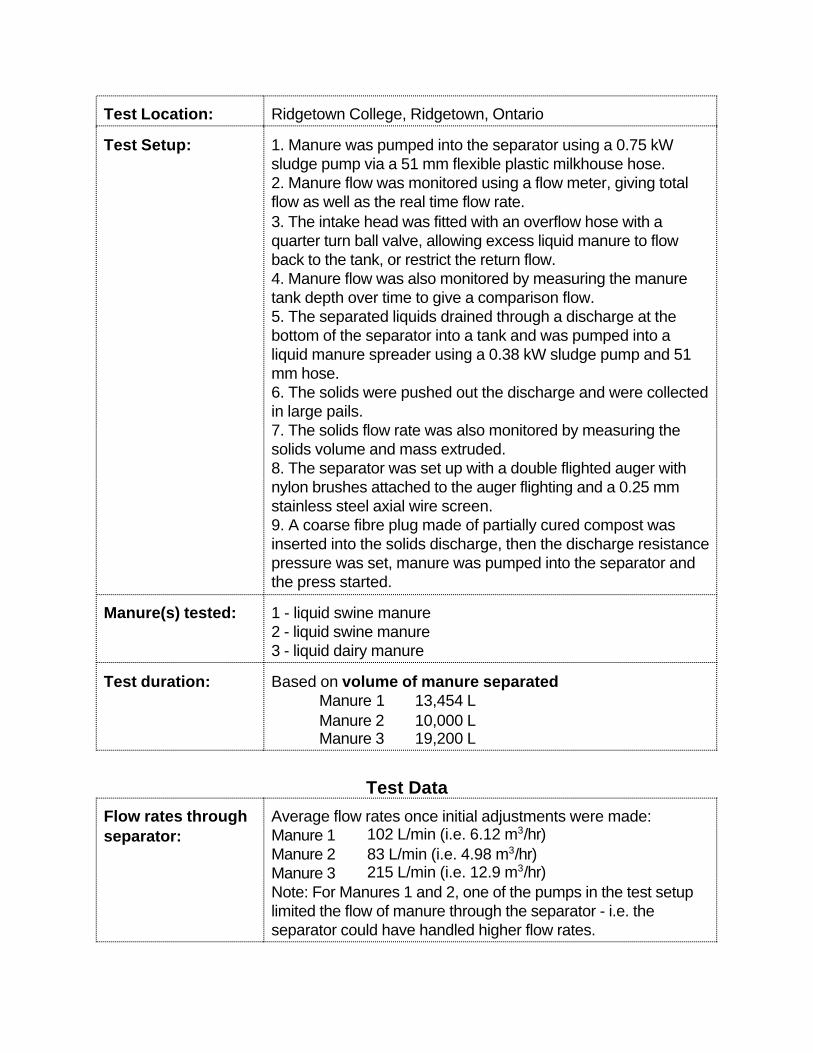
Test Location: Ridgetown College, Ridgetown, Ontario
Test Setup: 1. Manure was pumped into the separator using a 0.75 kWsludge pump via a 51 mm flexible plastic milkhouse hose. 2. Manure flow was monitored using a flow meter, giving totalflow as well as the real time flow rate. 3. The intake head was fitted with an overflow hose with aquarter turn ball valve, allowing excess liquid manure to flowback to the tank, or restrict the return flow. 4. Manure flow was also monitored by measuring the manuretank depth over time to give a comparison flow.5. The separated liquids drained through a discharge at thebottom of the separator into a tank and was pumped into aliquid manure spreader using a 0.38 kW sludge pump and 51mm hose. 6. The solids were pushed out the discharge and were collectedin large pails. 7. The solids flow rate was also monitored by measuring thesolids volume and mass extruded.8. The separator was set up with a double flighted auger withnylon brushes attached to the auger flighting and a 0.25 mmstainless steel axial wire screen. 9. A coarse fibre plug made of partially cured compost wasinserted into the solids discharge, then the discharge resistancepressure was set, manure was pumped into the separator andthe press started.
Manure(s) tested: 1 - liquid swine manure 2 - liquid swine manure3 - liquid dairy manure
Test duration: Based on volume of manure separatedManure 1 13,454 LManure 2 10,000 LManure 3 19,200 L
Test Data
Flow rates throughseparator:
Average flow rates once initial adjustments were made:Manure 1 102 L/min (i.e. 6.12 m3/hr)Manure 2 83 L/min (i.e. 4.98 m3/hr)Manure 3 215 L/min (i.e. 12.9 m3/hr)Note: For Manures 1 and 2, one of the pumps in the test setuplimited the flow of manure through the separator - i.e. theseparator could have handled higher flow rates.
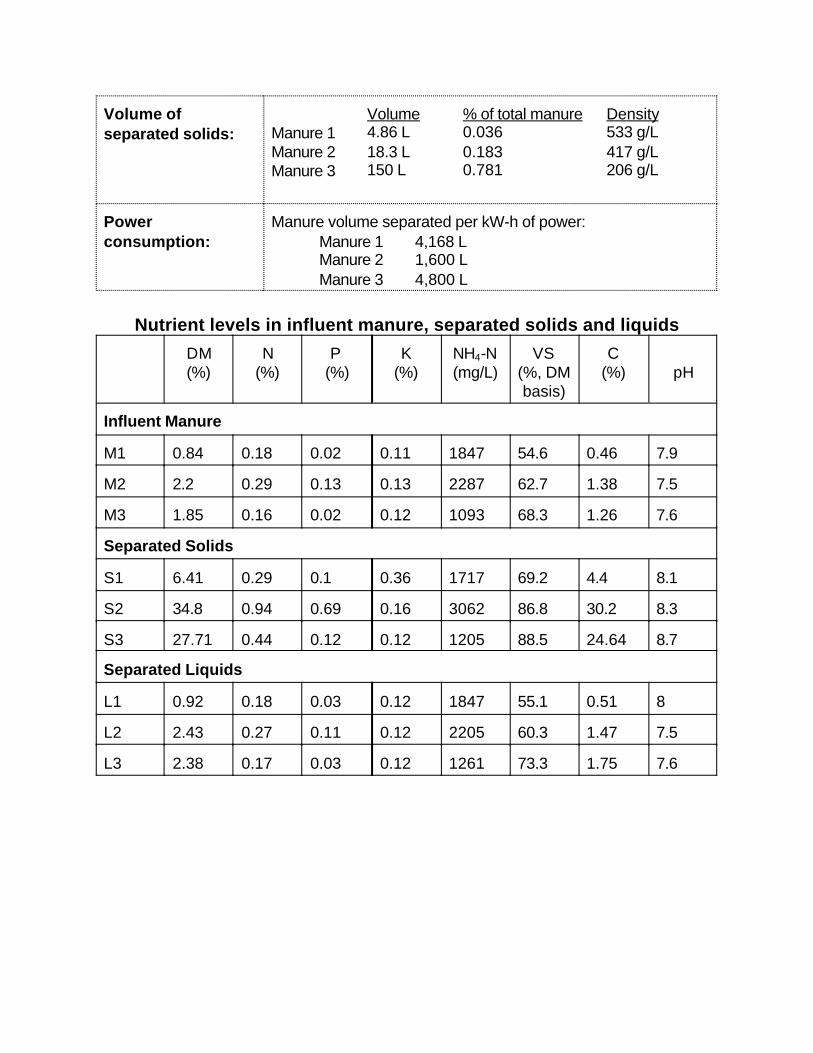
Volume ofseparated solids:
Volume % of total manure DensityManure 1 4.86 L 0.036 533 g/LManure 2 18.3 L 0.183 417 g/LManure 3 150 L 0.781 206 g/L
Powerconsumption:
Manure volume separated per kW-h of power:Manure 1 4,168 LManure 2 1,600 L Manure 3 4,800 L
Nutrient levels in influent manure, separated solids and liquids
DM(%)
N(%)
P (%)
K(%)
NH4-N(mg/L)
VS(%, DMbasis)
C(%) pH
Influent Manure
M1 0.84 0.18 0.02 0.11 1847 54.6 0.46 7.9
M2 2.2 0.29 0.13 0.13 2287 62.7 1.38 7.5
M3 1.85 0.16 0.02 0.12 1093 68.3 1.26 7.6
Separated Solids
S1 6.41 0.29 0.1 0.36 1717 69.2 4.4 8.1
S2 34.8 0.94 0.69 0.16 3062 86.8 30.2 8.3
S3 27.71 0.44 0.12 0.12 1205 88.5 24.64 8.7
Separated Liquids
L1 0.92 0.18 0.03 0.12 1847 55.1 0.51 8
L2 2.43 0.27 0.11 0.12 2205 60.3 1.47 7.5
L3 2.38 0.17 0.03 0.12 1261 73.3 1.75 7.6
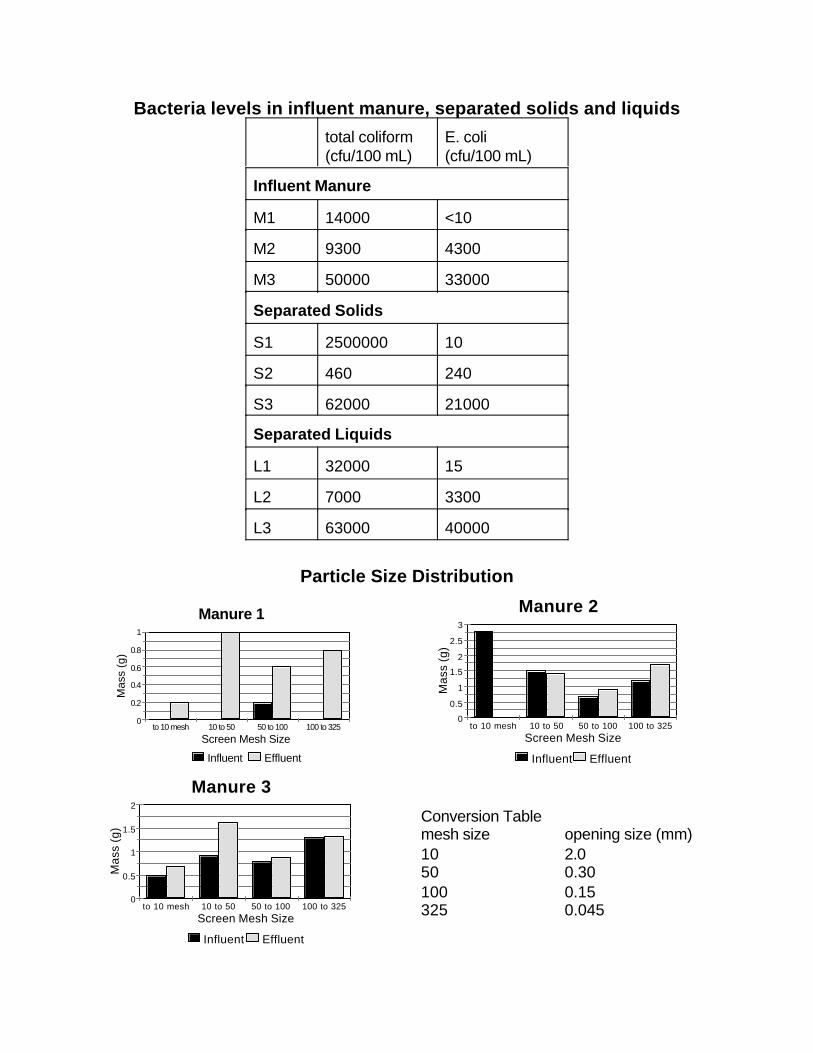
0
0.5
1
1.5
2
2.5
3
Mas
s (g
)
to 10 mesh 10 to 50 50 to 100 100 to 325Screen Mesh Size
Influent Effluent
Manure 2
0
0.2
0.4
0.6
0.8
1
Mas
s (g
)
to 10 mesh 10 to 50 50 to 100 100 to 325
Screen Mesh Size
Influent Effluent
Manure 1
0
0.5
1
1.5
2
Mas
s (g
)
to 10 mesh 10 to 50 50 to 100 100 to 325Screen Mesh Size
Influent Effluent
Manure 3
Bacteria levels in influent manure, separated solids and liquids
total coliform(cfu/100 mL)
E. coli(cfu/100 mL)
Influent Manure
M1 14000 <10
M2 9300 4300
M3 50000 33000
Separated Solids
S1 2500000 10
S2 460 240
S3 62000 21000
Separated Liquids
L1 32000 15
L2 7000 3300
L3 63000 40000
Particle Size Distribution
Conversion Tablemesh size opening size (mm)10 2.050 0.30100 0.15325 0.045

Performance Calculations
Feed flow rate Manure 1 102 L/minManure 2 83 L/minManure 3 215 L/min
Solids(concentrate) flowrate
Manure 1 19.6 g/minManure 2 63.3 g/minManure 3 346 g/min
% of initial solidsremoved intoseparated solidsa
Manure 1 0.15Manure 2 1.21Manure 3 2.41
% of initial Nremoved intoseparated solidsb
Manure 1 0.03Manure 2 0.25Manure 3 0.44
% of initial Premoved intoseparated solidsc
Manure 1 0.10Manure 2 0.41Manure 3 0.97
Dry Matter contentof separated solids
in range 6.41 to 34.8%
a separated solids DM (kg/min) x 100influent DM (kg/min)
b separated solids N (kg/min) x 100influent N (kg/min)
c separated solids P (kg/min) x 100influent P (kg/min)
Observations During Test
• Due to the low solids content for Manures 1 & 2, it was difficult to develop a goodliquid seal in the solids discharge. For Manure #1, it took 2.5 hours and 4,000litres of liquid manure for a seal to develop. For Manure 2, it took 2 hours and4000 L of manure. For manure 3, it took 2.75 hours and 3,500 litres of liquidmanure. Once the plug was set, it was not necessary to reset it if the separatorwas used regularly.
• For Manure 1 - The influent manure flow rate started to decline at about 18,600litres of manure pumped. By 22,454 litres, the flow was virtually stopped and thepressure was building in the separator. The solids end plug then failed andliquids flowed out of the solids discharge. The test was stopped at this point and
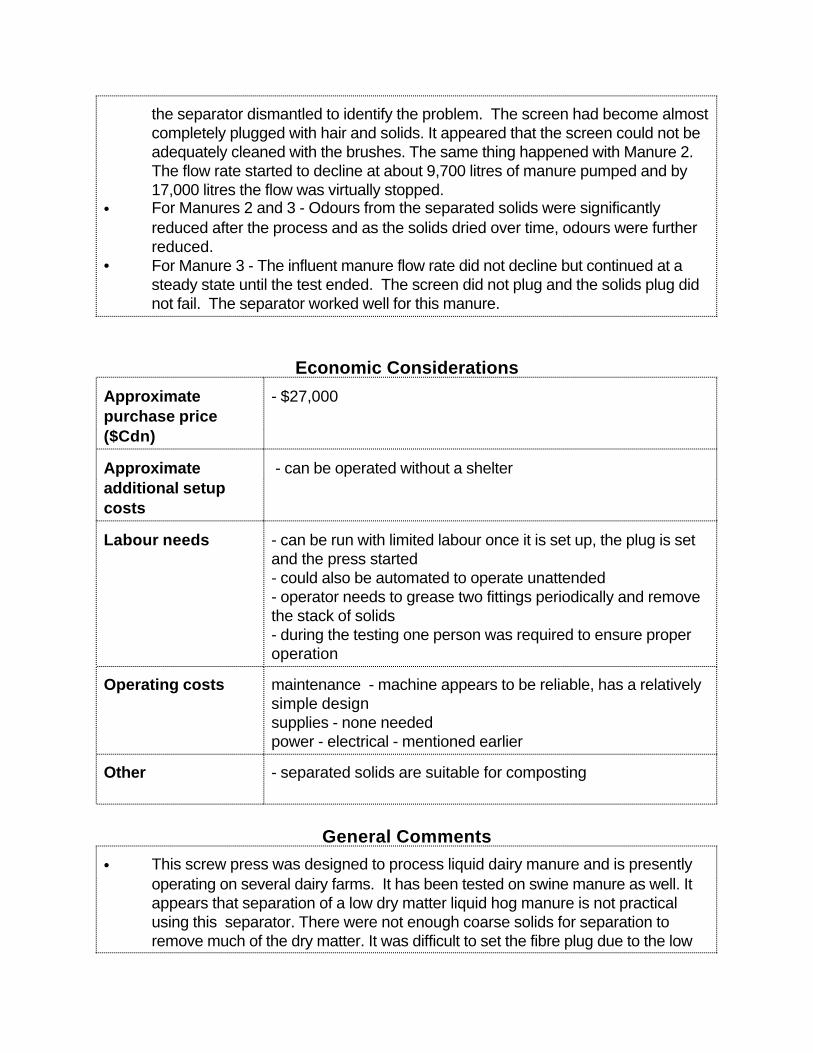
the separator dismantled to identify the problem. The screen had become almostcompletely plugged with hair and solids. It appeared that the screen could not beadequately cleaned with the brushes. The same thing happened with Manure 2.The flow rate started to decline at about 9,700 litres of manure pumped and by17,000 litres the flow was virtually stopped.
• For Manures 2 and 3 - Odours from the separated solids were significantlyreduced after the process and as the solids dried over time, odours were furtherreduced.
• For Manure 3 - The influent manure flow rate did not decline but continued at asteady state until the test ended. The screen did not plug and the solids plug didnot fail. The separator worked well for this manure.
Economic Considerations
Approximatepurchase price($Cdn)
- $27,000
Approximateadditional setupcosts
- can be operated without a shelter
Labour needs - can be run with limited labour once it is set up, the plug is setand the press started - could also be automated to operate unattended- operator needs to grease two fittings periodically and removethe stack of solids- during the testing one person was required to ensure properoperation
Operating costs maintenance - machine appears to be reliable, has a relativelysimple designsupplies - none neededpower - electrical - mentioned earlier
Other - separated solids are suitable for composting
General Comments
• This screw press was designed to process liquid dairy manure and is presentlyoperating on several dairy farms. It has been tested on swine manure as well. Itappears that separation of a low dry matter liquid hog manure is not practicalusing this separator. There were not enough coarse solids for separation toremove much of the dry matter. It was difficult to set the fibre plug due to the low

manure dry matter.• In a typical farm setup the manure is separated when fresh before the coarse
solids start to break down in storage, thus potentially improving the performanceof the separator.
• Comments on test procedure: < the handling process for influent manure should be modified - a system is
needed to ensure constant agitation of the influent manure (was not alwayspossible) or else more samples of influent manure must be collected(instead of one composite sample) - these individual samples should bematched with corresponding samples of separated solids and liquids
< calculations of P removal efficiencies are variable, partly due to the factthat the concentrations of P tend to be close to the lower detection limit ofthe analysis procedure
< the length of the test (volume of manure separated) is a compromise - itdoes not allow for an evaluation of long-term performance (e.g. slimeproblems, mechanical breakdowns, deterioration of the equipment,gradual plugging, etc.) but it does allow for testing more than one manuretype, which is essential
< there was an attempt to get manure samples in a wider range of DMcontents - most separators would have higher efficiencies with higher DMmanure
< more samples should have been taken for the particle size distributionanalysis - there is too much variability in the test results to rely on only onesample of influent and effluent
Report created by: Ron Fleming and Malcolm MacAlpine - June 3, 2003Ridgetown College - University of Guelph
Tested by: Malcolm MacAlpine & Marcy FordRidgetown College - University of Guelph
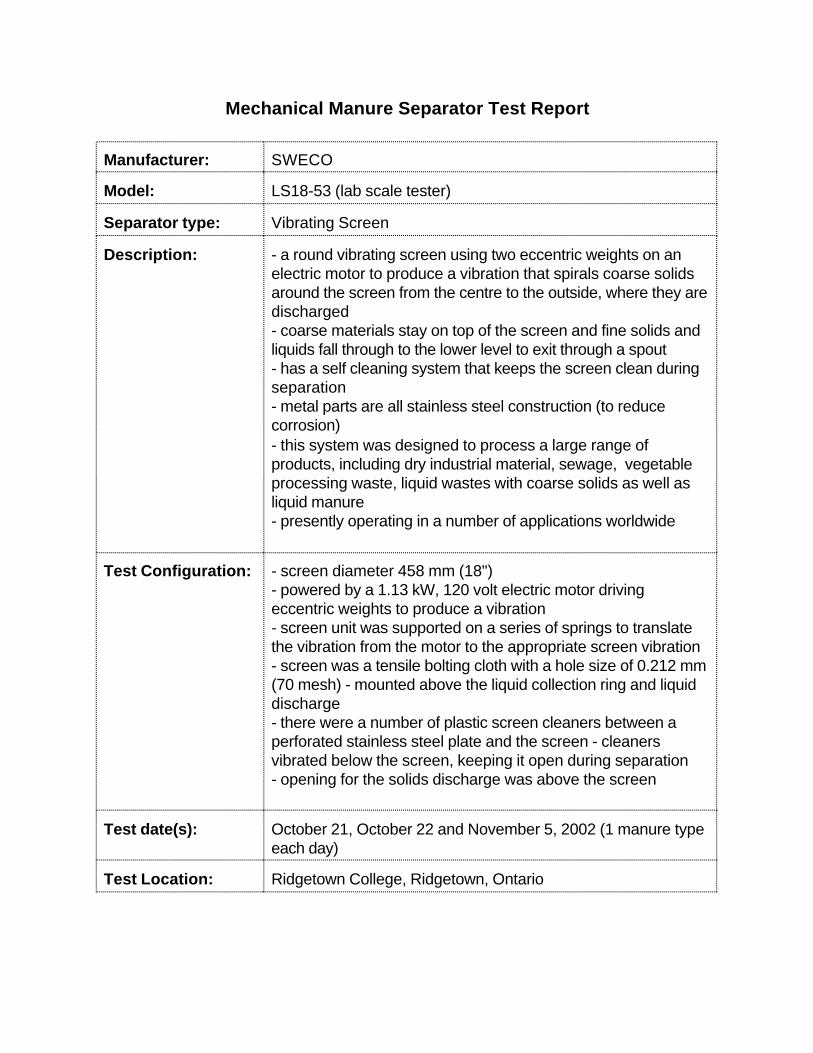
Mechanical Manure Separator Test Report
Manufacturer: SWECO
Model: LS18-53 (lab scale tester)
Separator type: Vibrating Screen
Description: - a round vibrating screen using two eccentric weights on anelectric motor to produce a vibration that spirals coarse solidsaround the screen from the centre to the outside, where they aredischarged- coarse materials stay on top of the screen and fine solids andliquids fall through to the lower level to exit through a spout- has a self cleaning system that keeps the screen clean duringseparation- metal parts are all stainless steel construction (to reducecorrosion)- this system was designed to process a large range ofproducts, including dry industrial material, sewage, vegetableprocessing waste, liquid wastes with coarse solids as well asliquid manure- presently operating in a number of applications worldwide
Test Configuration: - screen diameter 458 mm (18")- powered by a 1.13 kW, 120 volt electric motor drivingeccentric weights to produce a vibration- screen unit was supported on a series of springs to translatethe vibration from the motor to the appropriate screen vibration- screen was a tensile bolting cloth with a hole size of 0.212 mm(70 mesh) - mounted above the liquid collection ring and liquiddischarge- there were a number of plastic screen cleaners between aperforated stainless steel plate and the screen - cleanersvibrated below the screen, keeping it open during separation- opening for the solids discharge was above the screen
Test date(s): October 21, October 22 and November 5, 2002 (1 manure typeeach day)
Test Location: Ridgetown College, Ridgetown, Ontario

Test Setup: 1. There was agitation of the tank before and partial agitationduring the test.
2. For Manure 1 and 2, the influent manure was pumped ontothe centre of the vibrating screen using a 0.75 kW sludge pumpand a 51 mm plastic milkhouse hose with a ball valve to controlflow rates. Manure flow was monitored using a flow meter,giving total flow as well as the real time flow rate. For Manure 3,the manure was pumped from the manure tank into a smallerholding tank, then was added by hand (using a pail) to theSWECO separator. There was a limited amount of manureavailable (i.e.Manure 3) thus testing was not as extensive aswith the other manures.
3. The liquids were discharged into a tank and then pumped toa manure spreader or another tank. The solids weredischarged into plastic pails.
4. The solids flow rate was monitored by measuring the solidsvolume and mass separated. Separated Solids were collectedto determine their density, flow rate and total volume.
5. Samples were collected from the separated solids, liquidsand influent manure throughout the test for nutrient and bacteriatesting as well as particle size distribution.
Manure(s) tested: 1 - liquid swine manure 2 - liquid swine manure3 - liquid dairy manure
Test duration: Based on volume of manure separatedManure 1 16,250 LManure 2 2,940 LManure 3 2,000 L
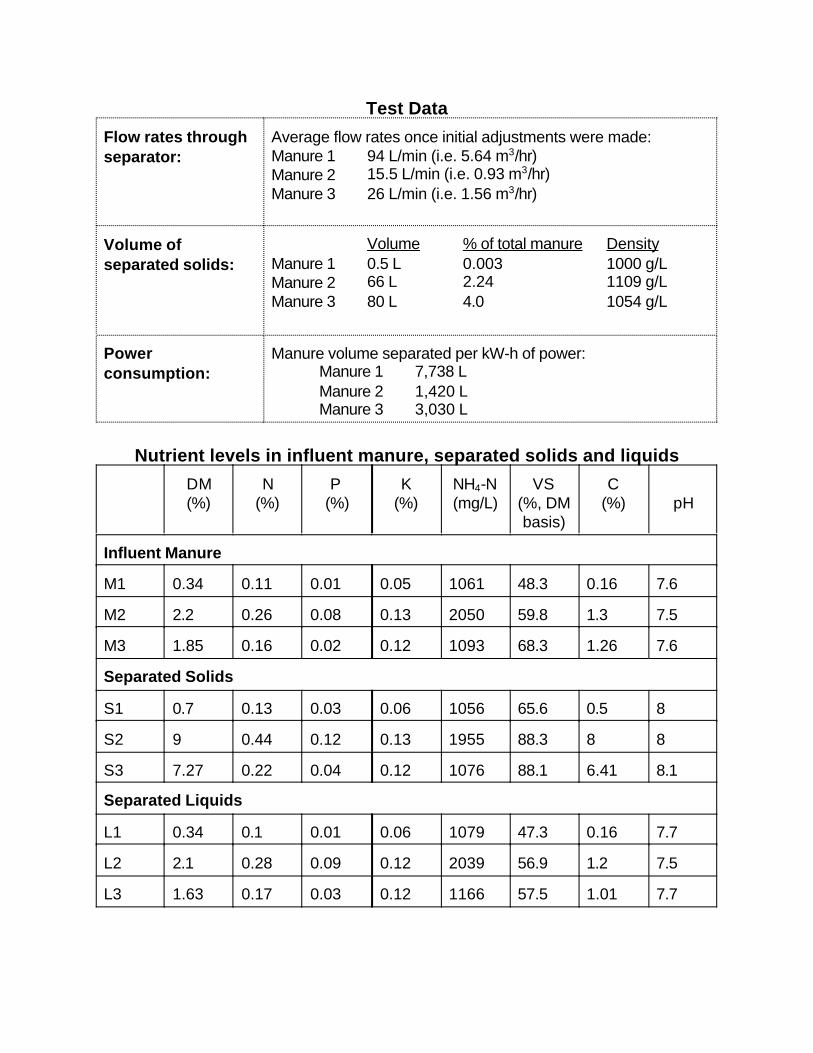
Test Data
Flow rates throughseparator:
Average flow rates once initial adjustments were made:Manure 1 94 L/min (i.e. 5.64 m3/hr)Manure 2 15.5 L/min (i.e. 0.93 m3/hr)Manure 3 26 L/min (i.e. 1.56 m3/hr)
Volume ofseparated solids:
Volume % of total manure DensityManure 1 0.5 L 0.003 1000 g/LManure 2 66 L 2.24 1109 g/LManure 3 80 L 4.0 1054 g/L
Powerconsumption:
Manure volume separated per kW-h of power:Manure 1 7,738 LManure 2 1,420 L Manure 3 3,030 L
Nutrient levels in influent manure, separated solids and liquids
DM(%)
N(%)
P (%)
K(%)
NH4-N(mg/L)
VS(%, DMbasis)
C(%) pH
Influent Manure
M1 0.34 0.11 0.01 0.05 1061 48.3 0.16 7.6
M2 2.2 0.26 0.08 0.13 2050 59.8 1.3 7.5
M3 1.85 0.16 0.02 0.12 1093 68.3 1.26 7.6
Separated Solids
S1 0.7 0.13 0.03 0.06 1056 65.6 0.5 8
S2 9 0.44 0.12 0.13 1955 88.3 8 8
S3 7.27 0.22 0.04 0.12 1076 88.1 6.41 8.1
Separated Liquids
L1 0.34 0.1 0.01 0.06 1079 47.3 0.16 7.7
L2 2.1 0.28 0.09 0.12 2039 56.9 1.2 7.5
L3 1.63 0.17 0.03 0.12 1166 57.5 1.01 7.7
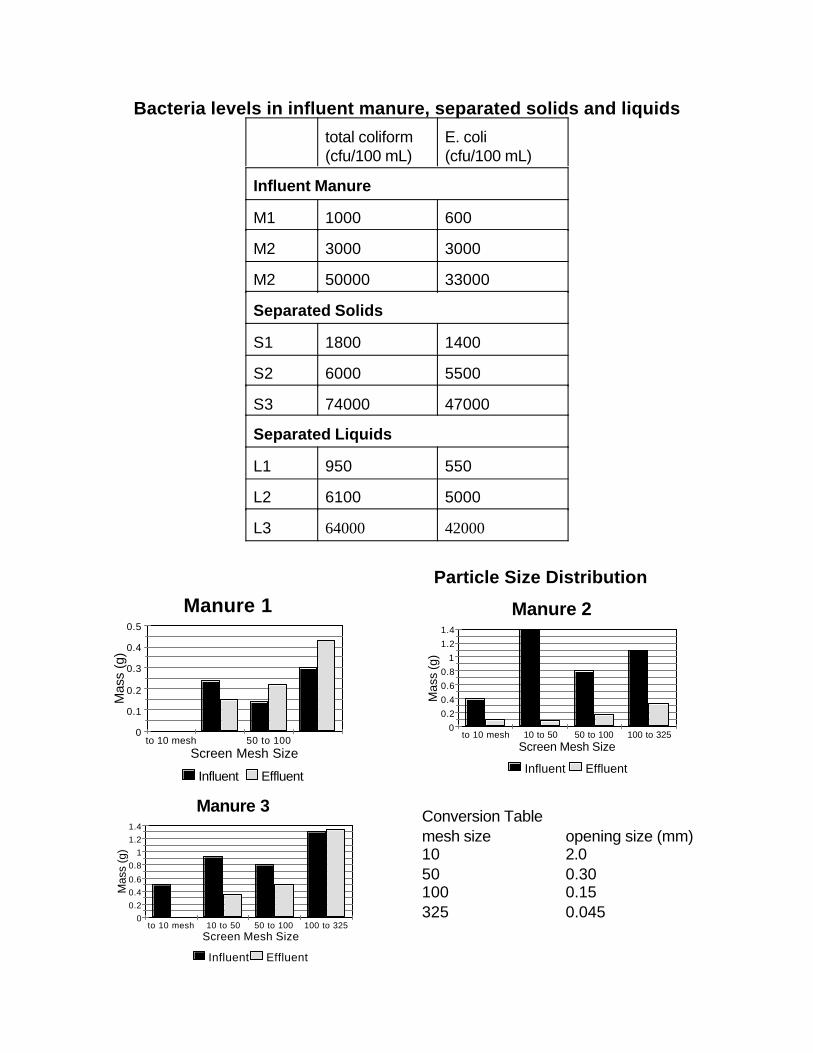
0
0.1
0.2
0.3
0.4
0.5
Mas
s (g
)
to 10 mesh 50 to 100Screen Mesh Size
Influent Effluent
Manure 1
0
0.2
0.4
0.6
0.8
1
1.2
1.4
Mas
s (g
)
to 10 mesh 10 to 50 50 to 100 100 to 325Screen Mesh Size
Influent Effluent
Manure 2
00.20.40.6
0.81
1.21.4
Mas
s (g
)
to 10 mesh 10 to 50 50 to 100 100 to 325Screen Mesh Size
Influent Effluent
Manure 3
Bacteria levels in influent manure, separated solids and liquids
total coliform(cfu/100 mL)
E. coli(cfu/100 mL)
Influent Manure
M1 1000 600
M2 3000 3000
M2 50000 33000
Separated Solids
S1 1800 1400
S2 6000 5500
S3 74000 47000
Separated Liquids
L1 950 550
L2 6100 5000
L3 64000 42000
Particle Size Distribution
Conversion Tablemesh size opening size (mm)10 2.050 0.30100 0.15325 0.045
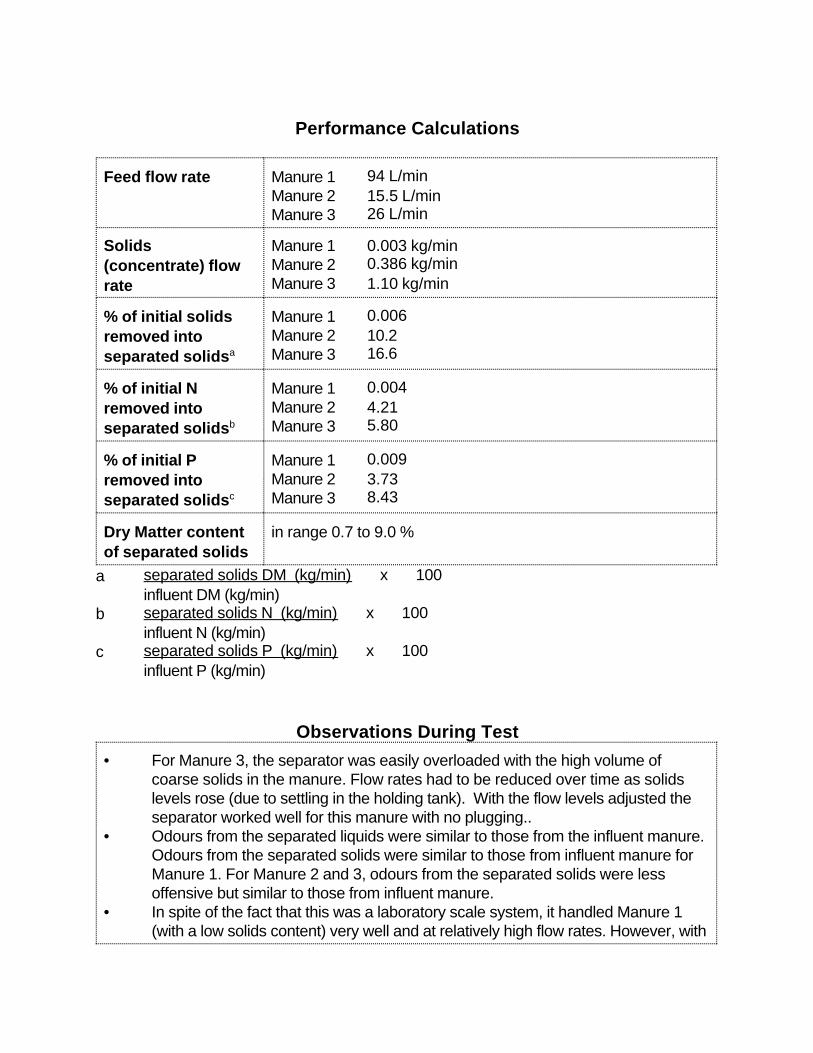
Performance Calculations
Feed flow rate Manure 1 94 L/minManure 2 15.5 L/minManure 3 26 L/min
Solids(concentrate) flowrate
Manure 1 0.003 kg/minManure 2 0.386 kg/minManure 3 1.10 kg/min
% of initial solidsremoved intoseparated solidsa
Manure 1 0.006Manure 2 10.2Manure 3 16.6
% of initial Nremoved intoseparated solidsb
Manure 1 0.004Manure 2 4.21Manure 3 5.80
% of initial Premoved intoseparated solidsc
Manure 1 0.009Manure 2 3.73Manure 3 8.43
Dry Matter contentof separated solids
in range 0.7 to 9.0 %
a separated solids DM (kg/min) x 100influent DM (kg/min)
b separated solids N (kg/min) x 100influent N (kg/min)
c separated solids P (kg/min) x 100influent P (kg/min)
Observations During Test
• For Manure 3, the separator was easily overloaded with the high volume ofcoarse solids in the manure. Flow rates had to be reduced over time as solidslevels rose (due to settling in the holding tank). With the flow levels adjusted theseparator worked well for this manure with no plugging..
• Odours from the separated liquids were similar to those from the influent manure. Odours from the separated solids were similar to those from influent manure forManure 1. For Manure 2 and 3, odours from the separated solids were lessoffensive but similar to those from influent manure.
• In spite of the fact that this was a laboratory scale system, it handled Manure 1(with a low solids content) very well and at relatively high flow rates. However, with
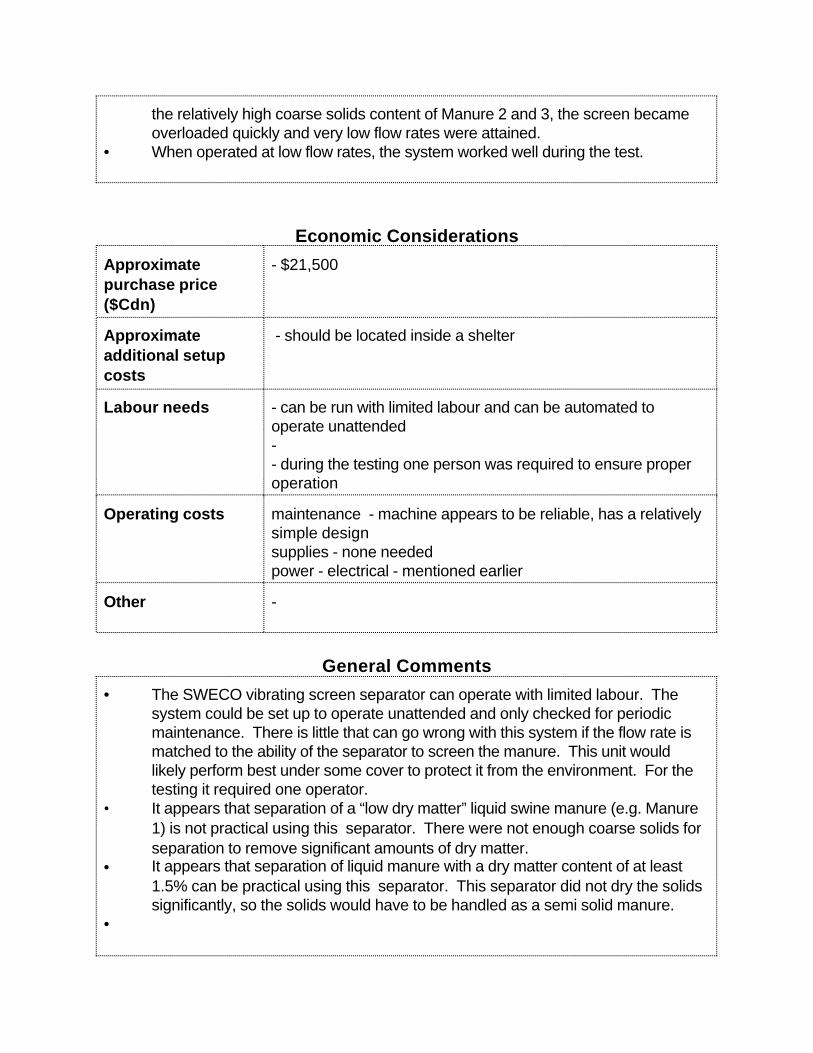
the relatively high coarse solids content of Manure 2 and 3, the screen becameoverloaded quickly and very low flow rates were attained.
• When operated at low flow rates, the system worked well during the test.
Economic Considerations
Approximatepurchase price($Cdn)
- $21,500
Approximateadditional setupcosts
- should be located inside a shelter
Labour needs - can be run with limited labour and can be automated tooperate unattended-- during the testing one person was required to ensure properoperation
Operating costs maintenance - machine appears to be reliable, has a relativelysimple designsupplies - none neededpower - electrical - mentioned earlier
Other -
General Comments
• The SWECO vibrating screen separator can operate with limited labour. Thesystem could be set up to operate unattended and only checked for periodicmaintenance. There is little that can go wrong with this system if the flow rate ismatched to the ability of the separator to screen the manure. This unit wouldlikely perform best under some cover to protect it from the environment. For thetesting it required one operator.
• It appears that separation of a “low dry matter” liquid swine manure (e.g. Manure1) is not practical using this separator. There were not enough coarse solids forseparation to remove significant amounts of dry matter.
• It appears that separation of liquid manure with a dry matter content of at least1.5% can be practical using this separator. This separator did not dry the solidssignificantly, so the solids would have to be handled as a semi solid manure.
•
Report created by: Ron Fleming and Malcolm MacAlpine - June 26, 2003Ridgetown College - University of Guelph
Tested by: Malcolm MacAlpineRidgetown College - University of Guelph
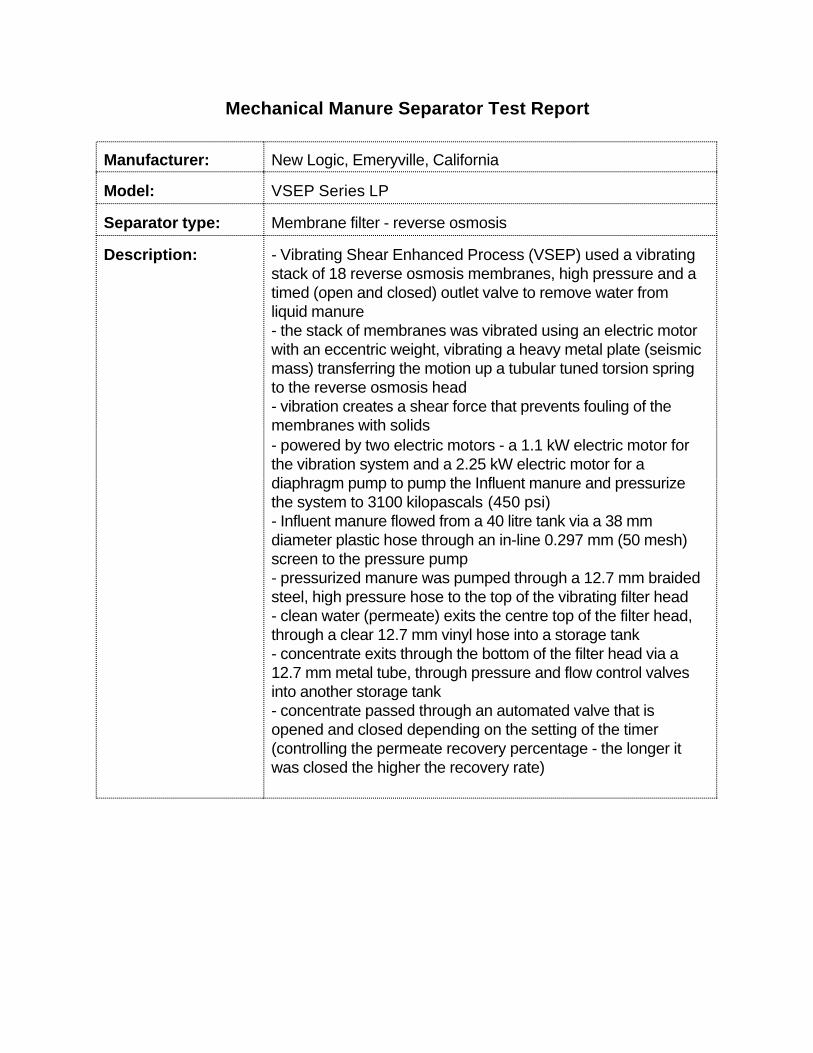
Mechanical Manure Separator Test Report
Manufacturer: New Logic, Emeryville, California
Model: VSEP Series LP
Separator type: Membrane filter - reverse osmosis
Description: - Vibrating Shear Enhanced Process (VSEP) used a vibratingstack of 18 reverse osmosis membranes, high pressure and atimed (open and closed) outlet valve to remove water fromliquid manure- the stack of membranes was vibrated using an electric motorwith an eccentric weight, vibrating a heavy metal plate (seismicmass) transferring the motion up a tubular tuned torsion springto the reverse osmosis head- vibration creates a shear force that prevents fouling of themembranes with solids- powered by two electric motors - a 1.1 kW electric motor forthe vibration system and a 2.25 kW electric motor for adiaphragm pump to pump the Influent manure and pressurizethe system to 3100 kilopascals (450 psi)- Influent manure flowed from a 40 litre tank via a 38 mmdiameter plastic hose through an in-line 0.297 mm (50 mesh)screen to the pressure pump- pressurized manure was pumped through a 12.7 mm braidedsteel, high pressure hose to the top of the vibrating filter head- clean water (permeate) exits the centre top of the filter head,through a clear 12.7 mm vinyl hose into a storage tank- concentrate exits through the bottom of the filter head via a12.7 mm metal tube, through pressure and flow control valvesinto another storage tank- concentrate passed through an automated valve that isopened and closed depending on the setting of the timer(controlling the permeate recovery percentage - the longer itwas closed the higher the recovery rate)
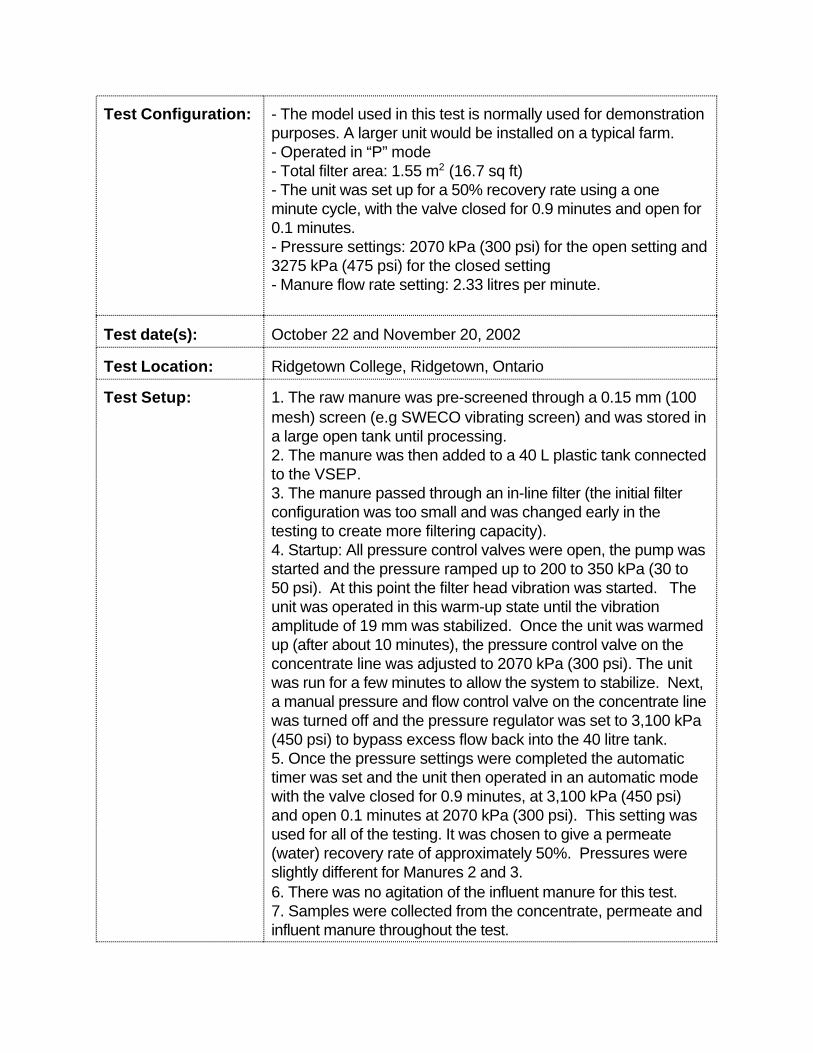
Test Configuration: - The model used in this test is normally used for demonstrationpurposes. A larger unit would be installed on a typical farm.- Operated in “P” mode- Total filter area: 1.55 m2 (16.7 sq ft)- The unit was set up for a 50% recovery rate using a oneminute cycle, with the valve closed for 0.9 minutes and open for0.1 minutes. - Pressure settings: 2070 kPa (300 psi) for the open setting and3275 kPa (475 psi) for the closed setting- Manure flow rate setting: 2.33 litres per minute.
Test date(s): October 22 and November 20, 2002
Test Location: Ridgetown College, Ridgetown, Ontario
Test Setup: 1. The raw manure was pre-screened through a 0.15 mm (100mesh) screen (e.g SWECO vibrating screen) and was stored ina large open tank until processing. 2. The manure was then added to a 40 L plastic tank connectedto the VSEP. 3. The manure passed through an in-line filter (the initial filterconfiguration was too small and was changed early in thetesting to create more filtering capacity). 4. Startup: All pressure control valves were open, the pump wasstarted and the pressure ramped up to 200 to 350 kPa (30 to50 psi). At this point the filter head vibration was started. Theunit was operated in this warm-up state until the vibrationamplitude of 19 mm was stabilized. Once the unit was warmedup (after about 10 minutes), the pressure control valve on theconcentrate line was adjusted to 2070 kPa (300 psi). The unitwas run for a few minutes to allow the system to stabilize. Next,a manual pressure and flow control valve on the concentrate linewas turned off and the pressure regulator was set to 3,100 kPa(450 psi) to bypass excess flow back into the 40 litre tank.5. Once the pressure settings were completed the automatictimer was set and the unit then operated in an automatic modewith the valve closed for 0.9 minutes, at 3,100 kPa (450 psi)and open 0.1 minutes at 2070 kPa (300 psi). This setting wasused for all of the testing. It was chosen to give a permeate(water) recovery rate of approximately 50%. Pressures wereslightly different for Manures 2 and 3. 6. There was no agitation of the influent manure for this test. 7. Samples were collected from the concentrate, permeate andinfluent manure throughout the test.

Manure(s) tested: 1 - liquid swine manure 2 - liquid swine manure3 - liquid dairy manure
Test duration: Based on TimeManure 1 3.5 h (460 L)Manure 2 4.0 h (465 L)Manure 3 4.75 h (600 L)
Test Data
Flow rates throughseparator:
Average flow rates once initial adjustments were made:Manure 1 2.3 L/min (i.e. 0.14 m3/hr)Manure 2 1.9 L/min (i.e. 0.11 m3/hr)Manure 3 2.1 L/min (i.e. 0.13 m3/hr)
Volume ofseparated solids:
Volume % of total manure DensityManure 1 250 L 54.3% 1000 g/LManure 2 269 L 57.8% 1000 g/LManure 3 342 L 57.0% 1000 g/L
Powerconsumption:
Manure volume separated per kW-h of power:Manure 1 82 LManure 2 86 L Manure 3 94 L

Nutrient levels in influent manure, separated solids and liquids
DM(%)
N(%)
P (%)
K(%)
NH4-N(mg/L)
VS(%)
C(%) pH
Influent Manure (measured) *
M1 0.34 0.1 0.01 0.06 1079 47.3 0.16 7.7
M2 2.09 0.28 0.09 0.12 2039 56.9 1.19 7.5
M3 1.63 0.17 0.03 0.12 1166 57.5 1.01 7.7
Influent Manure (calculated) **
M1 0.3 0.09 0 0.05 971 NA NA 7.5
M2 0.53 0.13 0.01 0.06 1347 NA NA 7.8
M3 0.67 0.07 0.01 0.06 492 NA NA 7.5
Separated Solids (concentrate)
S1 0.55 0.17 0.01 0.09 1755 45.5 0.25 7.8
S2 0.91 0.22 0.02 0.11 2303 40.4 0.37 7.9
S3 1.18 0.12 0.02 0.11 863 65.8 0.77 7.7
Separated Liquids
L1 0 0 0 0 38.3 NA NA 7.2
L2 0 0.1 0 0 34.7 NA NA 7.6
L3 0 0 0 0 0 0 0 7.3
* a well-mixed manure sample was submitted for testing** due to settling in the manure storage prior to passing through the machine, the
membrane filter did not receive well-mixed manure - the calculated value, based onconservation of mass, more accurately describes the Influent manure that the unitreceived
Note: The nutrients, dry matter and bacteria levels were often below the detectable limit forthe separated liquids (i.e. permeate) and were reported as 0 by the lab.
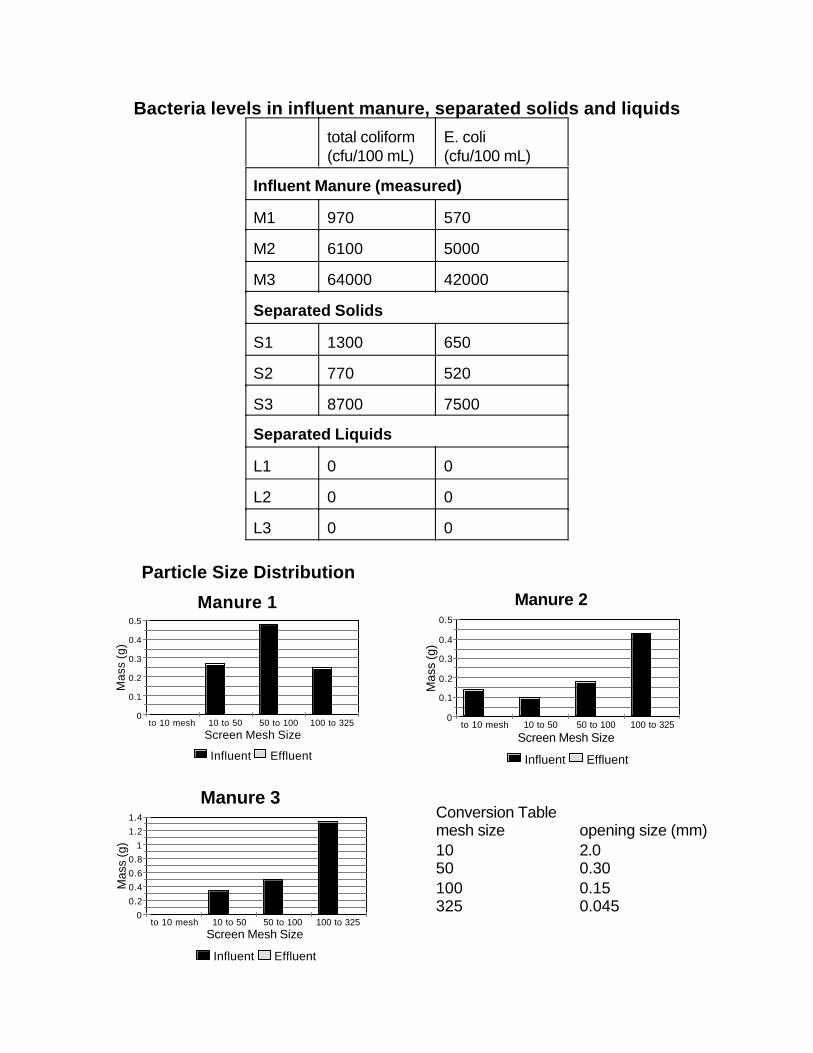
0
0.1
0.2
0.3
0.4
0.5
Mas
s (g
)
to 10 mesh 10 to 50 50 to 100 100 to 325Screen Mesh Size
Influent Effluent
Manure 1
0
0.1
0.2
0.3
0.4
0.5
Mas
s (g
)
to 10 mesh 10 to 50 50 to 100 100 to 325Screen Mesh Size
Influent Effluent
Manure 2
0
0.2
0.4
0.6
0.8
1
1.2
1.4
Mas
s (g
)
to 10 mesh 10 to 50 50 to 100 100 to 325Screen Mesh Size
Influent Effluent
Manure 3
Bacteria levels in influent manure, separated solids and liquids
total coliform(cfu/100 mL)
E. coli(cfu/100 mL)
Influent Manure (measured)
M1 970 570
M2 6100 5000
M3 64000 42000
Separated Solids
S1 1300 650
S2 770 520
S3 8700 7500
Separated Liquids
L1 0 0
L2 0 0
L3 0 0
Particle Size Distribution
Conversion Tablemesh size opening size (mm)10 2.050 0.30100 0.15325 0.045
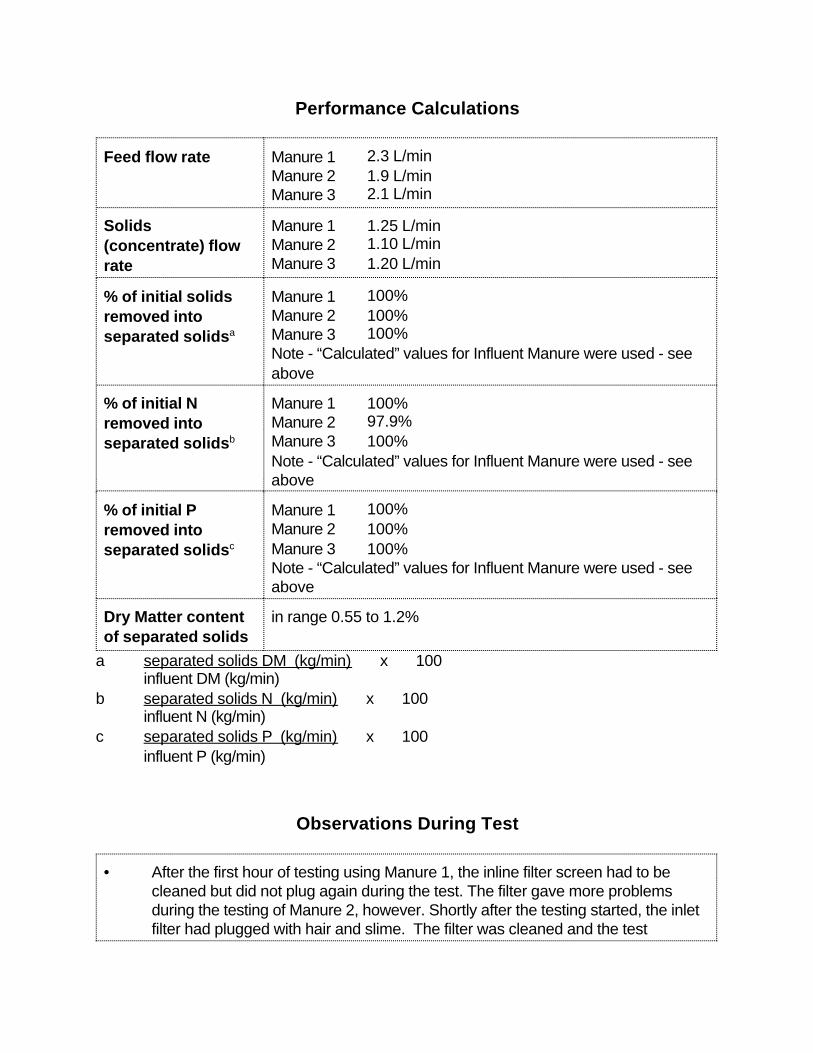
Performance Calculations
Feed flow rate Manure 1 2.3 L/minManure 2 1.9 L/minManure 3 2.1 L/min
Solids(concentrate) flowrate
Manure 1 1.25 L/minManure 2 1.10 L/minManure 3 1.20 L/min
% of initial solidsremoved intoseparated solidsa
Manure 1 100%Manure 2 100%Manure 3 100%Note - “Calculated” values for Influent Manure were used - seeabove
% of initial Nremoved intoseparated solidsb
Manure 1 100%Manure 2 97.9%Manure 3 100%Note - “Calculated” values for Influent Manure were used - seeabove
% of initial Premoved intoseparated solidsc
Manure 1 100%Manure 2 100%Manure 3 100%Note - “Calculated” values for Influent Manure were used - seeabove
Dry Matter contentof separated solids
in range 0.55 to 1.2%
a separated solids DM (kg/min) x 100influent DM (kg/min)
b separated solids N (kg/min) x 100influent N (kg/min)
c separated solids P (kg/min) x 100influent P (kg/min)
Observations During Test
• After the first hour of testing using Manure 1, the inline filter screen had to becleaned but did not plug again during the test. The filter gave more problemsduring the testing of Manure 2, however. Shortly after the testing started, the inletfilter had plugged with hair and slime. The filter was cleaned and the test
restarted. The filter again plugged within 10 minutes. This was repeated severalmore times with the same results. The tank was then drained and refilled withscreened liquid manure from the same storage tank. It was apparent that thevibrating screen used to pre-filter the manure was allowing hairs to pass through.This newly-screened manure was then tried in the separator but the filter againplugged within 10 minutes. This time slime had smeared over the filter holes. The filter was cleaned again and the test restarted. The filter again plugged withslime within 10 minutes of operation. The test was then shut down so that NewLogic could find a solution. Two larger filters were installed so they could operateindependent of each other (i.e. if one filter plugged, it could be removed from thesystem without shutting down the unit). For Manure 3, the inline filter neededcleaning after about 30 minutes of testing but did not plug again until the end ofthe test. At this point some manure with a higher solids content entered thesystem and plugged the in-line filters.
• Manure was pumped from the holding tank into the VSEP tank with no agitation. Due to the delays working with Manure 2, a portion of the solids was allowed tosettle out in the holding tank. Some settling also occurred with Manure 3.
• The electrical conductivity of the permeate ranged from 109 to 128microsiemens/cm2 for Manure 1, from 100 to 110 microsiemens/cm2 for Manure2 and from 39 to 50 microsiemens/cm2 for Manure 3.
• The temperature of the manure tested was 19 oC for Manure 1, 8 to 10 oC forManure 2, and 4 to 9 oC for Manure 3.
• The vibrating frequency was in the range 50.6 to 50.8 hertz and motor load was inthe range 27% to 34% for the three manures tested.
• Odours from the concentrated solids were similar to the influent manure. Thepermeate (water) had a slight ammonia odour as well as a slight sulfur odour. After the permeate stood for a few hours odours were no longer detected.
Economic Considerations
Approximatepurchase price($Cdn)
approximately $90,000 Cdn
Approximateadditional setupcosts
- a pre-filter will be needed in most cases and this could takethe form of a more traditional manure separator (such as avibrating screen)
Labour needs - During the testing one person was required to ensure properoperation
Operating costs maintenance - The manure must be pre-screened to removecoarse solids so there would be a separate system to monitoras well as the VSEP. The pre-filtration system must bemonitored so it does not plug. The pressure system with it’spump, high pressure hoses, flow and pressure control valvesmust be regularly checked. The vibration system, the motor,seismic mass, tuned torsion spring, and filter pack requireregular monitoring. The filter pack bolts and nuts must betorqued regularly. The electronic controls must be adjusted asneeded to the required settings and the filter pack must beflushed with fresh water, an acid wash, a fresh water flush, acaustic wash and a fresh water flush after about 48 hours ofoperation or when flow starts declining. The commercialsystems are fully automated, removing the need for most of thismaintenance such as tightening the filter head, monitoring theelectronics and flushing the filter pack. supplies - chemicals for regular cleaning of the filter pack power - electrical power to operate the VSEP unit plus any pre-filter and transfer pumps
Other - the filtered water could be used in the barn, and thus may havea value to the farmer in offsetting the need for other fresh water- manure must still be spread on the fields (likely scenario) butsince it is reduced in volume (and nutrients are moreconcentrated) labour and equipment costs associated withspreading are reduced
General Comments
• The VSEP shows potential as a way to treat dilute livestock manure. It removedpathogens, most of the nutrients and dissolved salts. This potentially makes thepermeate useful as drinking water for livestock or wash water in barns. Theconcentrate contains virtually all of the nutrients from the influent manure. With theVSEP operating at a 50% recovery rate, as in the test setup, half of the influentmanure goes to a clean water stream and half is a concentrated liquid manure.Other recovery rates are possible - however, higher water recovery rates woulddecrease the throughput rate.
• In part of the test, manure solids settled out in the temporary holding tank. Therewas no effective way to agitate this manure before it passed through the VSEPunit. On the other hand, the influent manure sample submitted for lab analysis wasagitated, and contained some of the dense solids that had settled out. The
manure filtered through the VSEP was drawn from the top 3/4 of the tank. Itappeared that this settling was an advantage for the machine configuration in thistest - “pre-screening” plus “settling” seem to represent the desirable manurepreparation steps for this unit.
• Reverse osmosis membranes were used in this test - other membranes areavailable and they would affect throughput rate and effluent quality.
• Comments on test procedure: < the handling process for influent manure should be modified - a system is
needed to ensure constant agitation of the influent manure (was not alwayspossible) or else more samples of influent manure must be collected(instead of one composite sample) - these individual samples should bematched with corresponding samples of separated solids and liquids
< the length of the test (volume of manure separated) is a compromise - itdoes not allow for an evaluation of long-term performance (e.g. slimeproblems, mechanical breakdowns, deterioration of the equipment,gradual plugging, etc.) but it does allow for testing more than one manuretype, which is essential
< there was an attempt to get manure samples in a wider range of DMcontents - most separators would have higher efficiencies with higher DMmanure
< more samples should have been taken for the particle size distributionanalysis - there is too much variability in the test results to rely on only onesample of influent and effluent
Report created by: Ron Fleming and Malcolm MacAlpine - June 3, 2003Ridgetown College - University of Guelph
Tested by: Malcolm MacAlpine
- in consultation with: Roger Torres (New Logic) and Jim Morris (Rondeau Anaerobics)