evaluation of molybdenum as an electrode material for
TRANSCRIPT
EVALUATION OF MOLYBDENUM AS AN ELECTRODE MATERIAL FOR
AFFINITY BASED URINE DIPSTICK BIOSENSING
by
Vikramshankar Kamakoti
APPROVED BY SUPERVISORY COMMITTEE:
___________________________________________
Dr. Shalini Prasad, Chair
___________________________________________
Dr. Hyun-Joo Nam
___________________________________________
Dr. Anjan Panneer Selvam
___________________________________________
Dr. Todd W. Polk

Copyright 2017
Vikramshankar Kamakoti
All Rights Reserved

Dedicated to my family

EVALUATION OF MOLYBDENUM AS AN ELECTRODE MATERIAL FOR
AFFINITY BASED URINE DIPSTICK BIOSENSING
by
VIKRAMSHANKAR KAMAKOTI, B.TECH, MS
DISSERTATION
Presented to the Faculty of
The University of Texas at Dallas
in Partial Fulfillment
of the Requirements
for the Degree of
DOCTOR OF PHILOSOPHY IN
BIOMEDICAL ENGINEERING
THE UNIVERSITY OF TEXAS AT DALLAS
August 2017

v
ACKNOWLEDGMENTS
I thank my advisor, Dr.Shalini Prasad for guiding me in my research throughout the PhD program.
I thank Dr.Anjan Panneer Selvam for mentoring me during the PhD program. My sincere thanks
to other committee members Dr. Polk and Dr. Nam for their acceptance to serve on my supervising
committee in my PhD program. I thank you for the constructive criticism in my research. I express
my sincere thanks to Dr. Rajeshwari Taruvai Kalyana Kumar and Dr. Nandhinee Radha
Shanmugam for providing constructive criticism to my research work. I thank Dr. Vinay J. Nagaraj
for his guidance in a collaborative research work. I would like to thank my friends Badrinath
Jagannath, Ambalika Sanjeev Tanak, Ashlesha Bhide, David Kinnamon, Jonathan E. Craven and
Dr. Rujuta Munje for their support and encouragement during my PhD program.
Finally I thank my parents and my elder sisters for their support throughout my education.
July 2017

vi
EVALUATION OF MOLYBDENUM AS AN ELECTRODE MATERIAL FOR
AFFINITY BASED URINE DIPSTICK BIOSENSING
Vikramshankar Kamakoti, PhD
The University of Texas at Dallas, 2017
ABSTRACT
Supervising Professor: Dr. Shalini Prasad
The work presented in this dissertation focuses on evaluation and characterization of molybdenum
(Mo) as an electrode material for affinity based biosensing applications. The material properties
of the electrode material dictate the performance of electrochemical biosensors. Mo demonstrates
electrochemical properties upon its interaction with electrolytes. Here, we have evaluated the
electrochemical properties of Mo for use in affinity based biosensors. Surface characterization of
deposited Mo electrode helps us to evaluate the efficiency of fabrication process conditions.
The deposition profile of Mo on the flexible polyamide (PA) substrate was characterized through
Scanning Electron Microscopy (SEM) and Atomic Force Microscopy (AFM) techniques. A label-
free immunoassay was designed for detection of target biomolecules. A monolayer of crosslinker
was formed on the Mo electrode surface. Thiol and carbodiimide crosslinker chemistries were
evaluated with Mo electrode. The characterization of chemical affinity between Mo and
crosslinker molecules is required to understand the effectiveness of crosslinker monolayer
formation on the electrode surface. The affinity between electrode and crosslinker molecules were
characterized through Fourier Transform Infrared Spectroscopy (FTIR), Fluorescence microscopy
and X-ray photoelectron spectroscopy (XPS). The binding affinity between antibody and
vii
crosslinker molecules was also characterized using FTIR technique. The form factor of the
biosensor was modified as a dipstick to detect inflammatory biomarkers namely Interleukin (IL-
6) and C-reactive protein (CRP). The effect of variable pH of the synthetic urine on the detection
of CRP and Il-6 was evaluated using Electrochemical Impedance Spectroscopy (EIS) technique.
The portability of the biosensor was demonstrated using customized electronics hardware
assembly. The impedance response from the electronics hardware was compared against standard
potentiostat systems.

viii
TABLE OF CONTENTS
ACKNOWLEDGMENTS.…………………………………………………………………...........v
ABSTRACT……………………………………………………………………………….............vi
LIST OF FIGURES………………………………………………………………………………...x
LIST OF TABLES……………………………………………………………………………......xii
CHAPTER 1 INTRODUCTION .....................................................................................................1
Characteristics of molybdenum .................................................................................3
Suitability of Mo for biosensing applications ...........................................................5
Deposition of molybdenum thin films .......................................................................6
Electrochemical affinity based biosensing with Mo electrode ..................................7
CHAPTER 2 MATERIALS AND METHODS ...............................................................................8
Introduction ...............................................................................................................8
Substrate material ......................................................................................................8
Sensor fabrication ......................................................................................................9
Crosslinker functionalization on Mo electrode .........................................................9
Transduction techniques for biosensing applications ..............................................11
Electrochemical Impedance Spectroscopy (EIS) technique ....................................12
Inflammatory biomarkers detection in urine ...........................................................13
CHAPTER 3 NOVELTY OF THE DISSERTATION ...................................................................15
Novelty in Electrode Material .................................................................................15
Novelty in Mo-crosslinker interaction ....................................................................15
Novelty in application to electrochemical dipstick urine biosensor design ............15
CHAPTER 4 FLEXIBLE MOLYBDENUM ELECTRODES TOWARDS DESIGNING
AFFINITY BASED PROTEIN BIOSENSORS .......................................................16
Prior Publication .......................................................................................................16

ix
Abstract .....................................................................................................................16
Introduction ...............................................................................................................17
Materials and Methods ..............................................................................................21
Results…. ..................................................................................................................28
Discussion .................................................................................................................37
Conclusions ...............................................................................................................39
CHAPTER 5 INVESTIGATION OF MOLYBDENUM-CROSSLINKER INTERFACES FOR
AFFINITY BASED ELECTROCHEMICAL BIOSENSING APPLICATIONS ....40
Prior Publication .........................................................................................................40
Abstract ......................................................................................................................40
Introduction ................................................................................................................41
Experimental Section .................................................................................................44
Results and Discussion ...............................................................................................48
Conclusion ..................................................................................................................63
CHAPTER 6 PORTABLE ELECTROCHEMICAL DIPSTICK BIOSENSOR USING
MOLYBDENUM ELECTRODE FOR DETECTION OF INFLMMATORY
BIOMARKERS ..........................................................................................................65
Abstract ......................................................................................................................65
Introduction ................................................................................................................65
Materials and Methods ...............................................................................................71
Results and Discussion ...............................................................................................74
Conclusions ................................................................................................................80
CHAPTER 7 CONCLUSION .........................................................................................................81
APPENDIX………………………………………………………….……………………………83
REFERENCES……………………………………………………………………………..……..85
BIOGRAPHICAL SKETCH……………………………………………………………………...97
CURRICULUM VITAE……………………………………………………………………….....98

x
LIST OF FIGURES
Figure 1. Structure of DSP crosslinker molecule...........................................................................10
Figure 2. EDC and NHS crosslinker structure ...............................................................................10
Figure 3. Randles equivalent electrical circuit ...............................................................................12
Figure 4. Material characterization of Mo biosensor. ....................................................................23
Figure 5. Biosensor design and electrical circuit model ................................................................27
Figure 6. Antibody conjugation analysis .......................................................................................30
Figure 7. Magnitude and Phase analysis of Mo sensor ..................................................................32
Figure 8. Calibration dose response analysis on Mo sensor ..........................................................34
Figure 9. Electrical prototype of an optical reader for cTnI detection ...........................................37
Figure 10. Molybdenum crosslinker binding chemistry ................................................................49
Figure 11. Contact angle measurements ........................................................................................50
Figure 12. Optical characterization of binding of Fluorescent molecule 123 ................................52
Figure 13. FTIR characterization on crosslinker functionalization ...............................................54
Figure 14. XPS spectra on Molybdenum and Oxygen ..................................................................56
Figure 15. XPS spectra of Carbon and Nitrogen ...........................................................................58
Figure 16. Electrochemical characterization of Molybdenum electrode .......................................60
Figure 17. EIS characterization for CRP detection ........................................................................62
Figure 18. Schematic representation of dipstick biosensor ...........................................................70
Figure 19. FTIR spectra of antibody binding on crosslinker functionalized Mo surface ..............75
Figure 20. Detection of CRP and IL-6 in synthetic urine with varying pH ...................................77
Figure 21. Dose response analysis for CRP and IL-6 detection in human urine ...........................78

xi
Figure 22. Linear impedance correlation between electronic device and lab instrument. .............80
Figure 23. Nyquist and Bode Phase analysis for IL-6 and CRP detection ....................................83

LIST OF TABLES
Table 1. Comparison of immunoassay performance for cTnI detection .......................................20
Table 2. Comparison of position of Mo peaks in cross-linker in cross-linker functionalized
samples ...............................................................................................................................59
Table 3. Estimation of experimental data-fit parameters ...............................................................63
Table 4. Prior work in the detection of inflammatory biomarkers ................................................68
1
CHAPTER 1
INTRODUCTION
Biosensors are standalone devices which provide analytical information on a target biomolecule.1
The biosensor consists of three sub-systems namely the biological recognition element, transducer
element and the signal processing element. The design of biosensors involves solving technical
challenges in these three sub-systems and it involves multi-disciplinary knowledge in the fields of
material science, biology and electrical engineering. The specificity of the biosensor is principally
governed by the biological recognition element. Antibodies and Nucleic Acid probes are the most
prominent recognition elements which have been evaluated in the design of biosensors. The
binding event between the target biomolecules and the biological recognition element is captured
by transducer element. There are various transduction methods (optical, electrochemical,
piezoelectric etc.) which have been employed to convert the signal from the target analyte to the
detector system. The signal processing element is critical for efficient readout of the measured
signal. The rest of this chapter explains the significance of label-free biosensors and discusses the
properties of Mo which are relevant for their evaluation in electrochemical biosensors. Chapter 2
discusses the fabrication of molybdenum electrodes and signal transduction principles. Chapter 3
describes the novelty of this work and relevance of this research towards designing affinity based
biosensors. Chapter 4 describes the surface morphology analysis of Mo electrodes and explains its
application for demonstrating of electrochemical biosensing. Chapter 5 explains the chemical
interactions between Mo and crosslinker molecules towards the formation of crosslinker

2
monolayer. Chapter 6 explains the application of Mo for design of electrochemical dipstick
biosensors for detection of inflammatory biomarkers in urine.
Labeled and label-free based biosensors are primary classifications of affinity based biosensors.
Label-based biosensors involves the tagging of a label to the target analyte.2 The quantitative
measurement of the labels post the biomolecular binding is estimated to correspond to the target
analyte’s concentration. However, the variability in the analyte and label binding properties might
lead to output readout errors. Label-free biosensors enable real-time monitoring of biomolecular
binding which favor their use in point of care applications.
The point of care (PoC) biosensors are used for home or clinic based diagnostic systems for
obtaining useful information regarding early disease diagnosis and prognosis. The advent of PoC
biosensors has enabled quick access to healthcare in a resource challenged environment. These
devices enable rapid diagnosis of target analytes and hence there is no requirement for sample
transport to laboratories for analysis. Thus, the patient has the scope for knowing results of the
testing instantly. This feature has greatly enabled in improving the quality of life of patients, and
it also helps in saving causalities occurring from fatal diseases. The form factor of the PoC devices
are significantly lower than the conventional laboratory diagnosis equipments.3 The portable
diagnostic devices do not generally require complex sample preparation techniques which
facilitates their use in home based monitoring and diagnosis of the physiological condition. The
sensor cartridges of PoC biosensors are generally disposable which greatly reduces the cleaning
requirements of the instrumentation hardware. The output of these devices are designed for easy
interpretation in a qualitative or quantitative way. Colorimetric biosensors are an example of
qualitative biosensors wherein the output from the biomolecular binding is reflected as changes in

3
the color. The variability in the changes in the color gradient is one of the critical challenges of the
colorimetric based biosensors. Electrical biosensors provide quantitative output in terms of
voltage/current changes. They are classified as voltammetry, amperometric or impedance based
biosensors. Impedance based biosensors are favored for ease with portability, ease of integration
with external hardware, low cost and the ability to provide quantitative output results. The
electrochemical properties of electrode material greatly influence the output signal response of the
biosensor. Hence, it is favorable to evaluate elements which demonstrate favorable
electrochemical properties. In this regard, the electrochemical properties demonstrated by Mo on
its interaction with electrolyte support their evaluation as electrode material in affinity based
electrochemical biosensors.
The objective of this work is to evaluate molybdenum (Mo) as an electrode material for affinity
based electrochemical biosensing application. Flexible nanoporous polyamide (PA) membranes
have been used as the sensor substrate.
Characteristics of molybdenum
Molybdenum (Mo) is a refractory metal belonging to the transition group of elements and
demonstrates BCC crystalline structure.4 It possess low wear resistance, good thermal and
electrical conducting properties. It is also considered a favorable alloying element as it increases
mechanical properties of the alloy.5 A thin passive surface oxide is formed on the molybdenum
surface which attributes to its high corrosion resistance. Molybdenum oxides find wide
applications like electrocatalysis, lithium ion batteries, gas sensors, capacitors, fuel cells and other
applications. The change in conductance of molybdenum oxide upon the adsorption/reaction is the
basis to apply it for gas sensing applications. Mo possesses good electrical conductivity properties

4
and has been used as a bottom electrode material in bulk acoustic resonator applications.6 Mo has
been used as a gate electrode in thin film transistors.7 Thicker electrical double layer has been
observed for molybdenum electrode compared to Nickel and Platinum in the hydrogen production
through water electrolysis in 1-butyl-3-methylimidazolium tetra fluoroborate (BMI.BF4) through
Electrochemical Impedance Spectroscopy (EIS) technique.8 Molybdenum exhibits multiple
oxidation states from II to VI and hence it demonstrates rich binding chemistry which facilitates
the formation of multiple compounds with varying stoichiometry. Another significant property of
Mo is the phenomena of pseudocapacitance demonstrated by Mo.5 The compounds of
molybdenum have also been found applications in semiconductor industry. Transition metal
dichalcogenides (TMDs) have been used as an electrocatalysts.9 Molybdenum Disulphide (MoS2)
has many industrial and research applications. It has been used as a gate material in Field Effect
Transistors (FET).10 The earliest industry applications of MoS2 include their use as extreme
pressure lubricants.11 It has been used a solid lubricant and has been used in combination with
hydrophobic and hydrophilic media and has been used as a dry film lubricant. It is added as a
thermoplastics as a nucleating agent as it enhances mechanical properties. It has also been used in
high density batteries. Molybdate (sodium molybdate) has been used as smoke suppressants. The
thermal expansion of Mo is comparable with that of Silicon and hence it has been used in
semiconductor applications. Mo possess good corrosion resistance against acids and therefore used
in autoclave liners, funnels etc. The catalytic effect of molybdenum carbide is utilized in the
development of solar cells.12 Molybdenum silicides have been used in the production of oxygen
protecting films owing to their corrosion and oxidation resistance. Molybdenum chloride have

5
been used for the detection of molecular oxygen due to their favorable optical and physical
properties.13
Suitability of Mo for biosensing applications
Mo demonstrates good electrical conducting properties. The favorable electrochemical properties
of Mo and its oxides have been applied to their use as an electrode material in fuel cells. They are
used as an anode material in Lithium ion batteries owing to their high energy storage capacity.
There has been a growing interest in MoS2 based biosensors for quantification of analytes.14 The
formation of passive surface oxide layer on molybdenum electrode surface is a critical challenge
in the formation of monolayer of crosslinkers towards building affinity based biosensor. The
choice of crosslinkers is restricted to the use of those crosslinker molecules which have affinity to
bind to oxygen site of molybdenum surface. Mo forms oxide compounds with varied stoichiometry
which is correlated with its oxidation state. The molybdenum trioxide (MoO3) is the oxidation
product of other oxide compounds and is commonly observed as α layered structures. MoO3 can
accommodate amine and alcohol functional groups which is favorable for the formation of a
chemical conjugate with organic functional groups of the crosslinkers. Mo is also a constituent in
many enzymes and its presence is ubiquitous in the environment. These enzymes exhibit chemical
affinity towards organic functional groups during various biochemical reactions inside the human
body.15 Thus, the favorable properties demonstrated by Mo and its compounds support its
evaluation as an electrode material for development of electrochemical biosensors.

6
Deposition of molybdenum thin films
Electron beam evaporation, DC and RF sputtering are the most commonly reported deposition
methods for the development of Mo thin films. The optimization of process parameters is a critical
step which govern the nature of the deposition profile and physical properties of thin films.16 Many
researches have evaluated the effect of process parameters by varying the deposition power,
duration of deposition, method of deposition, presence of inert gases, presence of oxygen etc. The
variation of these parameters might affect the conductive and material properties of the Mo thin
films. The resistivity of the thin film is dependent on deposition power. In DC magnetron
sputtering technique, higher deposition power yielded thin films with low electrical resistivity.17
The adhesion of Mo thin films could also enhanced by increasing the deposition power.18 It has
been demonstrated that the Argon (Ar) pressure has a direct relation with electrical sheet
resistance.19 The nature of the thin film is dependent on the application for which the Mo thin film
is being deposited. For Impedimetric biosensing applications, conductive thin films are desired as
it enhances the conduction of current resulting from biomolecular binding. The characterization of
deposition profile post fabrication is imperative in understanding the efficiency of the deposition
technique and accordingly optimize the process parameters.
In this work, we have achieved planar deposition of Mo on flexible nanoporous polyamide
substrate through electron beam evaporation technique. The rate of deposition was maintained
constant for the deposition process and a thickness of 100 nm was achieved.

7
Electrochemical affinity based biosensing with Mo electrode
Affinity based biosensing of electrochemical biosensors is dependent on signal transduction
resulting from biomolecular binding. Metal electrodes have been used for affinity based
electrochemical biosensors due to its favorable electrical conducting properties. Gold has been
preferred choice of electrode material in many affinity based electrochemical biosensors due to
inert nature and favorable binding affinity to crosslinkers.20 There has been a growing research in
other transition group elements which demonstrate excellent electrochemical properties.
Molybdenum demonstrates excellent electrochemical properties due to varied oxidation states
exhibited by Mo from 2 to 6. Thus, it holds promise to be used as an electrochemical biosensing
electrode favoring charge transfer properties of Mo.

8
CHAPTER 2
MATERIALS AND METHODS
Introduction
The design process of a biosensor involves the integration of various building block elements. The
successful integration of these building block elements is required for getting reliable signal
response. The various building elements of the sensor are the sensor substrate, electrode material
deposition process, cross-linker characterization and testing the biomolecular binding through a
transduction phenomenon. Efficient optimization at each step is imperative for achieving reliable
signal response resulting from biomolecular binding. The following sections describe the
individual elements of the biosensor design process.
Substrate material
The choice of the sensor substrate has been a major element defining the progress of biosensing
technology. The emergence of flexible substrate for biosensing applications has facilitated the
development of many disposable low cost biosensors.21 Flexible substrates also favor mass
fabrication of sensors through various batch fabrication techniques such as roll-to-roll
manufacturing techniques.22 Various materials have been evaluated as use as flexible substrate for
biosensors such as Nylon, Polyethylene terephthalate (PET), polyamide etc.23 Porous polyamide
track etched membrane of porosity 200 nm has been used as a substrate for this work. The
hydrophilic nature of polyamide substrate is advantageous for surface functionalization of
biomolecules. The presence of nanoporous structures on sensor substrate also helps in charge

9
screening thereby minimizing non-specific biomolecule signal response.24 The material
characterization of electrode on the flexible polyamide substrate is discussed in Chapter 4.
Sensor fabrication
In this section, the various process steps followed for sensor fabrication have been described. The
electrode pattern of the biosensor was made with AutoCAD software. The electrode pattern is
transferred on to the sensor substrate with the use of transparent shadow masks. The shadow masks
are aligned with the substrate and mounted on the chuck of the electron beam evaporator tool at
UTD Cleanroom facility. The E-beam metal deposition is performed with Mo pellets placed on a
crucible. The deposition is performed at a vacuum pressure of 5 e-6 Pa. The deposition rate of metal
is maintained between 0.1 to 0.5 Å/s. The deposition rate and thickness of the metal deposited are
monitored in the rate indicator. A thickness of 100 nm was maintained in all the fabrication
processes. The thickness of the sample was validated with profilometric measurements post
fabrication. The sheet resistance of the Mo film was measured using Van-der-pauw measurements.
The fabricated sensors are stored in Nitrogen desiccator until use. The individual sensors are cut
from the substrate for use in biosensing characterization experiments. The form-factor including
the non-electrode space area was maintained consistent for all the sensors.
Crosslinker functionalization on Mo electrode
The surface functionalization of crosslinkers is required for efficient immobilization of
biomolecules on the sensor surface. The choice of crosslinkers is dependent on the binding affinity
with the metal electrode. In this work, two class of crosslinkers have been evaluated for the
formation of monolayer of crosslinkers on Mo electrode. The binding affinity of Mo electrode with

10
thiol and carbodiimide crosslinkers have been characterized through FTIR, XPS and fluorescence
microscopy techniques. These experimental results have been described in chapter 5.
Dithiobis (succinimidylproprionate) (DSP) is a thiol based crosslinker which has amine reactive
ends (Figure 1). The cleaving of disulphide bond exposes the open sulphur end for binding with
metal electrode forming a metal thiol crosslinker monolayer on sensor surface.
Figure 1. Structure of DSP crosslinker molecule (Reference: Thermofisher scientific)
EDC-NHS crosslinker chemistry consists of two crosslinker molecules 1-ethyl-3-(3-
dimethylaminopropyl) carbodiimide hydrochloride (EDC) and N-hydroxysuccinimide (NHS)
which are used in combination to form a crosslinker monolayer on electrode surface (Figure 2).
The material characterization of the interaction of EDC-NHS crosslinkers with Mo electrode is
discussed in Chapter 5.
Figure 2. EDC and NHS crosslinker structure (Reference: Thermofisher scientific)

11
Transduction techniques for biosensing applications
Signal transduction methods help in interpretation of sensor’s response from biomolecular binding.
Various transduction techniques which have been used for biosensing applications include
electrochemical, optical, acoustic and optical-electronic, piezoelectric etc.25 Among the various
transduction methods, electrochemical transducers poses advantages of miniaturization, rapid
detection capability and scope for integration with portable hardware devices. Electrochemical
transducers are generally potentiometric, amperometric or conductometric. The signal
transduction resulting from accumulation of charge at the electrode surface is the basis for
development of potentiometric biosensors. The pH electrode is an example of potentiometric
biosensors. The absence of bio affinity recognition elements to modulate charge as a result of
biomolecular binding event is the primary limitation associated with this technique.
The amperometric transducers are based on measurement of current resulting from
electrochemical redox reactions. The magnitude of the current is correlated to the concentration of
the electroactive product. The conductimetric transducers are based on the measuring the changes
in the conductance at the sensor surface. Impedimetric biosensors are a type of electrochemical
transducers wherein the changes in impedance at the surface modified electrode is correlated to
the concentration of target analyte. The binding of target biomolecules to the surface
functionalized recognition biomolecules at the electrode- electrolyte interface which is transduced
as changes in impedance in a faradaic or non-faradaic method depending on the use of redox
molecule.

12
Electrochemical Impedance Spectroscopy (EIS) technique
EIS technique involves the application of an alternating current (AC) voltage to the electrode and
measuring the output current from the sensor. The ratio of voltage to current is the impedance of
the sensor. An electrical circuit model is modelled to study the biosensor system. For this work,
Randles equivalent electrical circuit model (Figure 3) is used for understanding the changes in the
electrical parameters occurring at the electrode.26 The biomolecular binding of proteins causes
transient charging at the electrode-electrolyte interface forming an electrical double layer of
charges. The transient building of charge causes change in double layer capacitance (Cdl). The
solution resistance of the buffer is modelled as Rsol. The resistance and capacitance contributed by
Mo is modelled as a parallel RC circuit group.
Figure 3. Randles equivalent electrical circuit
The impedance is composed of real and imaginary component depending on the electrical
parameters contributing to the change in impedance. The output impedance is correlated to the
concentration of target analyte bound to the surface functionalized antibody.

13
Inflammatory biomarkers detection in urine
Rapid detection of diseases is of critical significance for reducing the deaths occurring from fatal
diseases. Non-invasive diagnostic methods are preferred over invasive methods because there is
no need for trained personnel to perform sample collection. Non-invasive detection methods
consist of physiological monitoring of target biomarkers in physiological fluids such as saliva,
sweat, urine, tears etc. The ability to detect disease biomarkers from readily available biological
fluids has enabled the development of POC biosensors and wearable sensors thereby enabling real-
time monitoring of target biomarkers. With the advances in biosensors, the sample volume
requirement has critically reduced thereby further facilitating disease detection from sweat, saliva,
tears etc. Urine is one of the important biological fluids which provides valuable information about
the physiological state of the body. A number of critical biomarkers are expressed in urine and
hence facilitates reliable detection of their elevated expression. Urine contains biomarkers for
detection of various diseases related to kidney ailments, cardiovascular diseases, cancer, infectious
diseases etc.27 Urine is also considered as a diagnostic buffer for monitoring the levels of glucose.
Thus, the amount of glucose in the urine provides diagnostic and prognostic information about
diabetes. Urine consists of critical biomarkers which are relevant to cancer detection. For example,
urinary F2-isoprostanes is a biomarker for prostate carcinogenesis. Inflammatory biomarkers such
as CRP, IL-6 are prominent biomarkers which are of significance in understanding inflammatory
condition in human body. CRP and IL-6 have been assessed as critical biomarkers for many
infectious diseases such as periprosthetic joint infection28, community acquired pneumonia29
cardiovascular diseases30, crohn’s disease.31

14
Therefore, the early detection of elevated levels of CRP and IL-6 helps in the early detection of
many infectious and cardiovascular diseases. Thus, the urine based diagnosis methods provide
scope for non-invasive and reliable detection of concentration of inflammatory biomarkers. The
restrictions of low sample volumes availability are not relevant for urine based detection methods.
IL-6 facilitates the acute phase response in the liver thereby causing the production of CRP.32
Thus, the detection of both IL-6 and CRP holds significance in rapid detection of various
inflammatory and infectious conditions.

15
CHAPTER 3
NOVELTY OF THE DISSERTATION
Novelty in Electrode Material
This work is focused on evaluating a novel metal electrode namely molybdenum (Mo) for use in
affinity based electrochemical biosensors. The demonstration of various oxidation states by Mo
facilitates the formation of chemical compounds with varied stoichiometry which is useful for
formation of stable chemical conjugates with crosslinkers.
Novelty in Mo-crosslinker interaction
The interaction between Mo electrode and crosslinker molecules was characterized through
multiple material characterization methods. The carbodiimide crosslinker binding chemistry was
based on leveraging the passive oxide layer on Mo electrode.
Novelty in application to electrochemical dipstick urine biosensor design
The novel crosslinking methods were applied to detect two inflammatory biomarkers in human
urine samples namely IL-6 and CRP. The sensor form-factor was designed as a dipstick format on
a flexible nanoporous substrate. This work is also a novel demonstration of an electrochemical
dipstick biosensor for the detection of inflammatory biomarker from human urine samples. The
biosensor is envisioned to be developed as a low-cost home based point of care dipstick biosensor
for disease detection in human urine samples.

16
CHAPTER 4
FLEXIBLE MOLYBDENUM ELECTRODES TOWARDS DESIGNING
AFFINITY BASED PROTEIN BIOSENSORS
Prior Publication
This manuscript was published in the MDPI Biosensors Journal in 2016: Kamakoti, V., Panneer
Selvam, A., Radha Shanmugam, N., Muthukumar, S., & Prasad, S. (2016). Flexible Molybdenum
Electrodes towards Designing Affinity Based Protein Biosensors. Biosensors, 6(3), 36.
The primary goal of this work was to evaluate the feasibility of Mo to be used in affinity based
biosensors. The link to the article is http://www.mdpi.com/2079-6374/6/3/36
Abstract
Molybdenum electrode based flexible biosensor on porous polyamide substrates has been
fabricated and tested for its functionality as a protein affinity based biosensor. The biosensor
performance was evaluated using a key cardiac biomarker; cardiac Troponin-I (cTnI).
Molybdenum is a transition metal and demonstrates electrochemical behavior upon interaction
with an electrolyte. We have leveraged this property of molybdenum for designing an affinity
based biosensor using electrochemical impedance spectroscopy. We have evaluated the feasibility
of detection of cTnI in phosphate buffered saline (PBS) and human serum (HS) by measuring
impedance changes over a frequency window from 100 mHz to 1 MHz. Increasing changes to the
measured impedance was correlated to the increased dose of cTnI molecules binding to the cTnI
antibody functionalized molybdenum surface. We achieved cTnI detection limit of 1 pg/ml in PBS

17
and 1 ng/ml in HS medium. The use of flexible substrates for designing the biosensor demonstrates
promise for integration with large-scale batch manufacturing process.
Keywords: molybdenum, bioassay, flexible substrate, cardiac troponin-I, label-free biosensing
Introduction
Point of care diagnostic devices offer efficient and cost-effective solutions for early detection of
diseases and monitoring of patient health conditions.33 Flexible polymers are preferred choice of
substrates in the point of care diagnostic biosensing devices owing to their enhanced
physiochemical properties. These flexible substrate based biosensors holds promise for mass
production thereby aiding in providing disease diagnostic capabilities to resource limited
environment.34 The signal response obtained as a result of affinity based binding between the
surface immobilized recognition element and its target conjugate.35 Affinity based biosensors
consist of a biological recognition element such as an antibody or any other type of receptor
immobilized on a sensor and integrated with a transducer to detect and measure the concentration
of a target bio-analyte. Antibodies are most widely used biological recognition elements in the
affinity-based biosensors due to their high affinity to proteins also known as analytes and
commercial availability. The binding of the antibody to the antigen at the sensor surface generates
a signal response. The phenomenon to detect target analytes through the use of only one capture
antibody alone and hence leading to a distinguishable signal is called single-capture
immunoassay.36
The substrate of the sensor is a crucial component of the biosensor. Silicon has been used for the
development of biosensors as it enables precise design of electrodes in the micrometric dimensions
using microelectronic photolithographic processes and it favors the integration of signal processing

18
hardware components on the same substrate.37 The lack of flexibility of the silicon substrate is the
key limiting factor in use in emerging applications such as flexible substrate biosensors. Flexible
substrate biosensors can be scaled up to large-scale batch manufacturing processes and possess the
advantages of low-cost and easy disposal.38 A number of polymeric materials have been evaluated
for the design of flexible biosensor platforms.39 Porous nanomembranes are the preferred choice
of substrate material in various biosensing applications.23b, 40 One of the favorable porous substrate
polymers is polyamide. Polyamide membranes have been demonstrated as a favorable substrate
material for developing flexible substrate biosensors.41 The presence of pores in the substrate of
the membrane based biosensors has been shown to enhance the signal response from the sensor
due to the phenomenon of nano-confinement of biomolecules.24, 42 The nanoporous membranes
facilitate the elimination of charge screening caused by the non-specific components in the diffuse
region of the electrical double layer. The pores in the membrane are the sites where the
biomolecular interactions occur thereby resulting in an enhanced output signal. Polyamide
membranes exhibit high mechanical strength and are hydrophilic which favor their use with
aqueous solutions. Enhanced signal response is obtained from the nanoporous electrodes with a
pore size of the order of 200 nm when compared to planar electrodes for biosensing applications.43
Gold (Au) has been a preferred choice of electrode material in biosensing applications.20, 44
However, there is a growing interest in evaluating dichalcogenides for biosensing applications due
to their high electron mobility, enhanced surface area to volume ratio.14a, 45 Molybdenum is
transition metal with an electronegativity of 2.16 on the Pauling scale. It does not visibly react
with oxygen or water at room temperature46. Many of the first-row transition elements have a
known biological function and in many cases, redox reactions are linked to their role.47

19
Molybdenum has been used as an bottom electrode material in bulk acoustic resonator applications
due to its good electrical conductivity property.6 The molybdenum electrodes have been
demonstrated to form a thicker electrical double layer compared to Nickel and Platinum in the
hydrogen production through water electrolysis in 1-butyl-3-methylimidazolium tetra fluoroborate
(BMI.BF4) through Electrochemical Impedance Spectroscopy (EIS) technique.8 Electrochemical
interfacial capacitance is defined as the capacitance per surface area and is a function of electrical
double layer capacitance.48 Mo has been demonstrated to exhibit electrochemical behavior upon
the interaction with an electrolyte.49 The presence of interfacial capacitance of Mo can be
leveraged for biosensing by enhancing the signal response from binding of biomolecules which is
utilized in the EIS technique.8 The binding between the biomolecule and the electrode surface is
of crucial significance for the successful operation of the biosensor. Mo demonstrates a favorable
chemistry in binding with sulphur.50
The biomolecule chosen for this study is a well-established cardiac biomarker, Troponin-I (cTnI),
whose detection in the bloodstream signifies acute myocardial damage. Elevated levels of
Troponin-I in the range of ng/ml or higher has been clinically correlated to the onset of myocardial
infarction and other cardiac ailments. The enzyme-linked immunosorbent assay (ELISA) and
radioimmunoassay (RIA) are conventional methods for monitoring the cTnI levels in a clinical
environment.51 The limit of detection associated with these conventional detection techniques are
in the range of ng/ml to μg/ml. In order to detect an early spike in the levels of the cTnI, there is a
need for biosensors for detecting lower concentration of the cTnI in a reliable manner. Various
biosensing techniques such as electrochemiluminescence52, faradic electrochemical methods53,

20
colorimetric methods54 have been leveraged to detect the levels of the cTnI. The following table
compares the performance matrices of various biosensing techniques:
Table 1. Comparison of immunoassay performance for cTnI detection
Technique LoD Dynamic Range Reference
Electrochemiluminescence 0.0025 ng/mL 0.0025-10 ng/ml 52
Faradaic EIS 4.2 pg/mL 0.01-10 ng/ml 53
Optomagnetic biosensor 0.03 ng/mL 0.03-6.5 ng/ml 55
Colorimetric 0.01 ng/mL 0.01-5 ng/ml 56
Surface plasmon resonance 68 ng/L 68 ng/L-660 μg/L 57
Electrical biosensing is shown to be more robust than other label free transduction mechanisms
due to its speed, sensitivity, ease-of use, and low cost.58 Electrical biosensing using EIS technique
is a powerful technique to monitor the events occurring on the electrode–electrolyte interfaces.2
EIS technique has been evaluated and applied for the detection of number of bioanalytes.59 In brief,
EIS measurements can be performed in two ways: faradaic EIS and non-faradaic method. Faradaic
impedance measurements are usually carried out by using a reversible redox probe while non-
faradaic impedance measurements are done without using any redox probe.60 In a non-faradaic
sensor, the capacitance of the electrode–electrolyte interface can be considered as the main
indicator of interaction between the antibody and antigen.61 The non-faradaic biosensors have the
advantage of low instrumentation cost and have scope for miniaturization. Thus non-faradic
biosensor based on EIS promises scope for development of low-cost point of care diagnostic
device for monitoring the levels of cTnI in a reliable manner.

21
Herein, we presented an easy and facile way to design an affinity based protein biosensor, which
has vast scope for integration with a point of care diagnostic device. Conversely, to other
previously reported works for cTnI detection, in this paper we demonstrate the detection of cTnI
by employing the non-Faradaic method to probe the cTnI concentration changes. We have utilized
EIS technique to study the changes in the capacitance due to the interactions of molybdenum
electrode and the protein biomarkers. We have demonstrated the feasibility in the use of
molybdenum as an electrode material in biosensor for the detection of cardiac biomarkers. The
electrochemical property exhibited by the molybdenum upon its interaction with the electrolyte
has been leveraged in the design of a non-faradic label-free electrochemical biosensor. The
enhanced sensitivity obtained with the use of molybdenum as an electrode material is useful for
accurate detection of concentration of cTnI. Thus, we have evaluated the molybdenum electrode
as an electrode material in capturing the signal response occurring at the sensor surface due to
binding of biomolecules. The change in the signal is predominantly due to the changes in the
capacitances associated with the binding of charged biomolecules.
Materials and Methods
Sensor fabrication and characterization
Molybdenum (Mo) electrochemical biosensors were fabricated using e-beam evaporation (99.9%
purity Mo crucible) on nanoporous polyamide membrane substrates. Polyamide membranes (GE
Healthcare Life Sciences, PA, USA) are flexible, lightweight and hydrophilic whose intercalated
nanoporous structure allow the capillary wicking of test sample to the sensing region. The sensing
region comprises of two concentric circle electrodes which acts as working and counter/reference
22
electrodes. The design of the working and the counter electrodes is represented in Figure 4 (A). In
a typical biosensing application, the biological molecule is immobilized on the working electrode
and the signal resulting from the interaction of biological molecules is sensed from the working
electrode. Thus impedance of the counter electrode must be smaller. This is achieved by
maintaining the area of counter electrode at least ten times higher than that of working electrode.
62 In order to meet the above design requirement, the ratio between the counter and working
electrode’s area of the biosensor was designed to be 15:1.
The geometrical pattern of the designed electrodes was transferred on to substrate material using
shadow masks with CHA Mark 50 e-gun evaporator in UTD cleanroom. The shadow masks were
obtained from acrylic cellulose acetate sheets (Apollo® Copier Transparency Film, Lincolnshire,
IL, USA). The rate of deposition was maintained at 0.8 Å/s to achieve a uniform metal deposition
and thickness of Mo deposition was maintained at 120 nm. The thickness of the deposition was
validated through profilometric measurements. The conformal coating of Mo on polyamide were
characterized using Scanning Electron Microscope (SEM) and Energy Dispersive X-ray
Spectroscopy (EDAX). The morphological characteristics of material characterization is further
discussed in the results section.
The measured resistivity of Mo deposition on polyamide with a 4-point probe source meter was
5.9e-4 ohm cm while the resistivity prior to the Mo deposition was measured to be 6.6 e-2 ohm cm.
The low resistivity of the molybdenum surface provides good electrical conductivity and thus is
advantageous in achieving an enhanced sensor signal response for biosensing. The electrical
contact to the potentiostat is established through alligator clips.

23
Figure 4. Material characterization of Mo biosensor.
(A) Representation of Mo sensor on polyamide substrate. CE represents the counter electrode and
WE represents working electrode; (B) Representation of SEM image of Mo sensor on the porous
polyamide substrate before Mo deposition ;(C) Representation of SEM image of Mo sensor on the
porous polyamide substrate before Mo deposition; (D) Representation of EDAX spectrum analysis
on PA membrane before Mo deposition; (E) Representation of EDAX spectrum analysis on the
Mo sensor. The encircled region on the EDAX spectrum indicates the peak corresponding to the
L-shell energy peak of the Mo.
Surface functionalization of sensor
Dithiobis succinimidyl propionate (DSP) (Sigma-Aldrich, St. Louis, MO, USA) was dissolved in
dimethyl sulfoxide (DMSO) (Sigma-Aldrich, St. Louis, MO, USA) to formulate a 10mM mixture.
30 μL of the DSP-DMSO mixture was added to the Mo electrochemical sensor to allow
functionalization of this thiol-based linker molecule on Mo surface and incubated for four hours.
0.15 M 1x PBS buffer was added to the sensor to prepare the surface prior to addition of the

24
antibody. Monoclonal anti-cTnI antibody stock solution was diluted to 1μg/ml in PBS buffer and
then immobilized on the DSP functionalized sensor surface and incubated for 15 minutes. The
concentration of antibody to be used was determined through antibody saturation study. The
antibody saturation study experiment was conducted with varying antibody concentrations from
100 fg/ml to 1 µg/ml and the change in impedance with respect to a blank PBS sample was studied
for the various antibody concentrations. The noise estimation post the antibody conjugation was
studied by analyzing the impedance of the sensor for multiple PBS washes following the antibody
conjugation. EIS measurements were taken after each assay step with Gamry Reference 3000
potentiostat (Gamry Instruments, Warminster, PA, USA) to validate the binding.
2.3 Calibration dose response analysis for cTnI detection
In order to evaluate the baseline sensor performance on an antibody conjugated sensor, blank
buffer devoid of any antigen was added to the sensor. EIS measurements were performed after two
minutes of addition of buffer. This measurement was considered as the zero-dose measurement.
The impedance at the subsequent antigen concentrations was compared against the zero-dose
impedance values. The cTnI antigen was diluted to the experimental concentrations in the target
test buffers, PBS or human serum (HS) (Fitzgerald, Acton, USA).After the addition of antigen
sample, the sensor was incubated for 15 minutes to allow for sufficient time for binding of antigen
with the surface functionalized antibodies. EIS measurements were performed after the incubation
time in order to validate the binding of antigen to the surface conjugated antibody. We tested the
cTnI antigen concentration from 100 fg/ml to 10 μg/ml in PBS medium and from 100 pg/ml to 10
μg/ml in the HS medium. The dissociation constant between the cTnI antibody and the cTnI
antigen is in the range of 10-10 M.63 In order to validate the binding of the biomolecules on the

25
porous substrate, we performed the negative control dose response experiment with Bovine serum
albumin (BSA) protein.
EIS technique for label-free biosensing
The technique of single capture immunoassay (primary antigen-antibody interaction in the absence
of secondary antibody) was leveraged to achieve protein binding and subsequent detection process.
The binding of the biomolecules onto the molybdenum electrode perturbs the inherent charge
distribution in the electrical double layer (EDL). The perturbation in the charge distribution leads
to capacitance changes in the EDL. Thus, the capacitance introduced by the bimolecular binding
was measured by the EIS technique. The equivalent electrical circuit is depicted in the Figure 5(B).
The EIS technique used in this study is a modification of the standard electrochemical impedance
spectroscopy technique wherein redox probes are used to study the interactions occurring at the
surface probe. The absence of the use of the redox probe in the implemented sensing system makes
it a non-faradic sensor. The electrical stimulus is applied across the electrode in order to direct the
surface-charged biomolecules towards the sensing region of the biosensor. The resulting
impedance is calculated using the voltage-time function equation as given below:
Z=𝑉(𝑡)
𝐼(𝑡)=
𝑉0 𝑠𝑖𝑛(2𝜋𝑓𝑡)
𝐼0𝑠𝑖𝑛(2𝜋𝑓𝑡+𝜙)
In the above equation, 𝑉0 and 𝐼0 represent the peak voltage and the current signals, ‘f’ represents
the frequency of the applied signal,‘t’ represents the time and ‘ϕ’ represents the phase shift between
the voltage-time and the current-time functions. When the impedance measurement is carried over
a spectrum of frequencies, the technique is referred to as impedance spectroscopy. The binding of
the biomolecules causes a change in the output capacitance across the sensing region of the
26
molybdenum biosensor. The output impedance consists of resistive and capacitive components.
The capacitive component indicates the differential surface charge at the EDL as a function of
antigen-antibody binding. The parameters of the input voltage namely the amplitude of the
sinusoidal voltage and the frequency of the input signal need to be optimized in order to capture
the changes in the impedance occurring as a result of binding of biomolecules. The alternating
current (AC) input voltage is of the magnitude of 10 mV and the range of test frequency was varied
from 100 mHz to 1 MHz. The application of input AC voltage causes the ions in the solution to
get attracted towards the molybdenum electrode surface, which is known as inner Helmholtz plane
(iHP). The outer Helmholtz plane (oHP) is constituted with ions which facilitate the
functionalization of linker molecule onto the sensor surface. The length between the iHP and the
oHP is regarded as the length of the EDL. The length of the electrical double layer extends from
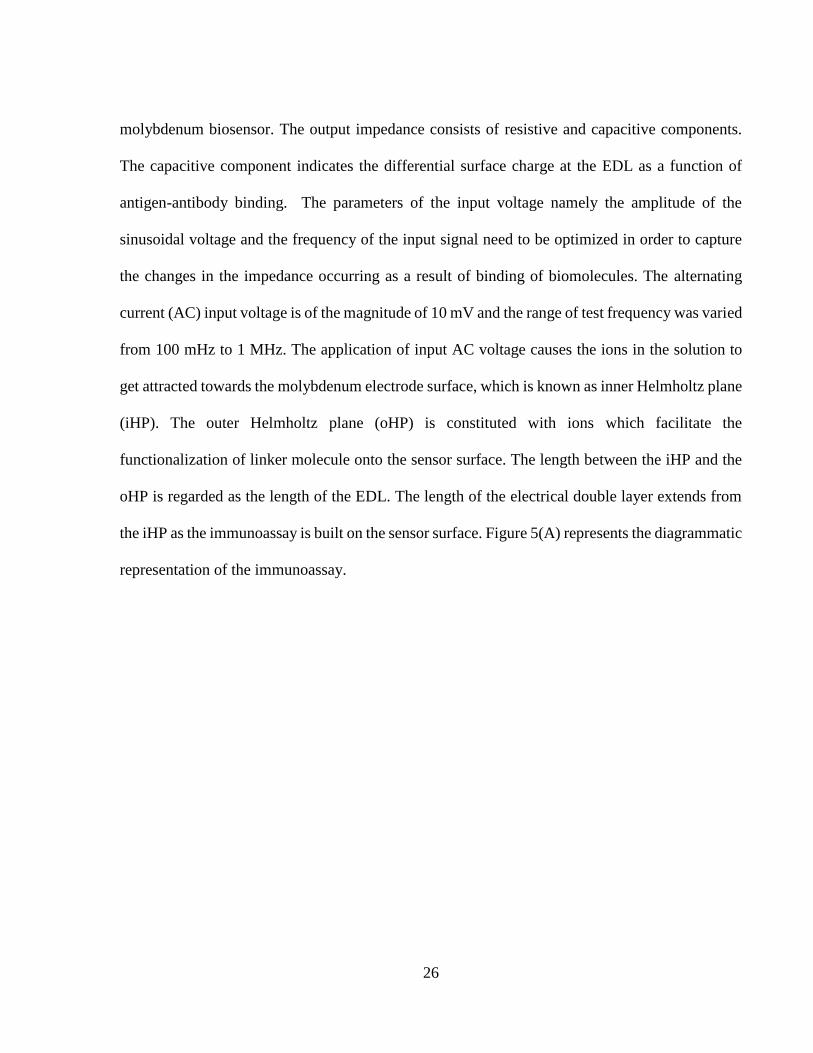
the iHP as the immunoassay is built on the sensor surface. Figure 5(A) represents the diagrammatic
representation of the immunoassay.

27
Figure 5. Biosensor design and electrical circuit model
(A) Schematic representation of immunoassay of the Mo biosensor indicating the deposition of
Mo on the pores of the membrane. The enlarged segment indicates the building of immunoassay
on the pores ;( B) Schematic representation of the equivalent circuit of the Mo biosensor. Cdl
represents the double layer capacitance dominated by biomolecular binding. Rsol represents the
resistance contributed by the solution, Zw represents the Warburg Impedance and Rct represents
the charge transfer resistance, RMo represents the resistance at the Mo electrode, CMo represents
the interfacial capacitance at the Mo electrode surface.

28
Results
Material characterization of Mo deposition
The material characterization of sensor surface performed with the SEM indicate the deposition of
molybdenum on the porous polyamide substrate. Figure 4(B) and Figure 4(C) indicate the SEM
images pre and post Mo deposition on polyamide membrane respectively. The SEM micrograph
post the Mo deposition validate the conformal deposition of Mo on the pores of the membrane
substrate. The profilometry results post the Mo deposition validate the depth of the Mo deposited
and its correlation with the preset value.
Figure 4(D) and 4(E) shows the EDAX spectra related to highlighted zone in the SEM
micrographs. The objective of measuring the EDAX spectra is to investigate the presence of
elements. The distinct peak at the energy level 2.29 keV corresponds to the L-shell energy level of
Mo thereby indicating that the deposited film on porous polyamide membrane is molybdenum.
The other significant peaks are of Carbon and Oxygen. The hydrocarbon side chains of the
polyamide membrane are the probable source. The EDAX spectra on blank polyamide substrate
does not indicate any peak correlating to the Mo. The exact nature of deposited film cannot be
evaluated using EDAX analysis. However, the presence of molybdenum deposit is certain.
Polyamide favored rapid fluid wicking which facilitated the uniform distribution of sample
solutions on the electrodes.
Baseline electrical characterization
The baseline sensor response refers to the study of material and electrical properties of the sensor
in the absence of biomolecules. This study was performed in order to analyze the effect of inherent

29
material and electrical properties of the Mo sensor. The baseline electrical properties of the Mo
electrode biosensor was studied with EIS technique by the application of an AC voltage of 10 mV
at 1000 Hz frequency as the electrode characteristics are studied as part of the bulk properties of
the electrode which are studied at the high frequencies.59 The lower frequencies reflect the effect
of biomolecular binding on the electrical double layer. Hence the performance of the immunoassay
was evaluated at 1 Hz frequency. The open-circuit impedance in the absence of any fluid on the
sensor surface was measured to be 75 MΩ and the short-circuit impedance was measured to be
5224 Ω. A total of n=3 replicates was performed and a coefficient of variation (CV) of 8 % was
observed. The low percentage in the CV indicates that the baseline performance of the sensor
shows that the sensor stack was reliable for EIS biosensing.
Antibody saturation study
The concentration of the antibody required to completely saturate the sensor surface functionalized
linker sites is crucial in order to competitive binding of free linker sites with other biomolecules.
We performed the antibody saturation experiment in order to determine the concentration of
antibody required for saturating the linker functionalized sensor surface. The experimental
conditions for this study was set at 10 mV AC voltage and 1 Hz frequency. A total of n=3 replicates
of measurements were performed for this study and the results are represented in Figure 6 (A). The
concentration of the antibody at which there is minimal change in impedance compared to earlier
concentration is regarded as the saturating antibody concentration. The noise threshold was
calculated from the difference in impedance value between the PBS step post DSP
functionalization and another blank PBS buffer dose step and was determined to be approximately
3200 Ω. The change in impedance for the lowest antibody concentration of 1 ng/ml was measured

30
to be 8900 Ω. The change in impedance for antibody concentration of 1000 ng/ml with respect to
the baseline PBS measurement was approximately 20 kΩ. The change in impedance with respect
to the earlier concentration was negligible and hence 1000 ng/ml was the saturating concentration
of the antibody required to complexly saturate all the available linker sites for the antibody
conjugation. Thus, the saturating dose concentration for the cTnI antibody was considered to be
1000 ng/ml. Figure 6(B) represents the results of the baseline sensor characterization for multiple
PBS wash steps following the antibody conjugation. A total of n=3 replicates were performed and
a p value greater than 0.05 was obtained for all the PBS wash steps with respect to the impedance
value obtained after antibody conjugation. Thus, the biosensor demonstrates stable measurements
post the antibody conjugation after the buffer wash steps. The stable values in the impedance
obtained post the PBS wash steps validates the conjugation of antibody to the linker sites and the
PBS wash steps does not dissociate the antibody from the sensor surface.
Figure 6. Antibody conjugation analysis
(A) Analysis of antibody saturation study on the DSP functionalized Mo sensor. The dotted line
indicates the noise threshold. Error bars indicate the standard error of mean from n=3 replicates;

31
(B) Baseline noise estimation on antibody conjugated biosensor and multiple PBS wash steps post
the Ab conjugation. The impedance values for the PBS wash steps are statistically insignificant
compared to the impedance obtained post the antibody incubation.
Calibration dose response study
The calibration dose response study experiments were performed for a frequency range of 100
mHz to 1 MHz frequency with 10 mV (peak to peak) voltage. Figure 7(A) represents the change
in the phase angle of the impedance as a function of frequency and Figure 7(B) represents the
change in the modulus of impedance as a function of frequency. A lag in the phase between the
input voltage and the output current is observed for the different assay steps. The phase lag is
contributed by the change in the capacitive elements in the biosensor. The transient building of
charges occurs at the electrical double layer as a result of biomolecular binding. The maximum
phase for the DSP functionalized sensor was measured to be approximately 20 . The phase of the
sensor increases with the subsequent assay steps due to increase in the capacitance at the
molybdenum electrode due to the biomolecular binding. The phase of the system increases up to
approximately 58 for the cTnI antigen concentration of 10,000 ng/ml. The changes in the phase
with respect to the assay steps were significant. These significant changes in the phase indicate the
presence of capacitive binding. The maximum changes in the phase between the DSP
functionalization step and the subsequent assay steps were observed at 1 Hz frequency and hence
the calibration dose response analysis were performed for impedance values at 1 Hz frequency.
Since the maximum phase changes are observed at a frequency of 1 Hz, it is inferred that the
capacitive behavior of the biosensor is dominant at this frequency. At high frequencies, the phase
of the signal approaches zero for all the assay steps. Also, at higher frequencies, the impedance

32
curves associated with the Bode magnitude analysis overlap with each other. Hence, the low
frequency region (1 Hz) is chosen to study the distinguishability in the doses as a function of
impedance. The impedance of the biosensor decreases with increase in the frequency of the input
signal. For instance, the impedance value at 100 mHz for 10 ng/ml is 45 kΩ and it decreases up to
975 Ω at 1000 Hz frequency. The changes in the impedance for various concentrations of the
antigen were distinguishable from each other. Thus, these distinct changes in the impedances for
various antigen concentrations validate the binding between the surface functionalized antibody
with the antigen molecule.
Figure 7. Magnitude and Phase analysis of Mo sensor
(A) Magnitude of impedance of Mo sensor. The magnitude of the impedance decreases with
increasing antigen concentrations; (B) Phase analysis of Mo sensor. Maximum phase changes
between the DSP functionalization step and subsequent assay steps were observed at 1 Hz
frequency.
Figure 8(A) and 8(B) represent the results of calibration dose response experiments for cTnI
protein detection in PBS and HS medium respectively at 1 Hz frequency. The percentage change
in impedance with respect to the zero dose for the lowest antigen dose of 100 fg/ml was 8%. The
impedance difference with respect to the zero-dose measurement was calculated to be 3 kΩ. The

33
% change in impedance increased with higher concentrations of the antigen. For the cTnI
concentration at this concentration of 10,000 ng/mL, the % change in impedance was
approximately 60 % and the change in impedance with respect to zero-dose sample was calculated
to be 29 kΩ.
The control experiments with the BSA protein did not yield an increasing trend in the change in
impedance percentage. The change in impedance with respect to zero-dose for the control doses
were measured to be less than 10%. The change in the impedance for the control doses is attributed
to the change in the diffusion driven impedance at the Mo electrode electrolyte interface.
The decrease in the impedance after the antigen binding is in correlation to the increase in the
double layer capacitance due to the binding event. Thus, the percentage change in impedance
increases with higher cTnI concentration. The increase in the change in the impedance for higher
concentrations observed for the cTnI antigen concentrations indicate the signal from the sensor is
a result of specificity in binding between the cTnI antigen and the cTnI antibody. The signal to
noise ratio for an immunoassay assay is fixed at 3.64 Based on the analysis of the results of the
calibration dose response, the difference in impedance between the impedance for dose
concentration and that of negative control was measured to be 600 ohms and this value is referred
to as noise threshold for the calibration dose response study. The specific signal threshold (SST)
is calculated as three times the noise impedance and was measured as 1800 ohms. In the Figure 8
(A), the percentage change in impedance for the cTnI concentration of 100 fg/ml was less than the
noise threshold. The lowest concentration of cTnI antigen which was above the impedance at the
noise threshold is regarded as the limit of detection (LoD) for the sensor. In our work, the LoD of

34
the sensor is inferred to be at 1 pg/ml in PBS medium. The dynamic range of detection in the PBS
medium was from 1 pg/ml to 10 μg/ml.
Figure 8. Calibration dose response analysis on Mo sensor
(A) Calibration dose response analysis in PBS medium. The dotted line indicates the noise
threshold. The LoD for the sensor in the PBS medium is 1 pg/ml. (B) Calibration dose response
analysis in HS medium. The LoD for the sensor in HS medium is 1 ng/ml. Error bars represent the
standard error of mean from n=3 replicates.(C) Comparison of experimental vs simulated result
for 1 ng/ml of cTnI antigen.(D) Comparison of capacitance for various assay steps on Mo
biosensor.

35
In order to simulate a diagnostic sensor environment, we tested the immunoassay in HS medium
for cTnI detection. The experimental concentrations of the cTnI antigen was diluted in the human
serum medium and was tested on the antibody conjugated molybdenum electrode biosensor. The
percentage change in impedance for the cTnI concentration of 100 pg/ml with respect to a zero-
dose measurement with blank human-serum alone was measured to be 4%. This value lies within
the noise threshold region. The lowest cTnI concentration which is above the noise threshold is 1
ng/ml. Hence the LoD for the sensor in the HS medium is 1 ng/ml. The change in impedance
increased with increase in the antigen concentration. The percentage change in impedance for
10,000 ng/ml cTnI concentration with respect to zero-dose measurement was measured to be 34%.
The increase in the percentage change in impedance for increasing concentration of the antigen is
an indication of increase in the double layer capacitance due to the binding of the biomolecules at
the Mo electrode surface despite the presence of interfering biomolecules present in the human
serum. The dynamic range of detection in the human serum medium was from 1 ng/ml to 10 μg/ml.
The change in impedance for the control experiments with BSA protein were less than 7 % with
respect to zero-dose measurements. The negligible change in percentage for the negative doses
indicates the specificity in the binding between the cTnI antigen and the cTnI antibody. Figure 9
(C) represents the comparison of Nyquist plot between the experimental result obtained for the 1
ng/ml cTnI antigen concentration and the simulated value. The simulated values were obtained
after fitting the experimental data into the equivalent circuit as shown in Figure 9(B). The
simulated data points correlated to the experimental values with a low chi square value of 4.96 e-
6. Thus, the presence of interfacial capacitance is validated in the derivation of equivalent electrical
circuit for the biosensor. The value of interfacial capacitance for the Mo obtained from simulation

36
analysis was obtained to be 5 μF. Figure 9(D) represents the comparison of experimentally
measured capacitance values for various immunoassay conditions at Mo electrode. The measured
capacitance increased from the DSP step to the antigen binding step thereby validating the
capacitive binding between the biomolecules.
Optical readout for cTnI detection
In order to demonstrate the reporting the sensing of cTnI molecules in a user-friendly format, we
developed a LED based prototype to indicate the of cTnI antigen. Figure 9 (A) indicates the cTnI
antibody immobilized sensor. The LED prototype operates similar to a Boolean logic output
indicating a change in the output for the impedance value correlating to the 1 pg/ml cTnI
concentration. The simple LED prototype supports the favorability of molybdenum biosensor to
be integrated with electrical circuit components. The threshold concentration to trigger the output
response is preset as a correlation to an impedance value. The output LED glow is an indication
of crossover point of the cTnI concentration. Figure 9(B) indicates ON state of the LED after the
addition of cTnI antigen. The addition of the antigen on the antibody-immobilized sensor decreases
the impedance of the circuit. A comparator integrated circuit compares the impedance with a preset
threshold value and completes the circuit to glow the LED. We observed that the output LED
turned ON within 10 seconds of addition of the antigen of 1 pg/ml concentration. The rapid change
in the output from the sensor indicates that Mo facilitates the charge conduction through the porous
substrate. The reader can be extended to classify the cTnI concentration into multiple classification
segments.

37
Figure 9. Electrical prototype of an optical reader for cTnI detection
(A) Optical reader indicating an “OFF” output state on an antibody conjugated sensor.(B) Optical
reader indicating an “ON” state upon the addition of antigen sample. The binding between of
biomolecules decreases the impedance below the threshold value thereby turning the output LED
to “ON” state.
Discussion
We have leveraged the material properties of the molybdenum for use as an electrode material for
the design of a cardiac biomarker (cTnI) detection biosensor. The flexibility of the polyamide
substrate offers scope for integration of the biosensor with textile based point of care diagnostic
platform. The presence of peaks in the EDAX spectrum analysis correlated with the energy levels
of the Mo validates the conformal deposition on the polyamide substrate. SEM images of the Mo
sensor represents the deposition of Mo on the porous polyamide membrane. The decrease in the
impedance after the DSP incubation indicates that the Mo electrode surface exhibits affinity
towards thiol linker molecule. The self-assembled monolayer formed at the sensor surface forms
the stack upon which the biomolecules are immobilized. The linear increase in the change in the
impedance of up to 20 kΩ for saturating antibody concentration of 1 µg/ml elucidates the binding

38
between the antibody and the linker functionalized Mo electrode sensor surface. The increase in
the change in the impedance is the results of the change in the double layer capacitance element at
the interface of the Mo and the electrolyte. The phase of the biosensor increases up to 58° for the
antigen concentrations. The increase in phase lag is due to capacitive binding at the pores of the
polyamide surface.
The biosensor exhibited clear distinguishability in the impedances for various concentrations of
the cTnI antigen at 1 Hz frequency. The change in the impedance is theoretically to the double
layer capacitance element of the equivalent electrical double layer model (Cdl). Molybdenum
electrode facilitates the changes in the capacitance associated with the binding event between the
surface conjugated antibody and the target antigen present in the sample. The changes in the
impedance is predominantly driven by the changes in the capacitance occurring due to
biomolecular binding. Mo electrode deposited on the porous polyamide substrate facilitates the
capacitive binding between the biomolecules.
The biosensor showed a linear response over a broad detection range from pg/ml to µg/ml with
approximately 60 % change from the zero-dose impedance measurement in the PBS medium and
a change of 35 % in HS medium. The increase in the percentage change in impedance for higher
sample concentrations validate the biomolecular binding. The lower limit of cTnI detection in the
PBS medium is 1 pg/ml as its change in impedance was higher than the noise threshold set by the
control (BSA) protein concentrations. The lower limit of detection in the HS medium was 1 ng/ml.
The small change in impedance for the negative control samples is attributed to the diffusion driven
Warburg impedance (Zw). The increase in the measured capacitance with the immunoassay steps
indicates that the molybdenum electrode drives the change in the double layer capacitance at the

39
electrical double layer formed at the sensor surface thereby favoring the detection of precise
changes in the cardiac troponin levels. The use of flexible substrate is advantageous for its scope
for large-scale scalability in the biosensor fabrication. The sensors are disposable after one time
use and hence holds promise for integration with a point of care diagnostics device.
Conclusions
The electrochemical behavior of the Mo has been leveraged in building a label-free biosensor on
a flexible membrane substrate. The biosensor demonstrates feasibility of cTnI detection in PBS
and HS medium over clinically relevant concentrations for the cTnI detection. The efficient
biomolecule detection capability of the molybdenum biosensor in the human serum despite the
presence of interfering biomolecules supports the claim of molybdenum as an economically
attractive alternative to the gold as an electrode material in diagnostic biosensors. Thus, the
molybdenum electrode biosensor has immense scope for use a portable point of care diagnostic
biosensor with ability to detect the onset of cardiac disease in a reliable and rapid manner.

40
CHAPTER 5
INVESTIGATION OF MOLYBDENUM-CROSSLINKER INTERFACES FOR
AFFINITY BASED ELECTROCHEMICAL BIOSENSING APPLICATIONS
Prior Publication:
This manuscript has been submitted to the Applied Surface Science journal and is currently under
review. The primary objective of this work was to evaluate the interaction of crosslinkers with
molybdenum electrode.
Abstract
The electrochemical properties of molybdenum (Mo) has been investigated for implementation as
an electrode material for affinity based biosensing towards developing flexible electronic
biosensors. Treatment of the native oxide of molybdenum was investigated through two surface
treatment strategies namely thiol and carbodiimide crosslinking methods. The binding interaction
between cross-linker molecules and Mo electrode surface has been characterized using Fourier
Transform Infrared Spectroscopy (FTIR), X-ray photoelectron spectroscopy (XPS) and optical
microscopy. The efficacy of treatment of Mo with its native oxide using carbodiimide cross linking
methodology was established. The carbodiimide cross-linking chemistry was found to possess
better surface coverage and binding affinity with molybdenum electrode surface when compared
to thiol cross-linking chemistry. Electrochemical characterization of Mo electrode using
Electrochemical Impedance Spectroscopy (EIS) and Cyclic Voltammetry (CV) techniques was
performed to evaluate the effect of ionic properties of solution buffer on the Mo electrode’s

41
performance. Affinity based biosensing of C - reactive protein (CRP) has been demonstrated on a
flexible nanoporous polymeric substrate with detection threshold of 100 pg/ml in synthetic urine
buffer medium. The biosensor has been evaluated to be developed as a dipstick based point of care
device for detection of biomarkers in urine.
Introduction
Experimental techniques that interface biomolecules directly with microelectronic systems are
increasingly being used in a wide range of diagnostics applications. The search for better
diagnostics technologies has been directed down to two interrelated pathways. One is the
continuing efforts to develop the lab on a chip concept, particularly for detection of biomolecules,
and this reflects the general trend in biotechnology where standard assays are being replaced by
molecular testing.65 The second is the development of porous polymer-based analytical devices
which have the advantage that polymeric materials can be machined in similar ways to silicon but
it is much cheaper, and an important consideration for devices in the developing world.66 In the
realm of porous polymer based analytical devices there has been significant emphasis on the
fluidics aspect but not sufficient emphasis has been placed in the material systems utilized for
achieving sensing/testing.67 Mo has frequently been selected as the electrode material to minimize
the acoustic attenuation and provide good electrical conductivity, it has been primarily applied for
acoustic resonator applications.68 In this paper, we have evaluated the suitability of molybdenum
as an electrode material for polymeric substrates. We have investigated surface functionalization
strategies for molybdenum towards designing electrochemical biosensors suitable for
implementation in polymer based porous bioanalytical devices. These devices lend themselves to
be integrated into dipstick formats enabling rapid biosensing.

42
Dipsticks for urinalysis are a convenient diagnostic tool as they are non-invasive, extremely
portable, and very cheap to manufacture.69 Unfortunately, the accuracy of the results is highly
dependent on multiple stringent requirements which include sample preparation, correct
interpretation of a gradient colour scale, and readout timing.70 There is an opportunity to remove
these stringent requirements through electronic dipsticks may be designed to report the
concentration of a specific biomarker from urine in a manner similar to blood glucometer. One
challenge in converting colorimetric dipsticks into electronic dipsticks is the choice of the
electrode material and the electrochemical assay that is incorporated onto the electrode. Standard
electrochemical assays typically utilize gold/ platinum as electrodes. These choices typically
increase the cost of a dip stick thus pricing the assay outside of considerations for implementation
in developing economies. In order to achieve this overarching goal, in this publication we have
investigated a novel material system namely molybdenum (Mo) as an electrode for designing
electronic dip sticks for evaluating biomarkers from urine.
The electrochemical properties of molybdenum (Mo) and its compounds have been demonstrated
in their use as in electrocatalytic applications.71 Mo exhibits various oxidation state ranging from
II to +VI. The wide range of oxidation states facilitates the formation of stable chemical
interactions with various organic and inorganic functional groups.5 Mo and its compounds have
widely been used in battery applications owing to their electrochemical properties.72 Mo
demonstrates electrochemical properties upon its interaction with electrolytes.73 It is susceptible
to formation of passive surface oxide layer.74 The native oxide layer on Mo acts as a passivation
layer thereby facilitating anti-corrosion properties.75 The biocompatibility and favourable
mechanical properties of Mo justify its application as an alloying material in medical implants.76

43
These properties favour the evaluation of Mo as a stable electrode material but fraught with the
challenge of utilizing the passive oxide layer towards developing functional biosensors. The
passive oxide requires surface engineering to develop a functional molybdenum surface suitable
for conjugation of biomolecules.
Engineering the electrode surface for biomolecule conjugation is a critical step towards evaluation
of the electrode material for affinity based biosensing applications. Various electrode surface
modification strategies such as physisorption77, enzyme entrapment78 and covalent attachment79
have been evaluated for functionalization of biomolecules. Stability of binding of biomolecules to
the surface of the electrode enables the successful signal transduction from biomolecular binding
to the electrodes. High binding strength resulting from covalent attachment of cross-linkers with
electrode surface favours their application in development of affinity based biosensors. The
chemical interactions of thiol group based cross-linkers is widely studied in surface
functionalization methods.80 The high binding affinity of Au-S bonds was used for building a
stable monolayer suitable for functionalization of biomolecules.81 Carbodiimide chemistry is
another class of cross-linkers, which are also widely reported in the development of biosensors. 82
Surface treatment of molybdenum plays an important role in utilizing its electrochemical
properties towards designing polymer based analytical devices.
In this work, we have investigated two methods of surface treatment widely used in affinity based
biosensing systems and adapted them towards implementation on molybdenum surfaces with
passive native oxide. Due to the integration of molybdenum electrodes onto polymer-based
substrates, standard etching based surface treatments are unsuitable for implementation.83 Hence,
we investigated the novel approach of leveraging the native oxide towards designing surface

44
suitable for biomolecule immobilization. We investigated the utilization of thiol and carbodiimide
linker molecules towards surface treatment of molybdenum native oxides and have studied the
interaction between Mo and the cross-linking molecules through ATR- FTIR, XPS and optical
methods. We have demonstrated the development of reliable multi-layers of cross-linkers for
efficient functionalization of capture biomolecule receptors (antibodies). Affinity based bio
sensing phenomena on polymer membranous substrates is demonstrated using C-reactive protein
(CRP) as a biomarker. CRP is widely studied and reliable biomarker for inflammatory and cardiac
diseases54. It is expressed in serum and urine.84 The occurrence of inflammatory disease conditions
causes elevated expression of CRP as high as 0.86 mg/L in urine.85 The effect of ionic properties
of buffer on Mo electrode was evaluated through cyclic voltammetry technique. The detection of
CRP has been evaluated in synthetic urine buffer through electrochemical impedance
spectroscopy.
Experimental Section
Materials and reagents
Glass substrates, (dithiobis (succinimidyl propionate)) (DSP), dimethyl sulfoxide (DMSO), and
ethanol were purchased from Thermo Fisher Scientific (MA, USA). N-hydroxysuccinimide
(NHS), 1-ethyl-3-(3-dimethylaminopropyl) carbodiimide hydrochloride (EDC), 2-(N-
Morpholino) ethanesulfonic acid (MES, pH 3), phosphate buffered saline (PBS, 0.1 M, pH 7),
Human serum (HS), Rhodamine 123, potassium hexacyanoferrate (III) (K3Fe(CN)6) were obtained
from Sigma Aldrich (MO, USA). α-CRP antibody and CRP antigen were procured from Abcam
(MA, USA). Synthetic urine (pH 6.3) was prepared freshly using the recipe published in previous

45
studies. Acrylic cellulose acetate sheets were obtained from Staples (TX, USA). All solvents and
reagents were of analytical grade and used as received.
Fabrication of Mo biosensor
A three electrode electrochemical configuration was used for evaluation in this work. The
schematic of a fabricated Mo biosensor is shown in Figure 10. Desired electrode pattern designed
using AutoCAD was translated on to the sensor substrate using shadow masks. Acrylic cellulose
acetate sheets with 0.5 inches thickness served as shadow masks and deposition of electrode
materials were performed using e-beam evaporation. Ratio of WE to CE surface area was
maintained at 3 in order to observe maximum signal response from the working electrode.62 The
working electrode (WE) and counter electrode (CE) consisted of 25 nm Cr/125 nm Mo and
reference electrode consisted of 25 nm Ti/125 nm Pt. Post deposition, the fabricated Mo biosensors
were stored in a nitrogen desiccator until further use.
Functionalization of Mo biosensor with crosslinker molecules
The binding interactions between Mo and organic molecule were evaluated using two crosslinkers
namely DSP, an organic molecule with thiol functional group and well-known EDC-NHS, a
molecule with carboxylic acid functional group. In a typical functionalization procedure,
fabricated Mo samples were washed with methanol and dried under nitrogen before treatment with
crosslinker molecules. Functionalization with thiol molecules involved treatment with 10 mM DSP
dissolved in DMSO at room temperature for an hour followed by 3x wash with DMSO to remove
any unbound DSP molecules. Similarly, functionalization with carboxylic acid group was achieved
by treating Mo samples with 400 mM of EDC and 100 mM of NHS prepared in MES for an hour
46
followed by 3x wash with MES buffer. Qualitative and quantitative analysis of such surface
modifications were obtained by characterization with optical, FTIR, and XPS measurements.
Blank Mo surface has a surface oxide state thereby forming a Mo-O groups (Figure 10). DSP is
an amine-reactive crosslinker which have affinity towards amino groups of antibodies. The thiol
chemistry between Mo and Sulphur is evaluated through material characterization of DSP
functionalized Mo surface. EDC is commonly used to react with carboxylic functional groups. The
other reactive end is conjugated with NHS thereby forming an amine-reactive esters of carboxylate
functional groups. Amino groups of the antibodies bind to the cross-linkers. NHS couples with
EDC to form a stable intermediate ester functional group. The primary amines of the proteins react
with the ester to form a stable amide conjugate.
Biosensing protocol
Surface functionalized Mo samples were first washed with PBS thrice before treatment with
antibody to maintain the same pH. Antibody immobilization was achieved by treatment with 1
μg/ml of α-CRP in PBS for 15 minutes followed by wash with testing buffer. Then, aliquots of
CRP antigen diluted in synthetic urine buffer were tested on antibody immobilized biosensor
surface starting with lowest concentration. All samples were incubated for five minutes followed
by 3x wash with buffer. Electrochemical measurements were taken at each step of immunoassay
and sample volume was maintained at 30 µL.

47
Characterization
Atomic force microscopy: The morphology of as deposited Mo was characterized with Veeco
Model 3100 Dimension V atomic probe microscope. Tapping mode antimony doped Silicon
coated with Chrome and Cobalt tips were used for imaging.
Contact angle measurements: The degree of hydrophobicity of free and functionalized Mo
samples were determined using goniometer (Ramě-hart Instruments Co, NJ, USA) based on
sessile-drop method. Measurements were taken at five different locations on the same sample with
a pure water droplet of ~ 1 mL and average of these five values were denoted as contact angle.
Fluorescence microscopy: The qualitative analysis of crosslinker functionalized Mo samples
labelled with Rhodamine 123 were acquired with Zeiss AXIO Vert A1 microscope equipped with
HAMATSU OCRA-flash4.0 camera using 20X magnification. Labelling was achieved by treating
functionalized Mo samples with 1 mM Rhodamine 123 dissolved in ethanol for 30 minutes in dark.
Fluorescence images were then obtained with excitation at 509 nm and emission was collected at
539 nm. This study is used to evaluate the surface coverage of crosslinkers in a qualitative way
only.
ATR-FTIR measurements: The infrared spectra of surface functionalized Mo samples were
recorded on a Nicolet iS50 FTIR spectrometer equipped with Ge Attenuated Total Reflectance
(ATR) accessory and DLaTGS detector. All absorbance spectral measurements were obtained at
a resolution of 4 cm-1 for 256 scans in the spectral range between 4000 cm-1 and 600 cm-1. Air was
used as reference background spectra.
XPS measurements: The surface composition of free Mo and surface functionalized Mo samples
were evaluated using X-ray photoelectron spectroscopy measurements. The samples were
48
analysed using PHI Versa Probe II X-ray photoelectron spectrometer equipped with Al Kα
monochromatic X-ray source and photoelectron take-off angle of 45°. Survey scans were
performed with pass energy of 187.850 and 0.8 eV. High resolution spectra were obtained with an
analyser of 23.5 eV at 0.2 eV. All binding energy (BE) values were referenced to the main C 1s
peak at 284.6 eV. Curve fitting and peak analysis were performed to understand the type of
chemical interaction between the crosslinker molecule and Mo electrode. The atomic
concentrations of the observed elements were calculated based on their corresponding peak areas.
Electrochemical measurements: The electrochemical performance of Mo biosensor was
evaluated using Ref 3000 potentiostat from Gamry instruments. Cyclic voltammetry
measurements in presence of the K3Fe(CN)6 from -0.8 V to +0.8 V with a scan rate of 100 mV/s
was performed to characterize electrode stability in various buffer medium. Similarly, EIS
measurements were obtained by applying a perturbed AC voltage signal of 10 mV amplitude over
frequency range from 1 Hz to 1 MHz under zero DC bias.
Results and Discussion
Surface morphology analysis
The mechanism that supports the covalent attachment of an organic molecule to sensor surface is
its morphological characteristics. Several research groups in past have demonstrated that the
surface roughness influence assembly of crosslinker molecules on its surface. 86 Thus, the surface
topography of deposited Mo thin films was evaluated using AFM in tapping mode. As shown in
Figure 10, the scanned surface image demonstrates a smooth and featureless surface with root
mean square value of roughness at 9.51 nm on glass substrate. This result confirms the conformal

49
deposition of Mo on to glass substrate. The scanning electron microscope (SEM) image (Figure
10) indicated a uniform deposition of Mo on the flexible nanoporous polyamide substrate.
Figure 10. Molybdenum crosslinker binding chemistry
(A) Mo sensor indicating the three-electrode system. (B) SEM image of Mo deposited on a porous
membrane substrate indicating uniform deposition. (C)AFM image of Mo surface indicating a
smooth profile indicating a uniform deposition of Mo on the sensor substrate and the insert table
indicating Ra( roughness average) and Rq( roughness root mean squared) (D) Schematic
representation of binding between Mo surface with the native surface oxide layer and DSP cross-
linker. (E) Schematic representation of binding between Mo surface with the native surface oxide
layer and EDC-NHS cross-linker
Surface wettability is another characteristic that determines interaction of organic crosslinker
molecules with Mo surface. Hence, contact angle measurements were conducted on free and

50
surface functionalized Mo samples on glass substrate and obtained results are shown in Figure 11.
Mo thin films show hydrophilic nature with measured contact angle at 49 ± 6°. After treatment
with DSP, contact angle of Mo was measured to be 32.1±2°. The contact angle of Mo surface after
EDC-NHS functionalization was measured to be 45±2°. Such a decrease in wettability
characteristics is evidence of assembly of organic functional groups on to Mo surface. In order to
compare the efficiency of surface coverages of thiol and carbodiimide cross-linkers, we performed
fluorescence microscopic characterization.
Figure 11. Contact angle measurements
Contact angle measurements on (A) Blank Mo sample. (B) DSP functionalized Mo surface (C)
EDC-NHS functionalized Mo surface. The decrease in the contact angle measurements with
respect to the blank Mo sample indicates the modification of surface
Fluorescence microscopy analysis
In order validate the success of Mo surface modification, we labelled the functionalized surface
with a green fluorescent dye namely Rhodamine 123 and performed studies with fluorescence
microscopy on Polyethylene terephthalate (PET) substrate. The NH2 groups of this chemical
compound specifically binds to NHS ester terminations in the crosslinker molecule and would
fluoresce when excited at 509 nm. Figure 12 shows the fluorescence microscopy analysis of
chemically modified Mo surfaces using fluorophore pre- and post-wash. In general, Mo due to its
high electrocatalytic properties has tendency to adsorb organic molecules on to its surface. This

51
behaviour poses an important challenge for accurate determination of effective surface coverage
via covalent attachment either via physisorption or chemisorption. Hence, these experiments
involved a blank Mo surface treated with fluorophore molecule as a control.
Figure 12 shows high-background signal caused by presence of high concentration of fluorophore
on Mo surface prior to wash step. We performed 5x wash with DI water to remove unbound
Rhodamine 123 molecules as it has the potential to interfere with qualitative determination of
surface coverage by crosslinker molecules. After washing, the fluorescence observed is evident of
crosslinker molecules binding to Mo surface and Figure 12 represents the images acquired on free,
DSP and EDC-NHS functionalized Mo surface. Higher the observed fluorescence, higher is the
density of tested crosslinker on Mo surface. EDC-NHS shows better coverage than DSP indicating
dominant functionalization of carboxylic acid groups on to Mo surface. However, these results
represent the effective number of linker molecules attached on to Mo surface only, while no
information regarding surface composition and chemistry is available.

52
Figure 12. Optical characterization of binding of Fluorescent molecule 123
(A) Blank Mo surface before wash condition (B) DSP functionalized Mo surface before wash
condition(C) EDC-NHS functionalized Mo surface before wash condition (D) Blank Mo surface
after wash condition (E) DSP functionalized Mo surface after wash condition indicating surface
coverage of Rh123 thereby indicating binding of DSP cross-linker on Mo surface (F) EDC-NHS
functionalized Mo surface after wash condition indicating enhanced surface coverage of Rh123
thereby indicating better binding of EDC-NHS cross-linker on Mo surface

53
ATR-FTIR analysis of surface modified Mo
The formation of Mo-linker binding and the subsequent chemical interactions was investigated
using ATR-FTIR measurements on glass substrate. The appearance of dominant peak
corresponding to molybdenum oxide represents the native oxide layer on Mo sample. Figure 13
illustrates the baseline corrected absorbance IR spectra of Mo surfaces after functionalization with
crosslinker molecules in order to enhance the resolution of peaks resulting from the chemical
interaction of cross-linkers with Mo sample. Under all conditions, IR spectra displays a broad and
dominant peak in the range between 800 cm-1 and 1000 cm-1, which is indicative of terminal metal-
oxygen bonds.87 Appearance of oxide peaks (i.e. Mo=O stretch) in the spectra is attributed to be
from passive oxide layer formation on deposited Mo thin films. The FTIR spectra of DSP
functionalized Mo sample after subtraction of Mo spectra shows the peaks corresponding to
organic functional groups (Figure 13 A). The peak at 1718 cm-1 corresponds to the presence of
ν(C=O) functional groups.88 The appearance of a peak at 2895 cm-1 corresponds to the presence
of ν (CH2) functional groups.89 The appearance of weak peaks corresponding to these organic
functional groups indicate the possible chemical interaction of DSP cross-linker onto the Mo
sample.

54
Figure 13. FTIR characterization on crosslinker functionalization
(A) FTIR spectra of DSP functionalized Mo sample after subtraction of the baseline Mo spectral
peaks. (B) FTIR spectra of EDC-NHS functionalized Mo sample after subtraction of Mo spectral
peaks. The spectra indicate the occurrence of peaks corresponding to organic functional groups
which indicate the possible chemical interaction between the cross-linkers with Mo sample.
The blank corrected FTIR spectra of EDC-NHS functionalized Mo sample is shown in Figure 13B.
The peaks corresponding to blank Mo sample were subtracted from the FTIR spectra and analysed
for EDC-NHS specific peaks. The spectra indicate a dominant peak at 3579 cm-1 which
corresponds to the (OH) stretch in a carboxylic acid functional group.90 The peak at 2840 cm-1
corresponds to the stretching of (C-H) bond in alkyl functional groups.91 The occurrence of peak
at 1670 cm-1 corresponds to the stretching vibration of ν(C=O) amide functional groups.92 The
peak occurrence at 1050 cm-1 is attributed to stretching of ν(C-N) bonds of aliphatic amines.93
However, IR spectra of both these crosslinker functionalization shows no other characteristic peaks
that corresponds to chemical structure of the molecule. This might be because the absorbance
intensity of other peaks is diminished by very high intensity from oxide peaks and hence no

55
significant changes are observed in the IR spectra. The appearance of more relevant signature
peaks corresponding to the carbodiimide cross-linkers indicate semi-quantitatively that EDC-NHS
may have a better chemical binding interactions with Mo surface as compared to DSP cross-
linkers.
XPS analysis of surface modified Mo
The chemical states of elements in a surface-functionalized Mo samples were investigated through
XPS peak analysis. The XPS experiments were performed with Mo deposited on a glass substrate.
For all conditions, recorded Mo 3d core level spectrum shows a doublet that is associated with Mo
3d3/2 and Mo 3d5/2 spin orbit coupling. Deconvolution and peak fitting with Gaussian function
shows that core levels of 3d spectrum can be fitted with two separate groups of Mo 3d doublets,
which corresponds to different oxidation states. The binding energies are represented in Table 2.
Spectra consisted of Mo 3d5/2 binding energies at 228.81 eV and 229.69 eV, 228.21 eV and 229.16
eV and 227.51 eV and 228.47 eV for free Mo, DSP treated Mo and EDC-NHS treated Mo
respectively. Peak positions for Mo 3d3/2 were at 231.87 eV and 232.42 eV surfaces. These peak
positions are in agreement with those found in literature for metallic Mo and various oxidation
states (i.e. Mo+5 and Mo+6 ).94
The O 1s spectrum shown in Figure 14A displays existence of two peaks each for Mo and DSP
treated Mo. The peak observed at ~ 530 eV is attributed to oxide formation and peak at ~532 eV
is due to adsorbed oxygen on to Mo.

56
Figure 14. XPS spectra on molybdenum and oxygen
(A) XPS spectra of blank molybdenum indicating doublet 3d peaks (B) XPS spectra of DSP
functionalized Mo (C) EDC-NHS functionalized Mo sample (D) Oxygen 1s XPS spectra of blank
Mo sample (E) Oxygen 1s XPS spectra of DSP functionalized Mo sample (F) Oxygen 1s XPS
spectra of EDC-NHS functionalized Mo sample
The chemical states of Mo, DSP treated Mo and EDC-NHS treated Mo were investigated by XPS
for Mo, at 231.49 and 232.94 eV for DSP treated Mo and at 230.78 eV and 232.53 eV for EDC-
NHS treated Mo to confirm surface modification both qualitatively and quantitatively.
For all conditions, recorded Mo 3d core level spectrum shows a doublet that is associated with Mo
3d3/2 and Mo 3d5/2 spin orbit coupling (Figure 14). Deconvolution and peak fitting with Gaussian
function shows that core levels of 3d spectrum can be fitted with two separate groups of Mo 3d

57
doublets, which corresponds to different oxidation states. In the case of EDC-NHS treated Mo,
decomposition of core O 1s spectrum shows existence of four peaks with binding energies at
527.89 eV, 529.86 eV, 531.42 eV and 532.50 eV. The major peak at observed at 531.42 eV is due
to the presence of organic C-O bonds which is evidence of functionalization of Mo surfaces with
EDC-NHS.
Analysis of C 1s spectrum is shown in Figure 15. The most noticeable peak at ~284.8 eV is
attributed to presence of C-C bonds due to carbon contamination or from functionalized crosslinker
molecules. We observe two additional peaks at 286.27 eV and 288.45 eV which are due to presence
of organic C-O-C and O-C=O bonds in EDC-NHS treated Mo surfaces.
Similarly, decomposition of N 1s spectrum for all the three conditions is represented in Figure 15.
The peak observed at a binding energy of ~395.7 eV is characteristic of Mo 3p3/2 component while
those observed at lower binding energies i.e. ~394 eV is attributed to Mo 3p. EDC-NHS treated
Mo displays a peak at ~399 eV that is attributed to imide nitrogen in the crosslinker molecule. This
further confirms the covalent attachment of EDC-NHS to Mo surface. We also observe a weak
shoulder at a binding energy of ~397 eV which is in agreement with literature for metallic nitrides
and much more detail studies have to be conducted to confirm this peak assignment.95

58
Figure 15. XPS spectra of Carbon and Nitrogen
(A) XPS spectra of Carbon 1 s spectra of blank Mo (B) XPS spectra of Carbon 1s of DSP
functionalized Mo sample (C) XPS Carbon 1s spectra of EDC-NHS functionalized Mo sample.
(D) XPS spectra of Nitrogen in blank Mo. (E) XPS spectra of Nitrogen 1s in DSP functionalized
Mo (F) XPS spectra of Nitrogen 1s of EDC-NHS functionalized Mo sample

59
Table 2. Comparison of position of Mo peaks in cross-linker in cross-linker functionalized
samples
Sample Type Binding Energy (eV)
Mo 3d3/2 Mo 3d5/2 Blank Mo 231.87 232.42 228.81 229.69 Mo+DSP 231.49 232.94 228.21 229.16
Mo+EDC-NHS 227.51 228.47 230.78 232.53
Thus, the high-resolution chemical studies conducted on different Mo surfaces reveal successful
functionalization of Mo with carboxylic acid functional groups and very weak binding interactions
with thiol groups.
Electrochemical characterization towards proof-of-feasibility for urinary biomarker
analysis.
The ionic properties of the buffer affect the electrochemical performance of the electrode. The
comparison of pH values of the buffers is demonstrated in Figure 16A. The pH of synthetic urine
was measured to be slightly acidic when compared to other buffers. The effect of the ionic
properties of the buffer on the electrochemical performance of electrode was evaluated through
cyclic voltametric studies (Figure 16B). The baseline electrochemical characterization studies
were performed on glass substrate. The positive voltage sweep demonstrated a positive
electrochemical peak current of 30 μA at 0.25 V and a negative peak current of 20 μA at 0.2 V.
These electrochemical peaks are attributed to the presence of Mo3+ and Mo6+ species.5 The data is
plotted is the mean value obtained from three cycles of measurement. The open circuit potential
(OCP) of all the buffers reached a steady state within 10 minutes and maintained stability after
reaching steady state (Figure 16C). The steady state behaviour of Mo electrode for multiple buffers

60
of varied pH indicate the ability of Mo for use in dipstick based electrochemical diagnostic
biosensors.
Figure 16. Electrochemical characterization of molybdenum electrode
(A) Comparison of pH for multiple buffers spanning acidic, neutral and alkaline media. Error bars
indicate standard error of mean from N=3 replicates. (B) Evaluation of electrochemical properties
with cyclic voltammetry experiments for multiple buffers. (C) Estimation of time to steady state
for buffer media indicating that the electrode reaching steady state within 10 minutes for all the
tested buffers
Affinity based biosensing was demonstrated using CRP protein with non-faradaic EIS method on
nanoporous polyamide substrate. Binding interactions between the surface-functionalized anti-

61
CRP antibody and the CRP antigen biomolecules results in the formation of electrical double layer
at the interface of electrode and buffer electrolyte. In an Impedimetric based assay, these binding
interactions at the electrical double layer causes changes in the impedance. The changes in
impedance is associated with resistive and capacitive components. The dominant resistive
components are solution resistance (Rs) and charge transfer resistance (Rct). The biomolecular
binding causes a transient build-up of charges which results in the changes in the capacitance. The
changes in double layer capacitance (Cdl) is the major capacitive component affecting the changes
in impedance. Nyquist and Bode plot analysis were performed to evaluate the electrochemical
performance of the biosensor (Figure 17). Nyquist analysis indicated that a clear distinguishability
between the multiple CRP concentration. The effect of buffer’s ionic properties is attributed to
changes in solution resistance which is observed at higher frequencies (>1000 Hz). Bode phase
plot indicated maximum changes in phase at lower frequencies. The demonstration of changes in
the phase of impedance is attributed to capacitive changes which thereby indicate the binding of
biomolecules. Maximum capacitive changes in phase were observed at 10 Hz (Figure 17B). The
calibration dose response (CDR) curve was henceforth plotted at 10 Hz frequency (Figure 17D).
Clear distinguishability in the CRP dose concentrations from 100 pg/ml to 1 µg/ml were obtained.
The sensor was tested in synthetic urine buffer medium. The Zmod measured at blank dose without
antigen was measured to be 32 kΩ. The sensor demonstrated a higher change in impedance with
increase in the CRP antigen concentrations. A 34% change in impedance with respect to blank
buffer for the lowest detectable CRP concentration of 100 pg/ml was measured. The change in
impedance with respect to blank buffer was calculated to be 75% for the highest concentration of
1 µg/ml. The higher change in impedance is the result of increase in the capacitance developed

62
due to biomolecular binding. The experimental values were fitted to the equivalent Randles
electrical circuit as shown in Figure 17 C. The experimental fit results indicated an increasing trend
for double layer capacitance (Cdl) for increasing CRP antigen concentrations (Table 3). The
resistive Rct component did not change appreciably for multiple CRP concentrations thereby
indicating that the change in impedances are driven by capacitive components in the circuit. The
other electrical parameters of the sensor were attributed to the resistance (RMo) and capacitance
(CMo) of molybdenum. However, these parameters did not change as a correlation to protein
concentrations. Thus, the linear correlation between changes in impedance with increasing CRP
concentrations indicates efficient binding interactions of biomolecules on the Mo electrode.
Figure 17. EIS characterization for CRP detection
(A) Nyquist plot indicating distinguishability between multiple CRP antigen concentrations (B)
Bode magnitude and phase analysis indicating maximum capacitive phase changes at encircled

63
region at 10 Hz. (C) Equivalent electrical circuit diagram of Mo biosensor (D) Calibration dose
response curve indicating percentage change in impedance for multiple CRP concentrations. Error
bars indicate standard error of mean from N=3 replicates
Table 3. Estimation of experimental data-fit parameters
Estimation of data-fit parameters
CRP
concentration
Rct (ohms) Cdl (F)
100 pg/ml 87521 6.24E-07
1 ng/ml 87600 6.74E-07
10 ng/ml 87611 7.18E-07
100 ng/ml 87609 7.37E-07
1 µg/ml 87597 7.85E-07
Conclusion
In summary, the binding interactions between Mo electrode and two cross-linker molecules
namely DSP and EDC-NHS have been characterized. The XPS and FTIR characterization results
showed evidence of binding of cross-linker molecules to the Mo electrode in spite of the presence
of passive oxide layer. EDC-NHS cross-linker was favourable over DSP for binding to Mo
electrode surface. Electrochemical characterization of Mo electrode demonstrated the stability of
Mo electrode for different buffer solutions. Affinity based electrochemical biosensing application
of Mo electrode was demonstrated using EIS method. The impedance of the sensor showed an
increasing trend in change in impedance with increase in the CRP antigen concentration. A limit
of detection threshold of 100 pg/ml was achieved in synthetic urine buffer. This concentration is

64
also the physiological threshold concentration for elevated presence of CRP in urine.85 The stable
behaviour of Mo electrode in multiple buffer media may be utilized to develop dipstick based
biosensors.

65
CHAPTER 6
PORTABLE ELECTROCHEMICAL DIPSTICK BIOSENSOR USING MOLYBDENUM
ELECTRODE FOR DETECTION OF INFLMMATORY BIOMARKERS
Abstract
Molybdenum (Mo) electrode has been used to develop electrochemical dipstick biosensor for the
detection of two key inflammatory biomarkers, CRP and IL-6. Non-faradaic, label-free
Electrochemical Impedance Spectroscopy (EIS) was used to capture the signal response occurring
from biomolecular binding. Binding affinity between EDC-NHS crosslinker and antibodies on Mo
surface was validated through Fourier Transform Infrared Spectroscopy (FTIR) technique. The
sensor’s performance was evaluated in human urine samples and synthetic urine of three pH ranges
(5.5, 6.5 and 7.5). The scope for portability in the design was demonstrated by preliminary
comparison of impedance measurements between standard potentiostat and portable hardware
prototype.
Introduction
Inflammatory biomarkers are significant predicators of physiological condition in humans. Two
prominent markers in particular, CRP and IL-6, are associated with various disease conditions
such as cardiovascular disease, depression, renal insufficiency, cancer, Chronic Obstructive
Pulmonary Disease (COPD) etc.96 Elevated levels of the cytokine IL-6 has also been associated
with various types of cancers, periodontal disease, arthritis, as well as type-2 diabetes. The
detection of IL-6 in urine holds critical significance in the diagnosis of urinary infections. Elevated

66
levels of IL-6 has been observed in cases of patients who had undergone kidney transplantation
and in acute rejection situations.97 The levels of IL-6 in patients diagnosed with asymptomatic
bacteriuria has been found to be present at an elevated levels only in urine and not in serum citing
local production of IL-6.98 Thus, IL-6 detection in urine holds relevance in such local occurrence
of elevated levels in cases of renal diseases. C-reactive protein (CRP) is a significant biomarker
for diagnosis of inflammatory responses. During inflammatory stimulus, the CRP levels show a
significant spike in its levels. Table 4 summarizes the past work towards detection of biomolecules
in urine. Majority of the prior work have focused on the detection of metabolites in the urine. Early
detection of elevated levels of these biomarkers would help to prevent mortality due to fatal
diseases. In isolation, elevated levels of these biomarkers could lend themselves to a vast range of
differing diagnosis, but in conjunction with detection of other biomarkers a greater level of
granularity can be achieved in the resulting diagnosis. Thus, the development of a point-of-care
(PoC) diagnostic biosensor for the detection of inflammatory disease has great value towards
reliable home-based monitoring of diseases.
The emergence of PoC diagnostic biosensors has enabled the early detection of disease, reducing
diagnosis time requirements compared to reliance on laboratory based testing. The cost-
effectiveness and rapid detection features of these PoC biosensors has made them attractive for
use in resource limited environments for rapid disease diagnosis.99 Thus, diagnostic utility of PoC
biosensors for the detection of biomarkers from physiological media such as sweat, urine, and
saliva has been of significant interest owing to their non-invasive mechanism of detection. There
is no necessity for trained personnel to collect specimens thereby enabling home based disease
diagnosis.27 The class of dipstick based biosensors have been demonstrated for rapid biomarker

67
detection.100 Easy manufacturability and user-friendly design of the dipstick form factor has
favored their use in pH strips as well as several urine dipstick test kits.34, 100a The output format of
the current dipstick biosensors are predominantly qualitative and colorimetric in nature which
makes integration with other data readout devices challenging.101 Thus, there is an imminent need
for biosensors which can provide quantitative or semi-quantitative information about the target
analyte. Unlike their colorimetric counterpart, electrochemical dipsticks help in addressing the
challenges associated with visual interpretation of results and also favors the miniaturization of
form-factor.102 Electrochemical dipsticks provide quantitative/semi-quantitative output and can be
interfaced with other electronic indicator hardware. They also have scope for miniaturization and
are inexpensive as they possess scope for large scale manufacturing. The development of dipstick
biosensors is focused on the non-invasive based detection of biomarkers from biological fluids
such as urine, sweat, saliva etc. Urine is considered a useful biological fluid as it consists of a
mixture of many significant proteins which are of relevance for disease diagnosis. Urinary
concentrations of inflammatory biomarkers such as IL-6 and CRP are elevated during disease
conditions.

68
Table 4. Prior work on urine based biomolecule detection
The development of flexible substrate based biosensors enable the development of disposable
point of care biosensors which can be manufactured in large batches in a cost-efficient manner.
Various flexible porous substrates have been evaluated as biosensor substrates owing to their
ability for large scale batch manufacturing and disposable nature.112 These nanoporous substrates
also aid in the amplification of signal response from affinity based binding of biomolecules in the
Class Biomarker Detection Method Detection
Limit
Response
Time
Reference
Metabolite Glucose Colorimetric 3e-7 mol L-1 20 minutes 103
Human serum
Albumin (HSA)
Chemiluminescence 2.5 mg L-1 32 minutes 104
Cocaine Colorimetric 1 nM N/A 105
Human growth
hormone (hGH)
Bimodal
Waveguide
Interferometry
10 pg mL-1 8 minutes 106
Creatinine Electrochemical 16 pg/mL N/A 107
Bacteria S. haematobium Electrochemical 0.53 ng/μL 60 minutes 108
Protein NMP22 Electrochemical 3.3 pg/mL N/A 109
hCG Electrochemical 2.4 pg/mL 30 minutes 110
TGF-β1 Electrochemical 10 pg/mL 20 minutes 111
IL-6 , CRP Electrochemical 1 pg/mL 5 minutes This work

69
pores. The presence of nanoporous structures enhance the charge screening from non-specific
molecules.24 Polyamide membranes are a favorable biosensor substrate due to their physical
stability and hydrophilic property making them ideal candidates for a dipstick assay. Electrodes
can be easily deposited on to the flexible polyamide membrane through various metal deposition
technique. The electrochemical properties of the electrode material are the driving factor in
capturing the signal response from the biomolecular binding. In the past, Gold has been the
preferred choice of electrode material for various electrochemical biosensors. However, there is a
growing research in the evaluation of other transition group elements as biosensor electrodes.
Molybdenum is a transition group element and its compounds have demonstrated good electrical
conducting properties.113 The compounds of molybdenum have been evaluated as cathode for
lithium batteries.114 Molybdenum oxide films exhibit pseudocapacitive property which has favored
its use as electrode material in micro-scale electrochemical capacitors due to enhanced charge
storage kinetics.115 Pseudocapacitance is a phenomenon of charge storage at or near the surface of
the material.116 Molybdenum oxide has been evaluated as an electrode material in Lithium ion
batteries due to their favorable electrochemical properties.117 Thus, the favorable electrochemical
properties of Mo support their evaluation as an electrode material for electrochemical biosensors.
This work is focused on the development of portable point of care dipstick biosensor for
multiplexed detection of IL-6 and CRP in human urine using non-faradaic Electrochemical
Impedance Spectroscopy (EIS) biosensing. Mo forms a passive surface oxide layer which restricts
the choice of crosslinkers to those which exhibit affinity to metal oxide chemical species. EDC-
NHS is one such crosslinker which has been evaluated for chemical conjugation with metal oxide
thin films.118 The binding interactions between EDC-NHS functionalized Mo and CRP and IL-6

70
antibody have been characterized through Fourier Transform Infrared Spectroscopy (FTIR). The
detection of CRP and IL-6 in human urine and synthetic urine has been demonstrated using non-
faradaic EIS technique covering the physiologically relevant ranges of pH.
Figure 18. Schematic representation of dipstick biosensor
A) Modified Randles Cell used to model the molybdenum sensor interface. B) Schematic
representation of the sensor, experimental set-up, and device display. C) Schematic detailing the
constructed assay for both detection of IL-6 and CRP.

71
Materials and Methods
Materials and Reagents
N-hydroxysuccinimide (NHS), 1-ethyl-3-(3-dimethylaminopropyl) carbodiimide hydrochloride
(EDC), 2-(N-Morpholino)ethanesulfonic acid (MES, pH 3), phosphate buffered saline (PBS, 0.1
M, pH 7), were obtained from Sigma Aldrich (MO, USA). α-CRP antibody, α-IL-6 antibody and
CRP antigen were procured from Abcam (MA, USA). IL-6 protein was procured from Thermo
Fisher Scientific Inc. (MA, USA). Pooled human urine samples were purchased from Lee
Biosolutions, Inc (MO, USA) Acrylic cellulose acetate sheets were obtained from Staples (TX,
USA). Kapton backing support material was obtained from McMaster Carr (TX, USA). Polyamide
membranes of 200 nm pore size were obtained from GE Healthcare (NJ, USA) All solvents and
reagents were of analytical grade and used as received.
Fabrication and assembly of Mo biosensor
The two-electrode pattern utilized in this work was designed in Autodesk AutoCAD software and
was translated to the base polyamide substrates using acrylic cellulose acetate shadow masks
during electron beam evaporation process. Gold was deposited as the base layer to improve the
overall sensor conductivity. Molybdenum was deposited upon the gold base layer leaving the
contact pads exposed for interfacing with instruments. Post deposition, the sensors were stored
under nitrogen desiccation until use. To give the dipstick sensor structural integrity a Kapton
adhesive backing was affixed to the bottom of the fabricated sensor. A secondary acrylic adhesive
glue was patterned just below the contact pads of the sensor to restrict the samples ability of
wicking to, and shorting the electrical contact pads.

72
Experimental protocol for biosensing experiments with synthetic urine
A 1:1 mixture of 100 mM N-hydroxysuccinimide(NHS) and 400 mM 1-ethyl-3-(3-
dimethylaminopropyl) carbodiimide hydrochloride (EDC) was dissolved in 2-(N-Morpholino)
ethanesulfonic acid (MES, pH 3) buffer just prior to the incubation. EDC-NHS mixture was
immediately introduced at the sensing region of the sensor and incubated for one hour. EIS
measurements were performed at each assay functionalization and dose step on the lab instrument
and constructed instrumentation in parallel, using a Gamry Reference 3000 potentiostat (PA, USA)
as the lab instrument. An alternating current (AC) voltage of 10 mVRMS was applied with a
frequency sweep of 1 Hz to 1 MHz. Post EDC-NHS functionalization, 8 µL of PBS was added to
the sensing region to remove any unbound crosslinker. 10 µg/ml of monoclonal antibody (IL-6
/CRP) in 0.1 M PBS was added and incubated for 15 minutes. A zero dose or blank dose
measurement was performed by dipping the sensor in a cuvette containing synthetic urine in the
absence of CRP or IL-6.The sample volume of the buffer in the cuvette was maintained at 300 µL.
Three different pH ranges (5.5, 6.5 and 7.5) of synthetic urine buffer were tested for detection of
CRP and IL-6. After a zero-dose baseline, the sensor was dipped serially in logarithmically
increasing doses of target protein suspended in human urine allowing for a 5-minute incubation
time before each measurement. A low IL-6 concentration of 1 pg/mL and a high concentration of
10 ng/ml was tested for each pH range of synthetic urine. All antigen doses were prepared in
separate cuvettes. All doses were performed on a single sensor, but only one target protein was
tested on any given sensor.

73
Experimental protocol for biosensing experiments with human urine
Electrochemical detection of the IL-6 and CRP were also performed with pooled human urine
samples. The experimental protocol for the functionalization of crosslinker and antibody on Mo
electrode was same as that of synthetic urine. IL-6 antigen concentrations from 1 pg/ml to 10 ng/ml
and CRP antigen concentrations from 1 pg/ml to 100 ng/ml were tested with human urine.
FTIR characterization analysis
Attenuated total reflectance Fourier transform infrared (ATR-FTIR) spectrograms were obtained
to establish the binding of the EDC-NHS crosslinker to the molybdenum surface, and subsequent
binding of IL-6 and CRP antibody to the EDC-NHS crosslinker. The tool was equipped with a
deuterated triglycine sulfate (DTGS) detector and KBr window. A Harrick VariGATR sampling
stage with a 65° Germanium ATR crystal was used in this study. Measurements were taken in the
range of 4000 – 600 cm-1 with 4 cm-1 resolution. Represented data is the average of 512 scans.
ATR-FTIR samples were prepared as follows: Cleaned microscope slides were patterned with a
layer of 100 nm Gold and 100 nm molybdenum using electron-beam evaporation process
analogous to that used in the fabrication of the sensors. The bare molybdenum samples were
sonicated with isopropyl alcohol and DI water and nitrogen dried completely before measurement.
The functionalized samples were incubated with 100 µL of the EDC-NHS mixture for one hour.
A 3x PBS wash was conducted to remove any unbound crosslinker. After washing and complete
nitrogen dry, the Mo-EDC-NHS measurement was taken. After EDC-NHS functionalization, 100
µL of 10 µg/mL target antibody was incubated on the sample surface for an additional 30 minutes.
A 3x PBS wash was conducted to remove unbound antibody. After a complete nitrogen dry the

74
antibody measurement was taken. All measurements represent individual samples. Samples were
not used for more than one measurement.
Testing with portable electronic platform
The proof-of-concept portable electronic platform was built using off-shelf components and
Arduino Uno R3 microcontroller. A digital-to-analog Converter in conjunction with a high-pass
filter was used to generate a sinusoidal 1 Hz single frequency EIS signal at 10 mVrms with 0 Vdc
offset. The resulting current at the working electrode of the sensor was measured using a low-side
current sense circuit. The resulting response was captured and compared to the excitation signal to
calculate the effective impedance over the sensor. An analog-to-digital converter to read results
back to the microcontroller for reporting. For this first-generation device, analysis was done off-
board post data acquisition.
Results and Discussion
ATR-FTIR characterization
Figure 19a shows the ATR-FTIR spectra for the binding of the EDC-NHS complex to the
molybdenum electrode interface, as well as the binding of IL-6 and CRP antibody to the bound
EDC-NHS complex. The first measurement was done on a bare molybdenum surface pre-
functionalization steps. The spectrum shows an absence of discernible peaks with a broad peak
manifesting from 900 – 1100 cm-1. This broad peak is characteristic of the Mo-O oxide layer that
is leveraged for EDC-NHS binding. The oxide peak is still present, but less noticeable in the
following functionalization steps as those measurements subtract the bare molybdenum baseline

75
from their measurement spectra. The peaks seen at 1649, 1645 cm-1, and 1614 cm-1 are indicative
of the v(C=O) carbonyl stretching of the EDC-NHS, but will be visible even after antibody
conjugation to the EDC-NHS. The peak at 1564 cm-1 is characteristic of the N-H stretch of the
EDC. The peaks at 1262, 1254, and 1267 cm-1 are from v(C-N) vibrational stretching also seen in
all three measurements. The 1229 cm-1 peak in the EDC-NHS spectrum is from the stretching
vibration of the v(N-O) as part of the NHS group and is not visible in either of the antibody
measurements which is indicative of antibody binding to the EDC-NHS. These results give
evidence that the EDC-NHS complex is binding to the oxide layer of the molybdenum surface,
and that both the IL-6 and CRP antibodies are subsequently binding to the EDC-NHS.
Figure 19. FTIR spectra of antibody binding on crosslinker functionalized Mo surface
ATR-FTIR spectra of bare molybdenum electrode, EDC-NHS functionalized electrode,
Functionalized electrodes with CRP Antibody, and functionalized electrodes with IL-6 Antibody.
The functionalization spectra have the bare Mo spectra subtracted out

76
Electrochemical detection of CRP and IL-6 in synthetic urine
Electrochemical detection of CRP and IL-6 were demonstrated in synthetic urine in three pH
ranges namely pH 5.5, 6.5 and 7.5. The biosensor’s impedance response was evaluated by
calculating the percentage change in the modulus of impedance post the antibody functionalization
step. Figure 20A shows the EIS characterization of CRP antigen concentrations in synthetic urine.
A low CRP antigen concentration of 1 pg/mL and a high CRP concentration of 100 ng/mL was
tested for three pH ranges namely 5.5, 6.5 and 7.5. Figure 20A shows the change in impedance
with respect to the baseline functionalization step for low and high CRP antigen concentrations.
The impedance values were analyzed at 1 Hz frequency. The analysis frequency was determined
from the Bode phase analysis which is explained in Appendix. The sensor demonstrated same
trend in impedance for all three pH buffer ranges of synthetic urine. Figure 20B shows the change
in impedance for pH buffer 6.45. The change in impedance ranged approximately 20% for 1 pg/ml
CRP concentration to 60 % for 100 ng/ml CRP concentration. A specific signal threshold (SST)
of 13% was calculated for the CRP detection assay steps with a signal to noise ratio of 3. Figure
20C represents the percentage change in impedance for the low and high IL-6 antigen
concentrations. An increasing trend in modulus of change in impedance was observed for
increasing IL-6 antigen concentrations. This trend was observed in all three pH ranges. The change
in impedance is the result of capacitive binding between the IL-6 antibody and IL-6 antigen. The
percentage change in impedance for 1 pg/ml of IL-6 antigen with respect to the baseline
functionalization step was calculated to be approximately 20 % for all three pH ranges which was
above the measured an SST of 11 % calculated with a signal to noise ratio of 3. A change in
impedance of approximately 50% was measured for the high concentration of 10 ng/mL ( Figure

77
20D). The biomolecular binding at the electrode electrolyte interfaces increases the double layer
capacitance resulting in the change in impedance.
Figure 20. Detection of CRP and IL-6 in synthetic urine with varying pH
(A) Change in impedance analysis for low and high CRP antigen concentrations in three pH ranges
of synthetic urine. Dotted lines indicate specific signal threshold (SST) (B) Impedance analysis for
pH 6.45 synthetic urine. (C) Change in impedance analysis for low and high IL-6 antigen
concentrations in three pH buffer ranges of synthetic urine. The dotted lines indicate Specific
Signal Threshold. (D) Change in impedance analysis for four IL-6 antigen concentrations in pH
6.5 buffer of synthetic urine.

78
Electrochemical detection of CRP and IL-6 in human urine
The detection of CRP and IL-6 antigen concentrations were performed in pooled human urine
samples. The mean pH of the human urine samples were measured to be 6.4.
Figure 21. Dose response analysis for CRP and IL-6 detection in human urine
(A) Change in impedance analysis for CRP antigen concentrations (B) Change in impedance
analysis for IL-6 antigen concentrations. Dotted lines indicate specific signal threshold (SST)
Figure 21A indicates the change in impedance for increasing CRP antigen concentrations from 1
pg/mL to 100 ng/mL. An SST of 21 % was calculated for the CRP detection assay. The limit of
detection was therefore determined to be at 1 pg/mL. The change in impedance varied from 30 %
to 61 % between the lowest and highest antigen concentrations. Figure 21B shows the change in
impedance for the IL-6 antigen concentrations. The LoD for the IL-6 assay was also determined
to be 1 pg/mL. The change in impedance for the highest IL-6 concentration of 10 ng/mL was
measured to be approximately 50%.
Thus, clear distinguishability in impedance curves were obtained for both CRP and IL-6
biomolecules. The change in impedances were the result of capacitive changes occurring due to

79
biomolecular binding at the molybdenum electrode surface. The detection of both the
inflammatory biomarkers is favored for specific disease detection and prognosis.
Comparison of impedance response with portable electronic hardware prototype
To demonstrate the translatability of the developed multiplexed dipstick assay into a true portable
and PoC device, a portable reader was created for single frequency EIS analysis of the sensor at
the 1 Hz point of analysis used for detection of the target proteins on the benchtop instrument. The
device was designed to capture the changes in impedance response of the sensor from the post-
functionalization baseline to the selected dose regimes of either CRP or IL-6 to the same level of
sensitivity as can be attained by the benchtop instrument. For this proof-of-concept device LED
indicators were used to report the detected levels of target protein (blank/no detection, 1 – 100
pg/mL, and 100 ng/mL). This correlation is plotted in figure 22 and shows a linear response with
an R2 value of 0.99. The governing equation y = 1.058x – 141.6 shows a near 1 slope. A 141.6 Ω
offset exists between the two instruments, but the offset is constant and predictable between
measurements making it easily accounted for. The main source of error in the correlation of the
two tools came from fluctuations in solution resistance as function of time when reconfiguring the
sensor from one tool to another, which is not a factor of the device itself. Overall, the device
demonstrates translatability of the urine dipstick for inflammatory biomarkers towards a true PoC
diagnostic form factor.

80
Figure 22. Linear impedance correlation between electronic device and lab instrument.
Conclusions
An affinity based electrochemical biosensor for the detection of two critical inflammatory
biomarkers namely CRP and IL-6 was developed using Mo electrode. Binding characteristics of
CRP and IL-6 antibody with EDC-NHS functionalized Mo surface was validated using FTIR
technique. The affinity based antigen-antibody binding was characterized through non-faradaic
electrochemical impedance spectroscopy. The biosensor exhibited ability to detect CRP and IL-6
antigen concentration as low as 1 pg/ml in both pooled human urine and synthetic urine samples.
The sensor demonstrated stability in performance in multiple pH buffer ranges.

81
CHAPTER 7
CONCLUSION
In this dissertation, molybdenum (Mo) has been evaluated as an electrode material for affinity
based electrochemical dipstick biosensor. The objective of this work is to develop a stable
electrode system for reliable detection of target biomolecules using affinity based electrochemical
dipstick biosensors. A stable deposition profile was observed for multiple fabrication batches. The
biosensing application of Mo electrode was demonstrated through the detection of inflammatory
biomarkers namely CRP and IL-6.
The deposition parameters for electron beam evaporation based Mo electrode on a porous flexible
polyamide substrate were defined and the deposition profile of the fabricated sensor was evaluated
through material characterization techniques such as SEM and EDAX. These results are discussed
in chapter 2. The preliminary evaluation of affinity based biosensing application was performed
using cTnI biomolecule.
In chapter 3, the interaction between Mo electrode surface and the crosslinker molecules were
investigated. Two crosslinker molecules namely DSP and EDC-NHS were evaluated and the
binding affinity between the crosslinker molecules with Mo electrode was characterized using
FTIR, XPS and fluorescence microscopy characterization methods. Electrochemical
characterization of the Mo electrode in varied buffers were characterized.
In chapter 4, affinity based electrochemical biosensing application was demonstrated with Mo
electrode was performed using non-faradaic electrochemical impedance spectroscopy technique.
In chapter 5, the chemical affinity between Mo with thiol and carbodiimide crosslinkers were

82
investigated using FTIR, XPS, fluorescence microscopy and contact angle measurements. In
chapter 6, electrochemical affinity based urine dipstick detection was discussed. Two
inflammatory biomarkers namely CRP and IL-6 were detected in the range from 1 pg/ml to 100
ng/mL for CRP and from 1 pg/ml to 10 ng/mL for IL-6. The detection of these biomarkers were
tested in human urine and synthetic urine samples in multiple pH ranges. The sensor performance
was tested using a standard benchtop commercial potentiostat and a portable electronic
potentiostat.
Thus, Mo displayed favorable electrochemical properties for use as an electrode material. The
surface morphology analysis indicated the possibility of achieving a uniform electrode deposition.
The surface characterization analysis proved the presence of chemical affinity between the
crosslinker molecules with Mo electrode. The electrode established the ability to detect change in
impedance between varying assay conditions and hence holds scope for use as electrode material
in affinity based electrochemical biosensors.

83
APPENDIX
Nyquist and Bode Phase analysis for CRP and IL-6 detection
The frequency response study of the biosensor for the detection of IL-6 and CRP was performed
with Bode phase and Nyquist plots. The frequency of the input voltage signal was swept from 0.1
Hz to 1 MHz. Figure 23 demonstrates the Nyquist and Bode phase plots for IL-6 and CRP detection
in synthetic urine buffer with pH 6.5.
Figure 23. Nyquist and Bode Phase analysis for IL-6 and CRP detection
A. Phase analysis of CRP indicates the presence of dominant capacitive reactance at 1 Hz
frequency. B. Nyquist plot indicates the correlation between CRP antigen concentration and
impedance values. C. Phase response indicates the presence of capacitive reactance at 1 Hz

84
frequency. D. Nyquist plot indicates the correlation between the IL-6 antigen and impedance
values.
The Bode phase plot of CRP (Figure 23A) indicates the change in phase of the impedance with
frequencies. The phase plot demonstrated a capacitive reactance region at 1 Hz where a dominant
capacitance and resistance component was present. Thus, this transition frequency was selected
for impedance analysis for subsequent assay steps. Similarly, Bode phase plot of IL-6 (Figure 23
C) also demonstrated a capacitive reactance region at 1 Hz. Figure 23B shows the Nyquist response
for varying CRP antigen concentrations. Nyquist plot demonstrated a correlation between CRP
concentrations and impedance values. Similarly, the Nyquist plot for IL-6 detection (Figure 23D)
also demonstrated a trend in the impedance values which is correlated with concentration of the
IL-6 antigen. The shift in the x intercept of the Nyquist plot is explained as the variation in the
solution resistance component (Rsol). The change in the solution resistance is attributed to the bulk
ionic effect resulting from the constituents of the buffer solution. Thus, the Nyquist response of
CRP and IL-6 assays demonstrated the ability to detect the change in impedance for multiple assay
steps and establish a correlation with the antigen concentration.

85
REFERENCES
1.Baryeh, K.; Takalkar, S.; Lund, M.; Liu, G., 1 - Introduction to medical biosensors for point of
care applications A2 - Narayan, Roger J. In Medical Biosensors for Point of Care (POC)
Applications, Woodhead Publishing: 2017; pp 3-25.
2.Daniels, J. S.; Pourmand, N., Label‐free impedance biosensors: Opportunities and challenges.
Electroanalysis 2007, 19 (12), 1239-1257.
3.Gubala, V.; Harris, L. F.; Ricco, A. J.; Tan, M. X.; Williams, D. E., Point of Care Diagnostics:
Status and Future. Analytical Chemistry 2012, 84 (2), 487-515.
4.Kim, J.-Y.; Jang, D.; Greer, J. R., Tensile and compressive behavior of tungsten, molybdenum,
tantalum and niobium at the nanoscale. Acta Materialia 2010, 58 (7), 2355-2363.
5. Saji, V. S.; Lee, C. W., Molybdenum, molybdenum oxides, and their electrochemistry.
ChemSusChem 2012, 5 (7), 1146-1161.
6.Cherng, J.; Chen, T.; Lin, C., Pulsed-DC sputtering of molybdenum bottom electrode and
piezoelectric aluminum nitride films for bulk acoustic resonator applications. Thin Solid Films
2011, 519 (20), 6797-6800.
7.Cao, Q.; Hur, S. H.; Zhu, Z. T.; Sun, Y. G.; Wang, C. J.; Meitl, M. A.; Shim, M.; Rogers, J. A.,
Highly Bendable, Transparent Thin‐Film Transistors That Use Carbon‐Nanotube‐Based
Conductors and Semiconductors with Elastomeric Dielectrics. Advanced Materials 2006, 18 (3),
304-309.
8. Padilha, J. C.; Martini, E. M. A.; Brum, C.; de Souza, M. O.; de Souza, R. F., Study of
molybdenum electrodes for hydrogen evolution reaction. Journal of Power Sources 2009, 194
(1), 482-485.
9.Gao, M.-R.; Liang, J.-X.; Zheng, Y.-R.; Xu, Y.-F.; Jiang, J.; Gao, Q.; Li, J.; Yu, S.-H., An
efficient molybdenum disulfide/cobalt diselenide hybrid catalyst for electrochemical hydrogen
generation. Nature communications 2015, 6.
10.Cheng, R.; Jiang, S.; Chen, Y.; Liu, Y.; Weiss, N.; Cheng, H.-C.; Wu, H.; Huang, Y.; Duan,
X., Few-layer molybdenum disulfide transistors and circuits for high-speed flexible electronics.
2014, 5, 5143.
11.Shen, B.; Malshe, A. P.; Kalita, P.; Shih, A. J., Performance of novel MoS2 nanoparticles
based grinding fluids in minimum quantity lubrication grinding. Trans. NAMRI/SME 2008, 36
(357), e364.

86
12.(a) Wu, H. B.; Xia, B. Y.; Yu, L.; Yu, X.-Y.; Lou, X. W. D., Porous molybdenum carbide
nano-octahedrons synthesized via confined carburization in metal-organic frameworks for
efficient hydrogen production. Nature communications 2015, 6; (b) Wu, M.; Lin, X.; Hagfeldt,
A.; Ma, T., Low‐Cost Molybdenum Carbide and Tungsten Carbide Counter Electrodes for Dye‐Sensitized Solar Cells. Angewandte Chemie International Edition 2011, 50 (15), 3520-3524.
13.Ghosh, R. N.; Askeland, P. A.; Kramer, S.; Loloee, R., Optical dissolved oxygen sensor
utilizing molybdenum chloride cluster phosphorescence. Applied Physics Letters 2011, 98 (22),
221103.
14.(a) Sarkar, D.; Liu, W.; Xie, X.; Anselmo, A. C.; Mitragotri, S.; Banerjee, K., MoS2 Field-
Effect Transistor for Next-Generation Label-Free Biosensors. ACS Nano 2014, 8 (4), 3992-4003;
(b) Lee, J.; Dak, P.; Lee, Y.; Park, H.; Choi, W.; Alam, M. A.; Kim, S., Two-dimensional
layered MoS2 biosensors enable highly sensitive detection of biomolecules. Scientific reports
2014, 4.
15.Hille, R.; Hall, J.; Basu, P., The Mononuclear Molybdenum Enzymes. Chemical Reviews
2014, 114 (7), 3963-4038.
16. (a) Li, Z.-H.; Cho, E.-S.; Kwon, S. J., Molybdenum thin film deposited by in-line DC
magnetron sputtering as a back contact for Cu(In,Ga)Se2 solar cells. Applied Surface Science
2011, 257 (22), 9682-9688; (b) Pethe, S. A.; Takahashi, E.; Kaul, A.; Dhere, N. G., Effect of
sputtering process parameters on film properties of molybdenum back contact. Solar Energy
Materials and Solar Cells 2012, 100, 1-5.
17.Khan, M.; Islam, M., Deposition and characterization of molybdenum thin films using dc-
plasma magnetron sputtering. Semiconductors 2013, 47 (12), 1610-1615.
18.https://pubchem.ncbi.nlm.nih.gov/compound/23932.
19.Vink, T. J.; Somers, M. A. J.; Daams, J. L. C.; Dirks, A. G., Stress, strain, and microstructure
of sputter‐deposited Mo thin films. Journal of Applied Physics 1991, 70 (8), 4301-4308.
20.Zhang, S.; Wang, N.; Yu, H.; Niu, Y.; Sun, C., Covalent attachment of glucose oxidase to an
Au electrode modified with gold nanoparticles for use as glucose biosensor. Bioelectrochemistry
2005, 67 (1), 15-22.
21.Farsinezhad, S.; Mohammadpour, A.; Dalrymple, A. N.; Geisinger, J.; Kar, P.; Brett, M. J.;
Shankar, K., Transparent anodic TiO2 nanotube arrays on plastic substrates for disposable
biosensors and flexible electronics. Journal of nanoscience and nanotechnology 2013, 13 (4),
2885-2891.
22.Lue, C.-E.; Wang, I.-S.; Huang, C.-H.; Shiao, Y.-T.; Wang, H.-C.; Yang, C.-M.; Hsu, S.-H.;
Chang, C.-Y.; Wang, W.; Lai, C.-S., pH sensing reliability of flexible ITO/PET electrodes on
EGFETs prepared by a roll-to-roll process. Microelectronics Reliability 2012, 52 (8), 1651-1654.

87
23.(a) Arecchi, A.; Scampicchio, M.; Drusch, S.; Mannino, S., Nanofibrous membrane based
tyrosinase-biosensor for the detection of phenolic compounds. Analytica Chimica Acta 2010, 659
(1), 133-136; (b) Scampicchio, M.; Arecchi, A.; Lawrence, N. S.; Mannino, S., Nylon
nanofibrous membrane for mediated glucose biosensing. Sensors and Actuators B: Chemical
2010, 145 (1), 394-397.
24.Panneer Selvam, A.; Prasad, S.; Barrett, T. W.; Kazmierczak, S. C., Electrical nanowell
diagnostics sensors for rapid and ultrasensitive detection of prostate-specific antigen.
Nanomedicine 2015, 10 (16), 2527-2536.
25.Rogers, K. R., Principles of affinity-based biosensors. Molecular Biotechnology 2000, 14 (2),
109-129.
26.Selvam, A. P.; Prasad, S., Nanosensor electrical immunoassay for quantitative detection of
NT-pro brain natriuretic peptide. Future cardiology 2013, 9 (1), 137-147.
27.Prasad, S.; Tyagi, A. K.; Aggarwal, B. B., Detection of inflammatory biomarkers in saliva
and urine: Potential in diagnosis, prevention, and treatment for chronic diseases. Experimental
Biology and Medicine 2016, 241 (8), 783-799.
28.El-Khier, N. A.; Ael, R. E. G.; Elgeidy, A.; Rakha, S. A., Assessment of interleukin-6 and
other inflammatory markers in the diagnosis of Egyptian patients with periprosthetic joint
infection. Egypt J Immunol 2013, 20, 93-99.
29.Chou, S.-C.; Ko, H.-W.; Lin, Y.-C., CRP/IL-6/IL-10 Single-Nucleotide Polymorphisms
Correlate with the Susceptibility and Severity of Community-Acquired Pneumonia. Genetic
Testing and Molecular Biomarkers 2016, 20 (12), 732-740.
30.Paik, J. K.; Kim, O. Y.; Koh, S. J.; Jang, Y.; Chae, J. S.; Kim, J. Y.; Kim, H. J.; Hyun, Y. J.;
Cho, J. R.; Lee, J. H., Additive effect of interleukin-6 and C-reactive protein (CRP) single
nucleotide polymorphism on serum CRP concentration and other cardiovascular risk factors.
Clinica Chimica Acta 2007, 380 (1), 68-74.
31.Filik, L.; Dagli, U.; Ulker, A., C-reactive protein and monitoring the activity of Crohn’s
disease. Advances in Therapy 2006, 23 (4), 655-662.
32.Liang, K. Z.; Mu, W. J., Flow-injection immuno-bioassay for interleukin-6 in humans based
on gold nanoparticles modified screen-printed graphite electrodes. Analytica Chimica Acta 2006,
580 (2), 128-135.
33.Wang, S.; Chinnasamy, T.; Lifson, M. A.; Inci, F.; Demirci, U., Flexible Substrate-Based
Devices for Point-of-Care Diagnostics. Trends in Biotechnology.
34.Hu, J.; Wang, S.; Wang, L.; Li, F.; Pingguan-Murphy, B.; Lu, T. J.; Xu, F., Advances in
paper-based point-of-care diagnostics. Biosensors and Bioelectronics 2014, 54, 585-597.

88
35.(a) Wan, Y.; Su, Y.; Zhu, X.; Liu, G.; Fan, C., Development of electrochemical
immunosensors towards point of care diagnostics. Biosensors and Bioelectronics 2013, 47, 1-11;
(b) Panpradist, N.; Lai, J. J., 4.1 - Point-of-Care Diagnostics A2 - Ebara, Mitsuhiro. In
Biomaterials Nanoarchitectonics, William Andrew Publishing: 2016; pp 139-156.
36.Zhou, J.; Gan, N.; Hu, F.; Li, T.; Zhou, H.; Li, X.; Zheng, L., A single antibody sandwich
electrochemiluminescence immunosensor based on protein magnetic molecularly imprinted
polymers mimicking capture probes. Sensors and Actuators B: Chemical 2013, 186, 300-307.
37.Carminati, M.; Vergani, M.; Ferrari, G.; Caranzi, L.; Caironi, M.; Sampietro, M., Accuracy
and resolution limits in quartz and silicon substrates with microelectrodes for electrochemical
biosensors. Sensors and Actuators B: Chemical 2012, 174, 168-175.
38.(a) Shafiee, H.; Asghar, W.; Inci, F.; Yuksekkaya, M.; Jahangir, M.; Zhang, M. H.; Durmus,
N. G.; Gurkan, U. A.; Kuritzkes, D. R.; Demirci, U., Paper and Flexible Substrates as Materials
for Biosensing Platforms to Detect Multiple Biotargets. Scientific Reports 2015, 5, 8719; (b)
Martinez, A. W.; Phillips, S. T.; Whitesides, G. M.; Carrilho, E., Diagnostics for the Developing
World: Microfluidic Paper-Based Analytical Devices. Analytical Chemistry 2010, 82 (1), 3-10.
39. (a) Cui, G.; Kim, S. J.; Choi, S. H.; Nam, H.; Cha, G. S.; Paeng, K.-J., A Disposable
Amperometric Sensor Screen Printed on a Nitrocellulose Strip: A Glucose Biosensor Employing
Lead Oxide as an Interference-Removing Agent. Analytical Chemistry 2000, 72 (8), 1925-1929;
(b) Nguyen, B. T. T.; Peh, A. E. K.; Chee, C. Y. L.; Fink, K.; Chow, V. T. K.; Ng, M. M. L.;
Toh, C.-S., Electrochemical impedance spectroscopy characterization of nanoporous alumina
dengue virus biosensor. Bioelectrochemistry 2012, 88, 15-21.
40.Adiga, S. P.; Jin, C.; Curtiss, L. A.; Monteiro‐Riviere, N. A.; Narayan, R. J., Nanoporous
membranes for medical and biological applications. Wiley Interdisciplinary Reviews:
Nanomedicine and Nanobiotechnology 2009, 1 (5), 568-581.
41.(a) Assolant-vinet, C. H.; Coulet, P. R., New Immobilized Enzyme Membranes for Tailor-
Made Biosensors. Analytical Letters 1986, 19 (7-8), 875-885; (b) Marquette, C. A.; Leca, B. D.;
Blum, L. J., Electrogenerated chemiluminescence of luminol for oxidase-based fibre-optic
biosensors. Luminescence 2001, 16 (2), 159-165; (c) Munje, R. D.; Muthukumar, S.; Panneer
Selvam, A.; Prasad, S., Flexible nanoporous tunable electrical double layer biosensors for sweat
diagnostics. Scientific Reports 2015, 5, 14586.
42.Uehara, H.; Kakiage, M.; Sekiya, M.; Sakuma, D.; Yamonobe, T.; Takano, N.; Barraud, A.;
Meurville, E.; Ryser, P., Size-Selective Diffusion in Nanoporous but Flexible Membranes for
Glucose Sensors. ACS Nano 2009, 3 (4), 924-932.
43. VATTIPALLI, K.; FEIKERT, P.; BRANDIGAMPALA, S.; PRASAD, S., Study of
nanoporous membranes with applications in the enhanced detection of cadiovascular biomarker
proteins. Nano Life 2010, 1 (03n04), 175-183.

89
44.Bogomolova, A.; Komarova, E.; Reber, K.; Gerasimov, T.; Yavuz, O.; Bhatt, S.; Aldissi, M.,
Challenges of Electrochemical Impedance Spectroscopy in Protein Biosensing. Analytical
Chemistry 2009, 81 (10), 3944-3949.
45.Kalantar-zadeh, K.; Ou, J. Z., Biosensors Based on Two-Dimensional MoS2. ACS Sensors
2016, 1 (1), 5-16.
46.Mele, L.; Santagata, F.; Iervolino, E.; Mihailovic, M.; Rossi, T.; Tran, A. T.; Schellevis, H.;
Creemer, J. F.; Sarro, P. M., A molybdenum MEMS microhotplate for high-temperature
operation. Sensors and Actuators A: Physical 2012, 188, 173-180.
47.(a) Zou, Z.; Han, J.; Jang, A.; Bishop, P. L.; Ahn, C. H., A disposable on-chip phosphate
sensor with planar cobalt microelectrodes on polymer substrate. Biosensors and Bioelectronics
2007, 22 (9–10), 1902-1907; (b) Lang, X.-Y.; Fu, H.-Y.; Hou, C.; Han, G.-F.; Yang, P.; Liu, Y.-
B.; Jiang, Q., Nanoporous gold supported cobalt oxide microelectrodes as high-performance
electrochemical biosensors. Nature communications 2013, 4; (c) Patel, J.; Radhakrishnan, L.;
Zhao, B.; Uppalapati, B.; Daniels, R. C.; Ward, K. R.; Collinson, M. M., Electrochemical
Properties of Nanostructured Porous Gold Electrodes in Biofouling Solutions. Analytical
Chemistry 2013, 85 (23), 11610-11618.
48. Wang, D.-W.; Li, F.; Wu, Z.-S.; Ren, W.; Cheng, H.-M., Electrochemical interfacial
capacitance in multilayer graphene sheets: Dependence on number of stacking layers.
Electrochemistry Communications 2009, 11 (9), 1729-1732.
49.Wikstrom, L.; Nobe, K., The Electrochemical Behavior of Molybdenum. Journal of The
Electrochemical Society 1969, 116 (4), 525-530.
50.Byskov, L. S.; Hammer, B.; Nørskov, J. K.; Clausen, B. S.; Topsøe, H., Sulfur bonding in
MoS2 and Co-Mo-S structures. Catalysis Letters 1997, 47 (3), 177-182.
51.(a) Cummins, B.; Auckland, M. L.; Cummins, P., Cardiac-specific troponin-l
radioimmunoassay in the diagnosis of acute myocardial infarction. American Heart Journal
1987, 113 (6), 1333-1344; (b) Bodor, G. S.; Porter, S.; Landt, Y.; Ladenson, J. H., Development
of monoclonal antibodies for an assay of cardiac troponin-I and preliminary results in suspected
cases of myocardial infarction. Clinical Chemistry 1992, 38 (11), 2203-14.
52.Shen, W.; Tian, D.; Cui, H.; Yang, D.; Bian, Z., Nanoparticle-based
electrochemiluminescence immunosensor with enhanced sensitivity for cardiac troponin I using
N-(aminobutyl)-N-(ethylisoluminol)-functionalized gold nanoparticles as labels. Biosensors and
Bioelectronics 2011, 27 (1), 18-24.
53.Singal, S.; Srivastava, A. K.; Biradar, A. M.; Mulchandani, A.; Rajesh, Pt nanoparticles-
chemical vapor deposited graphene composite based immunosensor for the detection of human
cardiac troponin I. Sensors and Actuators B: Chemical 2014, 205, 363-370.

90
54.Qureshi, A.; Gurbuz, Y.; Niazi, J. H., Biosensors for cardiac biomarkers detection: A review.
Sensors and Actuators B: Chemical 2012, 171–172, 62-76.
55.Dittmer, W. U.; Evers, T. H.; Hardeman, W. M.; Huijnen, W.; Kamps, R.; de Kievit, P.;
Neijzen, J. H. M.; Nieuwenhuis, J. H.; Sijbers, M. J. J.; Dekkers, D. W. C.; Hefti, M. H.;
Martens, M. F. W. C., Rapid, high sensitivity, point-of-care test for cardiac troponin based on
optomagnetic biosensor. Clinica Chimica Acta 2010, 411 (11–12), 868-873.
56.Wu, W.-Y.; Bian, Z.-P.; Wang, W.; Wang, W.; Zhu, J.-J., PDMS gold nanoparticle composite
film-based silver enhanced colorimetric detection of cardiac troponin I. Sensors and Actuators B:
Chemical 2010, 147 (1), 298-303.
57.Kwon, Y.-C.; Kim, M.-G.; Kim, E.-M.; Shin, Y.-B.; Lee, S.-K.; Lee, S. D.; Cho, M.-J.; Ro,
H.-S., Development of a surface plasmon resonance-based immunosensor for the rapid detection
of cardiac troponin I. Biotechnol Lett 2011, 33 (5), 921-927.
58.He, P.; Oncescu, V.; Lee, S.; Choi, I.; Erickson, D., Label-free electrochemical monitoring of
vasopressin in aptamer-based microfluidic biosensors. Analytica Chimica Acta 2013, 759, 74-80.
59.Randviir, E. P.; Banks, C. E., Electrochemical impedance spectroscopy: an overview of
bioanalytical applications. Analytical Methods 2013, 5 (5), 1098-1115.
60.Luo, X.; Davis, J. J., Electrical biosensors and the label free detection of protein disease
biomarkers. Chemical Society Reviews 2013, 42 (13), 5944-5962.
61. Jacobs, M.; Muthukumar, S.; Panneer Selvam, A.; Engel Craven, J.; Prasad, S., Ultra-
sensitive electrical immunoassay biosensors using nanotextured zinc oxide thin films on printed
circuit board platforms. Biosensors and Bioelectronics 2014, 55, 7-13.
62.Lisdat, F.; Schäfer, D., The use of electrochemical impedance spectroscopy for biosensing.
Analytical and Bioanalytical Chemistry 2008, 391 (5), 1555-1567.
63.Saha, B.; Evers, T. H.; Prins, M. W. J., How Antibody Surface Coverage on Nanoparticles
Determines the Activity and Kinetics of Antigen Capturing for Biosensing. Analytical Chemistry
2014, 86 (16), 8158-8166.
64.(a) Yang, M.; Qu, F.; Lu, Y.; He, Y.; Shen, G.; Yu, R., Platinum nanowire nanoelectrode
array for the fabrication of biosensors. Biomaterials 2006, 27 (35), 5944-5950; (b) Liu, J.; Wang,
J.; Wang, T.; Li, D.; Xi, F.; Wang, J.; Wang, E., Three-dimensional electrochemical
immunosensor for sensitive detection of carcinoembryonic antigen based on monolithic and
macroporous graphene foam. Biosensors and Bioelectronics 2015, 65, 281-286.
65.St John, A.; Price, C. P., Existing and emerging technologies for point-of-care testing. The
Clinical Biochemist Reviews 2014, 35 (3), 155.

91
66.Gonzalez-Macia, L.; Killard, A. J., 4 - Screen printing and other scalable point of care (POC)
biosensor processing technologies A2 - Narayan, Roger J. In Medical Biosensors for Point of
Care (POC) Applications, Woodhead Publishing: 2017; pp 69-98.
67.(a) Ahn, C. H.; Choi, J.-W.; Beaucage, G.; Nevin, J. H.; Lee, J.-B.; Puntambekar, A.; Lee, J.
Y., Disposable smart lab on a chip for point-of-care clinical diagnostics. Proceedings of the
IEEE 2004, 92 (1), 154-173; (b) Jung, W.; Han, J.; Choi, J.-W.; Ahn, C. H., Point-of-care testing
(POCT) diagnostic systems using microfluidic lab-on-a-chip technologies. Microelectronic
Engineering 2015, 132, 46-57.
68.Muller, A.; Neculoiu, D.; Konstantinidis, G.; Stavrinidis, A.; Vasilache, D.; Cismaru, A.;
Danila, M.; Dragoman, M.; Deligeorgis, G.; Tsagaraki, K., 6.3-GHz Film Bulk Acoustic
Resonator Structures Based on a Gallium Nitride/Silicon Thin Membrane. IEEE Electron Device
Letters 2009, 30 (8), 799-801.
69.Smith, G. T.; Dwork, N.; Khan, S. A.; Millet, M.; Magar, K.; Javanmard, M.; Bowden, A. K.
E., Robust dipstick urinalysis using a low-cost, micro-volume slipping manifold and mobile
phone platform. Lab on a Chip 2016, 16 (11), 2069-2078.
70.Chen, C.; Wu, Y.; Dong, T. In Dipsticks integrated on smart diapers for colorimetric analysis
of urinary tract infections in the field, Mechatronics-Mechatronika (ME), 2014 16th International
Conference on, IEEE: 2014; pp 423-427.
71.(a) Bertotti, M.; Pletcher, D., The reduction of bromate at molybdenum oxide film cathodes.
Electroanalysis 1996, 8 (12), 1105-1111; (b) Choi, J.-G.; Thompson, L., XPS study of as-
prepared and reduced molybdenum oxides. Applied Surface Science 1996, 93 (2), 143-149; (c)
Liao, L.; Wang, S.; Xiao, J.; Bian, X.; Zhang, Y.; Scanlon, M. D.; Hu, X.; Tang, Y.; Liu, B.;
Girault, H. H., A nanoporous molybdenum carbide nanowire as an electrocatalyst for hydrogen
evolution reaction. Energy & Environmental Science 2014, 7 (1), 387-392.
72.(a) Shon, J. K.; Lee, H. S.; Park, G. O.; Yoon, J.; Park, E.; Park, G. S.; Kong, S. S.; Jin, M.;
Choi, J.-M.; Chang, H., Discovery of abnormal lithium-storage sites in molybdenum dioxide
electrodes. Nature communications 2016, 7; (b) Park, D.-Y.; Sun, Y.-K.; Myung, S.-T.,
Carbothermal synthesis of molybdenum (IV) oxide as a high rate anode for rechargeable lithium
batteries. Journal of Power Sources 2015, 280, 1-4.
73. Ivanov, A. B.; Volkovich, V. A.; Likhachev, P. Y.; Kamalov, R. V., Electrochemical
Properties of Molybdenum in Alkali Chloride Melts. ECS Transactions 2014, 64 (4), 377-387.
74.Badawy, W. A.; Al-Kharafi, F. M., Corrosion and passivation behaviors of molybdenum in
aqueous solutions of different pH. Electrochimica Acta 1998, 44 (4), 693-702.
75.Rodrigues, A. V.; Oliveira, N. T. C.; dos Santos, M. L.; Guastaldi, A. C., Electrochemical
behavior and corrosion resistance of Ti–15Mo alloy in naturally-aerated solutions, containing
chloride and fluoride ions. Journal of Materials Science: Materials in Medicine 2015, 26 (1), 1.

92
76.Ribeiro, A. M.; Flores-Sahagun, T. H. S.; Paredes, R. C., A perspective on molybdenum
biocompatibility and antimicrobial activity for applications in implants. Journal of Materials
Science 2016, 51 (6), 2806-2816.
77.Arora, K.; Chaubey, A.; Singhal, R.; Singh, R. P.; Pandey, M. K.; Samanta, S. B.; Malhotra,
B. D.; Chand, S., Application of electrochemically prepared polypyrrole–polyvinyl sulphonate
films to DNA biosensor. Biosensors and Bioelectronics 2006, 21 (9), 1777-1783.
78.Barsan, M. M.; David, M.; Florescu, M.; Ţugulea, L.; Brett, C. M. A., A new self-assembled
layer-by-layer glucose biosensor based on chitosan biopolymer entrapped enzyme with nitrogen
doped graphene. Bioelectrochemistry 2014, 99, 46-52.
79. (a) Zhou, Y.; Zhi, J., Development of an amperometric biosensor based on covalent
immobilization of tyrosinase on a boron-doped diamond electrode. Electrochemistry
Communications 2006, 8 (12), 1811-1816; (b) Sun, Y.; Wang, H.; Sun, C., Amperometric
glucose biosensor based on layer-by-layer covalent attachment of AMWNTs and IO4−-oxidized
GOx. Biosensors and Bioelectronics 2008, 24 (1), 22-28.
80.(a) Timurdogan, E.; Alaca, B. E.; Kavakli, I. H.; Urey, H., MEMS biosensor for detection of
Hepatitis A and C viruses in serum. Biosensors and Bioelectronics 2011, 28 (1), 189-194; (b)
Malsagova, K. A.; Ivanov, Y. D.; Pleshakova, T. O.; Kaysheva, A. L.; Shumov, I. D.; Kozlov, A.
F.; Archakov, A. I.; Popov, V. P.; Fomin, B. I.; Latyshev, A. V., A SOI-nanowire biosensor for
the multiple detection of D-NFATc1 protein in the serum. Analytical Methods 2015, 7 (19),
8078-8085.
81.Arya, S. K.; Chornokur, G.; Venugopal, M.; Bhansali, S., Dithiobis(succinimidyl propionate)
modified gold microarray electrode based electrochemical immunosensor for ultrasensitive
detection of cortisol. Biosensors and Bioelectronics 2010, 25 (10), 2296-2301.
82. (a) Arya, S. K.; Prusty, A. K.; Singh, S. P.; Solanki, P. R.; Pandey, M. K.; Datta, M.;
Malhotra, B. D., Cholesterol biosensor based on N-(2-aminoethyl)-3-aminopropyl-
trimethoxysilane self-assembled monolayer. Analytical Biochemistry 2007, 363 (2), 210-218; (b)
Hosseini, S.; Ibrahim, F.; Djordjevic, I.; Rothan, H. A.; Yusof, R.; van der Marel, C.; Benzina,
A.; Koole, L. H., Synthesis and characterization of methacrylic microspheres for biomolecular
recognition: Ultrasensitive biosensor for Dengue virus detection. European Polymer Journal
2014, 60, 14-21.
83. Ryckman, J. D.; Liscidini, M.; Sipe, J. E.; Weiss, S. M., Direct Imprinting of Porous
Substrates: A Rapid and Low-Cost Approach for Patterning Porous Nanomaterials. Nano Letters
2011, 11 (5), 1857-1862.
84.(a) Fichtlscherer, S.; Rosenberger, G.; Walter, D. H.; Breuer, S.; Dimmeler, S.; Zeiher, A. M.,
Elevated C-Reactive Protein Levels and Impaired Endothelial Vasoreactivity in Patients With
Coronary Artery Disease. Circulation 2000, 102 (9), 1000-1006; (b) Chuang, Y.-C.; Tyagi, V.;

93
Liu, R.-T.; Chancellor, M. B.; Tyagi, P., Urine and Serum C-Reactive Protein Levels as Potential
Biomarkers of Lower Urinary Tract Symptoms. Urological Science 21 (3), 132-136.
85.Chuang, Y.-C.; Tyagi, V.; Liu, R.-T.; Chancellor, M. B.; Tyagi, P., Urine and serum C-
reactive protein levels as potential biomarkers of lower urinary tract symptoms. Urological
Science 2010, 21 (3), 132-136.
86.(a) Lessel, M.; Bäumchen, O.; Klos, M.; Hähl, H.; Fetzer, R.; Paulus, M.; Seemann, R.;
Jacobs, K., Self‐assembled silane monolayers: an efficient step‐by‐step recipe for high‐quality,
low energy surfaces. Surface and Interface Analysis 2015, 47 (5), 557-564; (b) Borges, J.; Mano,
J. F., Molecular Interactions Driving the Layer-by-Layer Assembly of Multilayers. Chemical
Reviews 2014, 114 (18), 8883-8942.
87.Maugé, F.; Lamotte, J.; Nesterenko, N.; Manoilova, O.; Tsyganenko, A., FT-IR study of
surface properties of unsupported MoS 2. Catalysis today 2001, 70 (1), 271-284.
88.Lacoste, J.; Carlsson, D. J., Gamma‐, photo‐, and thermally‐initiated oxidation of linear low
density polyethylene: A quantitative comparison of oxidation products. Journal of Polymer
Science Part A: Polymer Chemistry 1992, 30 (3), 493-500.
89. Rabolt, J.; Burns, F.; Schlotter, N.; Swalen, J., Anisotropic orientation in molecular
monolayers by infrared spectroscopy. The Journal of Chemical Physics 1983, 78 (2), 946-952.
90.Snoek, L. C.; Robertson, E. G.; Kroemer, R. T.; Simons, J. P., Conformational landscapes in
amino acids: infrared and ultraviolet ion-dip spectroscopy of phenylalanine in the gas phase.
Chemical Physics Letters 2000, 321 (1–2), 49-56.
91. Mansur, H. S.; Sadahira, C. M.; Souza, A. N.; Mansur, A. A. P., FTIR spectroscopy
characterization of poly (vinyl alcohol) hydrogel with different hydrolysis degree and chemically
crosslinked with glutaraldehyde. Materials Science and Engineering: C 2008, 28 (4), 539-548.
92.Schulz, H.; Baranska, M., Identification and quantification of valuable plant substances by IR
and Raman spectroscopy. Vibrational Spectroscopy 2007, 43 (1), 13-25.
93.Das, R. K.; Borthakur, B. B.; Bora, U., Green synthesis of gold nanoparticles using ethanolic
leaf extract of Centella asiatica. Materials Letters 2010, 64 (13), 1445-1447.
94.Son, D.; Chae, S. I.; Kim, M.; Choi, M. K.; Yang, J.; Park, K.; Kale, V. S.; Koo, J. H.; Choi,
C.; Lee, M., Colloidal Synthesis of Uniform‐Sized Molybdenum Disulfide Nanosheets for
Wafer‐Scale Flexible Nonvolatile Memory. Advanced Materials 2016, 28 (42), 9326-9332.
95. Figueroa, C. A.; Ferlauto, A. S.; Alvarez, F., Identification of the mechanism-limiting
nitrogen diffusion in metallic alloys by in situ photoemission electron spectroscopy. Journal of
Applied Physics 2003, 94 (8), 5435-5437.

94
96. (a) Thomsen, M.; Ingebrigtsen, T. S.; Marott, J. L.; Dahl, M.; Lange, P.; Vestbo, J.;
Nordestgaard, B. G., Inflammatory biomarkers and exacerbations in chronic obstructive
pulmonary disease. Jama 2013, 309 (22), 2353-2361; (b) Zeng, F.; Wei, H.; Yeoh, E.; Zhang, Z.;
Ren, Z.-F.; Colditz, G. A.; Tworoger, S. S.; Su, X., Inflammatory markers of CRP, IL-6, TNF-α
and soluble TNFR2 and the risk of ovarian cancer: a meta-analysis of prospective studies.
Cancer Epidemiology Biomarkers & Prevention 2016; (c) Shlipak, M. G.; Fried, L. F.;
Crump, C.; Bleyer, A. J.; Manolio, T. A.; Tracy, R. P.; Furberg, C. D.; Psaty, B. M., Elevations
of Inflammatory and Procoagulant Biomarkers in Elderly Persons With Renal Insufficiency.
Circulation 2003, 107 (1), 87-92.
97.Van Oers, M.; Van der Heyden, A. A.; Aarden, L., Interleukin 6 (IL-6) in serum and urine of
renal transplant recipients. Clinical and experimental immunology 1988, 71 (2), 314.
98. Hedges, S.; Stenqvist, K.; Lidin-Janson, G.; Martinell, J.; Sandberg, T.; Svanborg, C.,
Comparison of Urine and Serum Concentrations of Interleukin-6 in Women with Acute
Pyelonephritis or Asymtomatic Bacteriuria. The Journal of Infectious Diseases 1992, 166 (3),
653-656.
99.Lafleur, J. P.; Jönsson, A.; Senkbeil, S.; Kutter, J. P., Recent advances in lab-on-a-chip for
biosensing applications. Biosensors and Bioelectronics 2016, 76, 213-233.
100.(a) Link, N.; Weber, W.; Fussenegger, M., A novel generic dipstick-based technology for
rapid and precise detection of tetracycline, streptogramin and macrolide antibiotics in food
samples. Journal of Biotechnology 2007, 128 (3), 668-680; (b) Selvakumar, L. S.; Thakur, M. S.,
Dipstick based immunochemiluminescence biosensor for the analysis of vitamin B12 in energy
drinks: A novel approach. Analytica Chimica Acta 2012, 722, 107-113; (c) Vlachou, M. A.;
Glynou, K. M.; Ioannou, P. C.; Christopoulos, T. K.; Vartholomatos, G., Development of a
three-biosensor panel for the visual detection of thrombophilia-associated mutations. Biosensors
and Bioelectronics 2010, 26 (1), 228-234.
101. (a) Fernández-Sánchez, C.; McNeil, C. J.; Rawson, K.; Nilsson, O., Disposable
Noncompetitive Immunosensor for Free and Total Prostate-Specific Antigen Based on
Capacitance Measurement. Analytical Chemistry 2004, 76 (19), 5649-5656; (b) Liang, M.; Fan,
K.; Pan, Y.; Jiang, H.; Wang, F.; Yang, D.; Lu, D.; Feng, J.; Zhao, J.; Yang, L.; Yan, X., Fe3O4
Magnetic Nanoparticle Peroxidase Mimetic-Based Colorimetric Assay for the Rapid Detection
of Organophosphorus Pesticide and Nerve Agent. Analytical Chemistry 2013, 85 (1), 308-312.
102. Nemiroski, A.; Christodouleas, D. C.; Hennek, J. W.; Kumar, A. A.; Maxwell, E. J.;
Fernández-Abedul, M. T.; Whitesides, G. M., Universal mobile electrochemical detector
designed for use in resource-limited applications. Proceedings of the National Academy of
Sciences 2014, 111 (33), 11984-11989.
103. Su, L.; Feng, J.; Zhou, X.; Ren, C.; Li, H.; Chen, X., Colorimetric Detection of Urine
Glucose Based ZnFe2O4 Magnetic Nanoparticles. Analytical Chemistry 2012, 84 (13), 5753-
5758.

95
104.Zangheri, M.; Di Nardo, F.; Mirasoli, M.; Anfossi, L.; Nascetti, A.; Caputo, D.; De Cesare,
G.; Guardigli, M.; Baggiani, C.; Roda, A., Chemiluminescence lateral flow immunoassay
cartridge with integrated amorphous silicon photosensors array for human serum albumin
detection in urine samples. Analytical and Bioanalytical Chemistry 2016, 408 (30), 8869-8879.
105.Soh, J. H.; Lin, Y.; Rana, S.; Ying, J. Y.; Stevens, M. M., Colorimetric Detection of Small
Molecules in Complex Matrixes via Target-Mediated Growth of Aptamer-Functionalized Gold
Nanoparticles. Analytical Chemistry 2015, 87 (15), 7644-7652.
106.González‐Guerrero, A. B.; Maldonado, J.; Dante, S.; Grajales, D.; Lechuga, L. M., Direct
and label‐free detection of the human growth hormone in urine by an ultrasensitive bimodal
waveguide biosensor. Journal of Biophotonics 2017, 10 (1), 61-67.
107.Diouf, A.; Motia, S.; Hassani, N. E. A. E.; Bari, N. E.; Bouchikhi, B. In An electrochemical
biosensor based on moleculary imprinted polymer for the quantification of creatinine in human
urine samples, 2017 ISOCS/IEEE International Symposium on Olfaction and Electronic Nose
(ISOEN), 28-31 May 2017; 2017; pp 1-3.
108.Mach, K. E.; Mohan, R.; Patel, S.; Wong, P. K.; Hsieh, M.; Liao, J. C., Development of a
Biosensor-Based Rapid Urine Test for Detection of Urogenital Schistosomiasis. PLOS Neglected
Tropical Diseases 2015, 9 (7), e0003845.
109. Li, N.; Wang, Y.; Li, Y.; Cao, W.; Ma, H.; Wu, D.; Du, B.; Wei, Q., A label-free
electrochemical immunosensor based on Au@Pd/Ag yolk-bimetallic shell nanoparticles and
amination graphene for detection of nuclear matrix protein 22. Sensors and Actuators B:
Chemical 2014, 202, 67-73.
110.Xuan Viet, N.; Chikae, M.; Ukita, Y.; Maehashi, K.; Matsumoto, K.; Tamiya, E.; Hung Viet,
P.; Takamura, Y., Gold-linked electrochemical immunoassay on single-walled carbon nanotube
for highly sensitive detection of human chorionic gonadotropinhormone. Biosensors and
Bioelectronics 2013, 42, 592-597.
111. Sánchez-Tirado, E.; Martínez-García, G.; González-Cortés, A.; Yáñez-Sedeño, P.;
Pingarrón, J. M., Electrochemical immunosensor for sensitive determination of transforming
growth factor (TGF) - β1 in urine. Biosensors and Bioelectronics 2017, 88, 9-14.
112.Smith, J. T.; Katchman, B. A.; Lee, Y. K.; Brien, B. P. O.; Bawolek, E. J.; Shah, S. S.;
Christen, J. B. In Disposable point-of-use optical biosensor for multiple biomarker detection,
2014 IEEE Biomedical Circuits and Systems Conference (BioCAS) Proceedings, 22-24 Oct.
2014; 2014; pp 268-271.
113. Anilkumar, K. R.; Parveen, A.; Badiger, G. R.; Ambika Prasad, M. V. N., Effect of
molybdenum trioxide (MoO3) on the electrical conductivity of polyaniline. Physica B:
Condensed Matter 2009, 404 (12–13), 1664-1667.

96
114. Kumagai, N.; Kumagai, N.; Tanno, K., Electrochemical characteristics and structural
changes of molybdenum trioxide hydrates as cathode materials for lithium batteries. Journal of
Applied Electrochemistry 1988, 18 (6), 857-862.
115.Liu, C.; Li, Z.; Zhang, Z., Molybdenum oxide film with stable pseudocapacitive property for
aqueous micro-scale electrochemical capacitor. Electrochimica Acta 2014, 134, 84-91.
116.Kim, H.-S.; Cook, J. B.; Lin, H.; Ko, J. S.; Tolbert, S. H.; Ozolins, V.; Dunn, B., Oxygen
vacancies enhance pseudocapacitive charge storage properties of MoO3-x. Nat Mater 2017, 16
(4), 454-460.
117.Sen, U. K.; Mitra, S., Synthesis of Molybdenum Oxides and their Electrochemical Properties
against Li. Energy Procedia 2014, 54, 740-747.
118.Weng, Y.; Hou, R.; Li, G.; Wang, J.; Huang, N.; Liu, H., Immobilization of bovine serum
albumin on TiO2 film via chemisorption of H3PO4 interface and effects on platelets adhesion.
Applied Surface Science 2007.

97
BIOGRAPHICAL SKETCH
Vikramshankar Kamakoti received his Bachelor of Technology (B.Tech) in Electronics and
Instrumentation Engineering from SASTRA University, India in 2010. He worked with TATA
consultancy services Ltd (TCS) for two years as Assistant Systems Engineer. He received his MS
in Electrical Engineering from The University of Texas at Dallas in 2014. He joined the
Biomedical Microdevices and Nanotechnology Lab for his PhD degree in Biomedical Engineering
under the supervision of Dr. Shalini Prasad. He has gained experience in cleanroom fabrication,
several electrical & material characterization techniques and immunoassay characterization
experimentation.

98
CURRICULUM VITAE
VIKRAMSHANKAR KAMAKOTI
EDUCATION:
PhD. Biomedical Engineering, University of Texas at Dallas August 2017
M.S Electrical Engineering, University of Texas at Dallas May 2014
B.Tech Electronics & Instrumentation Engg, SASTRA University, India May 2010
PUBLICATIONS:
• Kamakoti Vikramshankar, Anjan Panneer Selvam, Nandhinee Radha Shanmugam,
Sriram Muthukumar, and Shalini Prasad. "Flexible Molybdenum Electrodes towards
Designing Affinity Based Protein Biosensors." Biosensors 6, no. 3 (2016): 36.
• Valekunja, Rohini Bhat, Vikramshankar Kamakoti, Anitha Peter, Shamprasad Phadnis,
Shalini Prasad, and Vinay J. Nagaraj. "The detection of papaya ringspot virus coat protein
using an electrochemical immunosensor." Analytical Methods 8, no. 48 (2016): 8534-
8541.
• Selvam, Anjan Panneer, Sriram Muthukumar, Vikramshankar Kamakoti, and Shalini
Prasad. "A wearable biochemical sensor for monitoring alcohol consumption lifestyle
through Ethyl glucuronide (EtG) detection in human sweat." Scientific reports 6 (2016).
TEACHING ASSISTANTSHIP EXPERIENCE:
BMEN 4320- Intermediate Electrical Systems (Fall 2016)
BMEN 3130- Engineering Physiology Laboratory (Spring 2017)
PROFESSIONAL EXPERIENCE:
Assistant Systems Engineer, TATA Consultancy Services Ltd. July 2010 –June 2012
•Identification and mitigation of Information Technology security risks