evaluation of performance of malaysian banks in risk
TRANSCRIPT

AAMJAF Vol. 12, No. 1, 25–47, 2016
© Asian Academy of Management and Penerbit Universiti Sains Malaysia, 2016
ASIAN ACADEMY of
MANAGEMENT
JOURNAL
of ACCOUNTING
and FINANCE
EVALUATION OF PERFORMANCE OF MALAYSIAN
BANKS IN RISK ADJUSTED RETURN ON CAPITAL
(RAROC) AND ECONOMIC VALUE ADDED (EVA)
FRAMEWORK
Asish Saha1*, Nor Hayati Ahmad2 and Siew Goh Yeok3
1,2,3School of Economics, Finance and Banking,
Universiti Utara Malaysia, 06010 Sintok,
Kedah, Malaysia 1National Institute of Bank Management, NIBM P.O., Pune – 411048, India
*Corresponding author: [email protected]
ABSTRACT
As Malaysian banks step into Basel-III era, a close look at their performance on risk
adjusted basis using RAROC and EVA would throw significant light on their relative
strengths and weaknesses. Post restructuring during 1999–2000, the regulatory
framework of Bank Negara Malaysia (BNM) throughout 2001–2010 was mainly centered
on capitalisation, risk management and governance practices in banks. Financial Sector
Blue Print is viewed as the reference framework for growth of banks in the current
decade. Though numerous studies have evaluated the performances of Malaysian banks
in terms of efficiency and productivity gains before and after the merger and also at
various phases during the last decade, no study has so far been reported to evaluate their
performances using the above framework. This paper intends to fill up this gap. The
period covered is 2001 to 2013. Findings of this paper would be of keen interest to the
policy planners, investors and researchers alike.
Keywords: commercial banks, risk management, performance measurement
INTRODUCTION
Malaysian banking system has developed significantly since the implementation
of a conscious strategy of restructuring, mergers, consolidation and
rationalisation exercise in the year 2000 to tide over the deleterious effects of the
Asian Financial crisis. The post restructuring growth of banks was guided by the
Financial Sector Master Plan (FSB) 2001–2010 of Bank Negara Malaysia
(BNM). As stated by Zeti (2013), “There has been a tremendous payoff from the
development of our financial system, its restructuring, rationalisation,
deregulation and subsequent liberalisation”. Since 2001, the financial sector has

Asish Saha et al.
26
expanded at an average annual rate of 7.3%, to account for 11.7% of real GDP in
2010 compared to 9.7% in 2001. Domestic banks have accumulated strong
capital and loan loss buffers, with improvements in underwriting and risk
management practices. Risk Weighted Capital Ratio (RWCR), Return on Asset
(ROA) and Return on Equity (ROE) of the domestic commercial banks went up
from 4.2% to 11.7%, 1.1% to 1.5% and 13.7% to 15.7% respectively between the
years 2000 to 2013.
As the Malaysian marketplace continues to evolve at a rapid pace under
the policy of liberalisation as specified in FSB2011–2020, it has become
imperative for domestic banks to remain efficient not only to withstand the
competitive pressure, especially from the foreign players, but also to thrive in a
rapidly changing environment. It may be recalled that basic touch-stone of
success of banks is their inner strengths to absorb shocks arising out of various
risks in their business profile. This has become increasingly important bench-
mark in the aftermath of the global financial crisis which brought perils to
banking system worldwide. As BNM steps up its initittaive to usher-in the
requirements of Basel-III, performance of each financial institutions will be under
the scanner of the investors as well as those who would like to assess the intrinsic
strength of each institution to generate return in accordance with the risk-class to
which it belongs. Given this background, there is a need to develop an innovative
framework which profiles the performance of banks on a risk adjusted basis.
Though there are many reported studies which evaluated the performance of
banks using traditional ratio analysis and the Data Envelopment Analysis, there is
no published paper literature on the risk adjusted performance measurement of
Malaysian banks. This paper aims to fill-in this important gap and provide a
framework which can be used by regulator, prospective investors and finally
future researchers who might be interested in delving deep into the performance
of Malaysian banks in the framework attuned to global best practices.
The assessment was carried out in three stages. In the first stage, the
focus was to highlight the key findings of BNM and International Monetary Fund
(IMF) assessment about the health of the commercial banks in the country. In the
second stage, domestic banking groups were evaluated in the Risk Adjusted
Return on Capital (RAROC), Economic Value Added (EVA) framework. In the
third stage, relative efficiency of banks was evaluated using Data Envelopment
Analysis (DEA) with ‘beta’ as input parameter and RAROC and EVA as output
parameters.

Performance of Malaysian Banks in RAROC & EVA Framework
27
THE EVOLVING FRAMEWORK OF BANK PERFORMANCE
Despite increasing complexity in banking business, earnings, efficiency, risk-
taking ability and leverage are the four key drivers of performance of banking
institutions. Return on Assets, Return on Equity, Cost to Income Ratio and Net
Interest Margin are the most popular traditional measures of banks performance.
Market based performance measures include Total Share Return (the ratio of
dividends and increase of the stock value over market stock price), the Price-
Earnings (P/E) ratio and Price to Book Value (P/BV) ratio and the Credit Default
Swap (CDS) are among others.
Drawbacks in Using Traditional Ratio Measures
Although variety of indicators, as mentioned above, are used to measure the
performance of banks, ROE remains the most used one (Baer, Mehta, &
Samandari, 2011). Based on the analysis of a sample of 12 large European and
US banks, the Report on EU Banking Structure (European Central Bank, 2010)
has however contended that ROE has provided misleading information in
discriminating good banks from the bad ones over different phases of the
financial crisis. The report has also indicated that the P/E ratio calculated with
expected earnings did not predict risks that were accumulating in the financial
system in advance. Moreover, it did not clearly differentiate the business models
of investment and universal banks and hence the market valuations were akin to
“herd-estimations”. The said report also argued that in the time of ‘stress’, when
earnings tend to reach zero, P/E ratio becomes meaningless. It has also been
stated in the report that though ROA, adjusted for leverage, is considered to be
more reliable indicator of profitability of banks than ROE, it failed to provide any
meaningful indication of the pending reversal of profitability before the crisis.
RAROC and EVA Framework
The economic measures of performance aim to assess the contribution of a bank
towards shareholders’ wealth creation by utilising its assets on risk adjusted
basis. Risk management in banks has always been an activity of first order
importance to ensure efficiency in the operation of banks (Merton, 1995). As
risks can trigger losses that can finally corrode the capital base of banks and
ultimately their viability, banks are concerned about the potential unexpected
losses that are associated with their business activities. Regulators, in turn, are
concerned about the potential impact of bank failures on the economy and hence
the systemic stability. They focus on the strength of the economic capital positon
of banks. Economic capital is defined as the amount of risk capital held by a bank
at a predetermined confidence level and the time horizon (Ong, 2012). Economic

Asish Saha et al.
28
capital (Zanjani, 2010) held by banks acts not only as buffer to maintain its credit
worthiness but also to meet the regulatory requirements.
Risk Adjusted Return on Capital (RAROC) and Economic Value Added
(EVA) are two important planks of the economic measures of performance.
Efficiency based indicators like capital adequacy, asset quality, revenue
sustainability and market based indicators etc. are used in the evaluation of bank
performance. However, economic based indicators like RAROC and EVA are not
used often presumably due to their complexity and difficulty in their correct
assessment.
RAROC is the assessment of profit as a percentage of economic capital
(Kimball, 1998). The numerator of the RAROC equation, as mentioned below, is
the net income adjusted for expected loss and it is divided by economic capital
which is the bank’s best estimate of the capital required to absorb unexpected
losses up to a chosen level of confidence:
RAROC = (Net Income – Expected Loss) / Economic Capital
RAROC, so assessed, needs to be compared with a ‘hurdle rate’, which is
the opportunity cost of taking the risk in the business. The hurdle rate, in turn,
needs to be benchmarked to a market rate that reflects the shareholders’
expectation of the return from a bank’s stock on a risk adjusted basis. It will vary
from bank to bank depending upon their respective ‘beta’, which is the individual
stock’s volatility vis-a-vis the volatility in the market index (Bandopadhayay &
Saha, 2007). Beta can be derived from the one-factor Capital Asset Pricing
Model (CAPM) as the excess return on the market per unit of risk. Based on the
interactions with the executives of 11 banks around the globe, Baer et al. (2011)
reported that banks use RAROC in a backward looking fashion and instead of
using it at the transaction level, banks use it at the aggregate level. They have
proposed that adoption of hurdle rates, which captures the contribution of each
business to the cost of capital including capital requirement of the banking
institution, would be a major improvement in the capital allocation process of
banks, performance tracking of their individual business lines and to assess the
robustness of risk management. In the present study, Tier-I capital of Malaysian
banks has been used as an alternative measure of economic capital of individual
banks.
EVA, as a parameter of performance measurement, is defined as excess
of the risk adjusted earnings over the opportunity cost of the capital employed
(Dunbar, 2013, Everts & Haarhuis, 2005, Sharma & Kumar, 2010):
EVA = RAROC – Hurdle Rate

Performance of Malaysian Banks in RAROC & EVA Framework
29
It is argued that maximisation of ‘earnings’ or ‘earnings growth’ rather
than ‘economic profit’ would result in a situation where a bank might be
profitable in ‘accounting’ sense but unprofitable in the ‘economic’ sense. Banks
which aim to maximise ‘economic profit’ would allocate units of equity capital to
activities until the marginal contribution capital is equal to its opportunity cost
and hence the average return on equity will be equal to or more than its
opportunity cost. It needs to be mentioned in this context that, the concept of
economic profit has become increasingly popular in the strategic decision
making, pricing, performance evaluation and incentive compensation framework
of banks.
DEA Framework
Various approaches and techniques have been used by researchers to evaluate the
efficiency of banks. In their review of 130 studies on bank efficiency, Berger and
Humphrey (1997) found that 57 of them have used DEA. Fethi and Pasiouras
(2010) in their review of 196 studies reported that 151 of them have used
techniques similar to DEA. Paradi and Zhu (2013) reported that there are 275
applications of DEA in studies relating to bank efficiency. There are many
reported studies (Saha, Ahmad, & Dash, 2014) on the efficiency of Malaysian
banks. Present study has also adopted DEA, a non-parametric technique, for the
estimation of production frontiers for given inputs and outputs of a set of decision
making units (DMUs). Introduced by Farrell (1957) and developed by Charnes,
Cooper and Rhodes (1978), DEA assumes that if a unit can produce a certain
level of output utilising specific input levels, another unit of equal scale should be
capable of doing the same. The most efficient producers can form a 'composite
producer', allowing the computation of an efficient solution for every level of
input or output as a 'virtual producer' and to make comparisons.
Stage 1
The formulation of the DEA model, with a set of n DMUs, each of which
converts m inputs into s outputs, involves finding the weights u and v that are
used while calculating the relative efficiencies of the DMUs. A DMU’s
efficiency is defined as the sum of weighted outputs divided by the sum of
weighted inputs. Each optimisation trial selects the set of weights that results in
the highest possible efficiency for the focal DMU associated with that
optimisation. The above intuition is represented in the fractional form of the DEA
model as shown in the following formulation:
Maximise 1
S
r rj
r
u y

Asish Saha et al.
30
Subject to 1
1
m
i ij
i
v x
1
0
S m
r rj i ij
r i j
u y v x for j =1, …, n, and
, 0r iu v for r =1, …, s and I = 1, …, m
In the above formulation, yrj , xij are all positive known outputs and inputs of the
jth DMU and ur ,vi ≥ 0 are the variable weights to be determined by the solution of
the problem. As the above formulation is not linear and thus cannot be solved by
linear optimisation methods, Charnes et al. (1978) transformed the same to a
linear problem by multiplication of the denominator in the side condition as
below:
1
S m
r rj i ij
r i j
u y v x for j = 1, …, n
The objective function has been linearised by normalising the denominator, i.e.
requiring the weighted sum of inputs to take a constant value say 1, as below:
1
m
i ij
i j
v x
After the linearisation of the basic and side functions, the complete formulation is
as below:
Maximise 1
S
r rj
r
u y
Subject to 1
m
i ij
i j
v x
1
0
S m
r rj i ij
r i j
u y v x for j = 1, …, n, and
ur ,vi ≥ 0, for r = 1, …, s and I = 1, …, m

Performance of Malaysian Banks in RAROC & EVA Framework
31
Application of DEA to a set of DMUs results in efficiency scores of 1 or
less than 1 for each DMU. DMUs with efficiency score of 1 are relatively
efficient as falling on the efficient or “best practice” frontier, while those with
scores of less than 1 are inefficient and fall within the frontier curve. On applying
DEA, a set of weights are also obtained for the inputs and outputs of every DMU.
The weights obtained are optimally determined from the viewpoint of the base
branch. A complete DEA analysis involves the execution of the program for all
the DMUs leading to many different weight sets. Improvements to the inefficient
DMUs can then be made by projecting the same onto the frontier. Depending
upon the application of DEA as either input or output oriented, different
improvement strategies, such as rationalisation of input resources or enhancement
of business output respectively, can be determined.
Interpretation of results using DEA must be done with care. Firstly, DEA
results are sensitive to the selection of inputs and outputs. The technique cannot
test for the best specification and it is found that the number of efficient firms on
the frontier tends to increase with the number of inputs and output variables. In
the present study, ‘beta’ is used as input parameter and ‘RAROC’ and ‘EVA’ as
output parameter in variable return to scale (VRS) formulation of DEA
framework. It needs to be mentioned that in view of the “positivity” (Charnes,
Cooper, & Thrall, 1991) requirement of the basic DEA formuations, the negative
values of output parameters may be substituted with small positive number and
such translation will not adversely affect the efficiency score (Bowlin, 1998).
Stage 2
Researchers using non-parametric methods like DEA face criticisms that it is
difficult to draw statistical inference. Dyson and Shale (2010) suggested that
bootstrap procedures produce confidence limits on the efficiencies of DMUs to
capture the true efficient frontier within the specified interval to enable
interpretation of results. DEA scores obtained in Stage 1 of the analysis were
therefore corrected by using the formulation of Bogetoft and Otto (2011).
Bias in DEA estimates and bias corection (Bogetoft & Otto, 2011)
In absence of measurement errors in the estimated efficiency score ˆ kE in DEA, all
of the observations in the sample are from the technology set ˆ .T T However,
the DEA estimate is biased upward and hence the estimated efficiency ˆ kE may be
higher than the actual efficiency .kE As the size of T depends on the sample, ˆ kE
is sensitive to sampling variations. In the presence of measurement errors, there is
no direct subset relationship between T and T. In order to remove the bias, the
bias is estimated as:

Asish Saha et al.
32
k* ˆbias EV( ) k k
As the distribution of k is unknown, one cannot compute ˆEV( ). k kb is used
as a bootstrap replica estimate of . k In such case, the estimated bias through
bootstrap is
k* *
1
1 ˆ ˆ ˆbias =
B kb k k k
bB and,
k* * *ˆ ˆ ˆ ˆ ˆ = bias + 2 k k k k k k
where,
k = The true efficiency based on the true but unknown technology T
k = DEA-estimated efficiency and T the estimated DEA technology
kb= The bootstrap replica b estimate based on the replica technology T
b
* k
= The bootstrap estimate of k
k = The bias-corrected estimate of k
The variance of the bootstrap estimate as specified below is used for the
computation of the confidence interval:
2 * 2
1
1ˆ ( )
B kb k
bB
FRAMEWORK OF ANALYSIS AND FINDINGS
In the first phase of analysis, the RAROC and EVA framework as elaborated in
“The Evolving Framework of Bank Performance” has been adopted for the
purpose of analysing the performances of eight domestic banks in Malaysia for
the period 2001 to 2013. It may be recalled here that in the aftermath of the Asian
Financial crisis, BNM initiated a major merger exercise in the banking and
financial system in the country. It also released the Financial Sector Master Plan
(2001–2010) which delineated the regulatory expectation of the central bank of
the country about the growth profile of banks during the decade. The Financial
Sector Blue Print (2011–2020) of BNM has similarly become the reference
document for the country’s banking and financial system for the current decade.
It may also be mentioned in this context that BNM has also ensured the
development of risk management system in banks in the country since 2001 and
aligning the same to the requirements of Basel Accords through its regulatory
nudge on a periodic basis. Present studyaimed at taking a comprehensive view of
the performance profile of domestic banks on risk adjusted basis since the major

Performance of Malaysian Banks in RAROC & EVA Framework
33
merger exercise in 2000. The choice of period of the study from 2001 to 2013
was conditioned by the study objective. The analysis culminates into the
evaluation of relative efficiency of Malaysian banks using DEA framework as
explained above.
Relevant data was collected from the DataStream database and the
annual reports of the respective banking groups. The daily share-price data of
these banking groups and KLCI Index for the period January 2001 to December
2013 were also extracted from the DataStream for the computation of β of the
shares of the individual banking groups. In the computation of β, the Yield on
MGS 1-Year Security over the years have been taken as the relevant risk free rate
and a benchmark return of 15% has been assumed as the benchmark market
return. The Yield on MGS securities were collected from Fully Automated
System for Issuing /Tendering (FAST) of BNM. The Tier-I capital of individual
banks was taken as a proxy measure of the economic capital maintained by
individual banks to meet estimate of unexpected losses every year. In arriving at
the RAROC figures of individual banks, the Expected Loss (EL) percentage is
computed using the following relationship:
EL = Probability of Default (PD) × Loss Given Default (LGD)
The default rate is computed as the ratio of non-performing loan to the average
loan. Three-year average default rate has been used for the computation of PD.
LGD is computed as the average loan write-off as percentage of non- performing
loans during the period of reference.
Reflections on the Financial Health of Malaysian Banks
The key performance indicators of the domestic banking system in the country as
has been carried out by BNM over the years are presented in Table 1.
Financial Stability and Payment Systems Report 2013 (Bank Negara
Malaysia, 2013) indicates that as Basel-II regulatory requirements are being
phased in, the banks have strengthened their capital base with an accretion to
reserve by 21% and new issuance of equity by 9.1%. The loss absorption buffer
of the banking system over the minimum regulatory requirement stood at
RM79.3 billion. Risk weighted assets of banks was 63.3% compared to 62.1% in
the previous year. The key driver of the earnings performance of banks was
reported to be funding activities which grew by 7.1% during 2013 and constituted
42.8% of the gross operating income of banks. Banks have reported been able to
grow the fee based income in the recent years to compensate the decline in
margin from highly competitive retail lending market. The interest margin net of
loan loss provision declined from 0.66% in 2012 to 0.61% in 2013.

Asish Saha et al.
34
Table 1
Some of the key financial indicators of Malaysian banks (Figures in %)
Particulars 2003 2004 2005 2006 2007 2008 2009 2010 2011 2012 2013
Risk weighted
capital ratio
13.8 14.4 13.7 13.5 13.2 12.6 15.4 14.8 15.7 15.7 14.3*
Core capital
ratio
11.1 11.4 10.7 10.7 10.2 10.6 13.8 13.0 13.7 13.9 12.8**
Return on
assets
1.3 1.4 1.4 1.3 1.5 1.5 1.2 1.5 1.6 1.6 1.5
Return on
equity
15.6 16.7 16.7 16.2 19.8 18.6 13.9 16.6 17.4 17.4 15.7
Liquid assets
to total assets
8.2 8.0 8.0 8.7 9.3 10.3 14.2 15.6 16.0 13.8 n.a.
Liquid assets
to short-term
liabilities
10.7 10.6 10.2 11.1 11.8 13.1 42.9 48.1 45.4 42.5 n.a.
Net non-
performing
loans ratio-3
months
8.9 7.5 5.8 4.8 3.2 2.2 1.8 2.3 1.8 1.4 2.6
*Basel-III complaint Tier-1 Capital Ratio; **Basel-III compliant total capital ratio
Source: Financial Stability and Payment Systems Reports (Bank Negara Malaysia, 2007, 2010, 2014) and Quarterly Bulletin
(Bank Negara Malaysia, 2013)
The gross non-performing loan ratio of the banks is found to be slightly
higher compared to peers’ average but collateral cover is reported at comfortable
level. It has however, raised concern about the possible impact of weakened
ability of household to service loans. The Probability of Default (PD) and Loss
Given Default (LGD) for residential mortgage lending were estimated to be at
3.1% and 19% respectively. Deposits from business houses constituted 37% of
total banking deposits compared to 35% by household deposits with one large
corporate accounting for 24% of total business deposits.
Performances of Malaysian Banks on Risk Adjusted Basis
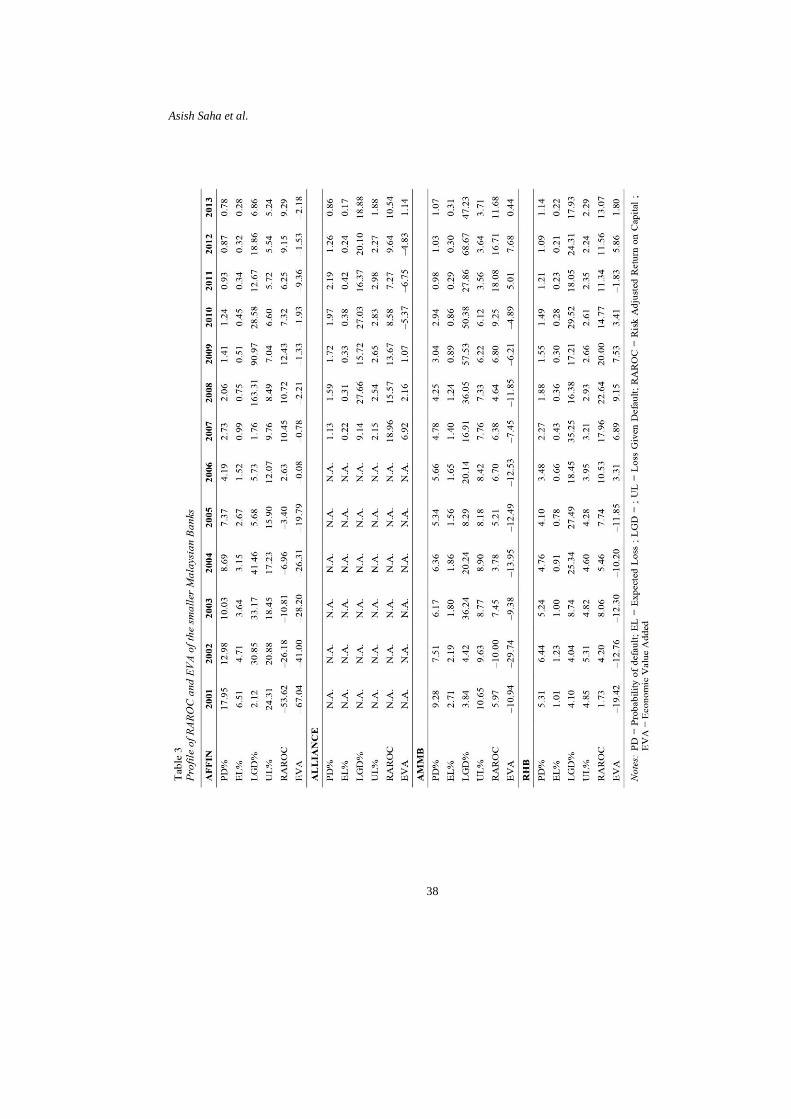
Table 2, Table 3 with corresponding Figure 1 and Figure 2 presents the Expected
Loss (EL), Probability of Default (PD), Loss Given Default (LGD), RAROC and
EVA for the Malaysian banks during the period of reference respectively.

Performance of Malaysian Banks in RAROC & EVA Framework
35

Asish Saha et al.
36
(a) Profile of PD of bigger Malaysian banks
(b) Profile of LGD of bigger Malaysian banks
(c) Profile of RAROC of bigger Malaysian banks
0.00%
1.00%
2.00%
3.00%
4.00%
5.00%
6.00%
2000 2010 2020
MayBank
CIMB
PUB
0.00%
10.00%
20.00%
30.00%
40.00%
50.00%
2000 2010 2020
MayBank
CIMB
PUB
HLB
0.00%
5.00%
10.00%
15.00%
20.00%
25.00%
30.00%
35.00%
1 4 7 10 13
May Bank
CIMB
PUB
HLB

Performance of Malaysian Banks in RAROC & EVA Framework
37
(d) Profile of EVA of bigger Malaysian banks
Figure 1. Profile of bigger Malaysian banks
It is evident from the above profiles that the PD of Malaysian banks fell
significantly over the years in tandem with the benign economic situation in the
country. The profile of LGDs of the banking groups is however, not
commensurate with the profile of PDs of banks; larger swings were observed
during the period 2008 to 2012 than during the earlier periods. The swings were
more pronounced in the case of PBB, HLB, Affin and AMMB; LGD of
MayBank went-up over the years and varied between 6.61% to 40.53%, between
22.14% to 44.76% for PUB, between 3.84% to 68.67% in AMMB. Affin’s made
a large write-off in 2008 and hence LGD was as high as 163.31% of net non-
performing loans in the said year. It needs to be highlighted, apart from the
quality of the loan portfolio, loan write-off percentage by banks clearly portray
the policy of the top management of banks regarding the timing of the write-off
according to the individual profit position in any particular year.
There are distinct differences in the profile of RAROC and EVA across
the Malaysian banking groups and it also varied across the clusters viz. bigger
and smaller banking groups. In general, RAROC of banks fell, though not
significantly, during 2008 to 2013. CIMB dominated others in terms of its profile
of RAROC followed closely by PUB. In terms of EVA, PUB however, occupied
the dominant position in terms of EVA during 2008 to 2013 period. RAROC of
three smaller banks viz., Affin, Alliance and RHB fell rather sharply between
2008–2012 periods. In the case of AMMB, it moved up from 4.64% in 2008 to
18.08% by 2011 but dropped-off later to 11.68% in 2013. The EVA of the
smaller Malaysian banking groups was rather patchy during most of the period of
reference.
-15.00%
-10.00%
-5.00%
0.00%
5.00%
10.00%
15.00%
20.00%
1 3 5 7 9 1113
May Bank
CIMB
PUB
HLB
Asish Saha et al.
38

Performance of Malaysian Banks in RAROC & EVA Framework
39
(a) Profile of PD of smaller Malaysian Banks (b) Profile of Write-off by smaller Malaysian
banks
(c) Profile of RAROC of smaller Malaysian
banks
(d) Profile of EVA of smaller Malaysian banks
Figure 2. Profile of smaller Malaysian banks
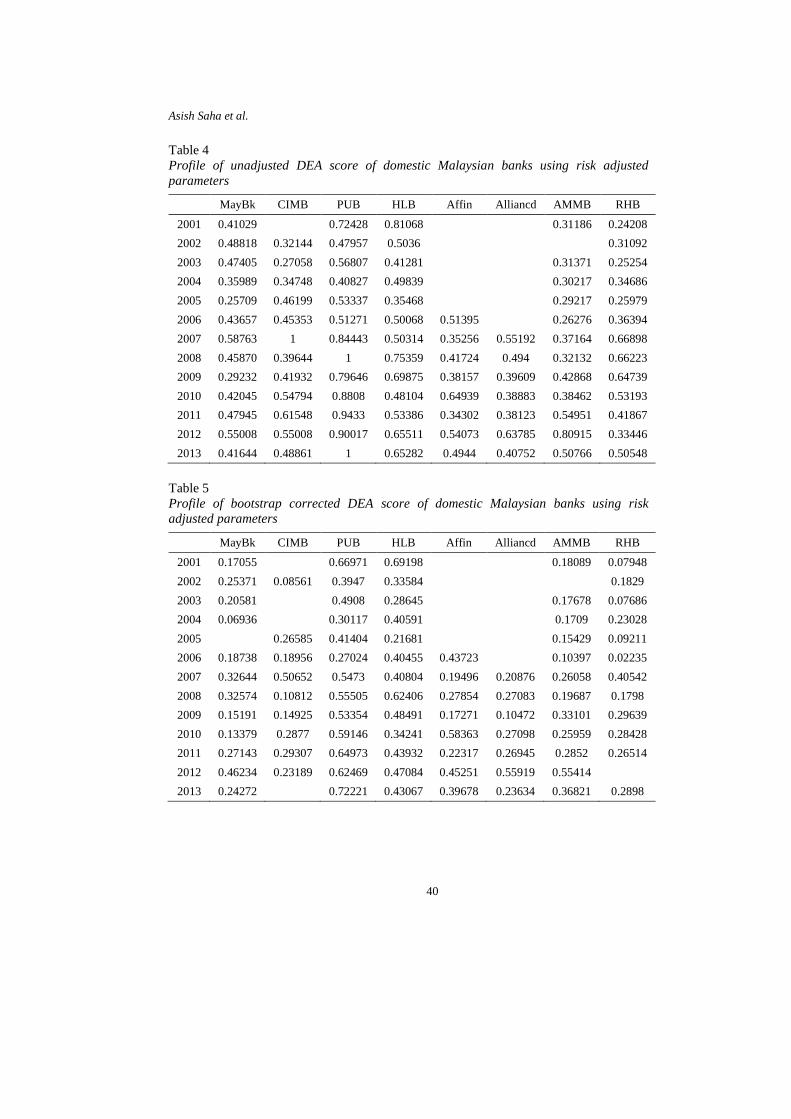
The DEA results based on ‘beta’ as input parameter and ‘RAROC’ and
‘EVA’ as output parameters without bias correction and after bootstrap correction
are presented in Table 4 and Table 5 respectively; 2000 iterations were taken for
the boot strap correction. The detailed results have been added as Appendix A.
0.00%
5.00%
10.00%
15.00%
20.00%
2000 2020
Affin
Alliance
AMMB
RHB
-50.00%
0.00%
50.00%
100.00%
150.00%
200.00%
2000 2020
Affin
Alliance
AMMB
RHB
-60.00%
-40.00%
-20.00%
0.00%
20.00%
40.00%
1 4 7 10 13
Affin
Alliance
AMMB
RHB
-80.00%
-60.00%
-40.00%
-20.00%
0.00%
20.00%
1 4 7 10 13Affin
Alliance
AMMB
RHB
Asish Saha et al.
40
Table 4
Profile of unadjusted DEA score of domestic Malaysian banks using risk adjusted
parameters
MayBk CIMB PUB HLB Affin Alliancd AMMB RHB
2001 0.41029 0.72428 0.81068 0.31186 0.24208
2002 0.48818 0.32144 0.47957 0.5036 0.31092
2003 0.47405 0.27058 0.56807 0.41281 0.31371 0.25254
2004 0.35989 0.34748 0.40827 0.49839 0.30217 0.34686
2005 0.25709 0.46199 0.53337 0.35468 0.29217 0.25979
2006 0.43657 0.45353 0.51271 0.50068 0.51395 0.26276 0.36394
2007 0.58763 1 0.84443 0.50314 0.35256 0.55192 0.37164 0.66898
2008 0.45870 0.39644 1 0.75359 0.41724 0.494 0.32132 0.66223
2009 0.29232 0.41932 0.79646 0.69875 0.38157 0.39609 0.42868 0.64739
2010 0.42045 0.54794 0.8808 0.48104 0.64939 0.38883 0.38462 0.53193
2011 0.47945 0.61548 0.9433 0.53386 0.34302 0.38123 0.54951 0.41867
2012 0.55008 0.55008 0.90017 0.65511 0.54073 0.63785 0.80915 0.33446
2013 0.41644 0.48861 1 0.65282 0.4944 0.40752 0.50766 0.50548
Table 5
Profile of bootstrap corrected DEA score of domestic Malaysian banks using risk
adjusted parameters
MayBk CIMB PUB HLB Affin Alliancd AMMB RHB
2001 0.17055 0.66971 0.69198 0.18089 0.07948
2002 0.25371 0.08561 0.3947 0.33584 0.1829
2003 0.20581 0.4908 0.28645 0.17678 0.07686
2004 0.06936 0.30117 0.40591 0.1709 0.23028
2005 0.26585 0.41404 0.21681 0.15429 0.09211
2006 0.18738 0.18956 0.27024 0.40455 0.43723 0.10397 0.02235
2007 0.32644 0.50652 0.5473 0.40804 0.19496 0.20876 0.26058 0.40542
2008 0.32574 0.10812 0.55505 0.62406 0.27854 0.27083 0.19687 0.1798
2009 0.15191 0.14925 0.53354 0.48491 0.17271 0.10472 0.33101 0.29639
2010 0.13379 0.2877 0.59146 0.34241 0.58363 0.27098 0.25959 0.28428
2011 0.27143 0.29307 0.64973 0.43932 0.22317 0.26945 0.2852 0.26514
2012 0.46234 0.23189 0.62469 0.47084 0.45251 0.55919 0.55414
2013 0.24272 0.72221 0.43067 0.39678 0.23634 0.36821 0.2898

Performance of Malaysian Banks in RAROC & EVA Framework
41
Figure 3. Profile of unadjusted DEA scores
Figure 4. Profile of bootstrap corrected DEA scores
The profile of DEA scores on a market based approach and assuming a
hurdle rate of 15% reflect that PUB and HLB led the rest throughout the period
2001 to 2013. CIMB and MayBank had a mixed profile: the efficiency scores of
these banks tapered off in the latter half of the period under study. The swings are
quite sharp for smaller Malaysian banks.
CONCLUSION
The aim of this paper was to bring into focus the increasing importance of risk
adjusted performance measurement of banks in view of the critical limitations of
0
0.2
0.4
0.6
0.8
1
1.2
2000 2002 2004 2006 2008 2010 2012 2014
MayBk
CIMB
PUB
HLB
Affin
Alliancd
AMMB
RHB
0
0.1
0.2
0.3
0.4
0.5
0.6
0.7
0.8
2000 2002 2004 2006 2008 2010 2012 2014
MayBk
CIMB
PUB
HLB
Affin
Alliancd
AMMB
RHB
Asish Saha et al.
42
the traditional ratio based measures of performance like ROE, ROA, P/E, P/B
ratio. An in-depth analysis using the framework of RAROC and EVA show that
although the bigger banks did not portray robust performance in terms of their
EVA, on the whole however, they have become more resilient over the years.
The situation however, is not entirely true in the case of the smaller banks in the
country. Business repositioning to attune them to meet the emerging challenges
in the increasingly competitive marketplace has become a necessity. Situation
will become more demanding for these banks as BNM phases in the requirements
of Basel – III over the next few years. Possibilities of a second phase of
consolidation, voluntary or otherwise, cannot be ruled out in the near future. It
needs to be mentioned here the EVA values reported in the paper have been
computed assuming a hurdle rate of 15% and hence the position may change in
case a lower/higher benchmark is used. It is no doubt true that the present
analysis is based on the data collected from secondary sources and hence can
only be indicative in nature. For future research, granular bank level data would
significantly improve the robustness of the analysis and hence the findings.
Moreover, looking at the performance of Public Bank Berhad and Hong Leong
Bank Berhad, as emerged from the present study, might prompt researchers’
attention to assess the effect of the ownership structure and hence the managerial
decision-making processes in Malaysian banks on their financial performance.
ACKNOWLEDGEMENTS
High Impact Project Research Grant (PBIT) of the Universiti Utara Malaysia for
the research project “Evaluation of Risk Management Systems in Malaysian
Banks”.

Performance of Malaysian Banks in RAROC & EVA Framework
43
APPENDIX A
Efficiency score of banks before and after bootstrap correction
Code Theta (Efficiency) Bias
Bias
Corrected Theta
95% confidence interval
Lower Upper
MAYBK2001 0.4103 0.2397 0.1706 0.3353 0.4057
MAYBK2002 0.4882 0.2345 0.2537 0.3847 0.4799
MAYBK2003 0.4740 0.2682 0.2058 0.3793 0.4623
MAYBK2004 0.3599 0.2905 0.0694 0.2926 0.3545
MAYBK2005 0.2571 0.3872 –0.1301 0.2099 0.2540
MAYBK2006 0.4366 0.2492 0.1874 0.3504 0.4295
MAYBK2007 0.5876 0.2612 0.3264 0.4564 0.5699
MAYBK2008 0.4587 0.1330 0.3257 0.3943 0.4574
MAYBK2009 0.2923 0.1404 0.1519 0.2578 0.2919
MAYBK2010 0.4204 0.2867 0.1338 0.3371 0.4105
MAYBK2011 0.4794 0.2080 0.2714 0.3947 0.4726
MAYBK2012 0.5501 0.0877 0.4623 0.4801 0.5490
MAYBK2013 0.4164 0.1737 0.2427 0.3524 0.4149
CIMB2002 0.3214 0.2358 0.0856 0.2706 0.3201
CIMB2003 0.2706 0.3144 –0.0438 0.2250 0.2688
CIMB2004 0.3475 0.3596 –0.0121 0.2674 0.3430
CIMB2005 0.4620 0.1961 0.2658 0.3814 0.4585
CIMB2006 0.4535 0.2640 0.1896 0.3639 0.4452
CIMB2007 1.0000 0.4935 0.5065 0.5716 0.9333
CIMB2008 0.3964 0.2883 0.1081 0.3190 0.3898
CIMB2009 0.4193 0.2701 0.1493 0.3286 0.4128
CIMB2010 0.5479 0.2602 0.2877 0.4112 0.5386
CIMB2011 0.6155 0.3224 0.2931 0.4378 0.6000
CIMB2012 0.5671 0.3352 0.2319 0.4048 0.5553
CIMB2013 0.4886 0.5859 –0.0973 0.3188 0.4793
PUB2001 0.7243 0.0546 0.6697 0.6391 0.7233
PUB2002 0.4796 0.0849 0.3947 0.4231 0.4789
PUB2003 0.5681 0.0773 0.4908 0.4995 0.5671
PUB2004 0.4083 0.1071 0.3012 0.3591 0.4076
PUB2005 0.5334 0.1193 0.4140 0.4578 0.5309
PUB2006 0.5127 0.2425 0.2702 0.4089 0.5028
PUB2007 0.8444 0.2971 0.5473 0.5809 0.8076
PUB2008 1.0000 0.4450 0.5550 0.5917 0.9375

Asish Saha et al.
44
PUB2009 0.7965 0.2629 0.5335 0.5648 0.7765
PUB2010 0.8808 0.2893 0.5915 0.6036 0.8438
PUB2011 0.9433 0.2936 0.6497 0.6374 0.8981
PUB2012 0.9002 0.2755 0.6247 0.6286 0.8667
PUB2013 1.0000 0.2778 0.7222 0.6851 0.9342
HLB2001 0.8107 0.1187 0.6920 0.6726 0.8045
HLB2002 0.5036 0.1678 0.3358 0.4220 0.4993
HLB2003 0.4128 0.1264 0.2864 0.3586 0.4120
HLB2004 0.4984 0.0925 0.4059 0.4367 0.4975
HLB2005 0.3547 0.1379 0.2168 0.3093 0.3540
HLB2006 0.5007 0.0961 0.4045 0.4369 0.4997
HLB2007 0.5031 0.0951 0.4080 0.4393 0.5022
HLB2008 0.7536 0.1295 0.6241 0.6248 0.7468
HLB2009 0.6987 0.2138 0.4849 0.5432 0.6809
HLB2010 0.4810 0.1386 0.3424 0.4121 0.4786
HLB2011 0.5339 0.0945 0.4393 0.4645 0.5328
HLB2012 0.6551 0.1843 0.4708 0.5263 0.6453
HLB2013 0.6528 0.2221 0.4307 0.5121 0.6362
AFFIN2006 0.5140 0.0767 0.4372 0.4535 0.5133
AFFIN2007 0.3526 0.1576 0.1950 0.3054 0.3518
AFFIN2008 0.4172 0.1387 0.2785 0.3603 0.4162
AFFIN2009 0.3816 0.2089 0.1727 0.3194 0.3796
AFFIN2010 0.6494 0.0658 0.5836 0.5712 0.6483
AFFIN2011 0.3430 0.1199 0.2232 0.3024 0.3425
AFFIN2012 0.5407 0.0882 0.4525 0.4723 0.5397
AFFIN2013 0.4944 0.0976 0.3968 0.4315 0.4934
ALLIANCE2007 0.5519 0.3432 0.2088 0.3980 0.5346
ALLIANCE2008 0.4940 0.2232 0.2708 0.3959 0.4855
ALLIANCE2009 0.3961 0.2914 0.1047 0.3196 0.3874
ALLIANCE2010 0.3888 0.1178 0.2710 0.3408 0.3881
ALLIANCE2011 0.3812 0.1118 0.2695 0.3354 0.3806
ALLIANCE2012 0.6379 0.0787 0.5592 0.5551 0.6365
ALLIANCE2013 0.4075 0.1712 0.2363 0.3486 0.4055
AMMB2001 0.3119 0.1310 0.1809 0.2751 0.3114
AMMB2003 0.3137 0.1369 0.1768 0.2760 0.3132
AMMB2004 0.3022 0.1313 0.1709 0.2666 0.3018
AMMB2005 0.2922 0.1379 0.1543 0.2578 0.2918
AMMB2006 0.2628 0.1588 0.1040 0.2313 0.2623

Performance of Malaysian Banks in RAROC & EVA Framework
45
AMMB2007 0.3716 0.1111 0.2606 0.3275 0.3711
AMMB2008 0.3213 0.1245 0.1969 0.2835 0.3209
AMMB2009 0.4287 0.0977 0.3310 0.3773 0.4280
AMMB2010 0.3846 0.1250 0.2596 0.3357 0.3839
AMMB2011 0.5495 0.2643 0.2852 0.4133 0.5391
AMMB2012 0.8091 0.2550 0.5541 0.5751 0.7911
AMMB2013 0.5077 0.1395 0.3682 0.4312 0.5049
RHB2001 0.2421 0.1626 0.0795 0.2136 0.2418
RHB2002 0.3109 0.1280 0.1829 0.2743 0.3105
RHB2003 0.2525 0.1757 0.0769 0.2217 0.2521
RHB2004 0.3469 0.1166 0.2303 0.3060 0.3464
RHB2005 0.2598 0.1677 0.0921 0.2285 0.2594
RHB2006 0.3639 0.3416 0.0223 0.2901 0.3593
RHB2007 0.6690 0.2636 0.4054 0.4893 0.6518
RHB2008 0.6622 0.4824 0.1798 0.4245 0.6435
RHB2009 0.6474 0.3510 0.2964 0.4539 0.6235
RHB2010 0.5319 0.2477 0.2843 0.4214 0.5189
RHB2011 0.4187 0.1535 0.2651 0.3582 0.4175
RHB2012 0.3345 0.6603 –0.3259 0.2409 0.3250
RHB2013 0.5055 0.2157 0.2898 0.4138 0.4963
Note: negative bias corrected scores reflect large bias in the original DEA estimates of the banks for
those specific years
Asish Saha et al.
46
REFERENCES
Baer, T., Mehta, A., & Samandari, H. (2011). The use of economic capital in performance
measurement for banks: A perspective. McKinsey Working Papers on Risk, No.
24.
Bandopadhayay, A., & Saha, A. (2007). RAROC: The new drivers of business growth in
Indian banks, MRPA Paper. Retrieved 28 June 2014 from http://mpra.ub.uni-
muenchen.de/8920/1/RAROC_and_EVAAB_and_AS-Revised-Final-Oct12-07. pdf
Bank Negara Malaysia (2007). Financial stability and payment system report 2007.
Retrieved 24 December 2014 from http://www.bnm.gov.my/files/publication/
fsps/en/2007/cp01.pdf
Bank Negara Malaysia (2010). Financial stability and payment system report 2010.
Retrieved 24 December 2014 from http://www.bnm.gov.my/files/publication/
fsps/en/2010/zcp07_table_A.02.pdf
Bank Negara Malaysia (2013). Quarterly Bulletin, Fourth Quarter 2013. Retrieved 24
December 2014 from http://www.bnm.gov.my/files/publication/qb/2013/
Q4/p5.pdf
Bank Negara Malaysia (2014). Financial stability and payment system report 2014.
Retrieved 24 December 2014 from http://www.bnm.gov.my/files/publication/
fsps/en/2014/zcp07_table_A.01.pdf
Berger, A. N., & Humphrey, D. B. (1997). Efficiency of financial institutions:
International survey and directions for future research. European Journal of
Operational Research, 98(2), 175–212.
Bogetoft, P., & Otto, L. (2011). Benchmarking with DEA, SFA and R. London: Springer.
Bowlin, W. F. (1998). Measuring performance: An introduction to data envelopment
analysis (DEA). Journal of Cost Analysis, 7, 3–27.
Charnes, A., Coopers, W. W., & Rhodes, E. (1978). Measuring the efficiency of decision
making units. European Journal of Operational Research, 2(6), 429–444.
Charnes, A., Cooper, W. W., & Thrall, R. M. (1991). A structure for characterizing and
classifying efficiency and inefficiency in data envelopment analysis. Journal of
Productivity Analysis, 2, 197–237.
Dunbar, K. (2013). Economic value added: A thematic bibliography. Journal of New
Business Ideas & Trends, 11(1), 54–66.
Dyson, R. G., & Shale, E. A. (2010). Data envelopment analysis operational research and
uncertainty. The Journal of the Operational Research Society, 61(1), 25–34.
European Central Bank (2010). Beyond ROE –How to measure bank performance.
Appendix to the Report on EU Banking Structure, September. Retrieved 4 July
2014 from http://www.ecb.europa.eu/PBB/pdf/other/beyondroehowtomeasure
bankperformance201009en.pdf
Everts, H., & Haarhuis, C. K. (2005). Handbook management accounting, finance and
control. Retrieved 4 July 2014 from http://www.finance-control.nl/artikel/7502
Farrell, M. J. (1957). The measurement of productive efficiency. Journal of the Royal
Statistical Society (Series A), 120(3), 253–281.
Fethi, D. M., & Pasiouras, F. (2010). Assessing bank efficiency and performance with
operational research and artificial intelligence technique. European Journal of
Operational Research, 204(2),189–198.

Performance of Malaysian Banks in RAROC & EVA Framework
47
International Monetary Fund (IMF). (2014). Financial sector performance vulnerabilities
and derivatives - Technical note. IMF Country Report No. 14/98. Retrieved 24
December 2014 from https://www.imf.org/external/pubs/ft/scr/2014/cr1498.pdf
Kimball, R. C. (1998). Economic profit and performance measurement in banking. New
England Economic Review, July/August, 35–53.
Merton, R. C. (1995). A functional perspective of financial intermediation. Financial
Management, 24(2), 23–41.
Ong, M. K. (Ed.). (2012). Managing and measuring capital: For banks and financial
institutions. London: Risk Books.
Paradi, J. C., & Zhu, H. (2013). A survey on bank branch efficiency and performance
research with data envelopment analysis, Omega, 41(1), 61–79.
Saha, A., Ahmad, N. H., & Dash, U. (2014). Drivers of technical efficiency in Malaysian
banking: A new empirical insight. Asia Pacific Economic Literature, 29(1), 161–
173.
Sharma, A. K., & Kumar, S. (2010). Economic Value Added (EVA): Literature review
and relevant issues. International Journal of Economics & Finance, 2(2), 200–
220.
Zanjani, G. (2010). An economic approach to capital allocation. The Journal of Risk and
Insurance, 77(3), 523–549.
Zeti, A. A. (2013). Reflections on financial reform - Malaysia's experience. Speech at the
2013 China Business News (CBN) Annual Meeting and Finance Summit,
Beijing, 8 December 2013.