evaluation of polyacrylamide (pam) for reducing … report 02-0781 california department of food and...
TRANSCRIPT
Final Report 02-0781
CALIFORNIA DEPARTMENT OF FOOD AND AGRICULTURE FERTILIZER RESEARCH AND EDUCATION PROGRAM
Final Report
Evaluation of Polyacrylamide (PAM) for Reducing Sediment and Nutrient
Concentration in Tail Water from Central Coast Vegetable Fields CDFA Contract Number: 02-0781
PROJECT LEADERS Michael Cahn, Water Resources and Irrigation Advisor UC Cooperative Extension, 1432 Abbott ST, Salinas, CA 93901 Husein Ajwa, Vegetable Specialist Dept. of Vegetable Crops, University of California 1636 East Alisal, Salinas, CA 93905 Richard Smith, Vegetable and Weed Advisor UC Cooperative Extension, 1432 Abbott ST, Salinas, CA 93901
OBJECTIVES
1. Evaluate effects of PAM on infiltration rates of a range of soil types found in the Salinas and Pajaro Valleys under varying water qualities.
2. Quantify the effect of PAM on sediment and nutrient concentration in irrigation runoff
from commercial vegetable fields. EXECUTIVE SUMMARY The Central Coast Regional Water Quality Control Board (RWQCB) identified agricultural run-off as a source of nutrients and sediments in the Salinas and Pajaro River watersheds. Treatment of soils with polyacrylamide (PAM), a large polymer molecule (10-15 Mg/mole), may reduce sediments and phosphorus transported in tail water run-off by flocculating suspended sediments, maintaining infiltration and stabilizing soil aggregates. Despite documented benefits of PAM for erosion control in other areas of the country, it is not widely used on the Central Coast region of California. This project evaluated the effects of PAM on sediment and nutrient concentration in irrigation tail water from vegetable fields across a range of soil types found in the Salinas and Pajaro Valleys. The methodology utilized column and field studies to quantify the effect of PAM on infiltration, run off, and sediment and nutrient (ortho and total P, NO3, Total N) loss from sprinkler and furrow irrigation systems. Because PAM has not been shown to be beneficial on
Final Report 02-0781
all soil types and under all water qualities, the column studies screened a larger group of soils and water compositions than could be accomplished with field studies. Field studies evaluated the effect of PAM on infiltration rate using a recirculating infiltrometer. Trials were also conducted in cool season vegetable fields to measure the effect of PAM on runoff, sediment and nutrient loss, and yield and quality. Information developed in this project was extended through field and seminar meetings, and newsletters. The target audiences for the project were vegetable growers and farm managers, NRCS and RCD personnel, irrigation industry reps and consultants. The results of the field trials demonstrated that PAM can significantly reduce sediments and nutrients in tail water. Across all 6 sites evaluated, treatment with PAM reduced suspended sediments by 85% compared to the untreated control. Additionally, soluble P, total P, and total N were reduced in the PAM treated run-off. PAM had no effect on nitrate or salt levels in the run-off and the polymer did not increase infiltration. Results from the recirculating infiltrometer studies showed that in furrow systems, PAM, applied only in the initial water at 10 ppm, had no significant effect on infiltration at 4 of 6 sites evaluated. At 2 sites, infiltration was reduced with the addition of PAM. Results from trials conducted in cool season vegetable fields also demonstrated that PAM, applied through overhead sprinklers at a 5 ppm concentration, was able to significantly reduce the turbidity and the suspended sediments in the tail-water. Similar to the results obtained with the recirculation infiltrometer trials, PAM reduced soluble and total P and total N in the run-off, but had no significant effect on NO3-N. Total sediment loss under sprinklers was reduced by as much as 95% using PAM. PAM applied 2 to 3 times before thinning the crop, had no significant effect on the marketable yield of lettuce; although at one location head weight was significantly increased and seedling emergence was significantly higher under the PAM treatment. The results of the columns studies confirmed that PAM applied continuously in the irrigation water decreased the final infiltration rate of all soils evaluated. Relative viscosity measurements, conducted using columns packed with a standard sand media, demonstrated that the viscosity of the applied water increased as the concentration of PAM increased. The effect of PAM on viscosity may offset the ability of the polymer to increase infiltration though improved aggregate stability. Pre-treating the surface of the soil with water containing PAM, rather than applying water with PAM continuously, maximized the final infiltration rate relative to the untreated control. The effect of PAM on infiltration was also dependent on the total salinity (EC) and the sodium adsorption ratio (SAR) of the applied water. Increasing the EC of PAM treated water increased infiltration, and increasing the SAR of PAM treated water decreased infiltration. WORK DESCRIPTION (March 2002 – February 2005) Task 1: Evaluate effects of PAM on infiltration rates of a range of soil types found in the Salinas and Pajaro Valleys and under varying water qualities. Samples of 10 soil types were collected from the top foot of commercial vegetable fields in the Salinas, Elkhorn, and Pajaro watersheds (Tables 1 and 2). Samples were air dried and ground to pass through a 2-mm sieve and were used into column infiltration experiments described in subtasks 1.1 and 1.2.
Final Report 02-0781
Subtask 1.1. Quantify the effects of PAM on infiltration rates of 10 soil types in the Salinas and Pajaro Valleys. Column studies were conducted to evaluate the effects of polyacrylamide on infiltration rate of the 10 soils. Samples of topsoil, collected from agricultural fields in Monterey, San Benito, and Santa Cruz counties, were sieved to pass through a 2 mm screen and packed into 5-cm high acrylic columns with a diameter of 7 cm. Depending on the soil type, final bulk densities of the packed columns ranged from 1.1 to 1.5 g cc-1. A constant head burette was used to maintain a 2.5-cm head of water above the surface of the soil (Figure 1). Pressure transducers and dataloggers were used to monitor the rate that water was depleted from the burettes. Final infiltration rates were determined when the infiltration reached steady state conditions. The water used for these experiments was deionized and then mixed with CaSO4 and NaCl to obtain an EC of 1 dS/m and an SAR of 2. Five treatments were evaluated for each soil type and replicated 6 times:
1. control (no PAM) 2. 10 ppm concentration of Amber 1200D1 PAM 3. 20 ppm concentration of Amber 1200D PAM 4. 10 ppm concentration of Soilfloc PAM 2 5. 20 ppm concentration of Soilfloc PAM
Treatment differences were analyzed using analysis of variance (ANOVA) statistics. Completed: Feb. 2004.
Subtask 1.2. Investigate the interaction between PAM and water quality on infiltration rate of 4 soil types common to the Salinas and Pajaro Valleys. Columns studies, investigating the interaction of water quality and PAM (Amber 1200D) on infiltration, were conducted on 4 soils (Salinas clay, Mocho silt loam, Placentia sandy loam, and Clear Lake clay) from the Central Coast. The column methodology described in subtask 1.1 was used to measure infiltration rate. A factorial treatment design with 18 water quality-PAM treatments was replicated 4 times. The treatment factors were: PAM (Amber1200D) concentration: 0 and 10 ppm SAR: 1, 4 and 8 EC: 1, 1.5, and 3 dS/m Completed: Feb. 2004. Task 2: Evaluate the effect of PAM on irrigation runoff and concentration of sediment and nutrients in tail water collected from commercial vegetable fields.
1 formerly Superfloc A-836, Amber Chem. Inc 2 Soilfloc 100D, Hydrosorb, Inc
Final Report 02-0781
Subtask 2.1. Determine the effect of PAM on infiltration rate in commercial vegetable fields.
We completed 6 in situ infiltration rate studies on soils located in the Salinas Valley. Treatments (Untreated Control, PAM 10 ppm) were replicated 4 times. Water, treated with a 10 ppm concentration of Amber 1200D PAM was applied until the advancing front reached the end of the 20-ft plots, after which water without PAM was introduced at the head of the furrows. Weirs at the tail-end of the furrows maintained a constant depth in the furrows and allowed water to overflow into a sump. A pump was used to recirculate tail water, collected in a sump, to the head of the plots. A turbidity meter was used to measure the sediment concentration in the tailwater. Samples of the tail water were analyzed for ortho and total P, NO3 , and total N, total suspended sediments.
Completed: May 2004 Subtask 2.2 Measure the effect of PAM on the amount of runoff and sediment and nutrient concentration in runoff from commercial vegetable fields irrigated with furrow systems. A trial comparing water treated with and without PAM was conducted in a furrow irrigated, head lettuce field. Plots measured 4 beds in width and 400 ft in length. Treatments (PAM, untreated control) were replicated 4 times. A fertilizer injection pump was used to meter PAM solution into the irrigation water as it entered the furrows to achieve a 10 mg/L concentration. PAM was added to the irrigation water while the wetting front advanced to the end of the rows. Weirs equipped with staffing gauges were used to monitor the inflow and outflow rates in 2 furrows per plot. The total amount of water infiltrated and amount of runoff were measured. Water samples were collected at the outflow and analyzed for sediment content, soluble and total P, NO3 and total N. Crop yield and quality (size) were evaluated from the center 2 beds of the plots. Treatment differences were analyzed using analysis of variance (ANOVA) statistics. Completed: Dec. 2004 Subtask 2.3 Measure the effect of PAM on the amount of runoff and sediment and nutrient concentration in runoff from commercial vegetable fields irrigated with sprinklers. We conducted 5 replicated trials comparing PAM-treated and untreated water in commercial fields planted with romaine lettuce, iceberg head lettuce and broccoli. Polyacrylamide (Amber 1200D) was injected into the irrigation water to achieve a 5 ppm concentration and applied through the sprinkler system. Run-off was measured and sampled from each plot during 2-3 irrigations per trial. Treatments were applied to plots, measuring 4 beds in width and 100 to 200-ft in length, and replicated 4 times. Catch-cans were used to monitor the sprinkler application rates during the irrigation events. Sumps at the end of the plots collected run-off which was measured and sampled using equipment consisting of a bilge pump, float switch, and residential flow meter. Runoff samples were analyzed for suspended sediments, soluble and total P, NO3 and total N. Infiltration rates during irrigation were calculated from the difference between the sprinkler application rate and the runoff rate. Crop yield and quality (size) were evaluated from the center 2 beds of the plots. Treatment differences will be analyzed using analysis of variance
Final Report 02-0781
(ANOVA) statistics. The effects of PAM on production costs will be estimated using current UC cost-studies for lettuce. Completed: Jan. 2005 Task 3: Conduct an outreach program to educate growers via publications, field meetings and tours on the applicability of polyacrylamide for vegetable crop production. Subtask 3.1 Make presentations of the results at grower meetings and irrigation workshops. Project results were presented to growers and industry representatives at 23 educational meetings. The presentations included 4 field demonstrations of PAM for growers and industry representatives. Details of presentations are given in Table 12. Completed: Feb. 2005 Subtask 3.2. Publish articles in Monterey County Crop Notes (distribution 1,700) and other farm industry publications. A summary article on using PAM for improving water quality was published in the Nov/Dec 2004 issue of Monterey County Crop Notes (Appendix 1). An article was also published in the Santa Cruz Resource Conservation District Newsletter in March 2005. Completed: Feb. 2005 RESULTS, DISCUSSION, CONCLUSIONS Column Infiltration Experiments The results of the column study showed that the effect of PAM on infiltration is dependent on the following factors:
1. PAM composition (Product) 2. Soil type 3. Salinity (EC and SAR) of the irrigation water 4. PAM concentration 5. PAM application rate (lb/acre)
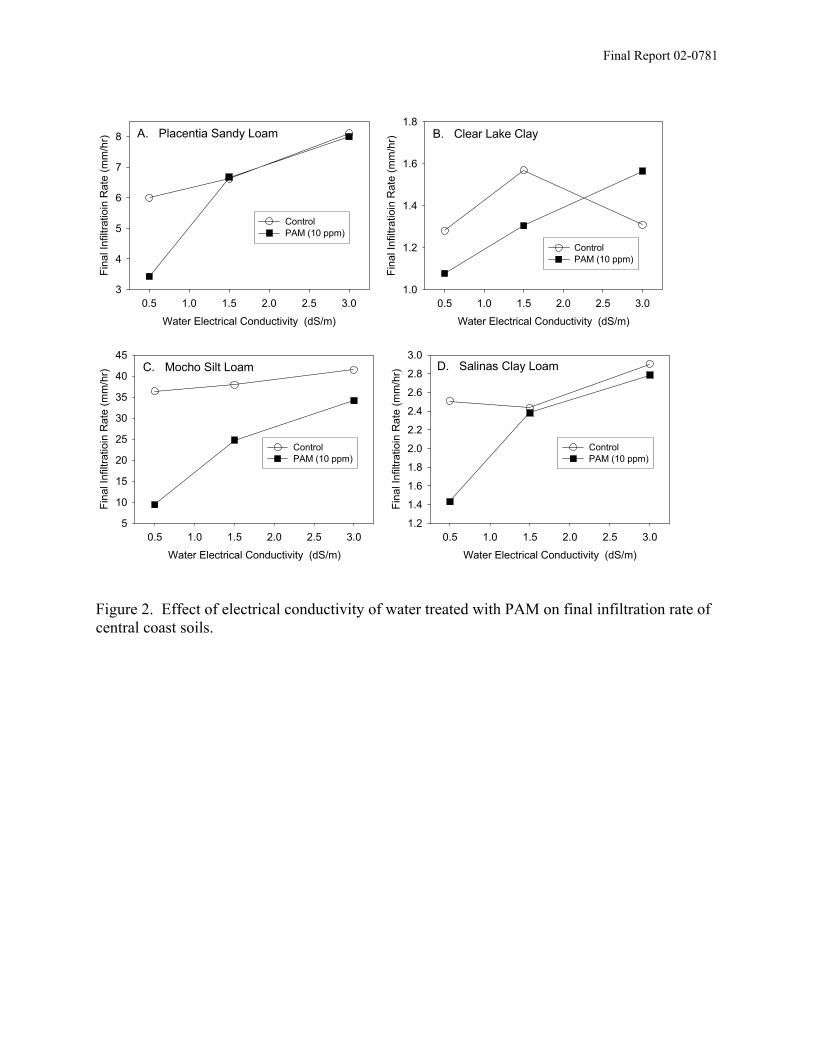
Effect of PAM on infiltration: PAM applied continuously in the water decreased the final infiltration rate of all soils tested (Table 3), though the surface of the soil columns remained visibly more aggregated with PAM then without PAM. The greatest decrease in infiltration occurred in the Oceano loamy sand. Across all soils, SoilFloc decreased the final infiltration rate more than Amber 1200 and the high concentration of PAM (20 ppm) decreased infiltration more than the low concentration (10 ppm).
Final Report 02-0781
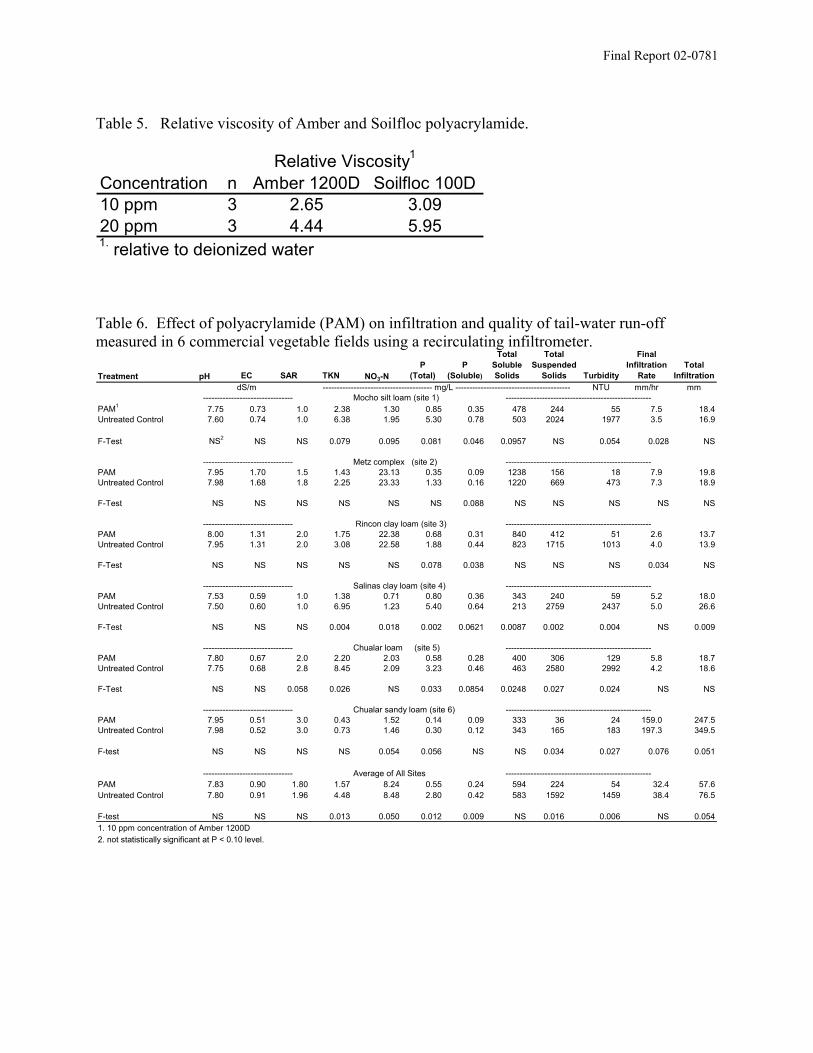
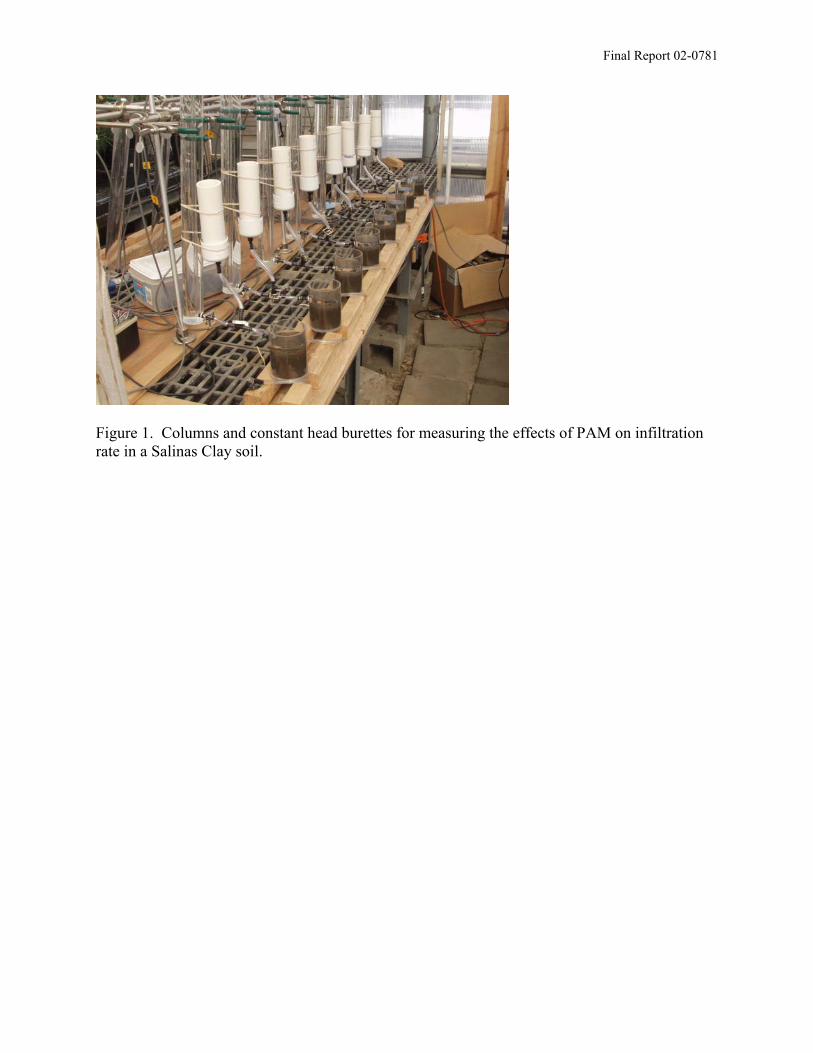
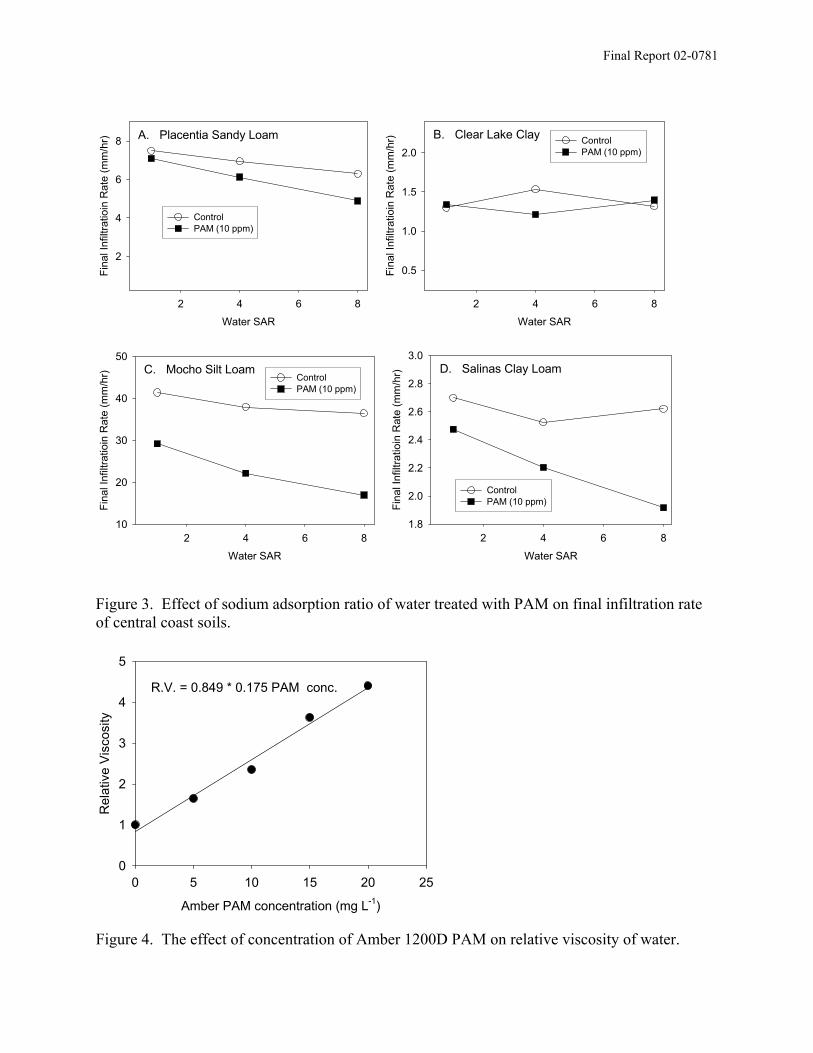
Interaction between water salinity and PAM on infiltration: The effect of PAM on infiltration was dependent on the electrical conductivity (EC) and the SAR of the applied water (Table 4). The final infiltration rate of the PAM treated water was higher as the EC of the water was increased for all soils tested (Figure 2). Conversely, the final infiltration rate of the PAM treated water was lower as the SAR of the water was raised (Figure 3). The effect of EC and SAR on infiltration was greater in the PAM treated water than in the untreated water. Additionally the effect of SAR on infiltration was greatest in water with a low EC (0.5 dS m-1) and the Mocho silt loam soil. Both EC and SAR of the water had the least effect on infiltration in the Clear Lake clay soil. Effect of PAM on water viscosity Relative viscosity measurements, conducted using columns packed with a standard sand media, demonstrated that the viscosity of the applied water increased as the concentration of PAM increased (Table 5). Also, the Soilfloc PAM had a higher viscosity than the Amber PAM at similar concentrations. For Amber PAM, relative viscosity increased by a factor of 1.75 for each increase in concentration of 10 ppm (Figure 4). The effect of PAM on viscosity may offset the ability of PAM to increase infiltration though improved aggregate structure. Effect of PAM pretreatment on infiltration Pre-treating the surface of the soil with water containing PAM, rather than applying water with PAM continuously, maximized the final infiltration rate relative to the untreated control (Figure 5). The reduction in infiltration was minimized as the pretreatment volume was decreased and the concentration of PAM was decreased. However, even by using a pretreatment, PAM never significantly increased the final infiltration rate relative to the untreated treatment. Field Infiltration Studies Infiltration rates were measured in the furrows of 6 commercial vegetable fields using a recirculating infiltrometer. Infiltration of water treated with Amber 1200D at a 10 ppm concentration was compared with untreated water at all sites. Water samples were taken at the tail-end of the furrow for chemical analyses. PAM increased the final infiltration rate at one site and decreased the infiltration rate at 2 sites (Table 6). PAM decreased total infiltration at 2 of the sites. Turbidity, and total suspended solids, which are mainly composed of sediments, were significantly reduced in the PAM treated water (Table 6). Overall, the PAM treatment reduced suspended sediments by 85% compared to the untreated control. Additionally, total and soluble P and total nitrogen were significantly reduced in the PAM treated water. However, PAM had little effect on nitrate or salt levels in the water. The effect of PAM on total P concentration was correlated to the sediment concentration in the tail water, implying that much of the P in the run-off was attached to the sediments (Figure 6). PAM Field Trials

Final Report 02-0781
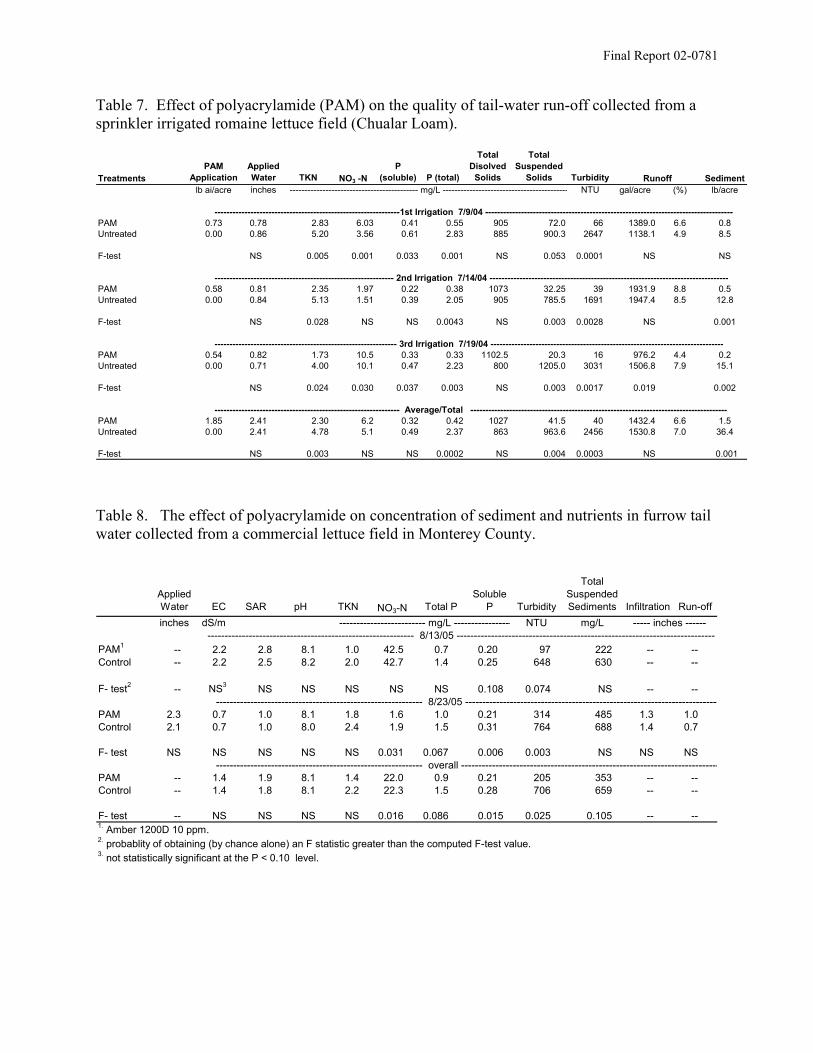
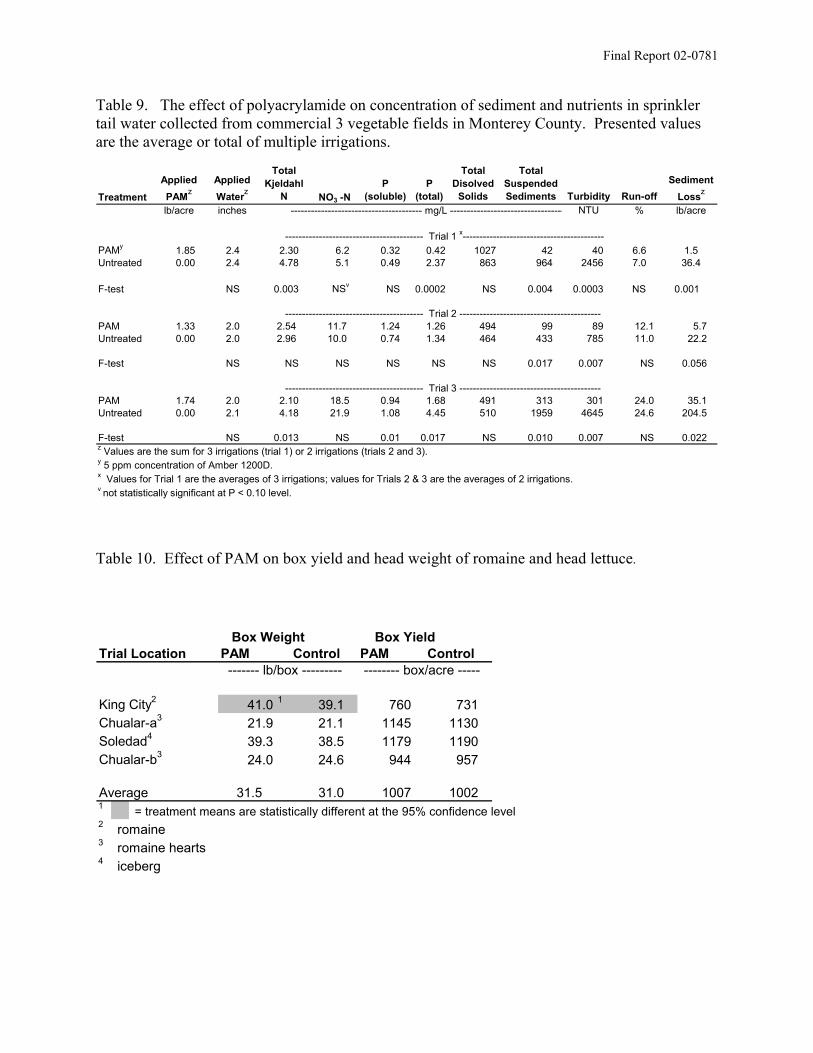
PAM was applied in replicated trials to commercial fields planted with romaine lettuce, crisphead lettuce and broccoli. Polyacrylamide (Amber 1200D) was injected into the irrigation water at a 5 ppm concentration for sprinkler irrigated trials and at a 10 ppm concentration for the furrow irrigated trial. Run-off measurements and water samples were collected during 2 to 3 irrigations per trial. Results of a completed sprinkler and furrow trial are presented in Table 7 and 8, respectively. Table 9 summarizes the results of sprinkler trials from 3 field sites. PAM applied through the sprinkler system was able to significantly reduce the turbidity and the suspended sediments in the run-off (Tables 7 and 9, Figures 7 and 8). At 2 of the sprinkler sites, PAM reduced total P and N in the run-off, but had no significant effect on soluble P and NO3-N (Table 9). At the 1st sprinkler trial site, PAM significantly reduced run-off during the 3rd irrigation and total sediment loss was reduced by 95% during the 3 irrigations (Table 7). At the 3rd sprinkler trial site, the addition of PAM reduced sediment loss from 205 to 35 lb acre-1 (Table 9). Under furrow irrigation, the application of PAM in the water did not significantly affect the total amount of infiltration or run-off (Table 8). The application of PAM did significantly reduce turbidity and soluble P in the furrow run-off. Sediment concentration in the furrow run-off was not significantly reduced through the use of PAM, although the average level of sediments was almost half the level in the untreated control treatment. We observed that after discontinuing the injection of PAM into the irrigation water which corresponded to when the wetting front had reached the end of the furrows, the concentration of suspended sediments in the run-off increased. It may be necessary to inject PAM continuously in the furrow water at low rates to maximize the water quality benefits of the treatment. The PAM applications had no significant effect on the carton yield of lettuce but did cause a significant increase in box weight (head size) at one of the trials (Table 10). Conclusions The results of the column studies demonstrated that polyacrylamide treated water can reduce infiltration rates in Central Coast soils by more than 50%. Additionally, water with a high SAR (> 5) interacted with PAM to further reduce infiltration. In contrast, high EC (> 1.5 dS/m) water minimized the effects of PAM on infiltration. Evidence in the literature and our results suggested that polyacrylamide reduced the infiltration into soil by increasing the viscosity of water. Hence, we found that pre-applications to the soil surface, using small volumes of polyacrylamide treated water, minimized the reduction in infiltration while maintaining the surface structure of the soil. The field infiltrometer experiments demonstrated that initially applying PAM and then using untreated water generally maintains or improves infiltration and greatly improves the quality of the tail water by flocculating out suspended sediments and reducing the load of total P and N nutrients transported in the tail water. Also, injecting PAM into sprinkler water at a 5 ppm concentration was found to improve the quality of tail water run-off without significantly increasing run-off. The addition of PAM to the irrigation water had no detrimental effects on lettuce yield and quality. The results of this project demonstrated that polyacrylamide may be an important tool for improving farm water quality on the Central Coast. PROJECT EVALUATION
Final Report 02-0781
The most significant outcome of this project was demonstrating that polyacrylamide is an effective practice for preventing the loss of nutrients and sediments from irrigated agricultural fields on the Central Coast. We measured a lost of sediment ranging between 10 to 100 lbs/acre during each overhead sprinkler irrigation when no conservation practices were implemented. Our results demonstrated that injecting PAM at low concentrations (5 ppm) in the irrigation water could reduce sediment loss by 80 to 90% and reduce loss of total P and N by more than 50%. Our analysis of the cost of using PAM as a conservation practice in solid-set sprinklers for germinating lettuce ranged between $17 and $21 per acre for 4 applications, each at a rate of 0.5 lbs of PAM/acre (Table 11). We assumed that surface-placed drip irrigation would be used after thinning, a practice that is now common in the Salinas Valley, and therefore no further applications of PAM would be needed for the remaining cycle of the crop. The costs accounted for labor, equipment, and materials costs as well as cost-sharing from the NRCS-EQIP program. Labor was the highest component of the costs for using PAM; therefore methods to automate the application may reduce the overall costs. Also because labor costs are independent of field size, the cost per acre for PAM applications would be less on large fields than on small fields. Considering that total preharvest costs for producing lettuce are close to $2500 per acre, the PAM applications would represent less than 1% of the production costs. The benefits achieved from using PAM may more than compensate for the additional costs. For example, costs associated with the removal of sediment from drainage ditches and canals may decrease significantly with the use of PAM. PAM may also be less costly than other comparable conservation practices, such as sediment basins, which take land out of production, are costly to build and maintain, and do not reduce the lost of sediments and nutrients as effectively as PAM applications. Another important result of this project was to develop guidelines for using PAM to maximize the benefits to water quality under sprinkler and furrow systems. Published methods of using PAM in furrow systems have advised applying PAM early in the irrigation and discontinuing the application when the water advances to approximately 75% of the length of the field. We found that applying the PAM at lower rates during the entire irrigation would improve the water quality benefits of the application. We also demonstrated that applying PAM at low rates through overhead sprinklers maximized the benefits to water quality. OUTREACH ACTIVITIES SUMMARY Project results were presented to growers and industry representatives at 23 educational meetings (Table 12). The presentations included 4 field demonstrations of PAM for growers and industry representatives. A summary article on using PAM for improving water quality was published in the Nov/Dec 2004 issue of Monterey County Crop Notes (Appendix 1). An article was also published in the Santa Cruz Resource Conservation District Newsletter in March 2005.
Final Report 02-0781
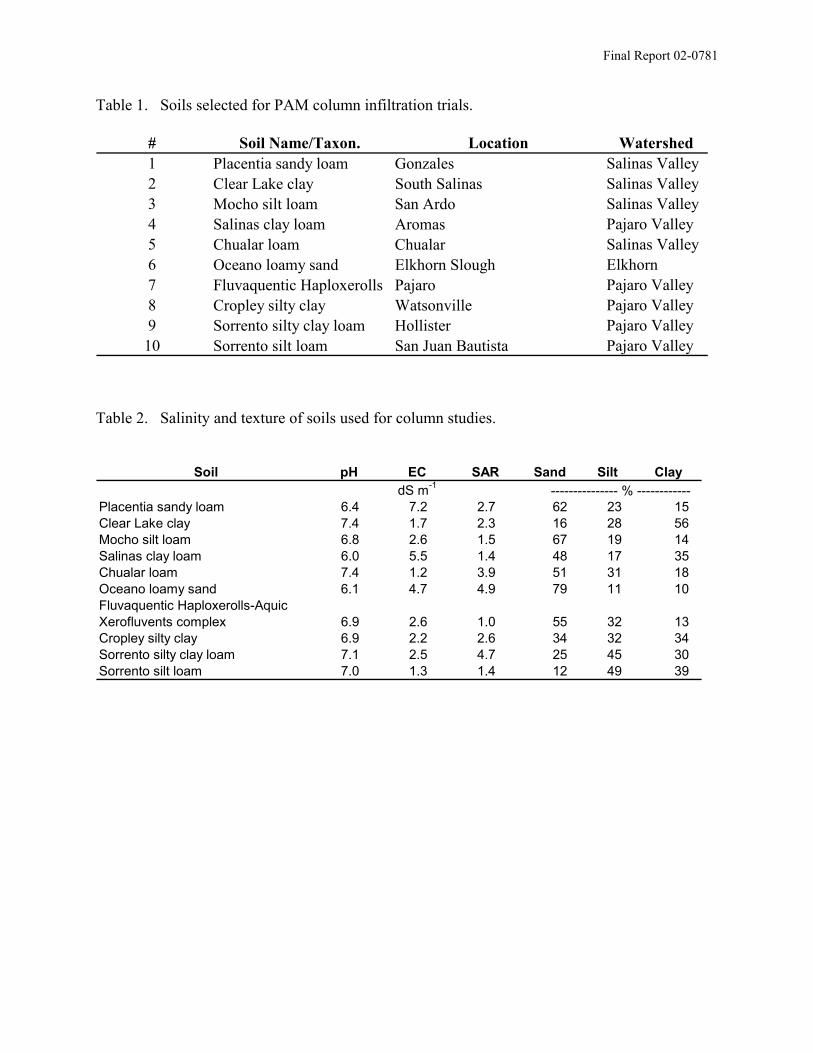
Table 1. Soils selected for PAM column infiltration trials.
# Soil Name/Taxon. Location Watershed1 Placentia sandy loam Gonzales Salinas Valley2 Clear Lake clay South Salinas Salinas Valley3 Mocho silt loam San Ardo Salinas Valley4 Salinas clay loam Aromas Pajaro Valley5 Chualar loam Chualar Salinas Valley6 Oceano loamy sand Elkhorn Slough Elkhorn7 Fluvaquentic Haploxerolls Pajaro Pajaro Valley8 Cropley silty clay Watsonville Pajaro Valley9 Sorrento silty clay loam Hollister Pajaro Valley
10 Sorrento silt loam San Juan Bautista Pajaro Valley Table 2. Salinity and texture of soils used for column studies.
Soil pH EC SAR Sand Silt ClaydS m-1 --------------- % ------------
Placentia sandy loam 6.4 7.2 2.7 62 23 15Clear Lake clay 7.4 1.7 2.3 16 28 56Mocho silt loam 6.8 2.6 1.5 67 19 14Salinas clay loam 6.0 5.5 1.4 48 17 35Chualar loam 7.4 1.2 3.9 51 31 18Oceano loamy sand 6.1 4.7 4.9 79 11 10Fluvaquentic Haploxerolls-Aquic Xerofluvents complex 6.9 2.6 1.0 55 32 13Cropley silty clay 6.9 2.2 2.6 34 32 34Sorrento silty clay loam 7.1 2.5 4.7 25 45 30Sorrento silt loam 7.0 1.3 1.4 12 49 39
Final Report 02-0781
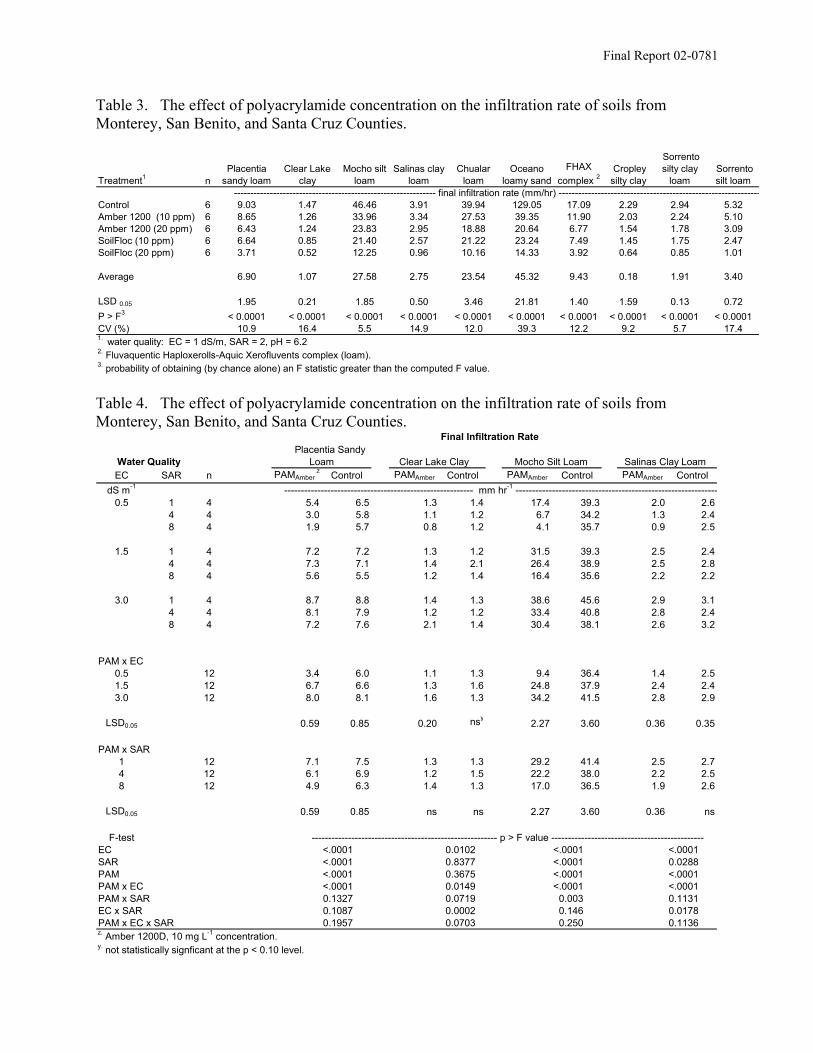
Table 3. The effect of polyacrylamide concentration on the infiltration rate of soils from Monterey, San Benito, and Santa Cruz Counties.
Treatment1 nPlacentia
sandy loamClear Lake
clayMocho silt
loamSalinas clay
loamChualar
loamOceano
loamy sandFHAX
complex 2 Cropley silty clay
Sorrento silty clay
loam Sorrento silt loam
-------------------------------------------------------------- final infiltration rate (mm/hr) --------------------------------------------------------------Control 6 9.03 1.47 46.46 3.91 39.94 129.05 17.09 2.29 2.94 5.32Amber 1200 (10 ppm) 6 8.65 1.26 33.96 3.34 27.53 39.35 11.90 2.03 2.24 5.10Amber 1200 (20 ppm) 6 6.43 1.24 23.83 2.95 18.88 20.64 6.77 1.54 1.78 3.09SoilFloc (10 ppm) 6 6.64 0.85 21.40 2.57 21.22 23.24 7.49 1.45 1.75 2.47SoilFloc (20 ppm) 6 3.71 0.52 12.25 0.96 10.16 14.33 3.92 0.64 0.85 1.01
Average 6.90 1.07 27.58 2.75 23.54 45.32 9.43 0.18 1.91 3.40
LSD 0.05 1.95 0.21 1.85 0.50 3.46 21.81 1.40 1.59 0.13 0.72P > F3 < 0.0001 < 0.0001 < 0.0001 < 0.0001 < 0.0001 < 0.0001 < 0.0001 < 0.0001 < 0.0001 < 0.0001CV (%) 10.9 16.4 5.5 14.9 12.0 39.3 12.2 9.2 5.7 17.41. water quality: EC = 1 dS/m, SAR = 2, pH = 6.22. Fluvaquentic Haploxerolls-Aquic Xerofluvents complex (loam).3. probability of obtaining (by chance alone) an F statistic greater than the computed F value. Table 4. The effect of polyacrylamide concentration on the infiltration rate of soils from Monterey, San Benito, and Santa Cruz Counties.
Final Infiltration Rate
Water Quality Clear Lake Clay Mocho Silt Loam Salinas Clay LoamEC SAR n PAMAmber
z Control PAMAmber Control PAMAmber Control PAMAmber ControldS m-1 --------------------------------------------------------- mm hr-1 -------------------------------------------------------------
0.5 1 4 5.4 6.5 1.3 1.4 17.4 39.3 2.0 2.64 4 3.0 5.8 1.1 1.2 6.7 34.2 1.3 2.48 4 1.9 5.7 0.8 1.2 4.1 35.7 0.9 2.5
1.5 1 4 7.2 7.2 1.3 1.2 31.5 39.3 2.5 2.44 4 7.3 7.1 1.4 2.1 26.4 38.9 2.5 2.88 4 5.6 5.5 1.2 1.4 16.4 35.6 2.2 2.2
3.0 1 4 8.7 8.8 1.4 1.3 38.6 45.6 2.9 3.14 4 8.1 7.9 1.2 1.2 33.4 40.8 2.8 2.48 4 7.2 7.6 2.1 1.4 30.4 38.1 2.6 3.2
PAM x EC 0.5 12 3.4 6.0 1.1 1.3 9.4 36.4 1.4 2.51.5 12 6.7 6.6 1.3 1.6 24.8 37.9 2.4 2.43.0 12 8.0 8.1 1.6 1.3 34.2 41.5 2.8 2.9
LSD0.05 0.59 0.85 0.20 nsy2.27 3.60 0.36 0.35
PAM x SAR 1 12 7.1 7.5 1.3 1.3 29.2 41.4 2.5 2.74 12 6.1 6.9 1.2 1.5 22.2 38.0 2.2 2.58 12 4.9 6.3 1.4 1.3 17.0 36.5 1.9 2.6
LSD0.05 0.59 0.85 ns ns 2.27 3.60 0.36 ns
F-test -------------------------------------------------------- p > F value ----------------------------------------------ECSARPAMPAM x ECPAM x SAREC x SARPAM x EC x SARz. Amber 1200D, 10 mg L-1 concentration.y. not statistically signficant at the p < 0.10 level.
<.0001<.0001<.0001<.00010.13270.10870.1957
0.01020.83770.36750.01490.07190.00020.0703
<.0001<.0001<.0001<.0001
0.0030.1460.250
<.00010.0288<.0001<.00010.11310.01780.1136
Placentia Sandy Loam
Final Report 02-0781
Table 5. Relative viscosity of Amber and Soilfloc polyacrylamide.
Relative Viscosity1
Concentration n Amber 1200D Soilfloc 100D10 ppm 3 2.65 3.0920 ppm 3 4.44 5.951. relative to deionized water
Table 6. Effect of polyacrylamide (PAM) on infiltration and quality of tail-water run-off measured in 6 commercial vegetable fields using a recirculating infiltrometer.
Treatment pH EC SAR TKN NO3-NP
(Total) P
(Soluble)
Total Soluble Solids
Total Suspended
Solids Turbidity
Final Infiltration
Rate Total
InfiltrationdS/m --------------------------------------- mg/L ----------------------------------------- NTU mm/hr mm
-------------------------------- Mocho silt loam (site 1) ----------------------------------------------------PAM1 7.75 0.73 1.0 2.38 1.30 0.85 0.35 478 244 55 7.5 18.4Untreated Control 7.60 0.74 1.0 6.38 1.95 5.30 0.78 503 2024 1977 3.5 16.9
F-Test NS2 NS NS 0.079 0.095 0.081 0.046 0.0957 NS 0.054 0.028 NS
-------------------------------- Metz complex (site 2) ----------------------------------------------------PAM 7.95 1.70 1.5 1.43 23.13 0.35 0.09 1238 156 18 7.9 19.8Untreated Control 7.98 1.68 1.8 2.25 23.33 1.33 0.16 1220 669 473 7.3 18.9
F-Test NS NS NS NS NS NS 0.088 NS NS NS NS NS
-------------------------------- Rincon clay loam (site 3) ----------------------------------------------------PAM 8.00 1.31 2.0 1.75 22.38 0.68 0.31 840 412 51 2.6 13.7Untreated Control 7.95 1.31 2.0 3.08 22.58 1.88 0.44 823 1715 1013 4.0 13.9
F-Test NS NS NS NS NS 0.078 0.038 NS NS NS 0.034 NS
-------------------------------- Salinas clay loam (site 4) ----------------------------------------------------PAM 7.53 0.59 1.0 1.38 0.71 0.80 0.36 343 240 59 5.2 18.0Untreated Control 7.50 0.60 1.0 6.95 1.23 5.40 0.64 213 2759 2437 5.0 26.6
F-Test NS NS NS 0.004 0.018 0.002 0.0621 0.0087 0.002 0.004 NS 0.009
-------------------------------- Chualar loam (site 5) ----------------------------------------------------PAM 7.80 0.67 2.0 2.20 2.03 0.58 0.28 400 306 129 5.8 18.7Untreated Control 7.75 0.68 2.8 8.45 2.09 3.23 0.46 463 2580 2992 4.2 18.6
F-Test NS NS 0.058 0.026 NS 0.033 0.0854 0.0248 0.027 0.024 NS NS
-------------------------------- Chualar sandy loam (site 6) ----------------------------------------------------PAM 7.95 0.51 3.0 0.43 1.52 0.14 0.09 333 36 24 159.0 247.5Untreated Control 7.98 0.52 3.0 0.73 1.46 0.30 0.12 343 165 183 197.3 349.5
F-test NS NS NS NS 0.054 0.056 NS NS 0.034 0.027 0.076 0.051
-------------------------------- Average of All Sites ----------------------------------------------------PAM 7.83 0.90 1.80 1.57 8.24 0.55 0.24 594 224 54 32.4 57.6Untreated Control 7.80 0.91 1.96 4.48 8.48 2.80 0.42 583 1592 1459 38.4 76.5
F-test NS NS NS 0.013 0.050 0.012 0.009 NS 0.016 0.006 NS 0.0541. 10 ppm concentration of Amber 1200D2. not statistically significant at P < 0.10 level.
Final Report 02-0781
Table 7. Effect of polyacrylamide (PAM) on the quality of tail-water run-off collected from a sprinkler irrigated romaine lettuce field (Chualar Loam).
TreatmentsPAM
ApplicationApplied Water TKN NO3 -N
P (soluble) P (total)
Total Disolved
Solids
Total Suspended
Solids Turbidity Sedimentlb ai/acre inches ------------------------------------------- mg/L ------------------------------------------ NTU gal/acre (%) lb/acre
--------------------------------------------------------------1st Irrigation 7/9/04 -----------------------------------------------------------------------------------PAM 0.73 0.78 2.83 6.03 0.41 0.55 905 72.0 66 1389.0 6.6 0.8Untreated 0.00 0.86 5.20 3.56 0.61 2.83 885 900.3 2647 1138.1 4.9 8.5
F-test NS 0.005 0.001 0.033 0.001 NS 0.053 0.0001 NS NS
------------------------------------------------------------ 2nd Irrigation 7/14/04 --------------------------------------------------------------------------------PAM 0.58 0.81 2.35 1.97 0.22 0.38 1073 32.25 39 1931.9 8.8 0.5Untreated 0.00 0.84 5.13 1.51 0.39 2.05 905 785.5 1691 1947.4 8.5 12.8
F-test NS 0.028 NS NS 0.0043 NS 0.003 0.0028 NS 0.001
------------------------------------------------------------- 3rd Irrigation 7/19/04 ------------------------------------------------------------------------------PAM 0.54 0.82 1.73 10.5 0.33 0.33 1102.5 20.3 16 976.2 4.4 0.2Untreated 0.00 0.71 4.00 10.1 0.47 2.23 800 1205.0 3031 1506.8 7.9 15.1
F-test NS 0.024 0.030 0.037 0.003 NS 0.003 0.0017 0.019 0.002
-------------------------------------------------------------- Average/Total --------------------------------------------------------------------------------------PAM 1.85 2.41 2.30 6.2 0.32 0.42 1027 41.5 40 1432.4 6.6 1.5Untreated 0.00 2.41 4.78 5.1 0.49 2.37 863 963.6 2456 1530.8 7.0 36.4
F-test NS 0.003 NS NS 0.0002 NS 0.004 0.0003 NS 0.001
Runoff
Table 8. The effect of polyacrylamide on concentration of sediment and nutrients in furrow tail water collected from a commercial lettuce field in Monterey County.
Applied Water EC SAR pH TKN NO3-N Total P
Soluble P Turbidity
Total Suspended Sediments Infiltration Run-off
inches dS/m ------------------------- mg/L ----------------- NTU mg/L ----- inches ------ ------------------------------------------------------------ 8/13/05 ---------------------------------------------------------------------------
PAM1 -- 2.2 2.8 8.1 1.0 42.5 0.7 0.20 97 222 -- --Control -- 2.2 2.5 8.2 2.0 42.7 1.4 0.25 648 630 -- --
F- test2 -- NS3 NS NS NS NS NS 0.108 0.074 NS -- -- ------------------------------------------------------------ 8/23/05 --------------------------------------------------------------------------
PAM 2.3 0.7 1.0 8.1 1.8 1.6 1.0 0.21 314 485 1.3 1.0Control 2.1 0.7 1.0 8.0 2.4 1.9 1.5 0.31 764 688 1.4 0.7
F- test NS NS NS NS NS 0.031 0.067 0.006 0.003 NS NS NS ------------------------------------------------------------ overall ---------------------------------------------------------------------------
PAM -- 1.4 1.9 8.1 1.4 22.0 0.9 0.21 205 353 -- --Control -- 1.4 1.8 8.1 2.2 22.3 1.5 0.28 706 659 -- --
F- test -- NS NS NS NS 0.016 0.086 0.015 0.025 0.105 -- --1. Amber 1200D 10 ppm.2. probablity of obtaining (by chance alone) an F statistic greater than the computed F-test value.3. not statistically significant at the P < 0.10 level.
Final Report 02-0781
Table 9. The effect of polyacrylamide on concentration of sediment and nutrients in sprinkler tail water collected from commercial 3 vegetable fields in Monterey County. Presented values are the average or total of multiple irrigations.
Treatment
Applied PAMz
Applied Waterz
Total Kjeldahl
N NO3 -NP
(soluble)P
(total)
Total Disolved
Solids
Total Suspended Sediments Turbidity Run-off
Sediment Lossz
lb/acre inches --------------------------------------- mg/L ---------------------------------- NTU % lb/acre
----------------------------------------- Trial 1 x------------------------------------------PAMy 1.85 2.4 2.30 6.2 0.32 0.42 1027 42 40 6.6 1.5Untreated 0.00 2.4 4.78 5.1 0.49 2.37 863 964 2456 7.0 36.4
F-test NS 0.003 NSv NS 0.0002 NS 0.004 0.0003 NS 0.001
----------------------------------------- Trial 2 ------------------------------------------PAM 1.33 2.0 2.54 11.7 1.24 1.26 494 99 89 12.1 5.7Untreated 0.00 2.0 2.96 10.0 0.74 1.34 464 433 785 11.0 22.2
F-test NS NS NS NS NS NS 0.017 0.007 NS 0.056
----------------------------------------- Trial 3 ------------------------------------------PAM 1.74 2.0 2.10 18.5 0.94 1.68 491 313 301 24.0 35.1Untreated 0.00 2.1 4.18 21.9 1.08 4.45 510 1959 4645 24.6 204.5
F-test NS 0.013 NS 0.01 0.017 NS 0.010 0.007 NS 0.022z Values are the sum for 3 irrigations (trial 1) or 2 irrigations (trials 2 and 3). y 5 ppm concentration of Amber 1200D.x Values for Trial 1 are the averages of 3 irrigations; values for Trials 2 & 3 are the averages of 2 irrigations. v not statistically significant at P < 0.10 level. Table 10. Effect of PAM on box yield and head weight of romaine and head lettuce.
Box Weight Box Yield Trial Location PAM Control PAM Control
------- lb/box --------- -------- box/acre -----
King City2 41.0 1 39.1 760 731Chualar-a3 21.9 21.1 1145 1130Soledad4 39.3 38.5 1179 1190Chualar-b3 24.0 24.6 944 957
Average 31.5 31.0 1007 10021 = treatment means are statistically different at the 95% confidence level2 romaine 3 romaine hearts4 iceberg
Final Report 02-0781
Table 11. Estimated costs for treating a 15-acre field of lettuce with polyacrylamide between planting and thinning (4 PAM applications).
Source unitnumber of units cost/unit amortized seasonal use
total cost/acre/year
area treated cost/field
Equipment costs $ years acres/year $ acres $5.5 hp gas pump ea 1 600 5 150 0.80 15 12.01000 gal fertilizer tank ea 1 700 10 150 0.47 15 7.0flow meter ea 1 60 5 150 0.08 15 1.2
Material/Operational CostsSoilfloc 300E PAM for 4 irrigations lb/acre 2 4 -- -- -- 15 120.0Fuel gal 4 2.5 15 0.7pump maintenance (7% of value) ea 1 42 15 2.8
Labor Costs(4 irrigations) 3 hrs per irrigation hours 12 14 -- -- -- 15 168.0
Total Costs ($) 311.7
Total Costs per Acre ($/acre) 20.8 Table 12. Summary of educational presentations on FREP project results.
Date Meeting name Presentation Topic Location Attendance01/20/04 UC Farm Water Quality Short Course Irrigation and salinity management Gilroy 4501/22/04 UC Farm Water Quality Short Course Irrigation and salinity management King City 6203/03/04 UC Farm Water Quality Short Course Irrigation and salinity management Watsonville 4503/11/04 UC Farm Water Quality Short Course Irrigation and salinity management Salinas 4503/22/04 UC Farm Water Quality Short Course Irrigation and salinity management Santa Cruz 5004/16/04 Regional Water Quality Control Board TAC Conservation practices for improving farm water Moss Landing 1109/24/04 UC Farm Water Quality Short Course Irrigation and Salinity Salinas 4510/11/04 MCWRA-AWAC Demonstration of Polyacrylamide using Sprinklers Chualar 2010/19/04 UC Farm Water Quality Short Course Irrigation and Salinity Gilroy 5010/20/04 AQWA-news media Demonstration of Polyacrylamide using Sprinklers Salinas 711/10/04 UC Farm Water Quality Short Course Irrigation and Salinity Watsonville 50
11/11/04 FREP Conference Effects of PAM on Tail Water Run-off from Central Coast Vegetable Fields Tulare 60
12/02/04 Vegetable Crops Continuing Conference Polyacrylamide and other Best Management Practices for Protecting Water Quality Davis 45
12/08/04 UC Farm Water Quality Short Course Irrigation and Salinity King City 5012/09/04 Grower update meeting Water Quality Best Management Practices Half Moon Bay 4501/18/05 UC Farm Water Quality Short Course Irrigation and Salinity Hollister 5001/27/05 California Irrigation Institute Water Seminar Polyacrylamide effects on Sediments and Nutrients Sacramento 5001/28/05 UC Farm Water Quality Short Course Irrigation and Salinity Salinas 5002/02/05 CalASA Plant and Soil Conference Polyacrylamide effects on Sediments and Nutrients Modesto 6002/17/05 UC Farm Water Quality Short Course Irrigation and Salinity (Spanish) Watsonville 5002/22/05 Irrigation and Nutrient Conference Polyacrylamide effects on Sediments and Nutrients Salinas 5002/22/05 Cover Crops Field Day Demonstration of Polyacrylamide using Sprinklers Salinas 3502/25/05 AQWA media event for Congressman Sam Farr Polyacrylamide (PAM) demonstration Salinas 40
Final Report 02-0781
Figure 1. Columns and constant head burettes for measuring the effects of PAM on infiltration rate in a Salinas Clay soil.
Final Report 02-0781
Water Electrical Conductivity (dS/m)
0.5 1.0 1.5 2.0 2.5 3.0
Fina
l Inf
iltra
tioin
Rat
e (m
m/h
r)
3
4
5
6
7
8
ControlPAM (10 ppm)
A. Placentia Sandy Loam
Water Electrical Conductivity (dS/m)
0.5 1.0 1.5 2.0 2.5 3.0
Fina
l Inf
iltra
tioin
Rat
e (m
m/h
r)
1.0
1.2
1.4
1.6
1.8
ControlPAM (10 ppm)
B. Clear Lake Clay
Water Electrical Conductivity (dS/m)
0.5 1.0 1.5 2.0 2.5 3.0
Fina
l Inf
iltra
tioin
Rat
e (m
m/h
r)
5
10
15
20
25
30
35
40
45
ControlPAM (10 ppm)
C. Mocho Silt Loam
Water Electrical Conductivity (dS/m)
0.5 1.0 1.5 2.0 2.5 3.0
Fina
l Inf
iltra
tioin
Rat
e (m
m/h
r)
1.2
1.4
1.6
1.8
2.0
2.2
2.4
2.6
2.8
3.0
ControlPAM (10 ppm)
D. Salinas Clay Loam
Figure 2. Effect of electrical conductivity of water treated with PAM on final infiltration rate of central coast soils.
Final Report 02-0781
Water SAR
2 4 6 8
Fina
l Inf
iltra
tioin
Rat
e (m
m/h
r)
2
4
6
8
ControlPAM (10 ppm)
A. Placentia Sandy Loam
Water SAR
2 4 6 8
Fina
l Inf
iltra
tioin
Rat
e (m
m/h
r)
0.5
1.0
1.5
2.0ControlPAM (10 ppm)
B. Clear Lake Clay
Water SAR
2 4 6 8
Fina
l Inf
iltra
tioin
Rat
e (m
m/h
r)
10
20
30
40
50
ControlPAM (10 ppm)
C. Mocho Silt Loam
Water SAR
2 4 6 8
Fina
l Inf
iltra
tioin
Rat
e (m
m/h
r)
1.8
2.0
2.2
2.4
2.6
2.8
3.0
ControlPAM (10 ppm)
D. Salinas Clay Loam
Figure 3. Effect of sodium adsorption ratio of water treated with PAM on final infiltration rate of central coast soils.
Amber PAM concentration (mg L-1)
0 5 10 15 20 25
Rel
ativ
e Vi
scos
ity
0
1
2
3
4
5
R.V. = 0.849 * 0.175 PAM conc.
Figure 4. The effect of concentration of Amber 1200D PAM on relative viscosity of water.
Final Report 02-0781
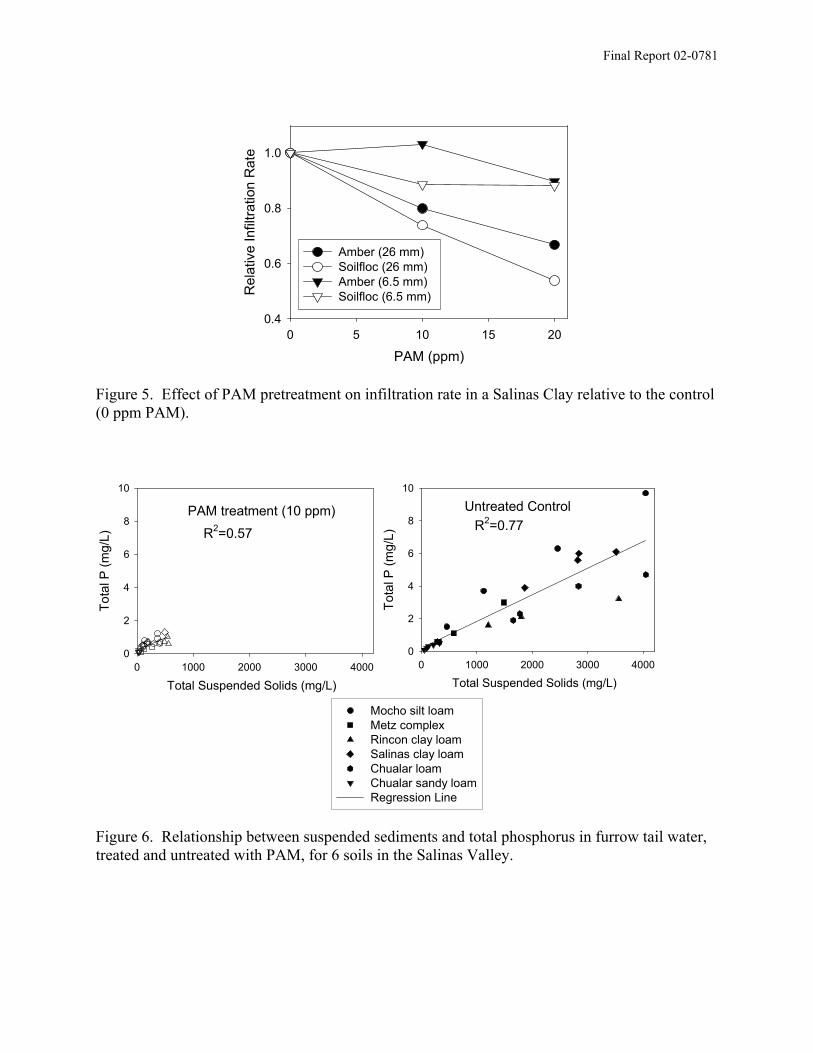
PAM (ppm)0 5 10 15 20
Rel
ativ
e In
filtra
tion
Rat
e
0.4
0.6
0.8
1.0
Amber (26 mm)Soilfloc (26 mm)Amber (6.5 mm)Soilfloc (6.5 mm)
Figure 5. Effect of PAM pretreatment on infiltration rate in a Salinas Clay relative to the control (0 ppm PAM).
Total Suspended Solids (mg/L)0 1000 2000 3000 4000
Tota
l P (m
g/L)
0
2
4
6
8
10
Mocho silt loamMetz complexRincon clay loam Salinas clay loamChualar loamChualar sandy loamRegression Line
R2=0.77Untreated Control
Total Suspended Solids (mg/L)0 1000 2000 3000 4000
Tota
l P (m
g/L)
0
2
4
6
8
10
PAM treatment (10 ppm)
R2=0.57
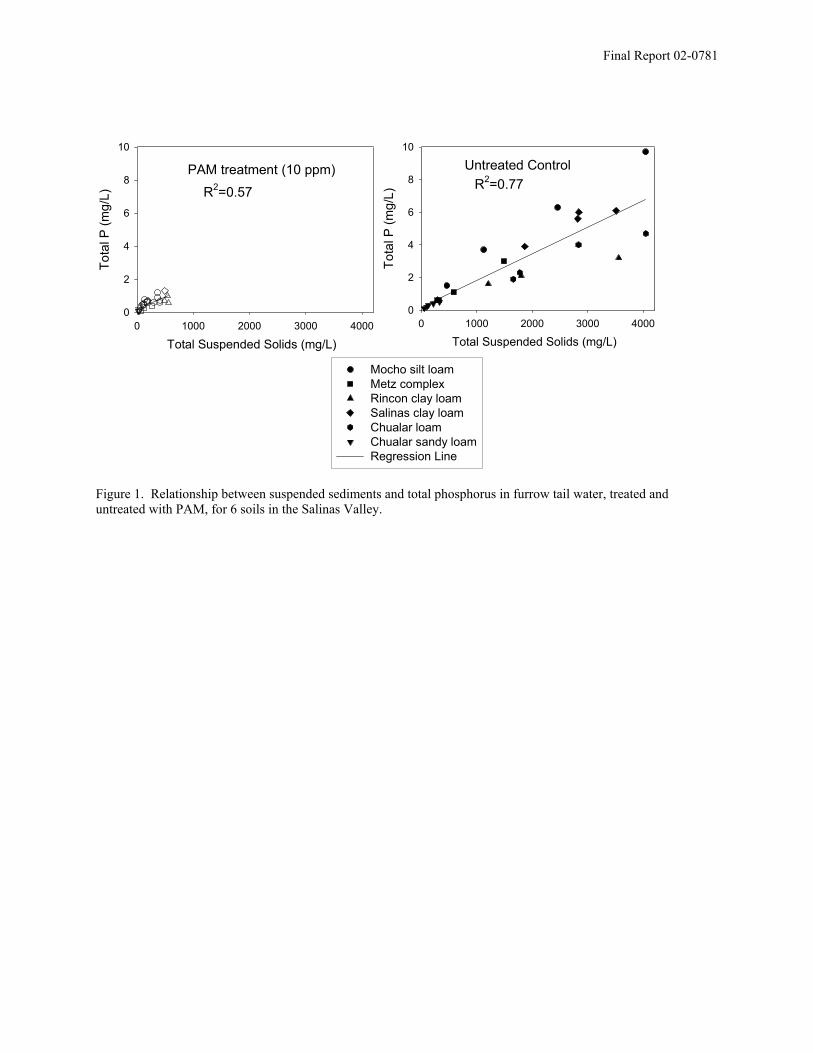
Figure 6. Relationship between suspended sediments and total phosphorus in furrow tail water, treated and untreated with PAM, for 6 soils in the Salinas Valley.
Final Report 02-0781
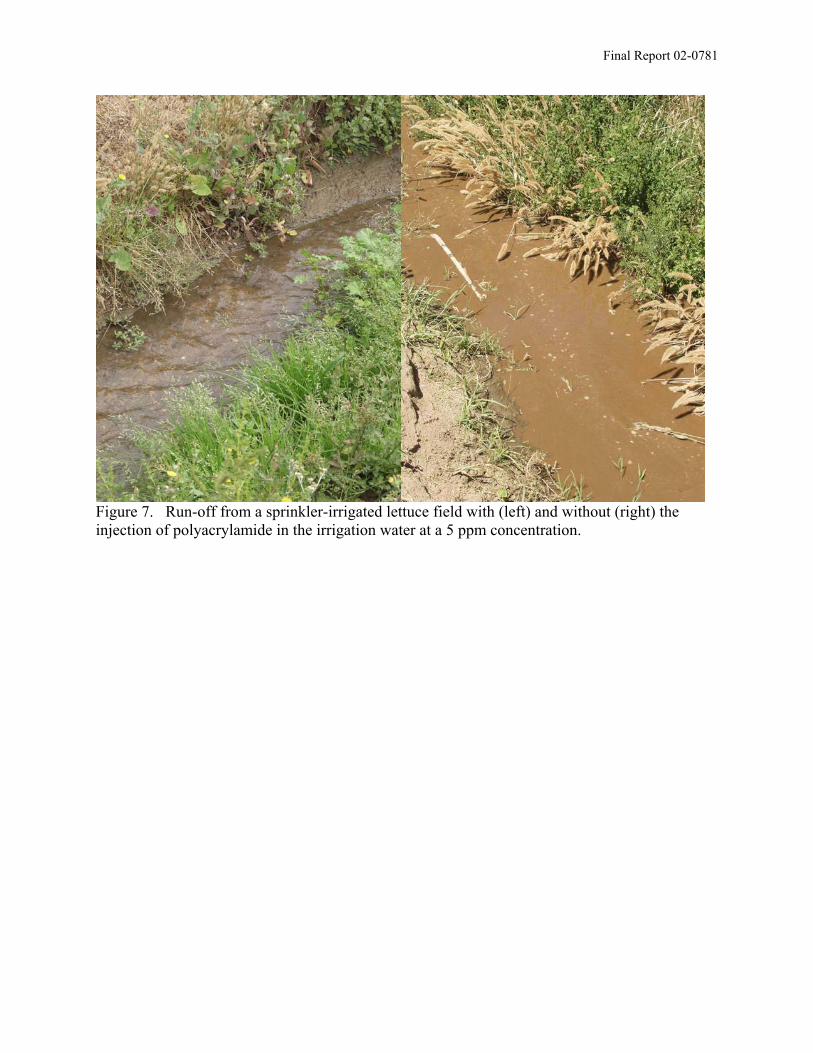
Figure 7. Run-off from a sprinkler-irrigated lettuce field with (left) and without (right) the injection of polyacrylamide in the irrigation water at a 5 ppm concentration.
Final Report 02-0781
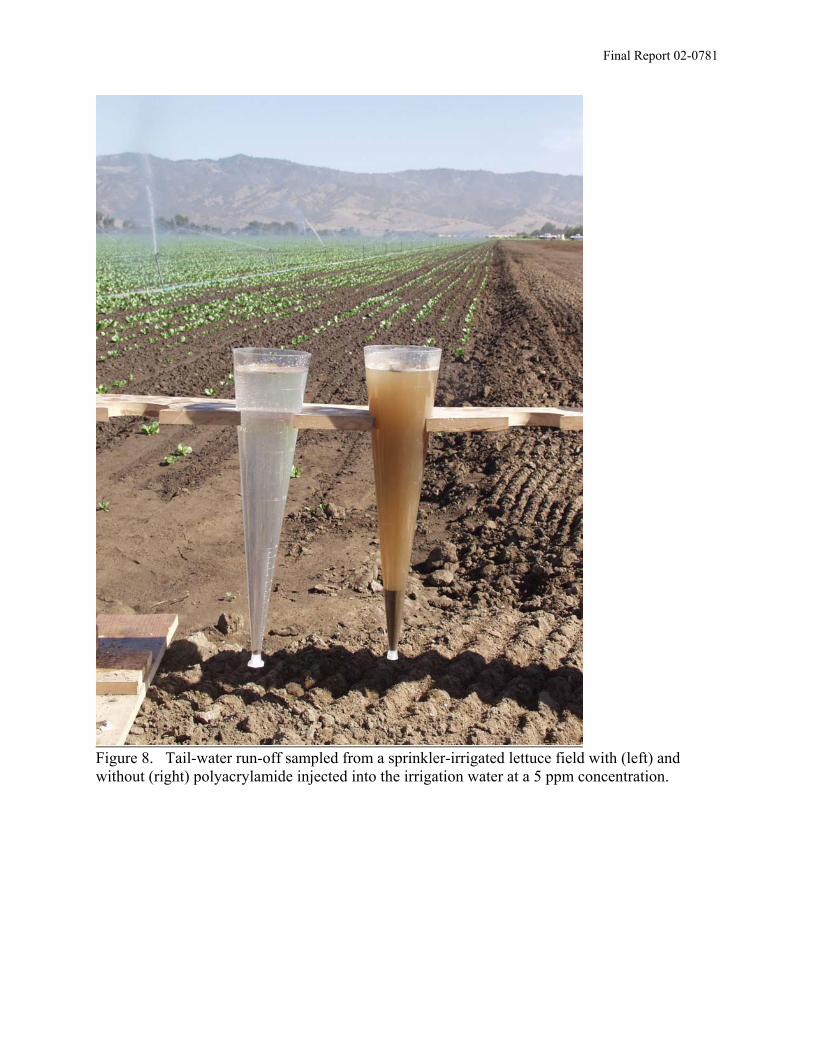
Figure 8. Tail-water run-off sampled from a sprinkler-irrigated lettuce field with (left) and without (right) polyacrylamide injected into the irrigation water at a 5 ppm concentration.
Final Report 02-0781
Appendix 1. Monterey County Crop Notes Newsletter Article. Evaluation of Polyacrylamide (PAM) for Reducing Sediment and Nutrient Concentration in Tail Water from Central Coast Vegetable Fields Michael Cahn, Husein Ajwa, Richard Smith, and Arnett Young Introduction Current state and federal water quality regulations, such as the conditional waiver for agricultural discharge and proposed total maximum daily loads (TMDL) for nutrients and sediments, will require that growers implement best management practices that minimize impairments to surface and ground water quality. While most growers are currently using recommended practices such as drip irrigation, cover crops, and integrated pest management to reduce the impacts of agriculture on water quality, additional management tools could help growers achieve more dramatic improvements to water quality. Growers who produce vegetables and row crops on highly erodible soils, such as the east side of the Salinas valley or sloped fields in the Elkhorn watershed, have a difficult challenge in reducing sediment and nutrient levels in run-off. Though many growers are using sediment basins and drip irrigation to minimize run-off and capture sediments, these practices are costly and may not fully achieve water quality targets. Our initial trials evaluating polyacrylamide (PAM), a chemical polymer, for use in sprinkler and furrow systems, demonstrated significant reductions in sediment and nutrient concentration in irrigation run-off. A brief primer on PAM Polyacrylamide (PAM) is a polymer used to stabilize soil and prevent erosion. Various forms of PAM exist, but the type used for erosion control is a large, negatively charged molecule (12-15 megagrams per mole) that is water soluble. PAM is commercially available in dry granular, emulsified liquid, and dry tablet forms, and costs as low as $2 to $4 per pound depending on the formulation, supplier, and cost of the raw materials used for manufacturing PAM (ie. natural gas). Non agricultural uses of PAM include waste and potable water treatment, processing and washing of fruits and vegetables, clarification of juices, manufacturing of cosmetics, and paper production. Use of PAM for irrigation and erosion control Beginning in the early 1990’s numerous studies demonstrated that low application rates of PAM (1 to 2 lb/acre) reduced run-off and improved water quality in furrow systems by stabilizing the aggregate structure of soil, by improving infiltration, and by flocculating out suspended sediments from irrigation tail-water. Most of the research and demonstrations of PAM for irrigation were conducted in Idaho and Washington states where soils are very erodible. By 1999, almost 1 million acres of land were annually treated with PAM in the northwest of the United States. Additionally, growers in the San Joaquin Valley and the Bakersfield areas of California have been using PAM to reduce soil erosion during irrigation events.
Final Report 02-0781
Application methods Most applications of PAM have been conducted in furrow systems by adding dry or liquid product to water flowing in the head ditch or the main line (if gated pipe is used) at a rate to achieve a 2.5 to 10 ppm concentration in the furrow water. The application can be made continuously during the irrigation or until the water advances almost to the end of the furrows. An alternate application method, called the “patch method” involves applying granular PAM to the first 3 to 5 feet of the head of each furrow. The granular PAM slowly dissolves during the irrigation, releasing product into the water. Applications of PAM into sprinkler systems require equipment for injecting concentrated liquid PAM into a pressurized main line at flow rates between 0.25 to 2 gallons per minute to treat a 30 to 100-acre field irrigated with solid-set impact sprinklers. Human and environmental safety PAM has a very low toxicity to mammals and is safe to handle, but precautions should be taken to minimize skin and eye exposure, and to avoid breathing dust from dry material. PAM can cause skin irritation in sensitive individuals. PAM becomes very slippery when wet so spills should be cleaned with a dry absorbent before attempting to wash it. PAM is sometimes confused with acrylamide monomer, a precursor in the manufacturing of PAM. Acrylamide monomer, a potential neurotoxin, has a high, acute toxicity in mammals. The Federal EPA requires that PAM sold for agricultural uses contain less than 0.05% acrylamide monomer. In soil, PAM degrades by physical, chemical, biological, and photochemical processes, but it does not decompose into the acrylamide monomer. Environmental studies of PAM have not shown any negative effects to the aquatic organisms. Anionic (negatively charged) PAM has a very low toxicity to fish, daphnia and algae. A previous study of the movement of PAM from agricultural fields showed that less than 3% of the applied product remained in the run-off leaving the field. The remaining PAM in the tail water was almost completely removed through adsorption to suspended sediments as the water flowed a distance of 300 to 1000 ft in the tail water ditch. Evaluation of PAM in Central Coast vegetable fields Although research in other parts of the United States has demonstrated that PAM can reduce soil erosion during irrigations, few if any evaluations of this practice have been conducted in vegetable and row crop fields on the Central Coast. Considering the important need to identify effective conservation practices that can improve farm water quality, we conducted a series of field trials to evaluate the effect of PAM2 on infiltration, run-off, and the concentration of sediment and nutrients in tail-water from furrow and sprinkler systems. Furrow systems PAM has been most successfully used to improve furrow irrigation. We evaluated the effect of PAM on infiltration and the concentration of sediments and nutrients in tail water from furrows of 6 commercial vegetable fields in the Salinas Valley using a recirculating infiltrometer. Water, 2 Amber1200D, formerly Superfloc A-836, Amber Chem. Inc
Final Report 02-0781
treated with 10 ppm of PAM was first added to a 20 ft-length of furrow. The water reaching the end of the furrow was recirculated to the head using a bilge pump. Untreated water was added from a tank to the head of the furrow to maintain a constant depth of water. Infiltration was estimated by measuring the rate that the tank emptied. Our results demonstrated that the pretreatment with PAM in the furrow water was sufficient to reduce the suspended sediments and nutrients in the tail water, but the PAM treatment did not have a consistent effect on infiltration. PAM significantly increased infiltration in a silt loam soil and significantly reduced infiltration in clay loam and sandy loam soils (Table 1). The PAM treatment reduced suspended sediments and turbidity in the run-off from all soil types. On average, the PAM treatment reduced suspended sediments by 86% (Table 2). Additionally, the PAM treatment reduced total nitrogen, soluble P, and total P in the tail water run-off (Tables 3 and 4) which corresponded to a 80% reduction in total P, 42% reduction in soluble P, and a 65% reduction in total N for all soil types tested. The concentration of total phosphorus in the tail water decreased as the concentration of suspended sediments in the tail water was reduced (Figure 1). The PAM treatment significantly reduced nitrate concentration in the furrow tail water of only one of the soil types tested. Sprinkler systems For PAM to be a useful conservation practice on the Central Coast, it needs to be effective with sprinkler irrigation. However, much less information has been published about the use of PAM in sprinklers than in furrow systems. We conducted several field trials evaluating the effect of PAM on run-off from solid-set sprinklers in commercial vegetable fields. A concentrated solution of PAM was injected into the main line of the sprinkler system at a rate to achieve a 5 ppm concentration in the irrigation water. The applications were done during the irrigations between germination and thinning. Each PAM application was made during the first 30 minutes of the irrigation and again when significant ponding occurred in the furrows and continued until the end of the irrigation set. Application rates of PAM varied from 0.5 to 0.75 lb/acre per irrigation. The results from these trials demonstrated that PAM significantly reduced sediment and turbidity in run-off from sprinklers. Results of 3 irrigations from a sprinkler trial conducted near Chualar are shown in Table 5. The application of PAM reduced sediment and turbidity levels in the run-off for all irrigations, which corresponded to a 95% reduction in sediment loss. Additionally, PAM significantly reduced run-off during the 3rd irrigation. The effects of PAM on phosphorus and nitrogen concentration in sprinkler run-off were more variable than in the furrow trials. Total nitrogen and phosphorus concentration was significantly lower in tail water from the PAM treatment than the untreated control. However, at another field site, the PAM treatment did not significantly reduce nitrogen and phosphorus in tail water from the sprinklers, but it did significantly reduce sediment concentration (data not shown). Lettuce yield The application of PAM may potentially improve lettuce yields by increasing water penetration and by reducing soil crusting. We found that the application of PAM did not affect box yield of romaine and head lettuce at the 4 field trials where we were able to conduct yield measurements (Table 6). The PAM treatment significantly increased box weight of romaine heads at one of the
Final Report 02-0781
field trials. Since PAM was not applied in more than 3 irrigations for any one trial, we cannot conclude if more applications of PAM would affect yield. Conclusions Our preliminary trials demonstrated that applying polyacrylamide at low rates through sprinkler and furrow systems can dramatically reduce sediment levels in irrigation run-off and potentially reduce total phosphorus and nitrogen concentrations. The effect of PAM on infiltration and run-off was dependent on soil type, but on most of the Central Coast soils that we tested the low rates of PAM had no significant effect on infiltration. Although our initial results are encouraging, further trials will be needed to determine if PAM can consistently reduce nutrient concentration in run-off from sprinklers, and to determine the optimal dose and application strategy for improving water quality. Acknowledgements We greatly appreciated the grower cooperation from American Farms, Christensen and Giannini, Costa Farms, D’Arrigo Bro., Huntington Farms, John Gill Ranch, and Rio Farms, and financial support from the CDFA Fertilizer Research and Education Program.
Final Report 02-0781
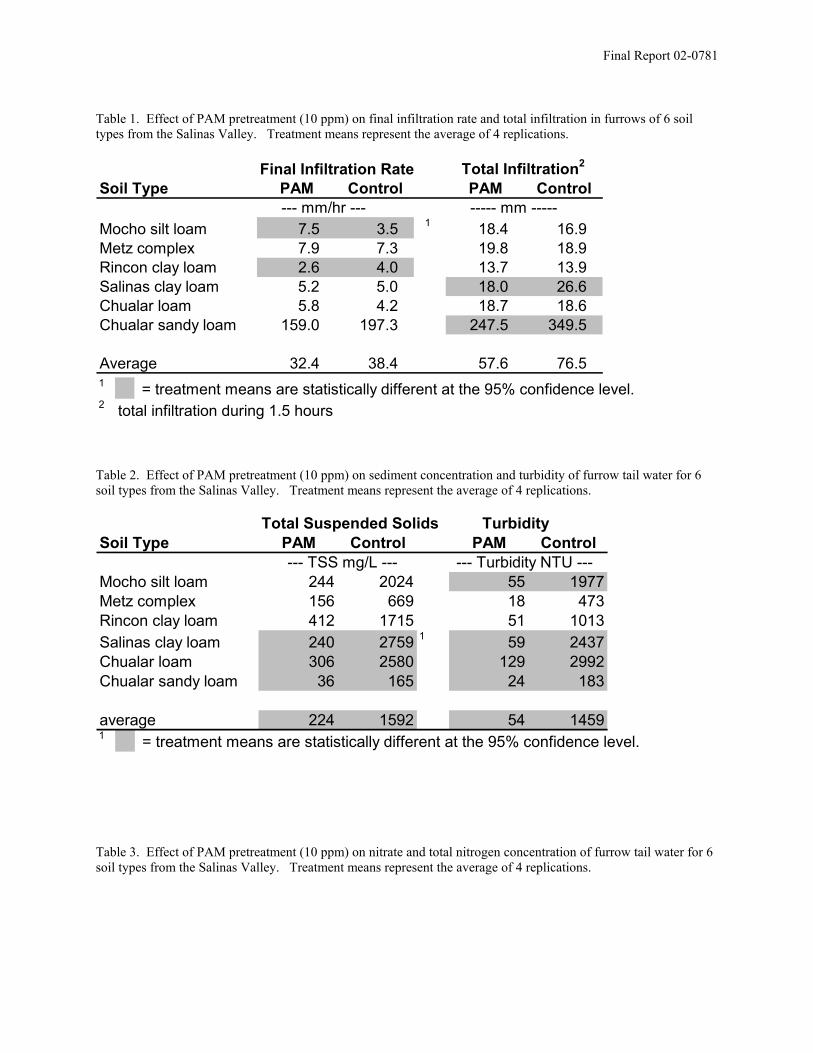
Table 1. Effect of PAM pretreatment (10 ppm) on final infiltration rate and total infiltration in furrows of 6 soil types from the Salinas Valley. Treatment means represent the average of 4 replications.
Final Infiltration Rate Total Infiltration2
Soil Type PAM Control PAM Control --- mm/hr --- ----- mm -----
Mocho silt loam 7.5 3.5 1 18.4 16.9Metz complex 7.9 7.3 19.8 18.9Rincon clay loam 2.6 4.0 13.7 13.9Salinas clay loam 5.2 5.0 18.0 26.6Chualar loam 5.8 4.2 18.7 18.6Chualar sandy loam 159.0 197.3 247.5 349.5
Average 32.4 38.4 57.6 76.51 = treatment means are statistically different at the 95% confidence level.2 total infiltration during 1.5 hours Table 2. Effect of PAM pretreatment (10 ppm) on sediment concentration and turbidity of furrow tail water for 6 soil types from the Salinas Valley. Treatment means represent the average of 4 replications.
Total Suspended Solids TurbiditySoil Type PAM Control PAM Control
--- TSS mg/L --- --- Turbidity NTU ---Mocho silt loam 244 2024 55 1977Metz complex 156 669 18 473Rincon clay loam 412 1715 51 1013Salinas clay loam 240 2759 1 59 2437Chualar loam 306 2580 129 2992Chualar sandy loam 36 165 24 183
average 224 1592 54 14591 = treatment means are statistically different at the 95% confidence level. Table 3. Effect of PAM pretreatment (10 ppm) on nitrate and total nitrogen concentration of furrow tail water for 6 soil types from the Salinas Valley. Treatment means represent the average of 4 replications.
Final Report 02-0781
Nitrate-Nitrogen Total Nitrogen2
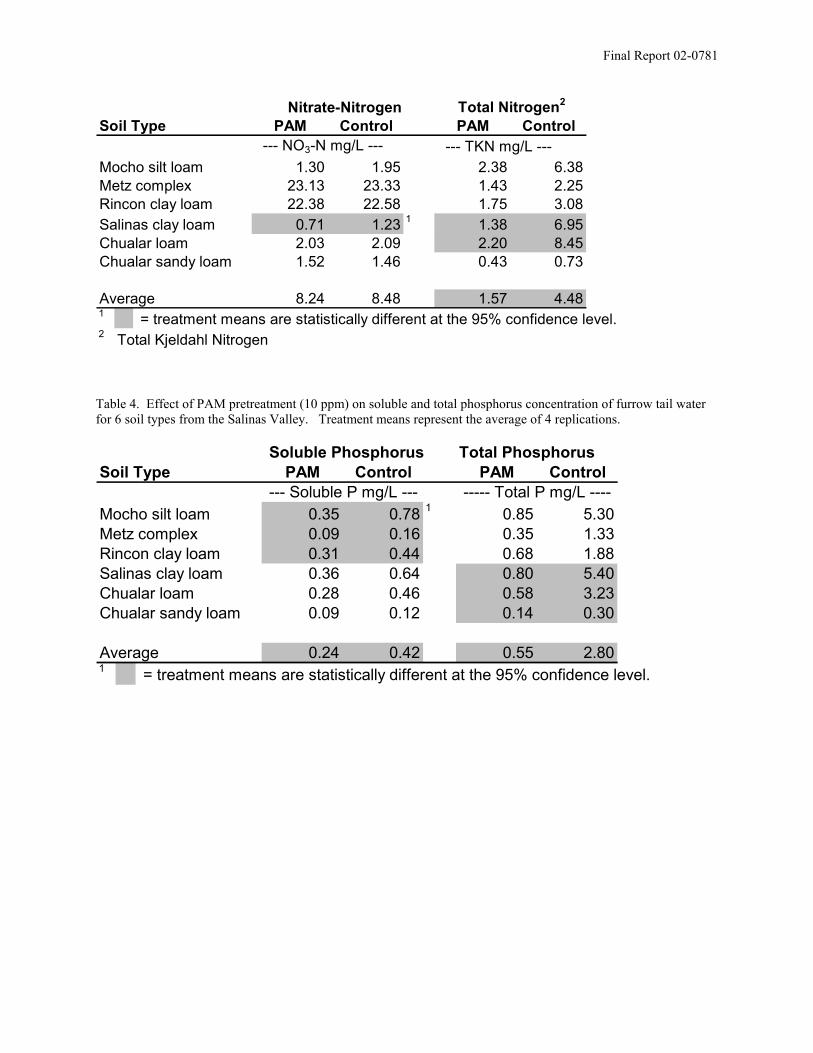
Soil Type PAM Control PAM Control --- NO3-N mg/L --- --- TKN mg/L ---
Mocho silt loam 1.30 1.95 2.38 6.38Metz complex 23.13 23.33 1.43 2.25Rincon clay loam 22.38 22.58 1.75 3.08Salinas clay loam 0.71 1.23 1 1.38 6.95Chualar loam 2.03 2.09 2.20 8.45Chualar sandy loam 1.52 1.46 0.43 0.73
Average 8.24 8.48 1.57 4.481 = treatment means are statistically different at the 95% confidence level.2 Total Kjeldahl Nitrogen Table 4. Effect of PAM pretreatment (10 ppm) on soluble and total phosphorus concentration of furrow tail water for 6 soil types from the Salinas Valley. Treatment means represent the average of 4 replications.
Soluble Phosphorus Total PhosphorusSoil Type PAM Control PAM Control
--- Soluble P mg/L --- ----- Total P mg/L ----Mocho silt loam 0.35 0.78 1 0.85 5.30Metz complex 0.09 0.16 0.35 1.33Rincon clay loam 0.31 0.44 0.68 1.88Salinas clay loam 0.36 0.64 0.80 5.40Chualar loam 0.28 0.46 0.58 3.23Chualar sandy loam 0.09 0.12 0.14 0.30
Average 0.24 0.42 0.55 2.801 = treatment means are statistically different at the 95% confidence level.
Final Report 02-0781
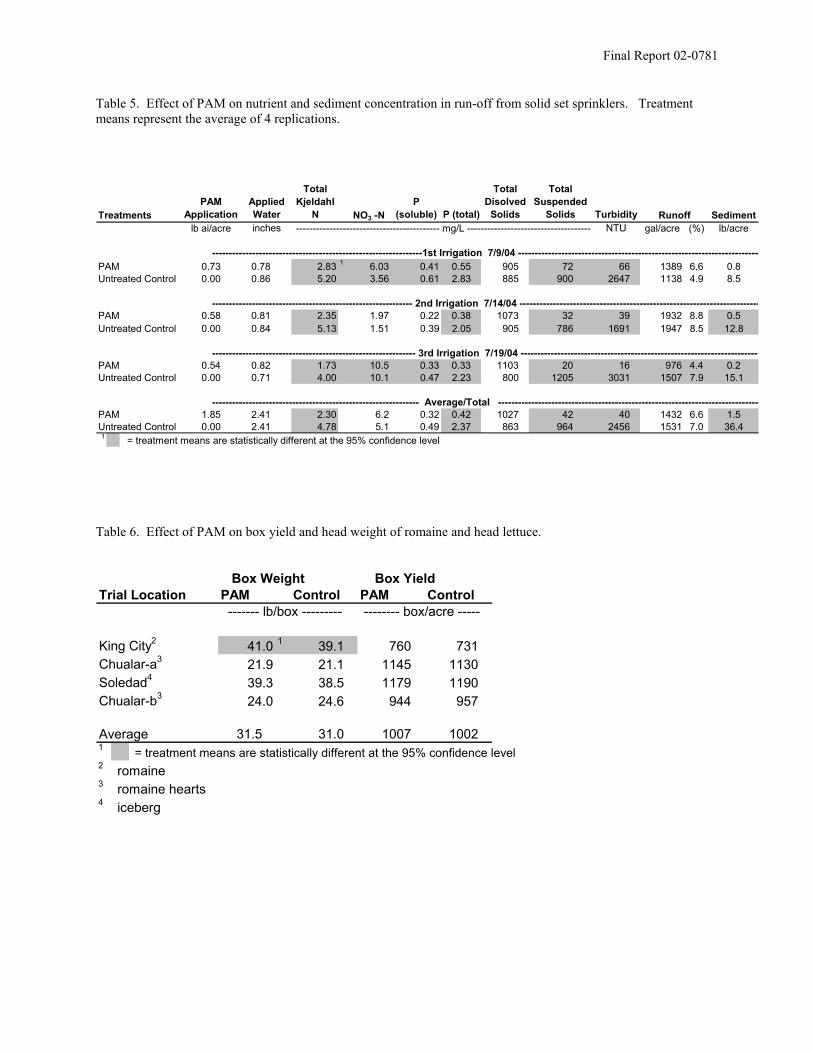
Table 5. Effect of PAM on nutrient and sediment concentration in run-off from solid set sprinklers. Treatment means represent the average of 4 replications.
TreatmentsPAM
ApplicationApplied Water
Total Kjeldahl
N NO3 -NP
(soluble) P (total)
Total Disolved
Solids
Total Suspended
Solids Turbidity Sedimentlb ai/acre inches ------------------------------------------- mg/L -------------------------------------- NTU gal/acre (%) lb/acre
---------------------------------------------------------------1st Irrigation 7/9/04 -------------------------------------------------------------------------PAM 0.73 0.78 2.83 1 6.03 0.41 0.55 905 72 66 1389 6.6 0.8Untreated Control 0.00 0.86 5.20 3.56 0.61 2.83 885 900 2647 1138 4.9 8.5
------------------------------------------------------------ 2nd Irrigation 7/14/04 ------------------------------------------------------------------------PAM 0.58 0.81 2.35 1.97 0.22 0.38 1073 32 39 1932 8.8 0.5Untreated Control 0.00 0.84 5.13 1.51 0.39 2.05 905 786 1691 1947 8.5 12.8
------------------------------------------------------------- 3rd Irrigation 7/19/04 ------------------------------------------------------------------------PAM 0.54 0.82 1.73 10.5 0.33 0.33 1103 20 16 976 4.4 0.2Untreated Control 0.00 0.71 4.00 10.1 0.47 2.23 800 1205 3031 1507 7.9 15.1
-------------------------------------------------------------- Average/Total ------------------------------------------------------------------------------PAM 1.85 2.41 2.30 6.2 0.32 0.42 1027 42 40 1432 6.6 1.5Untreated Control 0.00 2.41 4.78 5.1 0.49 2.37 863 964 2456 1531 7.0 36.41 = treatment means are statistically different at the 95% confidence level
Runoff
Table 6. Effect of PAM on box yield and head weight of romaine and head lettuce.
Box Weight Box Yield Trial Location PAM Control PAM Control
------- lb/box --------- -------- box/acre -----
King City2 41.0 1 39.1 760 731Chualar-a3 21.9 21.1 1145 1130Soledad4 39.3 38.5 1179 1190Chualar-b3 24.0 24.6 944 957
Average 31.5 31.0 1007 10021 = treatment means are statistically different at the 95% confidence level2 romaine 3 romaine hearts4 iceberg
Final Report 02-0781
Total Suspended Solids (mg/L)0 1000 2000 3000 4000
Tota
l P (m
g/L)
0
2
4
6
8
10
Mocho silt loamMetz complexRincon clay loam Salinas clay loamChualar loamChualar sandy loamRegression Line
R2=0.77Untreated Control
Total Suspended Solids (mg/L)0 1000 2000 3000 4000
Tota
l P (m
g/L)
0
2
4
6
8
10
PAM treatment (10 ppm)
R2=0.57
Figure 1. Relationship between suspended sediments and total phosphorus in furrow tail water, treated and untreated with PAM, for 6 soils in the Salinas Valley.