evaluation of post-earthquake axial load capacity...
TRANSCRIPT

23ACI Structural Journal/January-February 2015
ACI STRUCTURAL JOURNAL TECHNICAL PAPER
Objective evaluation of the capacity of a bridge to carry self-weight and traffic loads after an earthquake is essential for a safe and timely reopening of the bridge. The ability of a bridge to function depends directly on the remaining capacity of the bridge columns to carry gravity and lateral loads. An experimental study on models of modern circular reinforced concrete bridge columns was performed to investigate the relationship between earthquake-induced damage in bridge columns and the capacity of the columns to carry axial load in a damaged condition. The earthquake-like damage was induced in the column specimens in bidirectional, quasi-static, lateral load tests. The damaged column specimens were then recentered to eliminate the residual drifts and tested in compression to failure to evaluate their remaining axial load strength. It was found that well-confined modern bridge columns lose approximately 20% of their axial load capacity after sustaining displacement ductility demands of 4.5.
Keywords: axial tests; earthquake; post-earthquake lateral stiffness; quasi-static tests; reinforced concrete.
INTRODUCTIONModern highway bridges in California designed using
the Caltrans Seismic Design Criteria1 (SDC) are expected not to collapse during both frequent and rare earthquake events. Currently, design provisions aimed at preventing structural collapse are supported by numerous experimental data points and calibrated computer models.2,3 However, there is no evidence that the bridge systems were tested for the remaining traffic load capacity after some damage was induced under lateral loading. Still, attempts were made toward analytical evaluation of the ability of a highway overpass bridge4 or bridge columns5 to carry traffic load after an earthquake. Due to the lack of the validated quan-titative guidelines for estimating the remaining traffic load-carrying capacity of bridges after an earthquake, bridge inspectors and maintenance engineers provide an estimate of the capacity of the bridge to function based on qualita-tive observations, with each judgment founded on personal experience. Such subjective evaluation can be significantly improved if a model to provide a quantitative estimate of the remaining load-carrying capacity of bridge columns after an earthquake was developed and calibrated.
A combined experimental and analytical research program was performed to investigate the relationship between earthquake-induced damage in reinforced concrete bridge columns and the capacity of the columns in such damaged condition.6 This program comprised one axial load test, three quasi-static cyclic tests, and two hybrid model earthquake response simulations on scaled models of typical circular
bridge columns used in modern bridges in California. In this paper, the outcomes of the quasi-static cyclic part of the experimental program are presented. In the first stage of the quasi-static testing procedure, three column specimens were tested by applying a bidirectional quasi-static incre-mental lateral displacement protocol with circular orbits of displacement up to the predetermined displacement ductility targets of 1.5, 3, and 4.5. In the second stage of the testing procedure, an undamaged column specimen and the three damaged specimens with no permanent drifts were subjected to a monotonically increasing axial force up to failure. The specimens are listed in Table 1. These results support eval-uations of post-earthquake traffic load capacities of bridges with well-confined reinforced concrete columns.
RESEARCH SIGNIFICANCEReliable evaluation of the capacity of a bridge to carry
self-weight and traffic loads is essential for a safe and timely re-opening of the bridge after an earthquake. Columns of modern California bridges are designed to develop signif-icant flexural deformation ductility without shear failure and prevent bridge collapse. An experimental and analytical evaluation of earthquake-damaged modern bridge columns is used to quantify their axial load capacity and to develop reliable models for objective evaluation of the ability of a modern bridge to perform as intended after an earthquake: continue to safely carry traffic load.
EXPERIMENTAL INVESTIGATIONKetchum et al.7 developed a series of highway overpass
bridges designed in accordance with the Caltrans SDC1 in a recent PEER Center study. Bridge Type 11 (shown in Fig. 1)—typical for tall overpass bridges—was chosen as a prototype for this experimental study. The bridge is a five-
Title No. 112-S03
Evaluation of Post-Earthquake Axial Load Capacity of Circular Bridge Columnsby Vesna Terzic and Bozidar Stojadinovic
ACI Structural Journal, V. 112, No. 1, January-February 2015.MS No. S-2013-075.R1, doi: 10.14359/51687296, received March 5, 2014, and
reviewed under Institute publication policies. Copyright © 2015, American Concrete Institute. All rights reserved, including the making of copies unless permission is obtained from the copyright proprietors. Pertinent discussion including author’s closure, if any, will be published ten months from this journal’s date if the discussion is received within four months of the paper’s print publication.
Table 1—Test matrix
Specimen designation Ductility target Test sequences
Base0 0 Axial
Base15 1.5 Lateral and axial
Base30 3.0 Lateral and axial
Base45 4.5 Lateral and axial

24 ACI Structural Journal/January-February 2015
span single-column-bent overpass with 120 ft (36.58 m) edge spans, 150 ft (45.72 m) inner spans, a 39 ft (11.89 m) wide deck, and 50 ft (15.24 m) tall circular columns. The two principal parameters that affect the remaining axial capacity of bridge columns are the column aspect ratio H/D and the column shear strength (or transverse reinforcement ratio ρt).8 Different possible values of these two parameters, bounded by the provisions of the Caltrans SDC,1 were investigated.6 Values of H/D = 8 and ρt = 0.75% were selected for the columns of the prototype bridge. The columns are modeled with specimens referred to herein as the Base specimens. The Base specimens are cantilever columns representing the bottom half of the prototype bridge columns. The specimens were tested in a single-curvature-bending-using loading pattern that will induce displacement ductilities observed in columns of the prototype bridge for the two bridge direc-tions: transverse and longitudinal.
Specimen geometry, reinforcement, and materialsThe geometry and the reinforcement of a Base specimen
are detailed in Fig. 2. The specimen has a 73.75 in. (1.875 m) tall, 16 in. (0.4 m) diameter circular column, and a square (84 x 84 in. [2.13 x 2.13 m]), 24 in. (0.61 m) high foun-dation block. The effective height of the specimen column, from its base to the level where lateral load is applied, is 64 in. (1.625 m), giving it an aspect ratio of L/D = 4. The 9.75 in. (0.25 m) extension accommodates the installation of the 0.5 in. (13 mm) thick, 16 in. (0.4 m) tall steel jacket to attach the actuators.
The column has 12 longitudinal Grade 60 (nominal yield stress in tension is 60 ksi [420 MPa]) No. 4 [Ø13] reinforcing bars placed around its perimeter. The trans-verse steel reinforcement is a high-strength A82 (nominal yield stress in tension is 80 ksi [550 MPa]) W3.5 (0.211 in.
[5.4 mm]) continuous spiral with a center-to-center spacing of 1.25 in. [31.75 mm]. The concrete cover is 0.5 in. (13 mm). The specified unconfined compressive strength of the concrete was 5 ksi (34.5 MPa). Table 2 shows the spec-ified and the actual strengths of the longitudinal steel, the spiral steel, and the concrete.
Loading protocolThe loading pattern for the Base specimens was selected
to represent, as closely as possible, the motion experi-enced by a column of the prototype overpass bridge in an earthquake. The motion of the bridge column excited by different three-component ground motions is examined using a finite element model of the prototype bridge made in OpenSees.9 Two ground motion suites with 20 records per suite, representing near-field and far-field ground motions, were used. The displacement orbits of the tops of the proto-type bridge columns were traced during the nonlinear time history response analyses for the 40 selected ground motions. Because of the different bridge column boundary conditions for bending in the longitudinal (fixed-fixed) and transverse (fixed-free) directions of the bridge, appropri-ately scaled displacement histories applied to the cantilever bridge column model would not reproduce the deformation state of the prototype. To achieve the close correspondence of deformation states between the model and the prototype, the displacement history of the prototype bridge column had to be normalized by its yield displacements, different in different bridge directions. Therefore, the displacement orbits applied on the model were expressed in terms of displace-ment ductility. Although the displacements of the tops of the bridge columns were larger in the transverse direction than in the longitudinal bridge direction, the ductility orbits were proportional in the two bridge directions for most of the
Fig. 1—Prototype Caltrans bridge.7

25ACI Structural Journal/January-February 2015
ground motions. Normalization of the displacement orbits for one ground motion is shown in Fig. 3.
A circular loading pattern was selected for this experi-mental program because this loading pattern imposes larger sustained displacement ductility demand than was observed in any of the considered ground motions.6 Given that the goal of the experimental study is to establish the remaining
load-carrying capacity of damaged bridge columns, imposing the demand with a circular loading pattern is conservative. The selected circular loading pattern is defined by two cycles at each displacement level. In the first cycle, starting from the initial position O, the specimen control point (the center of the column cross section at the level of the actuators) is displaced toward position A, followed by motion that traces a full circle clockwise until point B (black line in Fig. 4). The specimen control point is then moved back to the initial position O to finish the first cycle. The second cycle is a counterclockwise path O-C-D-O (gray line in Fig. 4).
The maximum displacement ductility demand imposed on a column specimen in this study was set at 4.5. It is selected to be slightly larger than Caltrans SDC1 design target displacement ductility of 4 and is on the conservative side. Caltrans SDC1 design is based on experimental evidence that well-confined reinforced concrete circular column can sustain a displacement ductility demand of 4 without devel-oping significant flexural or shear damage.10-12 Two additional displacement ductility demand targets of 3.0 and 1.5 were selected to uniformly sample the demand space and evaluate the remaining axial capacity of less-damaged specimens.
Fig. 2—Geometry and reinforcement of Base specimens.
Table 2—Bridge column specimen material properties
Material
Specified1, ksi (MPa) Actual, ksi (MPa)
Yield Ultimate Maximum stress Yield Ultimate Test Maximum stress
Steel, longitudinal 60 (420) 80 (550) — 70.7 (487) 120 (830) — —
Steel, spiral 80 (550) — — 95 (655) 106 (730) — —
Concrete — 5.0 (34.5) — —
Base15-L 5.05 (34.82)
Base30-L 4.96 (34.2)
Base45-L 5.09 (35.09)
Base0 5.48 (37.8)
Fig. 3—Displacement orbits at top of bridge column: (a) absolute displacements; and (b) normalized displacements.

26 ACI Structural Journal/January-February 2015
The magnitudes of displacement demand increments for the quasi-static tests were defined following the recom-mendations in ACI 374.1-0513 and SAC/BD-00/1014 for a major far-field earthquake event. For the Base45 spec-imen, the increments in the magnitude of the displacement ductility were: 0.08, 0.2, 0.4, 1.0, 1.5, 2.0, 3.0, and 4.5. The pre-yield displacement levels include: a displacement level prior to cracking; two levels between cracking and yielding; and a level approximately corresponding to the first yield of the longitudinal reinforcement. After the yield level, the displacement ductility magnitude of each subsequent primary cycle is 1.25 to 1.5 times larger than its predecessor to provide data of the damage accumulation. The selected two-cycle displacement pattern provides data on specimen strength degradation due to sustained displacement demand. After yielding, each primary displacement ductility demand level was followed by a small displacement level equal to one-third of the previous primary displacement level to eval-uate specimen stiffness degradation. The displacement histo-ries for the Base15 and Base30 specimens were obtained by scaling the displacement history for the Base45 specimen by 0.3 and 0.6, respectively. This way, the number of primary cycles in the loading history was the same for all tests to maintain similitude with respect to the duration and number of excursions imposed by real ground motions. Displace-ment ductility levels of primary cycles for the three lateral displacement tests are given in Table 3. After completing the cycles at the target displacement ductility level, the speci-mens are cycled through a series of small deformation cycles decreasing in magnitude to zero to eliminate residual lateral forces and deformations and recenter the specimens. This was necessary for the subsequent axial load capacity tests on damaged specimens.
The lateral deformation tests were conducted with the column specimen under a constant axial load equal to 10% of the column nominal axial load capacity. This axial load magnitude is consistent with typical bridge column gravity load magnitudes, and slightly larger than the gravity load magnitude in the columns of the prototype bridge.
Test setupIn the first phase of the test, lateral and axial loads were
applied at the top of the column. The lateral displace-ment pattern was applied using the two servo-controlled hydraulic actuators, as shown in Fig. 5. An axial load of 100 kip (445 kN), equal to 10% of the column’s nominal axial load capacity, was applied through a spreader beam using pressure jacks and post-tensioning rods placed on each side of the column (Fig. 5). Spherical hinges (three- dimensional swivels) were provided at both ends of the rods to avoid bending of the rods during circular motion of the column top in the horizontal plane. A hinge connection (two- dimensional hinge) was placed between the spreader beam and the column such that the spreader beam remained hori-zontal in the plane of the rods during lateral motion of the column to avoid buckling of the rods. Geometry of the axial load application apparatus was monitored throughout the test in order to subtract the horizontal components of the force in the post-tensioned rods from the forces applied by the actua-tors and compute the actual lateral resistance of the column.
In the second phase of the test, the three laterally damaged column specimens and one undamaged column specimen were compressed axially to induce axial failure in the columns. A compression-tension axial load machine with a capacity of 1814 tonnes (4 million lb) and a constant rate of loading was used to accomplish this (Fig. 6). Longitudinal reinforcement strain measurements were used to evaluate presence of bending moment in the specimens during the axial load test based on which the extent of geometric imper-fections was estimated.
ANALYTICAL INVESTIGATIONThe experimental results, the hysteretic curves from quasi-
static tests, and the axial force-deformation responses from the compression tests were numerically simulated using the force-based fiber beam-column element15 of OpenSees.9 The force-based beam-column element is a line element discretized using the Gauss-Lobatto integration scheme with the integration points at the ends of the element and along the element length. Fiber cross sections are assigned to the integration points. The cross sections of the element are represented as assemblages of longitudinally oriented, unidirectional steel and concrete fibers. Each material in the cross section has a uniaxial stress-strain relation assigned
Fig. 4—Bidirectional displacement pattern.
Table 3—Displacement ductility levels of primary cycles
Cycles Base15 Base30 Base45
Cycle 1 0.02 0.05 0.08
Cycle 2 0.06 0.10 0.20
Cycle 3 0.12 0.25 0.40
Cycle 4 0.30 0.60 1.00
Cycle 5 0.45 1.00 1.50
Cycle 6 0.60 1.25 2.00
Cycle 7 1.00 1.80 3.00
Cycle 8 1.50 3.00 4.50

27ACI Structural Journal/January-February 2015
to it. The deformation compatibility of the cross-section fibers is enforced assuming that plane sections remain plane after deformation.
In a flexibility-based formulation of this element, nodal loads imposed on the element ends are used to calculate axial force and moment distribution along the length of the element. Given the moment and axial load values at each integration point, the curvature and the axial deformation of a section are subsequently computed. Because the response of the cross-section fiber materials may be nonlinear, defor-mation state determination of the cross section may be iter-ative. The deformation of the element is finally obtained through weighted integration of the section deformations along the length of the member.
A non-shear-critical column with hardening section behavior was modeled using five integration points16 along its length. The cross sections of the beam-column element had 132 fibers (24 for unconfined cover, 96 for confined core, and 12 for reinforcing steel) distributed nonuni-formly16 and arranged as shown in Fig. 7. To model the rein-forced concrete section, the fiber section that accounts for the axial-bending interaction was divided into three parts: concrete cover; concrete core; and reinforcing steel. Fibers of the concrete cover (unconfined concrete) and concrete core (confined concrete) were modeled using the OpenSees
Concrete01 uniaxial material that uses the Kent-Scott-Park model17 to represent the stress-strain relationship of concrete in compression. Reinforcing steel fibers (longitudinal bars) were modeled using the OpenSees Steel02 uniaxial mate-
Fig. 5—Lateral test setup: (a) plain view; (b) elevation (A-A); and (c) photo of test setup.
Fig. 6—Axial test setup.

28 ACI Structural Journal/January-February 2015
rial that uses the Giuffre-Manegotto-Pinto uniaxial strain- hardening material model.18 Transverse reinforcement was not modeled directly but its effect was accounted for through uniaxial stress-strain relationship of the confined concrete core19 assigned to core fibers.
The parameters of the Steel02 and Concrete01 uniaxial materials are given in Tables 4 and 5, respectively. The initial moduli of elasticity used to model plain Ec and confined concrete Ecc were calibrated from the concrete cylinder compression tests performed on the on the day of the tests (for example, Fig. 8). To define the confined concrete model, the maximum compressive strength fcc′ was calculated using Mander’s equations,19 the strain at the maximum compres-sive strength ε0 was calculated from the initial modulus of elasticity for the Concrete01 material (Ecc = 2fcc′/ε0), the concrete crushing strength fcu was set to 0.2fcc′1, and the strain at crushing strength of concrete εcu was calculated using Eq. (1) and is a function of the post-peak degrading slope of concrete (kEcc). Equation (1) can only be used in conjunction with Concrete01 material, as it is derived for the strain at the maximum compressive strength ε0 of 2fcc′/Ecc
εcucc cu
cc
f k fkE
=′ + −( )1 2
(1)
The post-peak degrading slope of concrete fibers has a significant effect on the accuracy of prediction of the remaining axial load strength of columns with the earth-quake type of damage. If, during a lateral load test simu-lation, a concrete fiber strain exceeds the strain at the maximum compressive strength (ε0), the peak strength that fiber can attain during the axial loading simulation phase is the strength that corresponds to the maximum strain reached during the lateral load test. This strength is smaller than the peak strength and depends on the post-peak degrading slope of the concrete fiber stress-strain model. Furthermore, the post-peak behavior is different for different fibers of the damaged section. While the post-peak degrading slope for the fibers of the concrete cover can be calibrated from the concrete cylinder compression tests (Fig. 8), the post-peak degrading slope for the fibers of the concrete core can be calibrated from the axial compression tests of the laterally damaged column specimens. For the tested column speci-mens and concrete modeled with the Concrete01 OpenSees material, the post-peak degrading slope kEcc of 0.014Ecc was found to provide the best predictions of the axial load capac-ities (Fig. 9).
The specimen models were cantilevers with displace-ments restrained to zero at the bottom node. The two hori-
Fig. 7—Nonuniform arrangement of fibers in column section.16
Table 4—Steel02 material model parameters
Material fy, ksi (MPa) Es, ksi (GPa) b R0 cR1 cR2
Reinforcingsteel 70.7 (490)* 29,000 (200) 0.025 15 0.925 0.15
*From coupon tests.
Table 5—Concrete01 material model parameters
Material fc′ ε0 fcu εcu
Concrete cover fc′* 2fc′/Ec† 0 0.0055
Concrete core fcc′‡ 2fcc′/Ecc† 0.2fcc′ εcu
§
*From test results on concrete cylinders (Table 2).†Ec, Ecc are initial moduli of elasticity (calibrated to match test results of concrete cylinders).‡Equation from Mander et al.19
§Equation (1).
Fig. 8—Calibration of the Concrete01 material using data from compression test of concrete cylinders.
Fig. 9—Accuracy in prediction of column axial strength as function of ratio of initial to post-peak degrading slope of confined concrete (k).
29ACI Structural Journal/January-February 2015
zontal displacements at the top of the specimens matched the displacements commanded during the test. The vertical force at the top of the element matched the vertical force applied and measured during the tests. The moments on the rotation and torsion degrees of freedom on the top node of the model were set to zero. The response of the specimen model was computed using nonlinear analysis, Newton-Raphson inte-gration algorithm, and geometric transformation to account for P-Δ effect.
RESULTS AND DISCUSSIONPhase 1: Lateral displacement tests
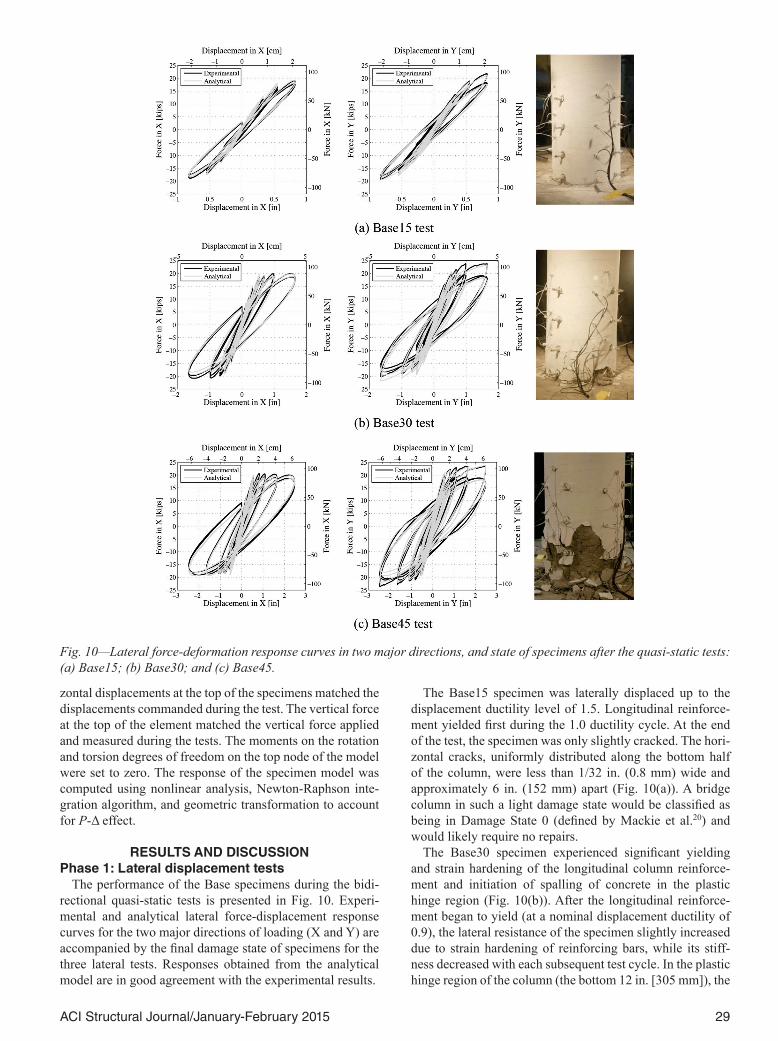
The performance of the Base specimens during the bidi-rectional quasi-static tests is presented in Fig. 10. Experi-mental and analytical lateral force-displacement response curves for the two major directions of loading (X and Y) are accompanied by the final damage state of specimens for the three lateral tests. Responses obtained from the analytical model are in good agreement with the experimental results.
The Base15 specimen was laterally displaced up to the displacement ductility level of 1.5. Longitudinal reinforce-ment yielded first during the 1.0 ductility cycle. At the end of the test, the specimen was only slightly cracked. The hori-zontal cracks, uniformly distributed along the bottom half of the column, were less than 1/32 in. (0.8 mm) wide and approximately 6 in. (152 mm) apart (Fig. 10(a)). A bridge column in such a light damage state would be classified as being in Damage State 0 (defined by Mackie et al.20) and would likely require no repairs.
The Base30 specimen experienced significant yielding and strain hardening of the longitudinal column reinforce-ment and initiation of spalling of concrete in the plastic hinge region (Fig. 10(b)). After the longitudinal reinforce-ment began to yield (at a nominal displacement ductility of 0.9), the lateral resistance of the specimen slightly increased due to strain hardening of reinforcing bars, while its stiff-ness decreased with each subsequent test cycle. In the plastic hinge region of the column (the bottom 12 in. [305 mm]), the
Fig. 10—Lateral force-deformation response curves in two major directions, and state of specimens after the quasi-static tests: (a) Base15; (b) Base30; and (c) Base45.

30 ACI Structural Journal/January-February 2015
distance between the cracks was 3 in. (76 mm) on average and the maximum width of the cracks during the test was approximately 1/16 in. (1.6 mm). Outside the plastic hinge region, the distance between the cracks was 6 in. (152 mm) on average with the widths of the cracks less than 1/32 in. (0.8 mm). Figure 10(b) shows horizontal cracks, vertical cracks, and some spalling of concrete at the bottom 8 in. (203 mm) of the column at the end of the test. Such a moderate damage state would put the column in Damage State 1 (defined by Mackie et al.20). The bridge columns with such earthquake damage are likely to require repairs such as epoxy injection into the plastic hinge cracks and cover patching.
The target displacement ductility demand imposed on spec-imen Base45 (4.5) slightly exceeds the Caltrans SDC design target (4.0). This specimen experienced extensive yielding of the reinforcing steel, spalling of the concrete cover, as well as a crushing and reduction in volume of the concrete core in the plastic hinge region. First yielding of a reinforcing bar occurred at a displacement corresponding to nominal displacement ductility of 0.75. The specimen response was highly nonlinear (Fig. 10(c)), with the expected gradual stiff-ness degradation and gradual strength increase. Based on the crack distribution along the height of the column during the test, the column was divided into three regions: 1) the plastic hinge region (the bottom 12 in. [305 mm] of column); 2) the intermediate region (12 in. [305 mm] of the column next to the plastic hinge region); and 3) the elastic region (the top 40 in. [1.02 m] of the column). In the plastic hinge region, the distance between the cracks was 3 in. (76 mm) on average, and the maximum width of the cracks during the test was approximately 1/8 in. (3.2 mm). Very exten-sive spalling of concrete and a reduction in volume of the concrete core were observed. In the intermediate region, the distance between the cracks was 4 in. (102 mm) on average, with the widths of the cracks less than 1/16 in. (1.6 mm). In the elastic region, the distance between the cracks was 6 in. (152 mm) on average, with the widths of the cracks less than 1/32 in. (0.8 mm). Such column damage would be classified into Damage State 2 (defined by Mackie et al.20), requiring significant repairs but not requiring replacement.
To analyze bridges for an aftershock, it is important to know effective stiffness keff of bridge columns after the main shock. This stiffness is computed using the response data measured during the small-displacement test cycles that followed the primary cycles. It represents the tangent slope at zero force of force-displacement curve for the small- displacement test cycles. The effective stiffness at yield keff,y of tested columns, representing the slope of force- displacement curve between origin and the point designating the first reinforcing bar yield, is used as a reference to measure stiffness degradation during the quasi-static tests. The ratio of column effective stiffness over column stiffness at yield keff/keff,y is given in Table 6 for each specimen. The effec-tive stiffness of the damaged column decreases such that, at displacement ductility level of 4.5, it is approximately half that of the effective stiffness of the same column at yield.
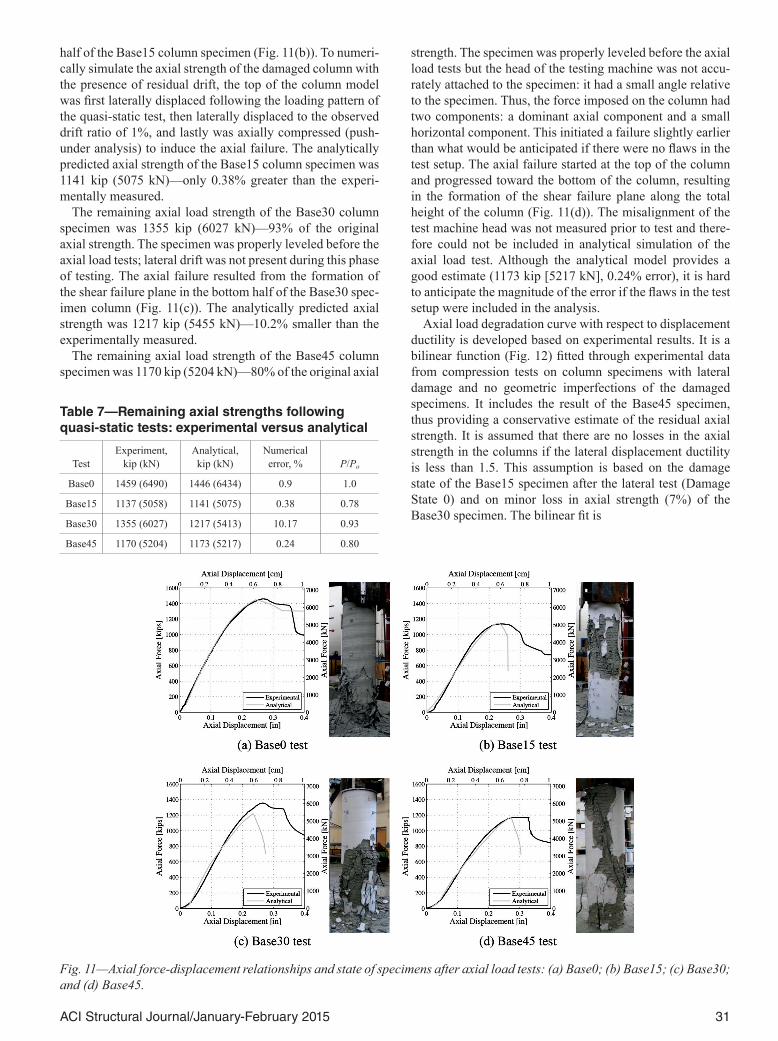
Phase 2: Axial load testsThe experimentally measured and numerically simulated
axial force-deformation curves for one undamaged and three damaged specimens are shown in Fig. 11. Because the tests are performed using a force-controlled compression machine, the axial force-displacement relationships are real-istic up to the peak force point. The experimental and analyt-ical axial load strengths, the remaining axial strength after damage was induced during the Phase 1 of lateral deforma-tion tests, and the errors in predicting the axial strengths are summarized in Table 7.
Testing of the Base0 column specimen was performed to establish the axial strength of an undamaged column specimen: it was 1459 kip (6490 kN). The axial failure resulted from the formation of the shear failure plane in the bottom half of the Base0 specimen column (Fig. 11(a)). The analytical model predicted the axial strength of the undam-aged specimen to be 1446 kip (6434 kN) (error is 0.9%). An equally accurate prediction of the axial strength can be achieved using Eq. (2)
Po = fcc′ · (Aeff – Ast) + fy · Ast (2)
if Mander’s equations19 are used to calculate the area of the confined core Aeff and the compressive strength of confined concrete fcc′, based on measured strengths of plain concrete, reinforcing bars, and spiral. Using Eq. (2), the axial strength of the column specimen, Po, is estimated to be 1455 kip (6472 kN), resulting in the ratio of estimated to measured strength (Po/Pm) of 0.997. However, if confinement of the column is not accounted for and the axial strength is calcu-lated following Eq. (3) (per ACI 31821 and Caltrans BDS22)
Pn = 0.85 · [0.85 · fc′ · (Ag – Ast) + fy · Ast] (3)
The estimated axial strength of the column is significantly smaller than the measured axial strength (Pn/Pm = 0.57).
The remaining axial load strength of the Base15 column specimen was 1137 kip (5057 kN)—78% of the original axial strength. Longitudinal reinforcement strain measure-ments during the axial load tests indicated a bending moment corresponding to a lateral drift of approximately 1%. A post-test inspection of the specimen indicated that the specimen was not accurately leveled when it was installed for axial load testing. The resulting second-order bending moment and the corresponding shear caused a shear crack in the top
Table 6—Ratio of column effective stiffness to column stiffness at yield
Ductility Base15 Base30 Base45
1.0 1.00 1.00 1.00
1.2 — 0.85 —
1.5 0.83 — 0.75
1.8 — 0.73 —
2.0 — — 0.63
3.0 — 0.54 0.52
4.5 — — 0.44
31ACI Structural Journal/January-February 2015
half of the Base15 column specimen (Fig. 11(b)). To numeri-cally simulate the axial strength of the damaged column with the presence of residual drift, the top of the column model was first laterally displaced following the loading pattern of the quasi-static test, then laterally displaced to the observed drift ratio of 1%, and lastly was axially compressed (push-under analysis) to induce the axial failure. The analytically predicted axial strength of the Base15 column specimen was 1141 kip (5075 kN)—only 0.38% greater than the experi-mentally measured.
The remaining axial load strength of the Base30 column specimen was 1355 kip (6027 kN)—93% of the original axial strength. The specimen was properly leveled before the axial load tests; lateral drift was not present during this phase of testing. The axial failure resulted from the formation of the shear failure plane in the bottom half of the Base30 spec-imen column (Fig. 11(c)). The analytically predicted axial strength was 1217 kip (5455 kN)—10.2% smaller than the experimentally measured.
The remaining axial load strength of the Base45 column specimen was 1170 kip (5204 kN)—80% of the original axial
strength. The specimen was properly leveled before the axial load tests but the head of the testing machine was not accu-rately attached to the specimen: it had a small angle relative to the specimen. Thus, the force imposed on the column had two components: a dominant axial component and a small horizontal component. This initiated a failure slightly earlier than what would be anticipated if there were no flaws in the test setup. The axial failure started at the top of the column and progressed toward the bottom of the column, resulting in the formation of the shear failure plane along the total height of the column (Fig. 11(d)). The misalignment of the test machine head was not measured prior to test and there-fore could not be included in analytical simulation of the axial load test. Although the analytical model provides a good estimate (1173 kip [5217 kN], 0.24% error), it is hard to anticipate the magnitude of the error if the flaws in the test setup were included in the analysis.
Axial load degradation curve with respect to displacement ductility is developed based on experimental results. It is a bilinear function (Fig. 12) fitted through experimental data from compression tests on column specimens with lateral damage and no geometric imperfections of the damaged specimens. It includes the result of the Base45 specimen, thus providing a conservative estimate of the residual axial strength. It is assumed that there are no losses in the axial strength in the columns if the lateral displacement ductility is less than 1.5. This assumption is based on the damage state of the Base15 specimen after the lateral test (Damage State 0) and on minor loss in axial strength (7%) of the Base30 specimen. The bilinear fit is
Fig. 11—Axial force-displacement relationships and state of specimens after axial load tests: (a) Base0; (b) Base15; (c) Base30; and (d) Base45.
Table 7—Remaining axial strengths following quasi-static tests: experimental versus analytical
TestExperiment,
kip (kN)Analytical,kip (kN)
Numericalerror, % P/Po
Base0 1459 (6490) 1446 (6434) 0.9 1.0
Base15 1137 (5058) 1141 (5075) 0.38 0.78
Base30 1355 (6027) 1217 (5413) 10.17 0.93
Base45 1170 (5204) 1173 (5217) 0.24 0.80

32 ACI Structural Journal/January-February 2015
PPo
=<
− ⋅ ≥
1 1 51 09 0 0615 1 5
if if
µµ µ
.. . .
(4)
CONCLUSIONSTests designed to evaluate the axial load capacity of tall
modern bridge columns damaged in bidirectional quasi-static cyclic tests up to nominal displacement ductility levels of 1.5, 3, and 4.5 were performed. The following conclu-sions are drawn:
1. The axial strength and stiffness of a column degrade with the increase in the amount of damage induced by lateral displacement of the column. Well-confined modern bridge columns with no residual post-earthquake lateral drifts lose approximately 20% of their axial load capacity after sustaining displacement ductility demand of 4.5, which is slightly larger than the Caltrans SDC design target displace-ment ductility demand of 4.0. Therefore, modern bridge columns designed according to Caltrans SDC1 will not experience a significant loss of axial load-carrying capacity after a design-level earthquake. No axial load capacity loss is expected for displacement ductility demands less or equal to 1.5. Axial load capacity loss may conservatively be assumed to vary linearly with increasing displacement ductility demand. The residual post-earthquake displace-ments have a significant effect on the axial capacity of the column: the column that sustained the displacement ductility demand of 1.5 with no significant local damage but with a residual lateral drift of 1% experienced a reduction in axial load capacity of 22%.
2. Damage states observed during bidirectional lateral displacement tests correspond well to Damage State descrip-tions defined by Mackie et al.20 Namely, virtually no damage observed at displacement ductility demand of 1.5 corre-sponds to Damage State 0; moderate damage characterized by cover spalling and pronounced yielding of longitudinal reinforcement at displacement ductility demand of 3.0 corre-sponds to Damage State 1; significant damage to the cover and core concrete, very pronounced yielding of longitudinal and transverse reinforcement, however without any rein-
forcement fractures, at ductility demand of 4.5 corresponds to Damage State 2. These data can be used to calibrate repair cost and time models for modern reinforced concrete bridge columns.
3. The effective lateral stiffness of a damaged column decreases with increasing displacement ductility demand. For example, the effective stiffness of the column that expe-rienced a displacement ductility demand of 4.5 is slightly less than half of the undamaged column effective stiffness. This information can be used to estimate the dynamic character-istics of damaged bridges for aftershock response analysis.
4. The circular bidirectional displacement ductility pattern developed in this study imposes sustained constant displace-ment ductility demands on the column that very likely exceed the displacement ductility demands imposed by the recorded ground motions. Therefore, this load pattern is a conservative estimate of actual ground motion demands and could be used to investigate residual post-earthquake capac-ities or function capabilities of damaged structures.
5. A non-shear-critical bridge column in the range of strain-hardening response can be modeled using fiber cross-section force-based beam-column element with distributed plasticity. Two OpenSees material models are recommended to model the steel and concrete unconfined cover and confined core fibers that define a cross section of the element: the Steel02 material model for reinforcing steel, and the Concrete01 material model for concrete fibers. Mander’s equations19 are recommended to calculate the compressive strengths of confined concrete. If the material test data for concrete are available, it is recommended to cali-brate the Concrete01 material model to match the test data. The post-peak degrading slope of the confined concrete core (kEcc) has a great influence on the accuracy of the response predictions. For the tested column specimens, the post-peak degrading slope kEcc of 0.014Ecc was found to provide accu-rate predictions of the axial load capacities.
The analytical models of the bridge columns presented in this paper were validated through hybrid simulations of the seismic response of an entire bridge followed by the truck load and the axial compression tests of damaged bridge columns.23 Validated model of a typical bridge was used in an extensive parametric study to evaluate its post-earth-quake truck load capacity. The parametric study examined the effects of different ground motions and bridge modeling parameters, including boundary conditions imposed by the bridge abutments, the location of the truck load on the bridge, the amount of bridge column damage, and the amount of bridge column residual drift. Envelopes of bridge responses developed for ranges of the considered parameters were used to evaluate bridge safety and ability to function following an earthquake.6
AUTHOR BIOSVesna Terzic is an Assistant Professor at the Department of Civil Engi-neering and Construction Engineering Management, California State University, Long Beach, CA. She received her BS from the University of Belgrade, Belgrade, Serbia; her MS from Saints Cyril and Methodius University of Skopje, Skopje, Macedonia; and her PhD from the Univer-sity of California, Berkeley, Berkeley, CA. Her research interests include performance-based design and evaluation of civil infrastructure.
Fig. 12—Column axial load capacity degradation data and a bilinear fit (Eq.(4)).
33ACI Structural Journal/January-February 2015
ACI member Bozidar Stojadinovic is a Professor and Chair of structural dynamics and earthquake engineering at the Department of Civil, Environ-mental and Geomatic Engineering at Swiss Federal Institute of Technology (ETH), Zurich, Switzerland. He received his Dipl. Ing. degree in civil engineering from the University of Belgrade; his MS in civil engineering from Carnegie Mellon University, Pittsburgh, PA; and his PhD in civil engineering from the University of California, Berkeley. He is a member of ACI Committees 341, Earthquake-Resistant Concrete Structures; 349, Concrete Nuclear Structures; and 374, Performance-Based Seismic Design of Concrete Structures; and Joint ACI-ASCE Committee 335, Composite and Hybrid Structures. His research interests include probabilistic perfor-mance-based seismic design of transportation and energy infrastructure.
ACKNOWLEDGMENTSThese data and findings presented herein stem from the work supported by
the California Department of Transportation through Project 04-EQ042 and the Pacific Earthquake Engineering Research (PEER) Center. This support, as well as engineering advice from M. Mahan and C. Whitten of Caltrans and S. Takhirov of the PEER Center, is gratefully acknowledged. Any opinions, findings, conclusions, or recommendations expressed in this material are those of the authors and may not be those of the project sponsors.
REFERENCES1. Caltrans, “Seismic Design Criteria,” State of California Department of
Transportation, Sacramento, CA, 2006.2. Fenves, G. L., and Ellery, M., “Behavior and Failure Analysis of a
Multiple-Frame Highway Bridge in the 1994 Northridge Earthquake,” Report PEER 98/08, Pacific Earthquake Engineering Research Center, University of California, Berkeley, Berkeley, CA, 1998.
3. Arici, Y., and Mosalam, K., “System Identification of Instrumented Bride Systems,” Earthquake Engineering & Structural Dynamics, V. 32, No. 7, 2003, pp. 999-1020. doi: 10.1002/eqe.259
4. Mackie, K., and Stojadinovic, B., “Fragility Basis for California Highway Overpass Bridge Decision Making,” Report PEER 2005/02, Pacific Earthquake Engineering Research Center, University of California, Berkeley, Berkeley, CA, 2005.
5. Saiidi, M. S., and Ardakani, S. M., “An Analytical Study of Residual Displacements in RC Bridge Columns Subjected to Near-Fault Earth-quakes,” Bridge Structures, V. 8, 2012, pp. 35-45.
6. Terzic, V., and Stojadinovic, B., “Post-Earthquake Traffic Capacity of Modern Bridges in California,” Report PEER 2010/103, Pacific Earthquake Engineering Research Center, University of California, Berkeley, Berkeley, CA, 2010.
7. Ketchum, M.; Chang, V.; and Shantz, T., “Influence of Design Ground Motion Level on Highway Bridge Costs,” Report PEER 6D01, Pacific Earthquake Engineering Research Center, University of California, Berkeley, Berkeley, CA, 2004.
8. Mackie, K., and Stojadinovic, B., “Fragility Basis for California Highway Overpass Bridge Decision Making,” Report PEER 2005/02, Pacific Earthquake Engineering Research Center, University of California, Berkeley, Berkeley, CA, 2005.
9. McKenna, F., and Fenves, G. L., “Open System for Earthquake Engi-neering Simulation (OpenSees).” Pacific Earthquake Engineering Research Center, University of California, Berkeley, Berkeley, CA, 2004.
10. Lehman, D. E., and Moehle, J. P., “Seismic Performance of Well-Con-fined Concrete Bridge Columns,” Report PEER 1998/01, Pacific Earth-quake Engineering Research Center, University of California, Berkeley, Berkeley, CA, 1998.
11. Lehman, D. E., and Moehle, J. P., “Behavior of Reinforced Concrete Bridge Columns Having Varying Aspect Ratios and Varying Lengths of Confinement,” Report PEER 2000/08, Pacific Earthquake Engineering Research Center, University of California, Berkeley, Berkeley, CA, 2000.
12. Hose, Y., and Seible, F., “Performance Evaluation Database for Concrete Bridge Components and Systems under Simulated Seismic Loads,” Report PEER 1999/11, Pacific Earthquake Engineering Research Center, University of California, Berkeley, Berkeley, CA, 1999.
13. ACI Committee 374, “Acceptance Criteria for Moment Frames Based on Structural Testing (ACI 374.1-05) and Commentary,” American Concrete Institute, Farmington Hills, MI, 2006, 9 pp.
14. Krawinkler, H.; Gupta, A.; Medina, R.; and Luco, N., “Loading Histories for Seismic Performance Testing SMRF Components and Assem-blies,” Report No. SAC/BD-00/10, SAC Joint Venture, 2000.
15. Taucer, F. F.; Spacone, E.; and Filippou, F. C., “A Fiber Beam-Column Element for Seismic Response Analysis of Reinforced Concrete Structures,” Report No. UCB/EERC-91/17, Pacific Earthquake Engineering Research Center, University of California, Berkeley, Berkeley, CA, 1991.
16. Berry, M. P., and Eberhard, M. O., “Performance Modeling Strat-egies for Modern Reinforced Concrete Bridge Columns,” Report PEER 2007/07, Pacific Earthquake Engineering Research Center, University of California, Berkeley, Berkeley, CA, 2007.
17. Kent, D. C., and Park, R., “Flexural Members with Confined Concrete,” Journal of Structural Engineering, ASCE, V. 97, 1971, pp. 1969-1990.
18. Menegotto, M., and Pinto, P. E., “Method of Analysis for Cyclically Loaded R.C. Plane Frames Including Changes in Geometry and Nonelastic Behaviour of Elements under Combined Normal Force and Bending,” Proceedings of the Symposium on the Resistance and Ultimate Deforma-bility of Structures Acted on by Well Defined Repeated Loads, International Association for Bridge and Structural Engineering, Zurich, Switzerland, 1973, pp. 15-22.
19. Mander, J. B.; Priestley, M. J. N.; and Park, R., “Theoretical Stress-Strain Model for Confined Concrete,” Journal of Structural Engi-neering, ASCE, V. 114, No. 8, 1988, pp. 1804-1826. doi: 10.1061/(ASCE)0733-9445(1988)114:8(1804)
20. Mackie, K.; Wong, J. M.; and Stojadinovic, B., “Integrated Probabi-listic Performance-Based Evaluation of Benchmark Reinforced Concrete Bridges,” Report PEER 2007/09, Pacific Earthquake Engineering Research Center, University of California, Berkeley, Berkeley, CA, 2007.
21. ACI Committee 318, “Building Code Requirements for Structural Concrete (ACI 318-05) and Commentary,” American Concrete Institute, Farmington Hills, MI, 2005, 430 pp.
22. Caltrans, “Bridge Design Specifications,” State of California Depart-ment of Transportation, Sacramento, CA, 2004.
23. Terzic, V., and Stojadinovic, B., “Hybrid Simulation of Bridge Response to Three-Dimensional Earthquake Excitation Followed by a Truck Load,” Journal of Structural Engineering, ASCE, V. 140, 2013. doi: 10.1061/(ASCE)ST.1943-541X.0000913

34 ACI Structural Journal/January-February 2015
NOTES: