evaluation of repair design on corrosion-damage d steel
TRANSCRIPT

Journal of Structural Engineering Vol.57A (March 2011) JSCE
Evaluation of repair design on corrosion-damaged steel pipe piles using welded patch plates
under compression
Xiao Chen*, Yasuo Kitane**, Yoshito Itoh***
* M. of Eng., Doctoral student, Dept. of Civil Eng., Nagoya University, Furo-cho, Chikusa-ku, Nagoya, 464-8603 ** Ph.D., Assoc. Prof., Dept. of Civil Eng., Nagoya University, Furo-cho, Chikusa-ku, Nagoya, 464-8603
*** Dr. of Eng., Professor, Dept. of Civil Eng., Nagoya University, Furo-cho, Chikusa-ku, Nagoya, 464-8603
This paper presents a numerical study on the compressive behavior of steel pipe piles repaired with patch plates welded underwater. In this study, a uniform thickness reduction is assumed for a portion of a pipe pile to simulate corrosion damage, and a special attention is paid to modeling the mechanical behavior of fillet welds in finite element analysis based on available experimental data. Effectiveness of different welding patterns on pipe piles with various size parameters is examined in terms of stiffness, load-carrying capacity, and load share ratio of patch plates of repaired piles. Effectiveness of transverse welds in the repair is also examined, and equations to calculate a load share ratio of patch plates, the minimum thickness of patch plates, and the maximum number of slits are proposed for the repair design.
Keywords: underwater welding, repair, steel pipe pile, corrosion damage, FE analysis.
1. INTRODUCTION
There are many offshore steel structures under corrosive
environments all over the world, and many of them are in need of repair. Due to its high efficiency and cost effectiveness, patch plate repair by underwater welding is one of commonly used repair techniques1),2). Fig. 1 shows a general procedure of this technique to repair a thickness-reduced steel pipe.
The current repair design manual in Japan, Port Steel Structure Corrosion-Prevention and Repair Manual, was issued
in 20093), where the major update from its previous version was the change of design concept from allowable stress design to reliability based design. Regarding the patch plate welding repair, there is also a change where the discount rate of weld strength due to field welding is set to 10% in place of its previous value of 20%3),4). Since the discount rate due to underwater welding environments is 20%, weld strength of field underwater welding is specified as 70% of that of in-air shop welding, which was 60% in the previous manual. To examine how much strength underwater welds have, the authors5),6)
performed a series of double-lapped joint tests on fillet welds, and found underwater fillet welds, depending on their base steels, have a strength increase ranging from 7% to 40% and a ductility decrease of about 50% compared with their counterpart in-air welds, implying that the current manual is on the safe side by discounting underwater weld strength by 20% from in-air weld strength.
There are still some other issues which need to be examined to achieve structurally more efficient repair design. The first one is the welding pattern. A required thickness of a patch plate and a required weld length can be determined according to the
Processing
Welding
Transverse fillet welds
Transverse fillet welds
Longitudinal fillet welds
Longitudinal fillet welds
Groove welds
Thicknessreduction
Processing
Patch plate
Pipe
Fig. 1 A general procedure of welding repair
-756-

current repair design manual when a corrosion-damaged structure is given. However, different welding patterns can be designed to provide the required weld length. How this difference in welding patterns would change structural performance and which pattern gives better structural performance are not yet understood. The second issue is the minimum required thickness of patch plates for a given corrosion-damaged structure to recover its original stiffness and strength. The third issue is the contribution of transverse fillet welds to structural performance of a repaired structure by patch plates. It is specified in the repair design manual that the strength of transverse welds is not counted to determine a required length of fillet welds for repair although transverse welds are usually provided to make the corrosion-damaged portion watertight.
To have a better understanding on these issues, this paper presents a comparative study on the compressive behavior of repaired pipe piles with different welding patterns, where a special attention is paid to the modeling of fillet welds in finite element (FE) analysis. The paper begins with a brief description and a result summary of weld strength tests, and then proposes a modeling method of fillet welds in FE analysis. The proposed weld model is validated against analytical solutions and test results. By using the proposed weld model, four baseline repair designs with different welding patterns to repair thickness-reduced steel pipe piles under compression are modeled. The structural behavior of the repaired pipe piles is examined in terms of stiffness, and load-carrying capacity as well as failure modes. Finally, design recommendations are made for a patch plate repair of steel pipe piles under compression.
2. MECHANICAL MODEL OF FILLET WELDS
To model the mechanical behavior of fillet welds in FE
analysis, mechanical properties of fillet welds need to be studied
beforehand. The experimental results5) are used in the present study to model fillet welds. To better understand the modeling procedure, a summary of the weld strength test is described in Section 2.1.
2.1 Weld Strength Test
Mechanical properties of underwater fillet welds were studied through a series of weld strength tests5). The specimens were double-lapped joints with fillet welds. The specified weld leg length was 6 mm, and a length of one weld line was 40 mm. There were forty-five specimens in total and fourteen cases with two welding environments of in-air and underwater welding, two weld orientations of transverse weld and longitudinal weld, and four base steels of SY295, SYW295, and corroded SY295 for steel sheet piles and STK400 for steel pipes. Because the current study is focused on steel pipe piles, mechanical properties of fillet welds made on STK400 steels, structural steel tubes specified in JIS G3444, with SM400 patch plate, rolled steel plate for welded structure specified in JIS G3106, are summarized in Table 1.
Base plate
Patch plate
Connector1 9
(ii) Analyzed model
1
2
(a) Longitudinal weld
iUi1
Ui2
Ui3
jUj1
Uj2Uj3
(iii) Connector element
Base plate
Connector
Patch plate 2
3
(b) Transverse weld(ii) Analyzed model
i
Ui2Ui3
Ui1j
Uj2
Uj3
Uj1
(iii) Connector element
Patch plate
Base plateFillet weld
1
2
Patch plate
Fillet weld
3
1
(i) 3D view
(i) 3D view
3
2Base plate
Fig. 2 Weld model by connector elements
Table 1 Mechanical properties of fillet welds
Parameters* In-air Underwater
Transverse Longitudinal Transverse LongitudinalStiffness kw0
(kN/mm/mm) 31 14 41 14 Yielding stress σy (MPa) 433 193 443 265
Weld strength σw (MPa) 553 324 591 393
Ductility factor γm 0.15 0.32 0.10 0.16 Ductility factor γf 0.16 0.41 0.12 0.19
*Note: kw0 is the weld stiffness in loading direction per unit length of aweld bead; σy is determined by 0.2% offset value; σw is the maximum applied load divided by weld throat area; γm is the weld deformation at the maximum applied load divided by weld size; and γf is the weld deformation at weld fracture divided by weld size.
-757-
2.2 Modeling Procedure
Chen et al.5) proposed a weld model using solid elements in elastic-plastic analysis, and this model could predict the maximum load of fillet welds with a good accuracy; it is, however, not easy to use for complex structural analysis. Kitane et al.7) used elastic beam elements to model fillet welds in a repaired pipe and obtained good agreement with experiments when predicting load-carrying capacity of repaired pipes; however, this model could not represent a nonlinear behavior of welds. These two existing weld model failed to predict both the post-peak response and the following failure of fillet welds, which would have a significant influence on the stress redistribution and structural behavior of repaired pipes once fillet welds fail. In the repair design, weld size and length will be determined so that base and patch plates will fail before weld fracture. However, in comparing effectiveness of different weld patterns in the repair design, there may be some cases where welds show a nonlinear behavior or even fail.
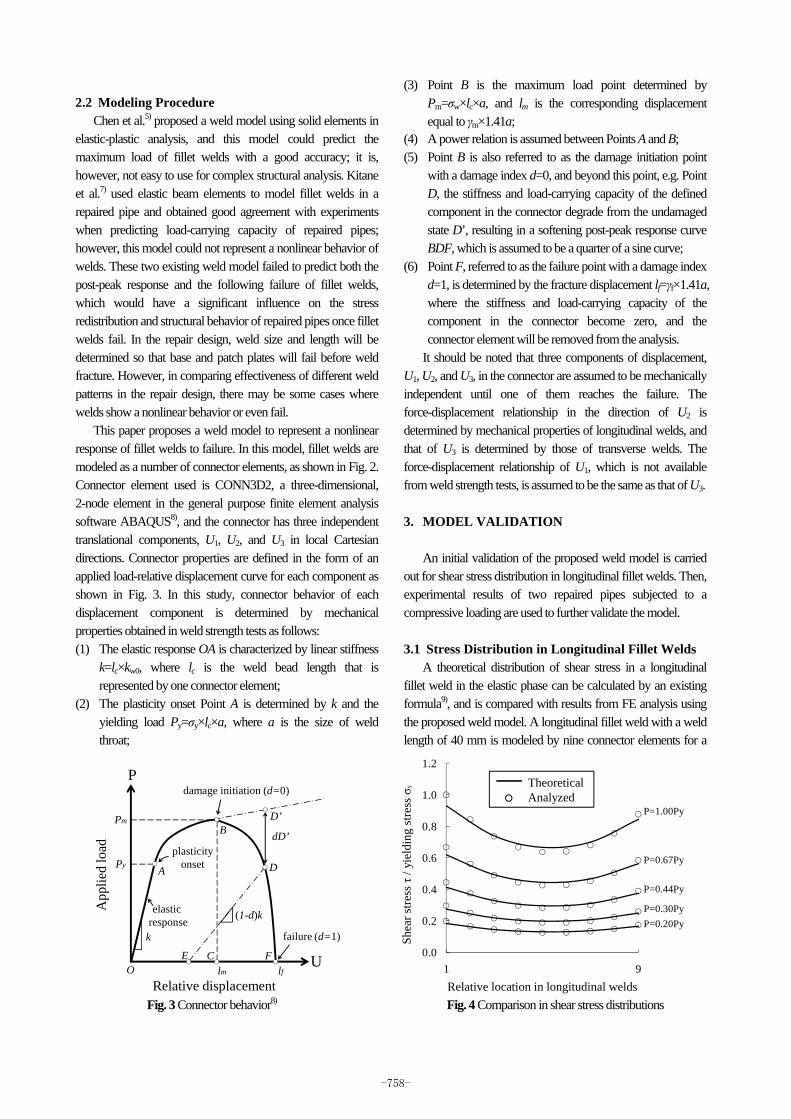
This paper proposes a weld model to represent a nonlinear response of fillet welds to failure. In this model, fillet welds are modeled as a number of connector elements, as shown in Fig. 2. Connector element used is CONN3D2, a three-dimensional, 2-node element in the general purpose finite element analysis software ABAQUS8), and the connector has three independent translational components, U1, U2, and U3 in local Cartesian directions. Connector properties are defined in the form of an applied load-relative displacement curve for each component as shown in Fig. 3. In this study, connector behavior of each displacement component is determined by mechanical properties obtained in weld strength tests as follows: (1) The elastic response OA is characterized by linear stiffness
k=lc×kw0, where lc is the weld bead length that is represented by one connector element;
(2) The plasticity onset Point A is determined by k and the yielding load Py=σy×lc×a, where a is the size of weld throat;
(3) Point B is the maximum load point determined by Pm=σw×lc×a, and lm is the corresponding displacement equal to γm×1.41a;
(4) A power relation is assumed between Points A and B; (5) Point B is also referred to as the damage initiation point
with a damage index d=0, and beyond this point, e.g. Point D, the stiffness and load-carrying capacity of the defined component in the connector degrade from the undamaged state D’, resulting in a softening post-peak response curve BDF, which is assumed to be a quarter of a sine curve;
(6) Point F, referred to as the failure point with a damage index d=1, is determined by the fracture displacement lf=γf×1.41a, where the stiffness and load-carrying capacity of the component in the connector become zero, and the connector element will be removed from the analysis.
It should be noted that three components of displacement, U1, U2, and U3, in the connector are assumed to be mechanically independent until one of them reaches the failure. The force-displacement relationship in the direction of U2 is determined by mechanical properties of longitudinal welds, and that of U3 is determined by those of transverse welds. The force-displacement relationship of U1, which is not available from weld strength tests, is assumed to be the same as that of U3. 3. MODEL VALIDATION
An initial validation of the proposed weld model is carried
out for shear stress distribution in longitudinal fillet welds. Then, experimental results of two repaired pipes subjected to a compressive loading are used to further validate the model. 3.1 Stress Distribution in Longitudinal Fillet Welds
A theoretical distribution of shear stress in a longitudinal fillet weld in the elastic phase can be calculated by an existing formula9), and is compared with results from FE analysis using the proposed weld model. A longitudinal fillet weld with a weld length of 40 mm is modeled by nine connector elements for a
k
damage initiation
failure
O
A
F
B
U
P
elasticresponse
Relative displacement
App
lied
load
dD’
(1-d)k
(d=0)
(d=1)
E
D
D’
Py
Pm
lm lfC
plasticity onset
0.0
0.2
0.4
0.6
0.8
1.0
1.2
1 9Relative location in longitudinal welds
Shea
r stre
ss τ
/ yie
ldin
g st
ress
σy
P=0.20PyP=0.30Py
P=0.44Py
P=0.67Py
P=1.00Py
TheoreticalAnalyzed
Fig. 3 Connector behavior8) Fig. 4 Comparison in shear stress distributions
-758-
throat size a=4.2 mm. Two connector elements at the end of weld beads, as indicated as “1” and “9” in Fig. 2(a)(ii), are specified with lc=2.5 mm, and the other seven connector elements are specified with lc=5 mm. Comparisons of shear stress distributions at different applied load levels are shown in Fig. 4. It is found that distributions from the FE analysis have good agreement with the theoretical ones along the weld bead although there is a small overestimation of about 6% at the end of the weld bead in the relative location “1”. 3.2 Validation Against Repaired Pipe Tests
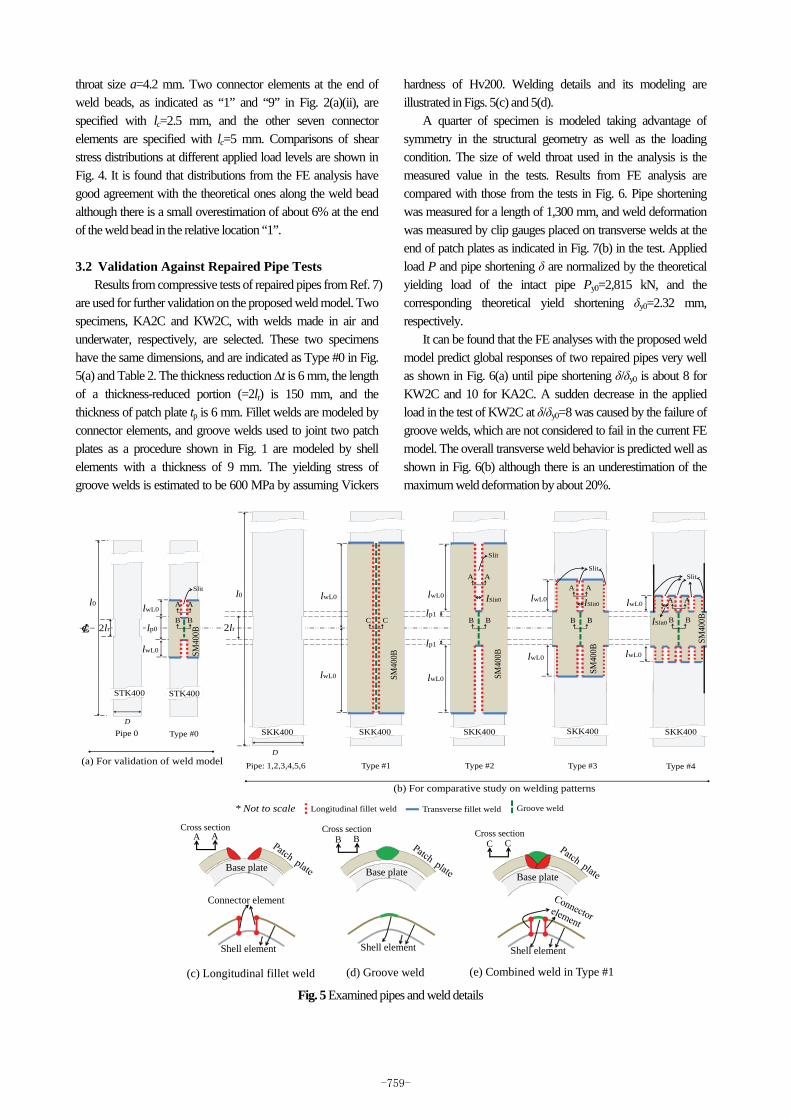
Results from compressive tests of repaired pipes from Ref. 7) are used for further validation on the proposed weld model. Two specimens, KA2C and KW2C, with welds made in air and underwater, respectively, are selected. These two specimens have the same dimensions, and are indicated as Type #0 in Fig. 5(a) and Table 2. The thickness reduction ∆t is 6 mm, the length of a thickness-reduced portion (=2lr) is 150 mm, and the thickness of patch plate tp is 6 mm. Fillet welds are modeled by connector elements, and groove welds used to joint two patch plates as a procedure shown in Fig. 1 are modeled by shell elements with a thickness of 9 mm. The yielding stress of groove welds is estimated to be 600 MPa by assuming Vickers
hardness of Hv200. Welding details and its modeling are illustrated in Figs. 5(c) and 5(d).
A quarter of specimen is modeled taking advantage of symmetry in the structural geometry as well as the loading condition. The size of weld throat used in the analysis is the measured value in the tests. Results from FE analysis are compared with those from the tests in Fig. 6. Pipe shortening was measured for a length of 1,300 mm, and weld deformation was measured by clip gauges placed on transverse welds at the end of patch plates as indicated in Fig. 7(b) in the test. Applied load P and pipe shortening δ are normalized by the theoretical yielding load of the intact pipe Py0=2,815 kN, and the corresponding theoretical yield shortening δy0=2.32 mm, respectively.
It can be found that the FE analyses with the proposed weld model predict global responses of two repaired pipes very well as shown in Fig. 6(a) until pipe shortening δ/δy0 is about 8 for KW2C and 10 for KA2C. A sudden decrease in the applied load in the test of KW2C at δ/δy0=8 was caused by the failure of groove welds, which are not considered to fail in the current FE model. The overall transverse weld behavior is predicted well as shown in Fig. 6(b) although there is an underestimation of the maximum weld deformation by about 20%.
lp02lr
l0 lwL0
Pipe 0 Type #0
STK400 STK400
D
SM40
0B
Longitudinal fillet weld Transverse fillet weld Groove weld
l0
Pipe: 1,2,3,4,5,6
lwL0
Type #2
lwL0
Type #1
SKK400 SKK400 SKK400
* Not to scale
D
SM40
0B
SM40
0B
Slit
Slit
lwL0
Type #3
SKK400
SM40
0B
Slit
lwL0
Type #4
SKK400
SM40
0B
Slit
A A
B B C C B B
A A
B B
A A
B B
A A
2lr
lwL0
lp1
lp1
(a) For validation of weld model
(b) For comparative study on welding patterns
lSlit0 lSlit0
lSlit0
lwL0lwL0
lwL0lwL0
Base plate
(c) Longitudinal fillet weld
Shell element
Connector element
A A
Base plate
(e) Combined weld in Type #1
C C
Shell element
Cross section
Base plate
(d) Groove weld
B B
Shell element
Cross sectionCross section
Fig. 5 Examined pipes and weld details
-759-

To estimate the failure of groove welds in the comparative study to be discussed in Section 4.3, the equivalent plastic strain of 5.7% at groove welds obtained from the FE analysis of KW2C at δ/δy0=8 is used as a criterion.
A contour plot of equivalent plastic strains from the FE analysis at P/Py0=0.8 in the post-peak region as shown in Fig. 7(c) is used to examine failure mode of KW2C. It is found that both the test and the analysis show that local buckling occurs at the thickness-reduced portion and that fillet welds fail at the corner of a slit in patch plates. An examination on the damage index d of welds in the analysis, as shown in Fig. 8, indicates that transverse weld elements #1 and #2 in the inner transverse weld line as indicated in Fig. 7(d) reach their ultimate load first at δ/δy0=3.64. The longitudinal weld #1 adjacent to them then reaches the ultimate load at δ/δy0=4.33, followed by the
longitudinal weld #2 at δ/δy0=5.95. A transverse weld line on a patch plate which constitutes a re-entrant corner of a slit is referred to as an inner transverse weld in this paper.
By comparing with δpmax, pipe shortening at Pmax, this damage progress suggests that the repaired pipe, KW2C, reaches its maximum load when local buckling of the thickness-reduced portion of the pipe occurs at δpmax/δy0=3.51, and that buckling causes deformation of the pipe to increase. The increased relative deformation between the pipe and patch plates triggers the failure of the inner transverse weld, and the adjacent longitudinal weld then becomes the damage-front. After that, weld failure progresses along the longitudinal weld bead, causing a total failure of the repaired pipe.
In the validation against both theoretical solutions and experimental results, it was shown that the proposed weld model
Table 2 FE model information
Pipe Pipe
length Pipe outer diameter
Wall thickness D/t0
ratio
Theoretical yielding load
Theoretical shortening at yielding load
Stiffness of intact pipe with 2lr’s
length Repair type
Length of each weld line
No. of slits
l0 (mm) D (mm) t0 (mm) Py0 (kN) δy0 (mm) Kr0 (kN/mm) lwL0 (mm) n Pipe0 1,300 216.7 12.3 17.6 2,815 2.32 10,684 #0 140 2
Pipe1
3,360 300.0
14.0 21.4
4,554
5.99
5,104
#1 1,180 0 #2 880 2 #3 440 4 #4 220 8
Pipe2 12.0 25.0 3,930 4,406
#1 1,180 0 #2 880 2 #3 440 4 #4 220 8
Pipe3
5,600 500.0
14.0 35.7 7,738
9.99
8,674
#1 1,760 0 #2 1,460 2 #3 730 4 #4 370 8
Pipe4 12.0 41.7 6,660 7,465
#1 1,760 0 #2 1,460 2 #3 730 4 #4 370 8
Pipe5
7,860 700.0
14.0 50.0 10,922
14.02
12,243
#1 2,340 0 #2 2,040 2 #3 1,020 4 #4 510 8
Pipe6 12.0 58.3 9,389 10,525
#1 2,340 0 #2 2,040 2 #3 1,020 4 #4 510 8
0.0
0.2
0.4
0.6
0.8
1.0
1.2
0 2 4 6 8 10 12 14
App
lied
load
P/P
y0
Pipe shortening δ/δy0
Test-KA2CTest-KW2CAnalysis-KA2CAnalysis-KW2C
Test AnalysisKA2C KW2C KA2C KW2C
Pmax/Pyo 1.058 1.044 1.045 1.028δPmax/δyo 3.717 3.560 4.010 3.510
Failure of groove welds
0.0
0.2
0.4
0.6
0.8
1.0
1.2
0.0 0.1 0.2 0.3 0.4 0.5
App
lied
load
P/P
y0
Weld deformation (mm)
Test-KA2CTest-KW2CAnalysis-KA2CAnalysis-KW2C
(a) Global responses of repaired pipes (b) Local responses of weld deformation
Fig. 6 Comparisons of validation tests on Type #0
-760-

is capable of predicting nonlinear behavior of fillet welds to failure as well as global strucutral responses of repaired pipes under compression. The proposed weld model is then used in the following analysis for a comparative study on welding patterns. 4. WELDING PATTERNS IN THE REPAIR
DESIGN 4.1 General Information of Designs
In designing patch plate repair for corrosion-damaged pipe piles, there can be different welding patterns as long as a total length of longitudinal welds meets design requirements by the current repair manual. In this study, how different welding patterns affect structural performance of pipe piles repaired by welded patch plates is examined by FE analysis.
To represent corrosion damage, a uniform thickness reduction for a portion of a pipe pile is assumed in this study. Four possible welding patterns are examined for repairing six pipe piles with different dimensions as listed in Table 2. Examined pipe piles with thickness reduction are designated as Pipe 1, 2, 3, 4, 5, and 6, and their four repair designs are Type #1, #2, #3, and #4 as illustrated in Fig. 5(b). Outer diameters and wall thicknesses of pipe piles are selected from JIS A5525 for the pipe pile SKK400, which is a typical type of piles used in offshore structures in Japan. Parameters listed in Table 3 are fixed for all pipe piles in this study. A thickness reduction ∆t is set to 6 mm by assuming 20 years’ corrosion at a severe splash zone with a length of 500 mm at offshore environment with a corrosion rate 0.3 mm/year3). Slenderness ratio is set to 16.5 to avoid global buckling at a specified threshold value of 18 for SKK400 steels3).
The target of all repair designs is to recover the structural performance in terms of stiffness and load-carrying capacity of corrosion-damaged pipe piles to the level of intact pipe piles. Characteristic values of material strength are listed in Table 4.
Standard values of partial factors for materials, applied load (dead load), and structural analysis are γσy=1.00, γq=1.00, and γa=1.00, respectively10).
In order to compare four different repair types, a baseline design is used for all four types, where repair designs just meet the minimum requirements of the repair design manual, and the additional redundancy is not introduced. Based on this rule, a total length of longitudinal weld lines is determined so as to be just above the minimum required length, and the thickness of patch plate is set equal to the thickness reduction in the pipe piles. Therefore, even though their welding patterns are different, the four repair designs from Type #1 to #4 are all baseline designs. 4.2 Examined Weld Patterns
Type #1 design uses two patch plates fillet-welded on a pipe pile, and two patch plates are further groove-welded together as shown in Fig. 5(b). Longitudinal welds in this type are made not only on the intact pipe portion but also on the thickness-reduced
Table 4 Characteristic values of material strength (MPa) Steel pipe
SKK400 Patch plate
SM400B Weld metal
(underwater welding on site) Tension andCompression 235 235 -
Shear 136 136 136×0.7=95.2
T weld #1T weld #2L weld #1L weld #2
Clip gauge
(a) Tested KW2C
(d)(b) Weld failure (c) FEA results
(d) Local image
0
0.2
0.4
0.6
0.8
1
0 2 4 6 8 10 12 14
Dam
age
varia
ble
d
Pipe shortening δ/δy0
T weld #1T weld #2L weld #1L weld #2
3.64
4.33
5.95
Fig. 7 Comparison of failure modes Fig. 8 Damage progress of welds in KW2C
Table 3 Fixed parameters in comparative study
Thickness reduction ∆t (mm) 6
Thickness of patch plates tp (mm) 6
Length of thickness-reduced portion 2lr (mm) 500
Length of over-patch lp1 (mm) 50
Slit width lslit0 50
Slenderness parameter of pipe piles 0.215
Slenderness ratio of pipe piles 16.5
Effective length factor 0.5
-761-

portion. Groove welds overlap two longitudinal weld beads and are modeled as shell elements with a thickness of 6 mm and a yielding stress of 600 MPa as illustrated in Fig. 5(e). Type #2 design uses two slits, each with two weld lines, in patch plates, which are fillet-welded to the pipe pile along slits. Two patch plates are groove-welded over the thickness-reduced portion as illustrated in Fig. 5(d). Type #3 and #4 designs use four and eight slits in patch plates, respectively, resulting in a length of one weld line lwL0 being a half and a quarter of Type #2.
It should be noted that in Type #1, the length of longitudinal welds at the thickness-reduced portion is not counted in the design because the quality of longitudinal welds may not be as good as those at the intact portion. However, all longitudinal welds of Type #1 are modeled as the same regardless of the potential difference in quality depending on pipe pile conditions. Therefore, Type #1 has longer longitudinal welds than Type #2 due to the extra length of 2lr at the thickness-reduced portion. This treatment in the analysis would result in an upper bound condition of Type #1 repair design.
For all the repair types, underwater fillet welds are modeled by the proposed weld model using a=4.2 mm, representing a target weld leg length of 6 mm, which is one of the most commonly used leg lengths in the underwater repair work. Moreover, to examine the effectiveness of transverse welds in the patch plate repair design, another set of four repair types without transverse welds are also modeled since transverse welds are not included in the weld strength calculation in the current design practice.
In this comparative study, initial stresses due to dead load are not considered in all pipe piles to be repaired since the main focus of this study is a relative comparison of repaired performance between different baseline repair designs. In the actual conditions, steel pipe piles are part of a structure, and when they corrode, stresses in corroded pipe piles due to dead load may increase or decrease depending on the rest of structure. It is usually difficult to determine the working initial stresses in corroded pipe piles to be repaired; however, if these initial stresses can be estimated, it is possible to design the repair.
Since there are 24 analytical cases (= 6 pipe types x 4 repair designs) with transverse welds and another 24 cases without transverse welds, totally forty-eight cases of repaired pipe piles are subjected to a compressive loading in the FE analysis. 4.3 Results and Discussions (1) Global responses of different repair types
Firstly, all repaired pipe piles show similar relationships between applied load and pipe shortening under compression. Therefore, global responses of Pipe 4 are plotted in Fig. 9 to represent typical results. Applied load P and pipe shortening δ of a total pipe length are normalized by the theoretical yielding load of the intact pipe Py0 and the corresponding theoretical yield shortening δy0 as listed in Table 2, respectively. It can be seen
that all repaired types have higher stiffness and larger load-carrying capacity than the unrepaired pipe pile. However, the target of a repair design which is to recover structural performance back to its intact level is not reached by any repair type except the overall stiffness after repair. Another finding is that there appears no significant difference in load-carrying capacity between repaired types with and without transverse welds, and all repair types have Pmax/Py0 ratios ranging approximately from 0.8 to 0.9.
To compare structural behavior of different repair types in more detail, results are discussed in terms of stiffness and load-carrying capacity in the following. (2) Stiffness of the thickness-reduced portion after
repair This section compares the stiffness of the thickness-reduced
portion with a length of 2lr after repair, referred to as Kr in this paper, in lieu of overall stiffness for a total pipe length l0. The ratio between Kr and the stiffness of the intact pipe pile with a length of 2lr, Kr0, is defined as stiffness recovery in this paper, indicating how much stiffness of the thickness-reduced portion is recovered after repair. The definition of Kr0 and Kr is illustrated in Fig. 10. Kr0, as shown in Table 2, is calculated according to basic structural mechanics, and Kr is determined at a load level of 0.5Pmax in FE analysis. Stiffness recoveries of all analytical cases are summarized in Fig. 11.
0.0
0.2
0.4
0.6
0.8
1.0
1.2
0 0.5 1 1.5 2 2.5 3
App
lied l
oad
P/Py
0
Pipe shortening δ/δy0
Type#1-wT Type#1-woTType#2-wT Type#2-woTType#3-wT Type#3-woTType#4-wT Type#4-woT
Unrepaired
Intact
Type#1-wT
Fig. 9 Global responses of Pipe 4 with different conditions
Intact pipe Repaired pipe
Kr0 Kr2lr
Thickness reduction
Fig. 10 Illustration of Kr0 and Kr
-762-

The discussion on Fig. 11 is firstly focused on repaired types with transverse welds. In general, all these baseline repair designs fail to fully recover the stiffness of the thickness-reduced portion. The recovery rate ranges approximately from 0.85 to 0.95 among all cases examined. Comparing four repair types within one pipe type, it is found that stiffness recovery rate increases with the number of slits in patch plates. This increase is found to be more significant on pipes with a larger D/t0 ratio. For example, Pipe 6 with a D/t0 ratio of 58.3 has a maximum difference of 8.1% between Type #2 and #4 repairs in stiffness recovery rate compared with other pipes with smaller D/t0 ratios.
By comparing the cases with and without transverse welds, it is interesting to note that although stiffness recovery rate is decreased from the corresponding cases with transverse welds, the extent of decrease is within 15% for all cases and within 10% for the most cases. Moreover, it is found that Type #2 has a largest decrease among four repair types, and that Type #1 shows a little decrease when D/t0 is small such as in the cases of Pipes 1 and 2 with D/t0 ratios of 21.4 and 25.0, respectively. (3) Load-carrying capacity of repaired pipe piles
Load-carrying capacities of repaired pipe piles are summarized in Fig. 12. There is a general trend that the recovery rate of load-carrying capacity, represented as Pmax/Py0, decreases
with the increase of D/t0 ratio. For Pipe 1 with D/t0=21.4, Pmax/Py0 ratios are close to 1.0, while for Pipe 6 with D/t0=58.3, Pmax/Py0 ratios are about 0.87 for four repaired types. By comparing different repair types within one pipe, it is found that for pipes with smaller diameters, i.e. Pipe 1 and 2, the recovery rate of load-carrying capacity decreases with the number of slits.
This dependency of load-carrying capacity on a number of slits can be explained by the loss of cross-sectional area of patch plates in each repaired type. The more slits are made in patch plates, the more cross-sectional area of patch plates would be reduced, which causes patch plates at the root of patch strips to have higher stress and eventually to yield as shown in Fig. 13, resulting in a lower buckling load of repaired pipe piles. This phenomenon is more significant for the pipes with smaller diameters where a relative loss of cross-sectional area is larger than the pipes with larger diameters for the same number of slits.
It is of importance to note that load-carrying capacities of repaired pipe piles are below the theoretical yielding loads of their corresponding intact pipe piles, and this phenomenon is more significant in pipe piles with larger D/t0 ratios as an overall trend shown in Fig. 12. In addition, more slits require more weld lines in the repair work, which would generate more residual stresses in welded
0.7
0.8
0.9
1.0
#1 #2 #3 #4 #1 #2 #3 #4 #1 #2 #3 #4 #1 #2 #3 #4 #1 #2 #3 #4 #1 #2 #3 #4
Kr/K
r0
With T weldsWithout T welds
Pipe 1 Pipe 2 Pipe 3 Pipe 4 Pipe 5 Pipe 6
Repaired type
Fig. 11 Stiffness of different repair types
0.7
0.8
0.9
1.0
#1 #2 #3 #4 #1 #2 #3 #4 #1 #2 #3 #4 #1 #2 #3 #4 #1 #2 #3 #4 #1 #2 #3 #4
Pmax
/Py0
With T weldsWithout T welds
Pipe 1 Pipe 2 Pipe 3 Pipe 4 Pipe 5 Pipe 6
Repaired type
Weld failureNo weld failure
Fig. 12 Load-carrying capacity of different repair types
-763-

steels and result in a lower load-carrying capacity of the repaired pipe. Although residual stresses are not considered in the FE model in this study, the general trend as shown in Fig. 12 that the repaired type with more slits has a lower load-carrying capacity still hold true in the actual case when there are residual stresses caused by welding.
Analytical cases that showed weld failure are also indicated in Fig. 12. Weld failure is observed at the re-entrant corners of slits and is similar to that shown in Fig. 7. There is no weld failure found in Type #1 repair, and this is reasonable because the continuous longitudinal weld beads at the thickness-reduced portion would reduce the relative displacement between base steels and patch plates, resulting in a reduction of shear stresses in fillet welds. For other repair types, it is found that the repair
type with more slits is beneficial to prevent fillet welds from failing, and that the larger a D/t0 ratio of pipe is, the larger number of slits is required to prevent weld failure. As indicated in Fig. 12, in order to have intact fillet welds, Pipe 1 and 2 need four slits, while other pipes need eight slits.
Failure modes of repaired pipes are examined at 0.9Pmax in the post-peak stage. Contour plots of equivalent plastic strains from Pipe 4 are selected here as a representative as shown in Fig. 14. It suggests that for all repair types, the base pipe at the thickness-reduced portion buckles first, as shown in Fig. 14(a), and buckling at patch plates follows in different ways as shown in Fig. 14(b). Patch plates at the mid-height of plates buckle in Type #1 and #2 repairs, while patch plates buckle near the inner transverse welds in Type #3 and #4 repairs, where the reduction of cross-sectional areas of patch plates is large. (4) Load-share ratio of patch plates
Load share ratios of patch plates Ppatch/Ptotal, as summarized in Fig. 15, are calculated at an elastic phase when applied loads on the repaired pipe piles equal to 0.5Pmax. It is found that an overall trend of Fig. 15 is very similar to that of Fig. 11. Corresponding to stiffness recovery rate ranging from 0.85 to 0.95, Ppatch/Ptotal ratio ranges from 0.35 to 0.47, meaning a larger portion of load is carried by the thickness-reduced base pipes rather than patch plates.
Examinations on load share ratios of patch plates in different repair types also suggest that a patch plate with more slits and accordingly shorter weld lines is a favorable welding pattern, which would transfer more loads to the patch plate and result in
Type #4 repair of Pipe 2 at 0.82Pmax
prior to the maximum load Fig. 13 Yielding of patch plate at the root of patch strips
Type #1 Type #2 Type #3 Type #4(b) Patch plates
(a) Base pipe piles (total length is not fully depicted)
Fig. 14 Failure modes of different repair types in Pipe 4 (a quarter of model at post-peak 0.9Pmax)
-764-

a larger stiffness recovery. (5) Effectiveness of transverse welds
Because the load carried by patch plates, Ppatch, must be transferred from base pipe piles through longitudinal welds and transverse welds if there are, Eq. (1) should be satisfied:
Ppatch= PTL= PT+ PL (1)
where, PTL is the total load transferred by transverse and longitudinal welds, PT is the load transferred by transverse welds, and PL is the load transferred by longitudinal welds.
Load share ratios of different welds are summarized in Table 5 for Pipe 4 case. Values in Table 5 are calculated at the same applied load at 0.5Py0. It is of interest to note that transverse welds carry more loads than longitudinal welds. The minimum load share ratio of transverse welds is found to be 0.62 for Type #4 repair, and the maximum value is 0.74 for Type #2 repair, implying transverse welds have a more significant role to transfer load in repair types where the number of slits is smaller. This finding can explain the observation that Type #2 repair exhibits the largest decrease in stiffness and load share ratio when there is no transverse weld in the repair from the case with transverse welds. It should also be noted that Type #1 repair that has no slit in patch plates has the second largest
load share ratio of transverse welds of 0.71 among four types of repair. Type #1 repair has a smaller load share ratio of transverse welds than Type #2 repair because longitudinal welds in Type #1 are made on the thickness-reduced portion and a total length of longitudinal welds are longer than Type #2.
Although transverse welds carry more loads than longitudinal welds, in the absence of transverse welds, changes in the load share ratio are within 10% for all cases, suggesting that the amount of load carried by patch plates is not affected much by losing transverse welds as long as longitudinal welds remain carrying the load. Therefore, the specification in the current repair design manual is appropriate where transverse welds are not counted when designing a total weld length because the structural behavior of repaired pipe piles would not be influenced significantly whether there are transverse welds or not. The function of transverse welds is hence more of sealing to protect corrosion-damaged pipe portion from seawater. 5. PROPOSAL FOR REPAIR DESIGN
As a result of a comparative study presented above, it is found that the welding pattern with many slits and short longitudinal weld lines is a favorable repair type in terms of
0.30
0.35
0.40
0.45
0.50
#1 #2 #3 #4 #1 #2 #3 #4 #1 #2 #3 #4 #1 #2 #3 #4 #1 #2 #3 #4 #1 #2 #3 #4
Ppat
ch/P
tota
l
With T weldsWithout T welds
Pipe 1 Pipe 2 Pipe 3 Pipe 4 Pipe 5 Pipe 6
Repaired type
Fig. 15 Load share ratio of patch plates in different repair types
Table 5 Load share ratio of welds and patch plates (Pipe 4)
With transverse welds Without transverse welds
Type #1 Type #2 Type #3 Type #4 Type #1 Type #2 Type #3 Type #4
PT (MN) 1.05 1.05 0.98 0.94 0 0 0 0
PL (MN) 0.44 0.37 0.49 0.58 1.35 1.30 1.42 1.44
PTL (MN) 1.50 1.42 1.46 1.51 1.35 1.30 1.42 1.44
PT/ PTL 0.71 0.74 0.67 0.62 0 0 0 0
PL/ PTL 0.29 0.26 0.33 0.38 1 1 1 1
Ppatch/ Ptotal 0.42 0.43 0.44 0.45 0.40 0.39 0.43 0.43
-765-

structural performance. However, simple design equations for this type of repair are not available. This section further investigates mechanics of repaired pipe piles and proposes design equations for a patch plate repair. 5.1 Load Share Ratio of Patch Plates
A load share ratio of patch plates determines the stiffness of the repaired portion. The calculation of a required thickness of patch plates, one of the most important design variables in repair work, is based on a load share ratio of patch plates. The current repair design manual assumes an equal strain in the base pipe and the patch plate in the same cross section of the repaired portion, which results in a load share ratio of 0.5 if the thickness of patch plates is the same as the thickness reduction of the pipe. However, this is not the case as found in all baseline designs presented in Section 4. In fact, the load share ratio of patch plates tends to be smaller than 0.5 in baseline designs.
Therefore, the first task when designing a proper thickness of patch plates is to calculate load share ratio accurately. For the repair type where many slits are used, this paper proposes Eq. (2) to calculate the load share ratio of patch plates, LSR. Deriving the equation, it is assumed that when many slits are used, the base pipe and patch plates have an equal amount of shortening deformation between cross sections C1-C1 and C2-C2 as indicated in Fig. 16(a).
patch
r p1 p wb rtotal
p b r r p1
1/
1
PLSR l l A E KA AP
A A l A l
= =+ +
+ ⋅+
(2a)
w w0T wT w0L wLK K l K l= + (2b)
wTl Dπ= (2c)
wL wL02l nl= (2d)
Definitions of variables used in Eq. (2) are also shown in Fig. 16(a). It is noted that the term ApE/Kw in Eq. (2a) is a relative stiffness of patch plates compared to welds, and it represents the effect of weld stiffness on load share ratio of patch plates. When Kw approaches to infinite, Eq. (2a) then retrogresses to Eq. (3).
patch*
r p1b rtotal
p b r r p1
1
1
PLSR l lA AP
A A l A l
= =+
+ ⋅+
(3)
The results of load share ratio from the two analytical equations, FE analysis, and experiments are plotted in Fig. 17. There are four experimental results in the figure: KA2C and KW2C are described previously as Type #0 repair, and KA4C and KW4C specimens, using four slits on patch plates and a thickness of patch plates of 12 mm, are also selected from Ref. 7). It can be found that, firstly, FE analysis results as well as analytical results from Eq. (2) have good agreement with four experimental results. Moreover, due to the assumption introduced, Eq. (2) predicts FE analysis results better when the number of slits is larger as in the case of Type #4 than the repair types with less slits. It is also noted that for all analytical cases considered, there is a negligible difference of about 3% between Eq. (2) and Eq. (3) where welds are regarded to be infinitely stiff. However, Eq. (3) yields a considerable overestimation of about 12% when the assumption of rigid welds is applied to
D
tptb
lslit0Cross section: C3-C3
lslit0
DPtotal
tp
σyp
nnmax
: Width of one patch slit: Outer diameter of the intact pipe: Applied design load: Thickness of patch steels: Characteristic value of yielding stress of patch steels: Number of slits on patch plates : Maximum number of slits on patch plates
(b) Parameters for the maximum number of slits
C1
lwL0
lwL0
lp1
2lr
lp1
C1
C3
C2 C2
(a) Parameters for load share ratio of patch plates
lr
lp1
Ar
Ab
Ap
EKw
Kw0T
Kw0L
lwT
lwL
lwL0
2n
: Half length of the thickness-reduced portion: Overlap length of patch plates on non-reduced pipe: Cross-sectional area of the thickness-reduced base steels: Cross-sectional area of the intact base steels: Cross-sectional area of patch steels: Young’s modulus of patch steels : Stiffness of all fillet welds: Stiffness of transverse fillet welds of per unit length : Stiffness of longitudinal fillet welds of per unit length : Length of transverse fillet welds: Length of longitudinal fillet welds : Length of one weld line of longitudinal fillet welds: Number of longitudinal weld lines
C3
Fig. 16 Parameters used in Eqs. (2) and (7)
-766-

experimental cases. This finding raises a concern that how much error it would
bring into the calculation of load share ratio of patch plates for different pipes by assuming welds to be rigid. To examine the error, an error factor η is introduced as Eq. (4):
* 1100% 100%LSR LSR ELSR B
ηπ ω
−= × = ⋅ × (4a)
p1 r p1r
r b p
( )l l llD
A A Aω
+= + + (4b)
wLw0T w0L
lB K KDπ
= +
(4c)
b r totalwL
b w
A A PlA aσ−
= ⋅ (4d)
where ω is structural size factor, B is weld equivalent stiffness, σw is the characteristic value of weld strength, and a is weld throat size. As an example, the change of η with ω is plotted in Fig. 18 using Ptotal=Py0 and a=4.2 mm. It is found that when the structural size factor ω is larger than, for example, 20, welds can be treated as rigid without introducing a large error in calculating the load share ratio of patch plates, while there is a rapid increase in the error factor η, which can be larger than 10% when ω is smaller than 20.
For example, Pipe 1 in this study has a structural size factor
ω=27 and a corresponding η=3%. When the length of the thickness-reduced portion 2lr changes from 500 mm to 200 mm, and the length of over-patch lp1 changes from 50 mm to 10 mm, the structural size factor ω then becomes 10, resulting in η of 7%. Therefore, it is recommended that 20 be a threshold value of ω to choose an appropriate equation for a load share ratio between Eqs. (2) and (3). 5.2 Minimum Thickness of Patch Plates and
Maximum Number of Slits It was found in Section 4 that by attaching patch plates of
the same thickness as the thickness reduction of the base pipe cannot fully recover the stiffness of the pipe. Once a load share ratio can be predicted using Eq. (2), a proper thickness of patch plates to recover the target stiffness can be determined.
Under an axial loading condition, a repair to recover its stiffness of the corrosion-damaged portion requires patch plates to carry at least the same load as what the missing thickness once carried in the intact pipe pile. Therefore, the load share ratio of patch plates should satisfy Eq. (5):
patch b r
total b b
P A A tLSRP A t
− Δ= ≥ (5)
Solving Eqs. (2) and (5) together, the minimum required thickness of patch plates tpmin can be obtained. As a common strategy used in the design manual, a sacrificial thickness of tps= 2 mm is added to the calculated minimum thickness of patch plates to protect the patches in the harsh offshore environment3). Finally, the thickness of patch plates used in the repair work, tpd, can be determined as:
tpd = tpmin+ tps (6)
Although patch plates with a larger number of slits is favorable to transfer load from base pipe piles to patch plates, the number of slits should not exceed a certain value to avoid an excessive loss of cross-sectional area of patch plates, which would cause steel at the root of patch strips to yield. Hence, the stress in patch steels should satisfy Eq. (7a), where, σp is the axial
0.30
0.35
0.40
0.45
0.50
0.55
0.60
0.65
0.70Pp
atch
/Pto
tal
ExperimentalFEM (with T welds)Analytical (finite Kw)Analytical (infinite Kw)
Pipe 1 Pipe 2 Pipe 3 Pipe 4 Pipe 5 Pipe 6#1 #2 #3 #4 #1 #2 #3 #4 #1 #2 #3 #4 #1 #2 #3 #4 #1 #2 #3 #4 #1 #2 #3 #4K
A2C
KW
2C
KA
4C
KW
4C
Fig. 17 Load share ratio of patch plates
0%2%4%6%8%
10%12%14%16%
0 10 20 30 40 50 60 70 80
Erro
r fac
tor η
Structural size factor ω Fig. 18 Error on load share ratio by assuming welds as rigid
-767-

stress in patch plate, γσy is partial factor for material, and σyp is the characteristic value of yielding stress of patch steels. σp can be calculated by Eq. (7b), where Ptotal is applied design load, and load share ratio of patch plates, LSR, can be determined by Eq. (2) or Eq. (3), whichever appropriate. The cross-sectional area of patch plates at the root of patch strips, Astrip, can be calculated by Eq. (7c). Then the maximum number of slits can be determined by Eq. (7d) when a width of one patch slit, lslit0, is given. Definitions of variables in Eq. (7) are shown in Fig. 16(b).
yp ypσσ γ σ≤ (7a)
patch totalp
strip strip
P P LSRA A
σ = = (7b)
strip p p p slit0( )A t D t nt lπ= + − (7c)
y
totalmax p
slit0 yp p
1 ( ) P LSRn D tl tσ
πγ σ
⎡ ⎤≤ ⋅ + −⎢ ⎥
⎢ ⎥⎣ ⎦
(7d)
6. CONCLUSIONS
This paper first proposed a modeling technique of nonlinear
behavior of fillet welds in FE analysis based on mechanical properties of welds obtained from weld strength tests. Using this weld model, the compressive behavior of thickness-reduced pipe piles repaired with welded patch plates was examined to understand structural performance of pipe piles repaired according to the current repair design manual. Main conclusions of this study are: 1) A repaired type with many slits in patch plates and short
weld lines is a more favorable type for welding repair of pipe piles under compression. However, the number of slits should be limited to avoid yielding of the patch plate.
2) A design equation to accurately estimate a load share ratio of patch plates is proposed by considering stiffness of fillet welds. When the structural size factor ω is larger than 20, fillet welds can be regarded as rigid in the calculation of a load share ratio.
3) A design equation for the minimum thickness of patch plates required to fully recover stiffness to the intact pipe pile level is proposed.
4) The existence of transverse welds does not change structural performance of repaired pipe piles with welded patch plates significantly. Therefore, a repair design procedure for a welding patch plate in the current repair design manual where transverse welds are not counted when designing a total length of fillet weld is appropriate.
5) The proposed weld model is accurate in representing the mechanical behavior of fillet welds and can be used in the analysis of welded structures where a nonlinear behavior of weld may be important.
This study was focused on repairing of steel pipe piles under compression. Structural performance of repaired pipe piles under other loading conditions such as monotonic and cyclic bending will have to be examined next. As another type of piles commonly used in offshore structures, steel sheet piles have a different loading condition and usually have a small width of flange, where the use of many slits on patch plates are not possible. The study on sheet piles also remains as future work. ACKNOWLEDGMENT:
This research was partially supported by The Japan Iron and Steel Federation. The authors would like to acknowledge their supports. The first author also thanks the Chinese government for the scholarship during his doctoral program study in Japan.
References 1) Liu, S., Maintenance and repair welding in the open sea,
Welding Journal, 84(11), pp.54-59, 2005. 2) Wernicke, R. and Billingham, J., Underwater wet repair
welding and strength testing on pipe-patch joints, Journal of Offshore Mechanics and Arctic Engineering, ASME, 120(4), pp.237-242, 1998.
3) Coastal Development Institute of Technology, Port Steel Structure Corrosion-Prevention and Repair Manual (version 2009), Coastal Development Institute of Technology, Japan, 2009 (in Japanese).
4) Coastal Development Institute of Technology, Port Steel Structure Corrosion-Prevention and Repair Manual (version 1997), Coastal Development Institute of Technology, Japan, 1997 (in Japanese).
5) Chen, X., Kitane, Y., and Itoh, Y., Mechanical properties of fillet weld joints by underwater wet welding in repairing corrosion-damaged offshore steel structures, Journal of Structural Engineering, JSCE, 56A. pp.742-755, 2010.
6) Watanabe, N., Kitane, Y., and Itoh, Y., Modeling of joint behavior of steel pipes repaired with steel plate by underwater wet welding, Journal of Structural Engineering, JSCE, 55A, pp.903-914, 2009 (in Japanese).
7) Kitane, Y., Itoh, Y., Watanabe, N., and Matsuoka, K., Compressive and flexural tests of thickness-reduced steel pipes repaired with patch plates using underwater wet welding, Journal of Structural Engineering, JSCE, 55A, pp.889-902, 2009 (in Japanese).
8) Dassault Systèmes Simulia Corp., ABAQUS/Standard user’s manual, version 6.8, 2008.
9) Suzuki, H., Recent Welding Engineering, Corona Publishing Co., Ltd., Tokyo, Japan, 1982 (in Japanese).
10) The Japan Port & Harbour Association, Technical Specifications and Explanations on Port and Harhour Infrastructures, The Japan Port & Harbour Association, Japan, 2007 (in Japanese).
(Received September 16, 2010)
-768-