evaluation of selected numerical weather prediction · pdf fileao agogbuo cn, nwagbara mo,...
TRANSCRIPT
Research Article s
Volume 7 • Issue 4 • 1000491J Environ Anal Toxicol, an open access journalISSN: 2161-0525
Open AccessResearch Article
Journal ofEnvironmental & Analytical Toxicology
Jour
nal o
f Env
ironmental &Analytical Toxicology
ISSN: 2161-0525
Agogbuo et al., J Environ Anal Toxicol 2017, 7:4DOI: 10.4172/2161-0525.1000491
Keywords: Numerical weather prediction; Global modeling; Regional model; Method of objective-based diagnostic evaluation; Dynamic downscaling
IntroductionPrecipitation forecast especially during the onset period is not
a very easy task for weather forecasters owing to the fact that rainfall is a dichotomous weather variable. Numerical weather prediction models have been used since 1946 to forecast precipitation and other atmospheric variables [1]. The use of these NWP models has lead to a considerable advancement in precipitation forecasting. This is largely due to the horizontal grid spacing of a few kilometers of these NWP models expected to reduce further in the coming years [2]. Accurate precipitation forecast is very important considering the fact that extreme rainfall events could lead to devastating effects such as flooding, aviation hazards amongst others. The principal aim of this research is to compare precipitation estimates from 3 global models and a regional model, referenced against satellite estimates combined with station data and to ascertain if a dynamically downscaled global model added value to the precipitation forecast. NWP models show different performance skills for various regions and domains. Therefore, the evaluation of a Numerical Weather Prediction model forecast by comparing it with observed data is key to ascertaining its reliability over a particular place. Ghelli et al. [3] have also noted that forecast verification provides the forecast userswith uncertainty information that helps them in their decision making.However, before evaluating a weather forecast, two key things areconsidered, the first is the type of weather parameter and the secondis the evaluation method to be used [4]. In this study user oriented andmodel oriented evaluation methods are used. While the user orientedevaluation method which compares model forecast directly with station data is subjective, the model oriented evaluation which compares model forecast against a gridded observation is objective. Validation of modelforecast against observed data is considered essential to ascertain thereliability of the modeled data at regional scale [5]. However, comparing model forecast and station data alone does not yield reliable result.
Several studies have revealed that incorporation of satellite observations improves the accuracy of evaluation results [6]. Satellite observations are also important to compensate for areas having a poor density of synoptic stations. Burkhardt Rockel et al. confirmed that dynamic downscaling does not necessarily retain or increase simulation skill of global model fields. Also, Castro et al. [7] did a work on dynamic downscaling and found out that only high-resolution landscape features could actually bring new information into regional model integration. In this paper, the WRF ems model is used to dynamically downscale the global model with the poorest performance skill using the type 1 downscaling technique proposed by Castro et al. [7]. In type 1 dynamic downscaling, the initial and lateral boundary conditions are used for simulation of the regional model. Three crucial issues are usually considered when dynamically downscaling a global field, these are, domain size, lateral boundary conditions and grid spacing [8]. It is also important that the circulation patterns at different levels of the atmosphere as predicted by the NWP models are verified against a reliable data assimilation system. The Global Data Assimilation System (GDAS) is used in this study. The GDAS shows the actual state of the atmosphere at the time of occurrence of the weather event and therefore, gives a diagnostic evaluation of the event.
Evaluation of Selected Numerical Weather Prediction Models for a Case of Widespread Rainfall over Central and Southern NigeriaChibuzo N Agogbuo1,3*, Moses O Nwagbara2, Endalkachew Bekele3 and Aremu Olusegun4
1National Weather Forecasting and Climate Research Center, Abuja, Nigeria2Michael Okpara University of Agriculture, Umudike, Abia, Nigeria3NOAA Center for Weather and Climate Prediction, Maryland, USA4National Weather Forecasting and Climate Research Center, Abuja, Nigeria
AbstractPrecipitation forecasts from four Numerical Weather Prediction (NWP) models are evaluated for a case of
widespread rainfall event over Central and Southern Nigeria on the 21st of March 2015. The four models evaluated are the European Centre for Medium Range Weather Forecast (ECMWF) with a resolution of 25 km, The UKMET model 20 km, NCEP Global Forecast System (GFS) 50 km and the Weather Research and Forecast Model (WRF) with 10 km resolution. Precipitation forecasts are compared with observed precipitation at station and gridded observation points for different rainfall amount thresholds using the Method of Objective-based Diagnostic Evaluation (MODE), Grid statistics and Point Statistics. The global models ECMWF, UKMET and GFS underestimated the rainfall amount when compared to the WRF regional model. The global models recorded a critical success index (CSI) of less than 10% while the regional WRF model recorded a critical success index of 40% for rainfall amount greater than 25 mm. MODE analysis showed that the WRF model also recorded a 93% relationship between observed and forecast precipitation events of 21st March 2015 over Nigeria when compared with the ECMWF, UKMET and GFS models which showed 88%, 88% and 87% relationship respectively. Our findings suggest that dynamically downscaling a global model using the WRF model added value and gave a better skill of precipitation forecast for the event under study.
*Corresponding author: Chibuzo N Agogbuo, NOAA Center for Weatherand Climate Prediction, Maryland, USA, Tel: +2348035813534; E-mail:[email protected]
Received July 11, 2017; Accepted July 15, 2017; Published July 20, 2017
Citation: Agogbuo CN, Nwagbara MO, Bekele E, Olusegun A (2017) Evaluation of Selected Numerical Weather Prediction Models for a Case of Widespread Rainfall over Central and Southern Nigeria. J Environ Anal Toxicol 7: 491. doi: 10.4172/2161-0525.1000491
Copyright: © 2017 Agogbuo CN, et al. This is an open-access article distributed under the terms of the Creative Commons Attribution License, which permits unrestricted use, distribution, and reproduction in any medium, provided the original author and source are credited.

Citation: Agogbuo CN, Nwagbara MO, Bekele E, Olusegun A (2017) Evaluation of Selected Numerical Weather Prediction Models for a Case of Widespread Rainfall over Central and Southern Nigeria. J Environ Anal Toxicol 7: 491. doi: 10.4172/2161-0525.1000491
Page 2 of 9
Volume 7 • Issue 4 • 1000491J Environ Anal Toxicol, an open access journalISSN: 2161-0525
Materials and MethodsMaterials
The data used in this study consist of observed rainfall data collected from 42 gauge stations across Nigeria for the 21st of March 2015 and precipitation forecast from the European Centre for Medium Range Weather Forecast (ECMWF), UK Met office, Global Forecast System of NCEP (GFS) and the Weather Research and Forecast (WRF version 3.4.1) models for the 21st of March 2015 (Table 1). The available gauge stations are unevenly distributed and sparse as seen in Figure 1, this usually brings a limitation to the quality of data. To overcome this limitation, satellite proxies particularly rainfall estimates are better used as alternatives because of their availability even over remote areas [9,10]. There were gaps in the gauge observation when compared to widespread heavy rainfall on satellite estimate (Figure 2). To compensate for the observed gaps CPC rainfall estimate was combined with the gauge observation. The combined observation data (Figure 3) are used for the model oriented evaluation of this study.
Methods
The performance skill of Numerical Weather Prediction (NWP) precipitation forecast varies in space and time. Therefore, any evaluation of NWP precipitation forecast should be aimed at reflecting this attribute (Shrestha et al.). It is recommended by World Weather Research Program (WWRP 2008) that evaluation of NWP models is done both against gridded observations which is model oriented and station observations which are user oriented. Model oriented evaluation involves processing observation data to match the temporal and spatial scales of the model while user oriented evaluation uses station observation to evaluate model forecasts. This study adopts a similar approach by evaluating the NWP model forecasts against station and gridded observations. Station-based evaluation was done by comparing the station rainfall amount and NWP precipitation amounts using the nearest neighbor approach (The NWP grid cell nearest to the rainfall Station). This method is simple but suffers limitations due to unevenly and irregularly spaced measurement stations which may create some bias [11]. However, this direct comparison facilitates the understanding of performance skill of NWP models from a user’s perspective. Also, the GFS global model which recorded the least performance skill was dynamically downscaled using the WRF model. The dynamic downscaling technique used in this study is the type 1 proposed by Castro et al. [7] where the initial and lateral boundary conditions of the global model are used to initialize the regional model. Also, the WRF simulation was done without a cumulus scheme while the microphysics scheme used is the Lin et al. scheme which is suitable for high resolution simulations less than 15 km. The user oriented evaluation method used in this study is represented by the contingency table as shown in Table 2 from which some evaluation scores such as Accuracy and bias were obtained.
The verification scores that are obtainable from the contingency table above are defined below:
1. Accuracy: The level of agreement between forecast and observed
HITS CORRECT NEGATIVESAccuracyTotal
+=
2. Bias: Compares the forecast and observed frequency of YES events
HITS FALSE ALARMBiasHITS MISSES+
=+
Critical Success Index (CSI) was also used in this study. The CSI answers the question on how well the forecast “yes” events corresponds with the observed “yes” events (WWRP 2008). Since precipitation forecast is a dichotomous (yes/no) forecast, the CSI is a good metric for this verification. The model oriented evaluation methods used in this study are the Grid statistics which compares a grid point in the observation field against a grid point in the forecast field and the Method of Objective-based Diagnostic Evaluation (MODE). The Mode evaluates the forecast and observation in terms of spatial bias and also gives the level of relationship between forecast and observed events. The MODE tool addresses the problem of double penalty commonly associated with forecast verification. The MODE defines, matches and compares weather events in the observation and forecast fields and then uses a fuzzy logic to establish a relationship in percentage between these events. The MODE also gives a Post Script plot containing a summary of the features and matching between forecast and observed events.
Results and DiscussionThe first step in this evaluation involves the user oriented evaluation
where the forecast fields of the Numerical Weather Prediction Models are compared directly with the Observation field while in the second approach, Model oriented evaluation, and Model Evaluation Tools (MET) are used.
Comparison of NWP forecast with observation
Global models versus observation: Figure 4 shows the map of 24-hour NWP precipitation forecast of three global models (NCEP-GFS, ECMWF and UKMET) and the observation. The areas in red are areas of high rainfall while the areas in green are areas of relatively low rainfall. The figure reveals that the three global models failed to predict heavy rainfall over Central and Southern Nigeria. They underestimated the rainfall event over the region. However, the ECMWF did better than the other two models in predicting light to moderate rainfall in the region.
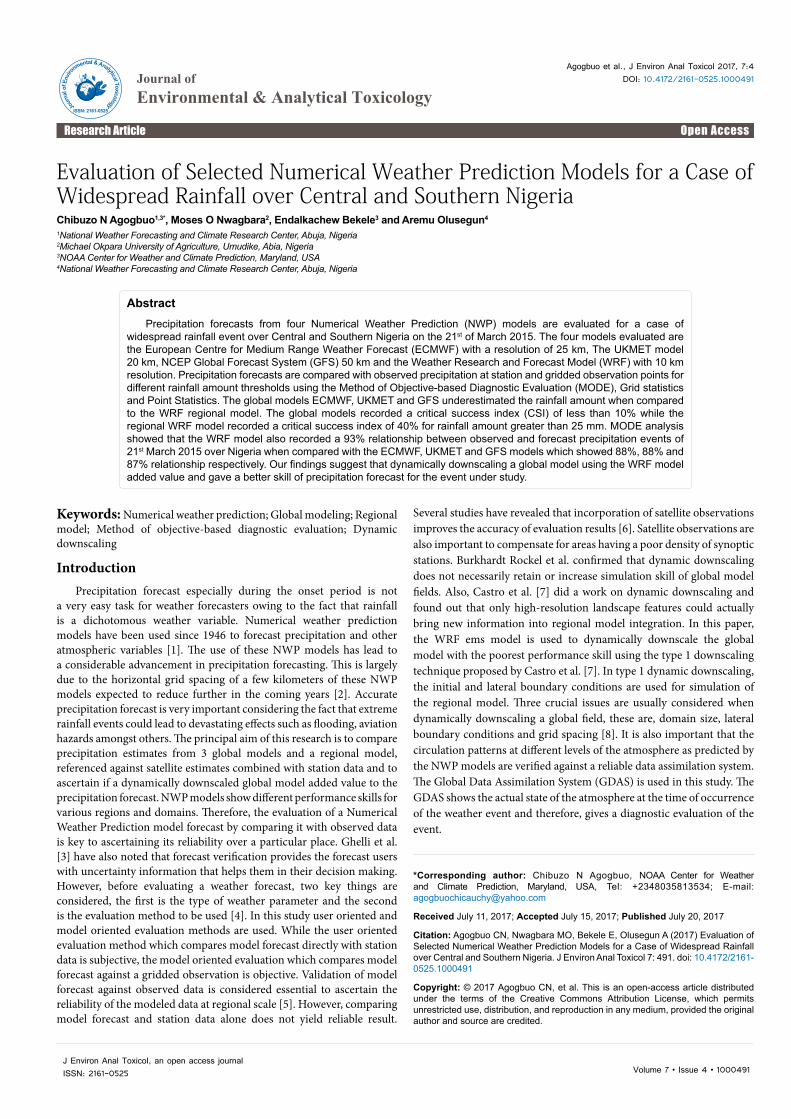
WRF model versus observation: The GFS forecast was dynamically downscaled using the WRF model with resolutions of 20 km, 15 km and 10 km as shown in Figure 5. The Pan-Fries convective parameterization scheme was used for WRF 15 km and WRF 20 km while convection was turned off for the 10 km simulation as recommended in the WRF model configuration set up. Dynamical downscaling was done using the same initial and lateral boundary condition of the GFS model but with increased resolution. The figure shows that the rainfall forecasts were improved using the WRF model. Also, the figure reveals that WRF at 10 km resolution was able to predict heavy rainfall in some places within the region. Further analysis reveals that the WRF model at the top of the boundary layer showed higher upward motion when compared to the global models. This is a possible reason why the WRF was able to predict the high intensity rainfall over the region. Figure 5 however is for eye ball verification and therefore is subjective to an extent. A more objective and quantitative approach is discussed later in this work in Method of Objective based Diagnostic Evaluation (MODE).
Categorical verification scores of NWP models: Table 3 shows the verification scores for the Numerical Weather Prediction models evaluated in this study. The table shows that though the ECMWF and the WRF 10 km have the highest bias of 74%, the recorded the highest accuracy of 69%.
Point statistics: The point statistics match points on the forecast field to points on the observation field. It generates some metrics such as accuracy, Bias, Critical Success Index (SCI) among others. The point statistics metric that was used in this study is the CSI. This is considered

Citation: Agogbuo CN, Nwagbara MO, Bekele E, Olusegun A (2017) Evaluation of Selected Numerical Weather Prediction Models for a Case of Widespread Rainfall over Central and Southern Nigeria. J Environ Anal Toxicol 7: 491. doi: 10.4172/2161-0525.1000491
Page 3 of 9
Volume 7 • Issue 4 • 1000491J Environ Anal Toxicol, an open access journalISSN: 2161-0525
Station No. Station Name Longitude Latitude Gauge ECMWF GFS UKMET WRF1 Abeokuta 3.33 7.17 21.7 24.5328 24.084 5.19534 14.942 Abuja 7 9.25 14.3 1.7253 0.108 3.47434 0.64083 Abakiliki 8.7 6.41 0 12.8998 2.5704 4.44436 12.82324 Akure 5.3 7.2 12.5 11.7665 11.2968 6.00737 14.26325 Asaba 6.82 6.23 108 11.6541 7.5276 7.12814 12.50646 Awka 7.05 6.2 6.1 10.0197 7.5276 7.03404 14.86087 Bauchi 9.82 10.28 17 0 0 0.047249 08 Bida 6 9.8 21.4 22.6475 8.9532 6.298 12.88449 Benin 5.6 6.33 13.7 1.41195 0.108 0.879471 0
10 Ekiti 7.95 4.4 11.8 5.35633 0 3.38843 011 Enugu 7 6.5 32.5 11.0617 2.376 7.82405 14.90412 Gombe 11.15 10.28 0 0 0 0.072208 013 Gusau 6.77 12.17 0 0 0 0.000736 014 Ibadan 3.9 7.43 18.3 17.5858 5.5296 3.43922 12.682815 Ijebu 3.93 6.83 18 9.5163 20.5308 9.31079 3.848416 IKE 3.33 6.58 15.9 3.89045 3.564 3.93267 017 Ilorin 4.58 8.48 0.01 7.80757 0.864 4.58748 5.38218 Iseyin 3.6 7.97 7.1 13.2933 13.068 7.18406 9.698419 Jos 8.9 9.63 0 0.0009232 0.8856 5.42749 020 Kaduna 7.45 10.6 0 0 0 1.22863 021 Kano 8.53 12.05 0 0 0 0 022 Katsina 7.68 13.02 0 0 0.1512 0 023 Lafia 8.5 8.49 0 0.589172 0 1.98154 5.032824 Lokoja 6.73 7.8 0 1.32364 11.664 5.20187 5.68825 Makurdi 9 8 0 2.23084 0 2.32439 6.159626 Mina 6.54 9.56 0 0.730408 0 1.76326 0.34227 Nguru 10.47 12.88 0 0 0 0 028 Ogoja 8.8 6.7 0 7.45315 5.346 6.6078 8.589629 Ondo 4.83 7.1 11.2 18.6485 8.478 3.59456 20.919630 Oshodi 3.5 6.3 25.5 5.59056 3.564 0.85453 031 Oshogbo 4.5 7.82 37 12.8034 9.6228 2.30605 9.673232 Owerri 7.03 5.48 17.2 7.60641 6.2208 7.4768 6.17433 Portharcourt 7.12 4.85 11.5 8.22262 1.836 4.2039 13.503634 Potiskum 11.03 11.7 0 0 0 0 035 Shaki 3.47 8.35 24.4 10.0023 3.348 6.91553 13.114836 Sokoto 5.2 12.92 0 0 0 0.000938 037 Umuahia 7.48 5.13 7.9 15.1595 9.4716 6.03031 15.9338 Yelwa 4.5 11 0 0 0 1.13735 039 Yola 12.47 9.23 0 0 1.1232 0.001064 040 Zaria 7.75 11.07 0 0 0 1.05944 041 Ado Ekiti 5.12 7.42 21.1 12.8229 8.0676 5.57582 21.344442 USI Ekiti 5.18 7.84 0 8.73002 10.8972 3.16604 14.0184
Table 1: Observed rainfall data from 42 gauge stations across Nigeria for the 21st of March 2015 and precipitation forecast from the European Centre for Medium Range Weather Forecast (ECMWF), UK Met Office, Global Forecast System (GFS) and the Weather Research and Forecast (WRF) models for the 21st of March 2015.
ObservedYes No Total
ForecastYes Hits False alarm Forecast yesNo Misses Correct negatives Forecast no
Total Observed yes Observed no Total
Table 2. Contingency table of binary event for categorical verification scores.
Accuracy BiasNCEP-GFS 55 32
ECMWF 69 74UKMET 55 16
WRF 10 Km 69 74
Table 3: Verification scores for NWP models.
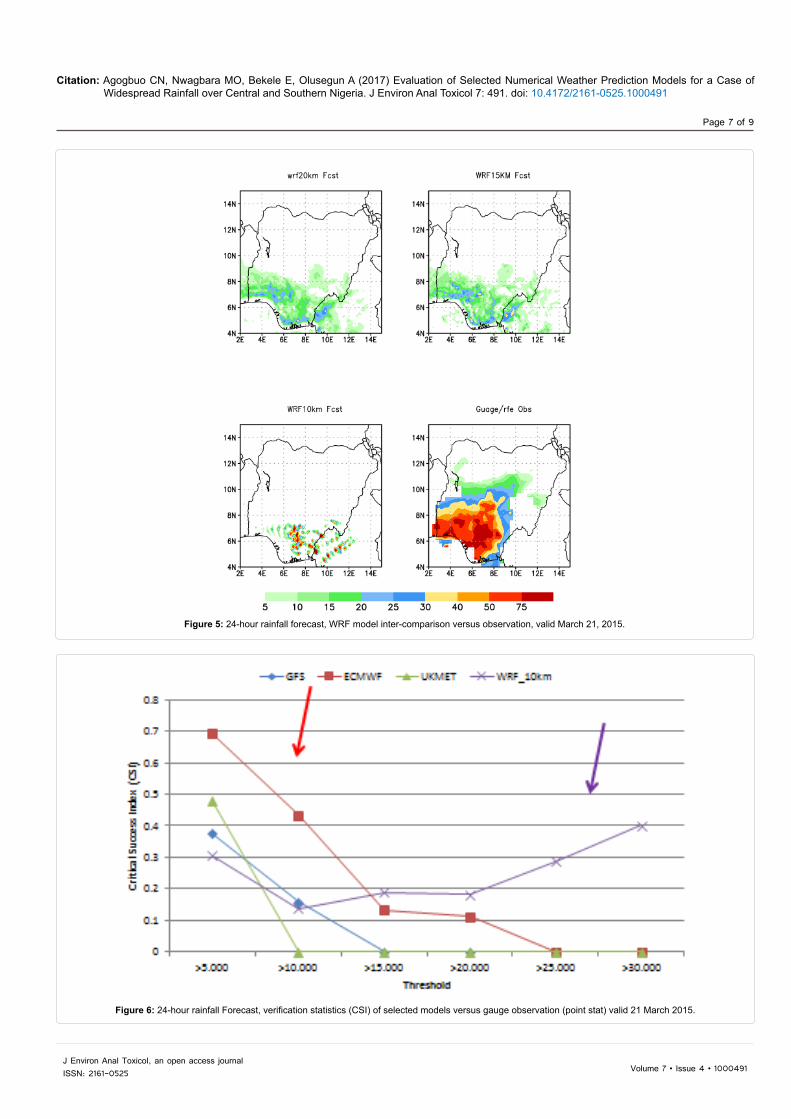
a good metric for yes or no events such as precipitation. Figure 6 shows the point Statistics map of the NWP models when compared with the
gauge observation. The map shows the Critical Success Index (CSI) values of the models for different rainfall amount thresholds. Rainfall

Citation: Agogbuo CN, Nwagbara MO, Bekele E, Olusegun A (2017) Evaluation of Selected Numerical Weather Prediction Models for a Case of Widespread Rainfall over Central and Southern Nigeria. J Environ Anal Toxicol 7: 491. doi: 10.4172/2161-0525.1000491
Page 4 of 9
Volume 7 • Issue 4 • 1000491J Environ Anal Toxicol, an open access journalISSN: 2161-0525
Figure 1: Map of the study area showing the locations of the meteorological stations.

Citation: Agogbuo CN, Nwagbara MO, Bekele E, Olusegun A (2017) Evaluation of Selected Numerical Weather Prediction Models for a Case of Widespread Rainfall over Central and Southern Nigeria. J Environ Anal Toxicol 7: 491. doi: 10.4172/2161-0525.1000491
Page 5 of 9
Volume 7 • Issue 4 • 1000491J Environ Anal Toxicol, an open access journalISSN: 2161-0525
Figure 2: CPC satellite observation (RFE) top and gauge observation (bottom) on 21/03/2015 over Nigeria.

Citation: Agogbuo CN, Nwagbara MO, Bekele E, Olusegun A (2017) Evaluation of Selected Numerical Weather Prediction Models for a Case of Widespread Rainfall over Central and Southern Nigeria. J Environ Anal Toxicol 7: 491. doi: 10.4172/2161-0525.1000491
Page 6 of 9
Volume 7 • Issue 4 • 1000491J Environ Anal Toxicol, an open access journalISSN: 2161-0525
Figure 3: Combined satellite/Gauge rainfall observation on 21/03/2015 over Nigeria.
Figure 4: 24-hour rainfall forecast, global model inter-comparison versus observation valid March 21, 2015.
Citation: Agogbuo CN, Nwagbara MO, Bekele E, Olusegun A (2017) Evaluation of Selected Numerical Weather Prediction Models for a Case of Widespread Rainfall over Central and Southern Nigeria. J Environ Anal Toxicol 7: 491. doi: 10.4172/2161-0525.1000491
Page 7 of 9
Volume 7 • Issue 4 • 1000491J Environ Anal Toxicol, an open access journalISSN: 2161-0525
Figure 5: 24-hour rainfall forecast, WRF model inter-comparison versus observation, valid March 21, 2015.
Figure 6: 24-hour rainfall Forecast, verification statistics (CSI) of selected models versus gauge observation (point stat) valid 21 March 2015.

Citation: Agogbuo CN, Nwagbara MO, Bekele E, Olusegun A (2017) Evaluation of Selected Numerical Weather Prediction Models for a Case of Widespread Rainfall over Central and Southern Nigeria. J Environ Anal Toxicol 7: 491. doi: 10.4172/2161-0525.1000491
Page 8 of 9
Volume 7 • Issue 4 • 1000491J Environ Anal Toxicol, an open access journalISSN: 2161-0525
thresholds of 5, 10, 15, 20, 25 and 30 mm were used. The figure reveals that the GFS and the UKMET showed poor skills in predicting rainfall amount in excess of 5 mm for the case under study while the ECMWF (red) was better for rainfall thresholds between 5-15 mm. Also, the WRF model was better in predicting rainfall above 20 mm having recorded a critical Success index of 40% when compared with the other models.
Model oriented evaluation of NWP ModelsGrid statistics: The grid statistics match events on the forecast
grid against events on the observation grid box. Figure 7 shows the grid statistics map of Critical Success Index of the Numerical weather prediction Models when compared with the combined observation. From the figure, The ECMWF has a higher CSI for rainfall threshold between 5 and 18 mm while the WRF model was better for heavier rainfall values greater than 18 mm.
Method of Objective based Diagnostic Evaluation (MODE): The MODE matches events on the forecast field against events on the observation field and establishes a relationship in percentage between forecast and observation using a fuzzy logic. This Tool is objective and unique for the fact that it’s never in a hurry to discard a forecast model if it fails to predict an event over a particular place. It looks out for possibility of spatial misplacement of events and tries to generate a correction for that. Different rainfall thresholds are considered in this analysis. For the GFS and UKMET models rainfall of over 10 mm
Figure 7: 24-hour rainfall Forecast, verification statistics (CSI) of selected models versus Combined Observation (Grid stat) valid 21 March 2015.
Figure 8: MODE analysis of 24 Hr forecast GFS versus Combined Observation.
Figure 9: Mode analysis of 24-hour forecast, UKMET versus Combined Observation.
Figure 10: Mode analysis of 24-hour forecast, ECMWF versus Combined Observation.
was chosen. Figure 8 shows the MODE analysis plot for the NCEP-GFS forecast of 21 March 2015. The red polygons (middle left and middle right) are areas of 10 mm and above rainfall in the forecast and observation events. Despite the difference in the sizes of the polygons, MODE analysis found 87% relationship between the forecast and the observed. In Figure 9, the Mode analysis for the UKMET model forecast for rainfall of 10 mm and above reveals that there is 88% relationship between forecast and observed event.
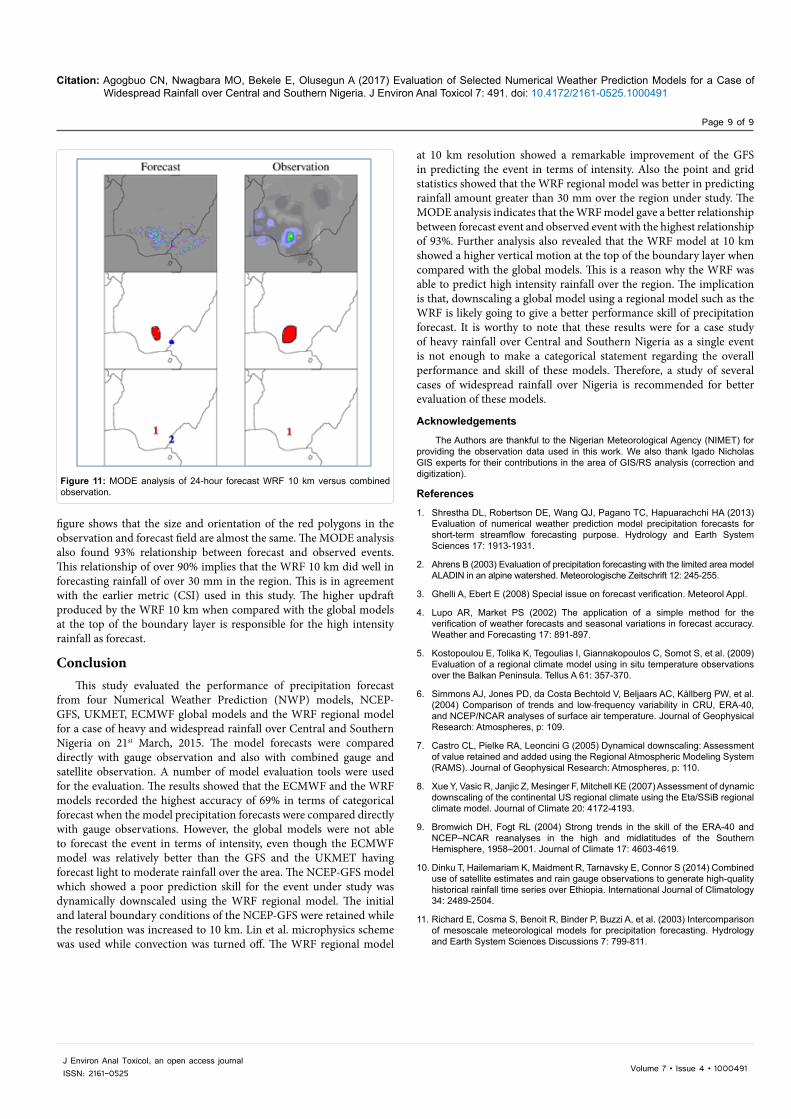
Figure 10 shows the MODE analysis for the ECMWF model precipitation forecast for rainfall amount of 25 mm and above. Despite the differences in size and orientation of the polygons, 88% relationship between forecast and observed was established. The 30 mm and above rainfall events in WRF 10 km forecast and observation are shown in red shaded polygons (middle left and middle right) of Figure 11. The
Citation: Agogbuo CN, Nwagbara MO, Bekele E, Olusegun A (2017) Evaluation of Selected Numerical Weather Prediction Models for a Case of Widespread Rainfall over Central and Southern Nigeria. J Environ Anal Toxicol 7: 491. doi: 10.4172/2161-0525.1000491
Page 9 of 9
Volume 7 • Issue 4 • 1000491J Environ Anal Toxicol, an open access journalISSN: 2161-0525
Figure 11: MODE analysis of 24-hour forecast WRF 10 km versus combined observation.
figure shows that the size and orientation of the red polygons in the observation and forecast field are almost the same. The MODE analysis also found 93% relationship between forecast and observed events. This relationship of over 90% implies that the WRF 10 km did well in forecasting rainfall of over 30 mm in the region. This is in agreement with the earlier metric (CSI) used in this study. The higher updraft produced by the WRF 10 km when compared with the global models at the top of the boundary layer is responsible for the high intensity rainfall as forecast.
ConclusionThis study evaluated the performance of precipitation forecast
from four Numerical Weather Prediction (NWP) models, NCEP-GFS, UKMET, ECMWF global models and the WRF regional model for a case of heavy and widespread rainfall over Central and Southern Nigeria on 21st March, 2015. The model forecasts were compared directly with gauge observation and also with combined gauge and satellite observation. A number of model evaluation tools were used for the evaluation. The results showed that the ECMWF and the WRF models recorded the highest accuracy of 69% in terms of categorical forecast when the model precipitation forecasts were compared directly with gauge observations. However, the global models were not able to forecast the event in terms of intensity, even though the ECMWF model was relatively better than the GFS and the UKMET having forecast light to moderate rainfall over the area. The NCEP-GFS model which showed a poor prediction skill for the event under study was dynamically downscaled using the WRF regional model. The initial and lateral boundary conditions of the NCEP-GFS were retained while the resolution was increased to 10 km. Lin et al. microphysics scheme was used while convection was turned off. The WRF regional model
at 10 km resolution showed a remarkable improvement of the GFS in predicting the event in terms of intensity. Also the point and grid statistics showed that the WRF regional model was better in predicting rainfall amount greater than 30 mm over the region under study. The MODE analysis indicates that the WRF model gave a better relationship between forecast event and observed event with the highest relationship of 93%. Further analysis also revealed that the WRF model at 10 km showed a higher vertical motion at the top of the boundary layer when compared with the global models. This is a reason why the WRF was able to predict high intensity rainfall over the region. The implication is that, downscaling a global model using a regional model such as the WRF is likely going to give a better performance skill of precipitation forecast. It is worthy to note that these results were for a case study of heavy rainfall over Central and Southern Nigeria as a single event is not enough to make a categorical statement regarding the overall performance and skill of these models. Therefore, a study of several cases of widespread rainfall over Nigeria is recommended for better evaluation of these models.
Acknowledgements
The Authors are thankful to the Nigerian Meteorological Agency (NIMET) for providing the observation data used in this work. We also thank Igado Nicholas GIS experts for their contributions in the area of GIS/RS analysis (correction and digitization).
References
1. Shrestha DL, Robertson DE, Wang QJ, Pagano TC, Hapuarachchi HA (2013)Evaluation of numerical weather prediction model precipitation forecasts forshort-term streamflow forecasting purpose. Hydrology and Earth System Sciences 17: 1913-1931.
2. Ahrens B (2003) Evaluation of precipitation forecasting with the limited area modelALADIN in an alpine watershed. Meteorologische Zeitschrift 12: 245-255.
3. Ghelli A, Ebert E (2008) Special issue on forecast verification. Meteorol Appl.
4. Lupo AR, Market PS (2002) The application of a simple method for theverification of weather forecasts and seasonal variations in forecast accuracy. Weather and Forecasting 17: 891-897.
5. Kostopoulou E, Tolika K, Tegoulias I, Giannakopoulos C, Somot S, et al. (2009) Evaluation of a regional climate model using in situ temperature observationsover the Balkan Peninsula. Tellus A 61: 357-370.
6. Simmons AJ, Jones PD, da Costa Bechtold V, Beljaars AC, Kållberg PW, et al. (2004) Comparison of trends and low‐frequency variability in CRU, ERA‐40, and NCEP/NCAR analyses of surface air temperature. Journal of GeophysicalResearch: Atmospheres, p: 109.
7. Castro CL, Pielke RA, Leoncini G (2005) Dynamical downscaling: Assessment of value retained and added using the Regional Atmospheric Modeling System (RAMS). Journal of Geophysical Research: Atmospheres, p: 110.
8. Xue Y, Vasic R, Janjic Z, Mesinger F, Mitchell KE (2007) Assessment of dynamic downscaling of the continental US regional climate using the Eta/SSiB regional climate model. Journal of Climate 20: 4172-4193.
9. Bromwich DH, Fogt RL (2004) Strong trends in the skill of the ERA-40 andNCEP–NCAR reanalyses in the high and midlatitudes of the SouthernHemisphere, 1958–2001. Journal of Climate 17: 4603-4619.
10. Dinku T, Hailemariam K, Maidment R, Tarnavsky E, Connor S (2014) Combined use of satellite estimates and rain gauge observations to generate high-quality historical rainfall time series over Ethiopia. International Journal of Climatology 34: 2489-2504.
11. Richard E, Cosma S, Benoit R, Binder P, Buzzi A, et al. (2003) Intercomparison of mesoscale meteorological models for precipitation forecasting. Hydrologyand Earth System Sciences Discussions 7: 799-811.