evaluation of service infrastructure … · results of further analysis laid the foundation in the...
TRANSCRIPT
International Journal of Civil Engineering, Construction and Estate Management
Vol.6, No.2, pp.46-58, July 2018
___Published by European Centre for Research Training and Development UK (www.eajournals.org)
46
ISSN 2055-6578(Print), ISSN 2055-6586(online)
EVALUATION OF SERVICE INFRASTRUCTURE INFORMATION PASTEUR
TOLL GATE
Julhizar Lingga Pratama and Mei Sutrisno
Politeknik Negeri Bandung
ABSTRACT: The long queue that took place at the Pasteur toll gate caused inconvenience
for users of the Pasteur toll gate. The length of the queue is one of the impact of the imbalance
between service time and the number of vehicles. To overcome the queue length problem at
Pasteur toll gate, it is necessary to evaluate the capacity and service time. In the evaluation
process used queue simulation to obtain the optimum number of toll booth and the length of
the queue space needed as a solution of the problems that occur. Solutions obtained from the
results of further analysis laid the foundation in the geometric design of the Pasteur toll gate.
the result is that the need of toll booth at Pasteur toll gate is 10 toll booth both for toll gate
entrance and exit gate. For the projection result until 2027, it takes a substation of 14 toll booth
on each gate.
KEYWORDS: Simulation Queue, Number of Toll Booth, Toll Gate Geometry
INTRODUCTION
The unbalanced condition between the number of incoming and outgoing toll gates with service
time led to long queues during peak hours at the Pasteur toll gate, thus causing inconvenience
for users of the Pasteur toll gate. To improve the effectiveness and efficiency of the function
of Pasteur toll gate, the need for a solution in the form of designing the improvement of service
infrastructure at Pasteur toll gate in several variables such as the number of service toll booth.
LITERATURE
The theory used in this study refers to the results of research on "Level of Service Analysis of
Toll Plazas on Freeway Main Lines". where in the research is trying to evaluate the
performance of a toll gate with the main parameters of vehicle queue length by considering the
volume parameters and capacity of the toll gate.
METHODOLOGY
The purpose of Pasteur toll gate evaluation is to find out the optimal number of toll booths
required based on the number of vehicles crossing the Pasteur toll gate. The output of the queue
simulation used to evaluate the Pasteur toll gate is the number of toll booth, the average length
of the vehicle queue, the average time in the system which is a cumulative of the average time
in the queue and the average service time as well as the length of the queue space. In the
evaluation process there are several analysis steps that need to be done, the following
explanation,
International Journal of Civil Engineering, Construction and Estate Management
Vol.6, No.2, pp.46-58, July 2018
___Published by European Centre for Research Training and Development UK (www.eajournals.org)
47
ISSN 2055-6578(Print), ISSN 2055-6586(online)
1. The first stage of evaluation is conducted to find out the output parameters of the
simulation results of the existing condition, where the parameters of the number of toll
booth which are the output parameters are used as input parameters with the service time
parameters and the number of vehicles. The results of the analysis in the first stage is how
long the average queue that occurs, how much time average in the system experienced by
the vehicle, as well as how long the queue space needs. Previous studies (Lin & Su, 1994)
on the queue simulation which is the main variable is the length of the queue, the following
equations are used,
𝐿 = 0, 𝑖𝑓 𝑉
𝐶≤ 0,5 (2.1)
𝐿 = 7𝑉
𝐶− 3,5 𝑖𝑓 0,5 ≤
𝑉
𝐶≤ 0,93 (2.2)
𝐿 = 3 [1 + 6,29 (𝑉
𝐶− 0,93) (
𝐶 × 3600
360− 1)] [1 + (14
𝑉
𝐶− 13)
2
𝑡]
𝑖𝑓 𝑉
𝐶≥ 0,93 (2.3)
In addition to the length of the queue, in this simulation we can obtain the maximum queue
length data value to determine the Toll Plaza design, to obtain the maximum queue length
value, the equation is used as follows
𝐿𝑚𝑎𝑥 = 7 + 1.7𝐿, 𝑖𝑓 𝐿 ≤ 10 (2.4)
and
𝐿𝑚𝑎𝑥 = 11 + 1.3𝐿, 𝑖𝑓 𝐿 > 10 (2.5)
Explanation,
L = System queue length, vehicle
V = volume / number of vehicle (λ), vehicle/second
C = Capacity, vehicle/second
t = durasi, jam
𝑇 = 1605+3250𝐿
𝐶 if L ≤ 15 (2.6)
𝑇 = 8748+2776𝐿
𝐶 if L > 15 (2.7)
𝐶 = 60
𝑆𝑇 (2.8)

International Journal of Civil Engineering, Construction and Estate Management
Vol.6, No.2, pp.46-58, July 2018
___Published by European Centre for Research Training and Development UK (www.eajournals.org)
48
ISSN 2055-6578(Print), ISSN 2055-6586(online)
Explanation,
T = average time in system, second
L = average queue length, vehicle
C = Capacity of toll both, vehicle/hour
ST = service time, second
Vehicle arrival delay time can be calculated by equation,
𝑑 = 0,92𝑇 (2.9)
𝑑 =2,060+2,980𝐿
𝐶 𝑖𝑓 𝐿 ≤ 15 (2.10)
𝑑 =8,244+2,570𝐿
𝐶 𝑖𝑓 𝐿 ≥ 15 (2.11)
Explanation,
d = delay time of arrival of vehicle, second
T = average time in system, second
L = average queue length, vehicle
C = Capacity of toll both, vehicle/hour
To calculate the required number of gates the equations are used,
𝑁𝑖 =𝐹𝑖
𝐶𝑖(𝑉
𝐶)
𝑖
(2.12)
Explanation,
N = number of toll booth needed, unit
V = volume / number of vehicle (λ), vehicle/second
C = Capacity of toll both, vehicle/hour
F = Design of vehivle flow, vehicle/hour
2. After the first stage is finish, the next is verification of the simulation results with real
conditions that occur at the toll gate associated with the queue length parameters and the
average delay time in the system. The real conditions occurring at the toll booths are the
number of vehicles per 15 minutes for one hour, as well as the time delay in the system
from multiple vehicle samples over the course of an hour, as well as the average queue
length that occurs within one hour, real condition data in the field taken at the same time
both day and hour.

International Journal of Civil Engineering, Construction and Estate Management
Vol.6, No.2, pp.46-58, July 2018
___Published by European Centre for Research Training and Development UK (www.eajournals.org)
49
ISSN 2055-6578(Print), ISSN 2055-6586(online)
From the verification result to the next real condition compared with the simulation result
on the queue length and time delay parameters in the system, if there is any difference then
calibration is necessary. if there is no difference in the results of both, it can be concluded
that the queue simulation is in accordance with real conditions at the toll gate pasteur. The
calibration will produce a constant aka multiplied by the equation to calculate the queue
length and time delay in the system.
3. After calibration, use the simulation that has been added to the calibration constant
constants to analyze the next step is to evaluate the need for optimal number of toll booth
on the Pasteur toll gate. Having obtained the output of the analysis of the number of toll
booth, the length of the queue and the time delay in the system, compared with the
minimum service standards for the queue length queue is in accordance with the minimum
service standards of toll roads.
If the length of the queue does not meet the requirements of the minimum toll road service
standards, it is necessary to evaluate the substation capacity, whether the service system
composition is used in the substation, or improve the service system used in terms of the
use of technology to increase the speed of transactions at toll booths.
RESULTS AND DISCUSSION
At the time of evaluating the toll gate of Pasteur both toll gate entrance and exit gate of toll.
Input data used is the number of vehicles during peak hours and time average pelayananan at
toll gate Pasteur. for the data of the number of vehicles used is the maximum number of vehicles
during peak hours of data on the number of vehicles per hour from October to December 2017.
For the number of vehicles obtained value of 2047 vehicles at the entrance gate tolls and 2557
vehicles at the exit gate, 10.52 seconds. Table 4.1 shows the results of the analysis on the
Pasteur toll gate after the service system implemented e-toll on all toll booths. At the gate
entrance of the average queue length of the line is 42 vehicles with an average time in the
system of 366 seconds, while at the exit gate, the average queue length is 3 vehicles with the
average time in the system for 50 seconds.
International Journal of Civil Engineering, Construction and Estate Management
Vol.6, No.2, pp.46-58, July 2018
___Published by European Centre for Research Training and Development UK (www.eajournals.org)
50
ISSN 2055-6578(Print), ISSN 2055-6586(online)
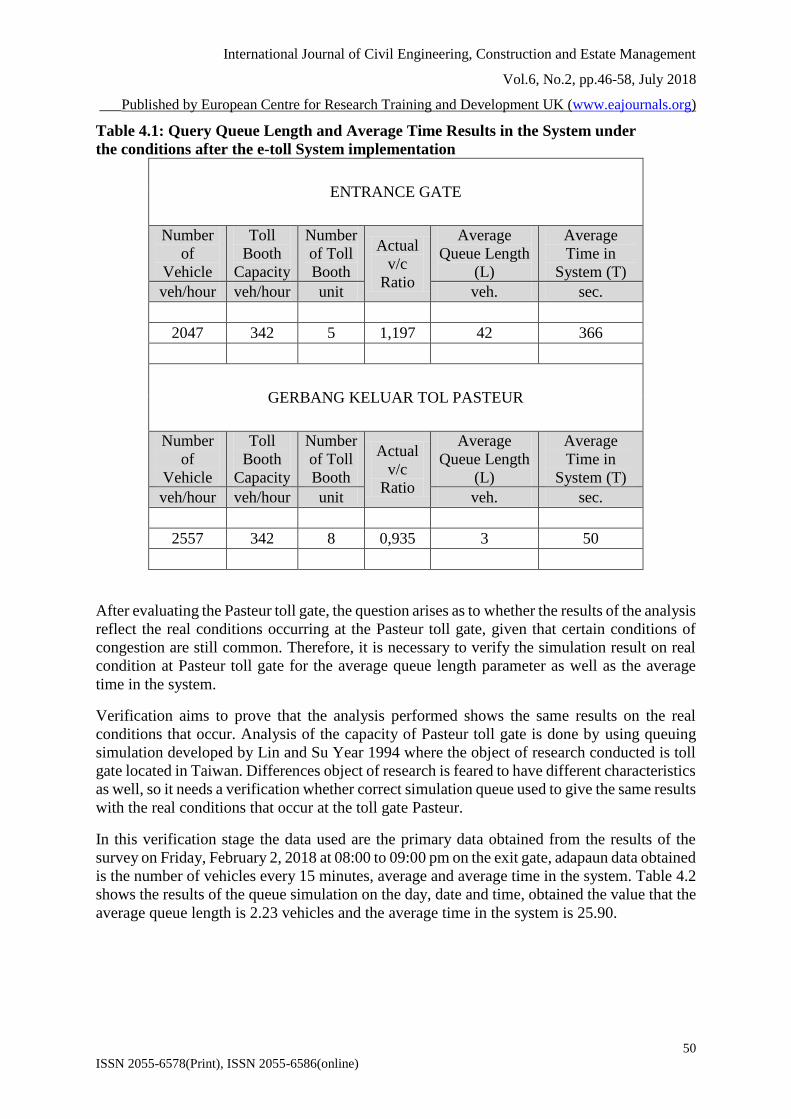
Table 4.1: Query Queue Length and Average Time Results in the System under
the conditions after the e-toll System implementation
ENTRANCE GATE
Number
of
Vehicle
Toll
Booth
Capacity
Number
of Toll
Booth
Actual
v/c
Ratio
Average
Queue Length
(L)
Average
Time in
System (T)
veh/hour veh/hour unit veh. sec.
2047 342 5 1,197 42 366
GERBANG KELUAR TOL PASTEUR
Number
of
Vehicle
Toll
Booth
Capacity
Number
of Toll
Booth
Actual
v/c
Ratio
Average
Queue Length
(L)
Average
Time in
System (T)
veh/hour veh/hour unit veh. sec.
2557 342 8 0,935 3 50
After evaluating the Pasteur toll gate, the question arises as to whether the results of the analysis
reflect the real conditions occurring at the Pasteur toll gate, given that certain conditions of
congestion are still common. Therefore, it is necessary to verify the simulation result on real
condition at Pasteur toll gate for the average queue length parameter as well as the average
time in the system.
Verification aims to prove that the analysis performed shows the same results on the real
conditions that occur. Analysis of the capacity of Pasteur toll gate is done by using queuing
simulation developed by Lin and Su Year 1994 where the object of research conducted is toll
gate located in Taiwan. Differences object of research is feared to have different characteristics
as well, so it needs a verification whether correct simulation queue used to give the same results
with the real conditions that occur at the toll gate Pasteur.
In this verification stage the data used are the primary data obtained from the results of the
survey on Friday, February 2, 2018 at 08:00 to 09:00 pm on the exit gate, adapaun data obtained
is the number of vehicles every 15 minutes, average and average time in the system. Table 4.2
shows the results of the queue simulation on the day, date and time, obtained the value that the
average queue length is 2.23 vehicles and the average time in the system is 25.90.

International Journal of Civil Engineering, Construction and Estate Management
Vol.6, No.2, pp.46-58, July 2018
___Published by European Centre for Research Training and Development UK (www.eajournals.org)
51
ISSN 2055-6578(Print), ISSN 2055-6586(online)
Table 4.2: Result of Queue Length Calculation and Average Time in System for
Verification
Number
of
Vehicle
Toll
Booth
Capacity
Number
of Toll
Booth
Actual
v/c
Ratio
Average
Queue Length
(L)
Average
Time in
System (T)
veh/hour veh/hour unit veh. sec.
2242 342 8 0,819 2,23 25,90
Table 4.3 is a comparison of the results of the analysis with a queue simulation with real
conditions at the exit gate of Pasteur toll. Once verified there is a difference, for the average
queue length value there is a difference of 0.54 so that if the obtained value of the average
queue length of the simulation results need to multiply the constant with a value of 0.24 so that
between the simulation results the same as the conditions at the Pasteur toll gate, meanwhile
the average time in the system needs to be multiplied by a constant with a value of 0.53 because
there is a difference of 13.72 seconds. The constants will then be used during the analysis using
queue simulation at the Pasteur toll gate.
Tabel 4.3: Results of Verification of Queue Simulation on Real Conditions at Pasteur
Toll Gate Exit.
Parameter
Queue
Simulation
Results
Real
Condition Difference Konstanta
1 2 3 4 5
Average Queue
Length (L)
(veh.)
2,23 2,77 0,54 0,24
Average Time
in System
(sec.)
25.90 39,62 13,72 0,53
The data of the number of vehicles owned is the sample data of the number of vehicles from
June to December, so there is data that is not known in the preceding months, for the ignorance
is necessary to predict the data by generating existing data so close to the real data. The monte
carlo method is the frequently used data generating method, while the Generator or the tool for
generating data in this research uses excel software help. Input data to generate data by monte
carlo method is the mean value, standard deviation and distribution type. In this study the
parameters to be generated is the value of the number of vehicles per hour from June to
December. Generate data on the number of vehicles performed on the analysis table to calculate
the need for the number of toll booth as in Table 4.4, so it will automatically perform
calculations for other parameters such as average queue length, average time in the system,
maximum queue length and queue space length on the toll plaza.

International Journal of Civil Engineering, Construction and Estate Management
Vol.6, No.2, pp.46-58, July 2018
___Published by European Centre for Research Training and Development UK (www.eajournals.org)
52
ISSN 2055-6578(Print), ISSN 2055-6586(online)
Table 4.4: Example of Requirements Calculation Results Gardu Number, After
done Generating Data on the Number of Vehicles
Number
of
Vehicle
Average
of
Service
Time
Toll
Booth
Capacity
Design
Service
Flow (F)
Estimation
(V/C)
ratio
Number
of Toll
Booth
Actual
(V/C)
ratio
1 2 3 4 5 6 7
1774
1580 10,52 342 1580 0,800 5,77 0,800
495 10,52 342 495 0,800 1,81 0,800
Average
Queue Length
(L) (veh.)
Average Time
in System (T)
(sec.)
Maksimum
Average
Queue Length
(L) (veh.)
Toll Plaza
Queue Length
(meters)
8 9 10 11
2 25 11 110
2 25 11 110
After the next value of substation count value calculate the mean value and standard deviation
of the number of substations both at the entrance gate or toll gate exit, the mean and standard
deviation of each gate can be seen in Table 3.5, the data of the substation number is then made
frequency graph based the mean and standard values devised by Table 4.5.
Table 4.5: Mean and Standard Deviation Value of Generate Data Number of
Vehicles at each Pasteur Toll Gate
When finished creating the next frequency table for the frequency graph, it will get the graph
form as in Figure 4.1. for toll entrance gates and Figure 4.2 for toll exit gates. From the graph
then will be searched how many substations will be used for designing of Pasteur toll gate,
based on trust level.
Gate Mean Standard
Deviation
Entrence 4,92 2,53
Leave 4,81 2,49

International Journal of Civil Engineering, Construction and Estate Management
Vol.6, No.2, pp.46-58, July 2018
___Published by European Centre for Research Training and Development UK (www.eajournals.org)
53
ISSN 2055-6578(Print), ISSN 2055-6586(online)
Figure 4.1 Frequency Graph Number of Pasteur Toll Gate Entrance Entry
Figure 4.2 Frequency Graph Number of Pasteur Toll Gate Leaving Entry
Speaking of statistical data the number of substations will certainly talk about the distribution
of data, the distribution of data presented is a normal distribution because based on a random
value when generating data, and the next is the characteristic of a data with normal distribution
is from the form of the resulting graph will form a bell upside down with a peak that divides
both sides with the same extent.
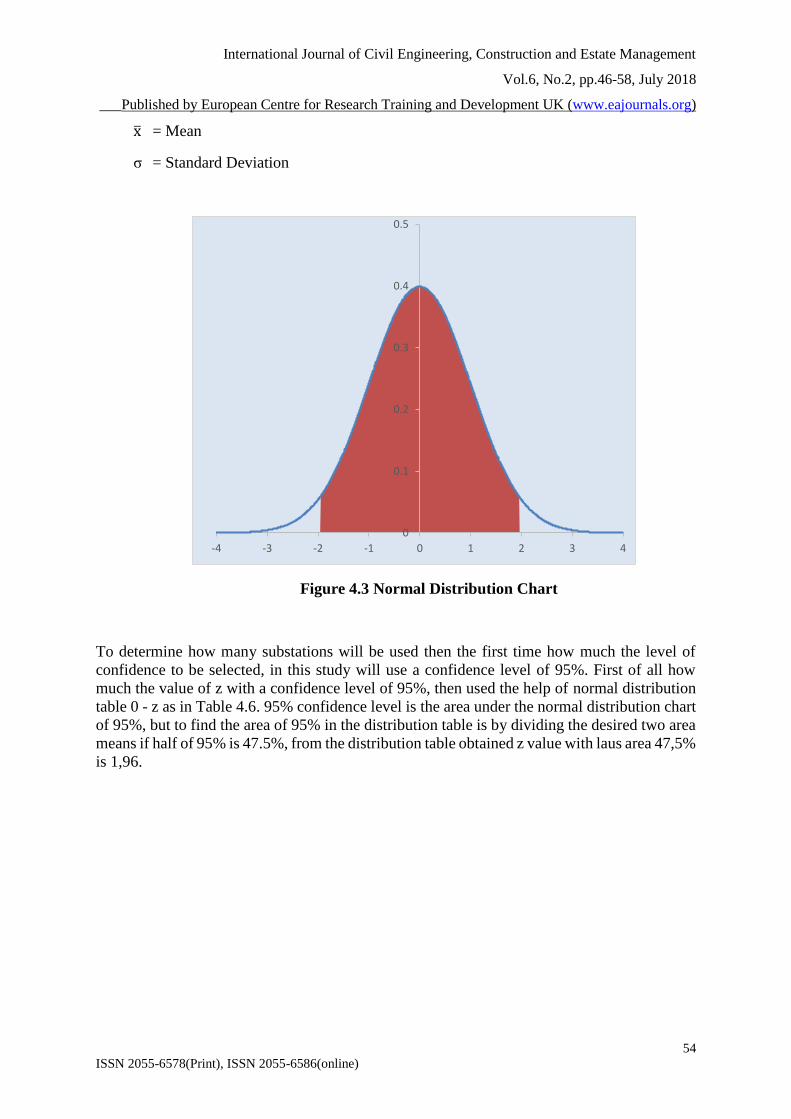
Speaking of the level of confidence, the data with normal distribution is a probability value.
Figure 4.3. is a normal distribution of distributed data distribution with a 95% confidence level,
meaning that the level of trust is the area of a normal distribution graph or it can also be obtained
from a graph of the distribution of a probability value or probability of an event. To simplify
the current there is a normal distribution table that can be used to determine the probability of
an event aided by equations for a standard normal distribution such as the following equation
𝑧 =𝑥 − �̅�
𝜎
Explanation :
z = Random variable of normal distribution
x = The value of an event
0
50
100
150
200
250
300
350
400
450
500
-5.23
-4.65
-4.06
-3.48
-2.90
-2.31
-1.73
-1.14
-0.56
0.03
0.61
1.20
1.78
2.36
2.95
3.53
4.12
4.70
5.29
5.87
6.46
7.04
7.62
8.21
8.79
9.38
9.96
10.55
11.13
11.72
12.30
12.89
13.47
14.05
14.64
Fre
kue
nsi
Number of Toll Booth
Frequency Graph Number of Pasteur Toll Gate Entrance Entry
0
50
100
150
200
250
300
350
400
450
-5.08
-4.61
-4.14
-3.67
-3.20
-2.73
-2.26
-1.79
-1.32
-0.85
-0.38
0.10
0.57
1.04
1.51
1.98
2.45
2.92
3.39
3.86
4.33
4.80
5.27
5.74
6.21
6.68
7.15
7.62
8.09
8.57
9.04
9.51
9.98
10.45
10.92
11.39
11.86
12.33
12.80
13.27
13.74
14.21
14.68
Fre
kue
nsi
Number of Toll Booth
Frequency Graph Number of Pasteur Toll Gate Leaving Entry
International Journal of Civil Engineering, Construction and Estate Management
Vol.6, No.2, pp.46-58, July 2018
___Published by European Centre for Research Training and Development UK (www.eajournals.org)
54
ISSN 2055-6578(Print), ISSN 2055-6586(online)
x̅ = Mean
σ = Standard Deviation
Figure 4.3 Normal Distribution Chart
To determine how many substations will be used then the first time how much the level of
confidence to be selected, in this study will use a confidence level of 95%. First of all how
much the value of z with a confidence level of 95%, then used the help of normal distribution
table 0 - z as in Table 4.6. 95% confidence level is the area under the normal distribution chart
of 95%, but to find the area of 95% in the distribution table is by dividing the desired two area
means if half of 95% is 47.5%, from the distribution table obtained z value with laus area 47,5%
is 1,96.
-4 -3 -2 -1 0 1 2 3 4
0
0.1
0.2
0.3
0.4
0.5

International Journal of Civil Engineering, Construction and Estate Management
Vol.6, No.2, pp.46-58, July 2018
___Published by European Centre for Research Training and Development UK (www.eajournals.org)
55
ISSN 2055-6578(Print), ISSN 2055-6586(online)
Table 4.6 Normal Distribution Table from 0 to z
After the value of z is obtained then use the standard normal distribution equation to find out
how much the value of x, the value of x to be searched is the value of the substation with
probabiliti or opportunity of 95%, the following explanation of the process of calculation:
Entrance Gate :
𝑧 =𝑥 − �̅�
𝜎
𝑥 = (𝑧 × 𝜎) + �̅�
𝑥 = (1,96 x 2,93) + 4,93
𝑥 = 9,90 ~ 10 toll booth
Leaving Gate :
𝑧 =𝑥 − �̅�
𝜎
𝑥 = (𝑧 × 𝜎) + �̅�
𝑥 = (1,96 x 2,49) + 4,81
𝑥 = 9,69 ~ 10 toll booth

International Journal of Civil Engineering, Construction and Estate Management
Vol.6, No.2, pp.46-58, July 2018
___Published by European Centre for Research Training and Development UK (www.eajournals.org)
56
ISSN 2055-6578(Print), ISSN 2055-6586(online)
From the calculation of the number of substations to be used for the design of the geometry of
the toll gate obtained the value of the required substation as many as 10 substations and 10
substations for exit toll gate in 2017. In this study will be designed gate for 10 years to 2027
until, get the value then it is necessary to obtain the value of how much the value of vehicle
growth at the toll gate Pasteur. To obtain the required growth rate, we use the comparison
method or the average of the data in Table 4.7, so that the value of growth rate is 2.82% for toll
entrance gate and 2.92% for exit gate.
Table 4.7 Number of Annual Traffic of Pasteur Toll Gate
Year
Gate % Growth
Entrance Leaving Entranc
e
Leavin
g
2007 9.213.327 8.879.058
2008 9.483.859 9.194.800 2,936 3,556
2009 10.063.122 9.814.217 6,108 6,737
2010 10.274.700 10.461.543 2,103 6,596
2011 10.785.722 11.021.815 4,974 5,356
2012 11.262.056 11.754.025 4,416 6,643
2013 11.503.885 12.285.625 2,147 4,523
2014 11.166.302 12.019.511 -2,935 -2,166
2015 11.764.047 2,821 -2,125
2016 11.900.752 1,162
2017 11.777.510 -1,036
Having obtained the level of growth, then the data is used to predict the number of substations
toll pasteur next ten years using the following equation:
Pn = Po( 1 + i )n
Explanation:
Po = The number of initial toll booth
Pn = Number of toll booth year-n
n = Number of year
i = Growth Rate ( % )

International Journal of Civil Engineering, Construction and Estate Management
Vol.6, No.2, pp.46-58, July 2018
___Published by European Centre for Research Training and Development UK (www.eajournals.org)
57
ISSN 2055-6578(Print), ISSN 2055-6586(online)
Table 4.8 is the result of the calculation of the number of substations 10 years to be precisely
in 2027. Obtained the need for the number of substations at the Pasteur toll gate in 2027 is as
much as 14 for both toll gate entrance and exit gate.
Table 4.8 The Need of Number of Toll Booth in Year 2027.
Gate Location Number of Toll Booth
2017 2027
Entrance Gate 10 14
Leaving Gate 10 14
DISCUSSION
From result of analysis that it is known that requirement of toll gate number is 10 gate good
for gate entrance and exit of toll. but the clan service party as the toll road manager only
provides 7 toll gate entrance at the toll gate relocation. see these differences need to find what
the cause of these differences, whether of the analysis of demand calculations toll booths or
from differences in the level of trust that is used in the design needs of the toll gate
Implication to Research and Practice
The performance of toll gate is strongly influenced by factors such as gate capacity, arrival
patterns and vehicle movement. but the need for a research related to the impact of geometry
shapes or the placement of toll booths against parameters that affect the performance of the toll
gate.
CONCLUTION
1. Based on the evaluation result by simulation of queue to capacity and service of toll
gate of Pasteur at initial condition that is at the time still use service system, obtained
result that value v / c ratio at toll gate of Pasteur > 1 added with high average queue
length, at the entrance gate of the average queue toll of 5617 vehicles while at the exit
gate -37.35 vehicles.
2. Looking at the evaluation result at point 1, it is necessary to verify the queuing
simulation used, whether the simulation result actually shows the same result with real
condition in Pasteur toll gate. From the verification result it turns out there is a
difference to the average queue length and the average time in the system, there is a
difference of 0.54 vehicles on the average queue length or approximately 0.24 times
from the queue simulation results, while the average time in the system there is
difference of 13.72 seconds or 0.53 times the simulation results. The value of time or
the multiplier constants is calibrated to the simulation result for the queue length and
time parameter in the system.
3. The need for substation at toll gate pasteur with 95% confidence level in 2017 is 10
substations both for toll gate entrance and exit gate, while for year 2027, need of
International Journal of Civil Engineering, Construction and Estate Management
Vol.6, No.2, pp.46-58, July 2018
___Published by European Centre for Research Training and Development UK (www.eajournals.org)
58
ISSN 2055-6578(Print), ISSN 2055-6586(online)
substation to 14 substation at each gate taking into account growth rate for toll gate
entrance of 2.82% and toll exit gate of 2.92%.
4. To design the geometry of the Pasteur toll gate, toll plaza is obtained the required
queue space is 110 meters with a taper along the 195 meters plus a slowing path with
a plan speed of 60 km / h, the length of the 70 meter slowing path with a 45 meter
taper , while the acceleration path with a plan speed of 60 km / h for the acceleration
path length is 120 meters and taper 45 meters. For the placement of substations at the
toll gates of 14 substations are made into two lines, each line consisting of 7
substations. Each row consists of 5 lanes for Class 1 vehicles with a maximum vehicle
height of 2.3 meters and two lanes for Class II vehicles up to Class V.
5. Location of Pasteur toll gate will be relocated to 5 + 000 kilometers with consideration
of area and availability of land for Pasteur toll gate.
6. Pasteur toll gate implementation method is divided into 3 zones, where zone 1
becomes the main settlement priority so that traffic flow in Pasteur toll road is not
disturbed for long enough time.
FUTURE RESEARCH
1. Regarding the data verification stage of queue simulation result against real condition
that happened at Pasteur toll gate, need to get more primary data as material of
verification, so for calibration process give result of multiplier constants which really
close to real condition at toll gate of Pasteur .
2. On February 1, 2018, the PT. Jasa Marga (Persero) Tbk. The Purbaleunyi Toll Branch
relocates to the toll entrance gate to a location adjacent to the ramp site of the Baros
toll exit gate, so it needs to be analyzed as well as the previous toll gate entrance.
REFERENCE
Cebalos G., Curtis Owen., 2013. Queue Analysis at Toll and Parking Exit Plazas: A
Comparison between Multi-server Queuing Models and Traffic Simulation,
Elgar, E. 2013. The Transport System and The Transport Policy, Cheltenham, UK
Northampton, MA, USA.
Lin, F. B. and Su, C. W. 1994. Level of Service Analysis of Toll Plazas on Freeway Main
Lines, Journal of Transportation Engineering, ASCE, Vol. 120, No. 2, March/April,
246-263 pp.
May, A. D. 1990. Traffic Flow Fundamentals, New Jersey, USA.
Taha, H. A. 2007. Operation Research in Introduction, Eighth Edition, Univercity of
Arkansas, USA.