evaluation of silicate minerals for ph control during ... · 1 evaluation of silicate minerals for...
TRANSCRIPT

1
Evaluation of silicate minerals for pH control during bioremediation:
Application to chlorinated solvents
Elsa Lacroixa1, Alessandro Brovellia, Christof Holligerb, D. A. Barrya,
Ecole Polytechnique Fédérale de Lausanne (EPFL), School of Architecture, Civil and
Environmental Engineering (ENAC), Lausanne, Switzerland
a Ecological Engineering Laboratory
b Laboratory for Environmental Biotechnology
Journal: Water, Air and Soil Pollution
1 Author to whom all correspondence should be addressed. Tel. +41-21-69 34721; fax + 41-21-69 34722; e-mail [email protected]

2
Abstract
Accurate control of groundwater pH is of critical importance for in situ biological treatment
of chlorinated solvents. This study evaluated a novel approach for buffering subsurface pH
that relies on the use of silicate minerals as a long-term source of alkalinity. A screening
methodology based on thermodynamic considerations and numerical simulations was
developed to rank silicate minerals according to their buffering efficiency. A geochemical
model including the main microbial processes driving groundwater acidification and silicate
mineral dissolution was developed. Kinetic and thermodynamic data for silicate minerals
dissolution were compiled. Results indicated that eight minerals (nepheline, fayalite,
glaucophane, lizardite, grossular, almandine, cordierite and andradite) could potentially be
used as buffering agents for the case considered. A sensitivity analysis was conducted to
identify the dominant model parameters and processes. This showed that accurate
characterization of mineral kinetic rate constants and solubility are crucial for reliable
prediction of the acid-neutralizing capacity. In addition, the model can be used as a design
tool to estimate the amount of mineral (total mass and specific surface area) required in field
applications.
Keywords: groundwater acidification, in situ bioremediation, buffer injection, geochemical
modeling, reductive dechlorination, organohalide respiration.
3
1 Introduction
Groundwater acidification of contaminated sites is a relatively frequent problem. The pH
decrease can result from microbial processes (AFCEE 2004; Aulenta et al. 2006), presence
of chemicals (like phenols or acid pesticides) and oxidative dissolution of sulfidic minerals,
such as pyrite. Acidification is observed when the natural buffering capacity of ambient
groundwater and soil is exceeded (McCarty et al. 2007; Robinson et al. 2009). Acidity
buildup is of particular concern for in situ remediation processes such as bioremediation,
chemical oxidation and reduction, and in situ mobilization-stabilization (Czupyrna 1989;
ITRC 2005; Robinson et al. 2009). For example, if the pH is too low reaction rates may be
reduced or the solubility of the target chemical may be too high or too low. Consequently,
the application of such techniques is enhanced by implementation of efficient pH-control
strategies.
In situ bioremediation of chlorinated aliphatic hydrocarbons (CAHs) is very sensitive to this
issue (Adamson et al. 2004; Cope and Hughes 2001; McCarty et al. 2007). CAHs such as
perchloroethylene (PCE) and trichloroethylene (TCE) are amongst the most frequently
encountered subsurface contaminants due to their extensive use as dry cleaning and metal
degreasing agents in many industrial processes (Fetzner 1998). CAHs are persistent in the
environment and constitute a source of groundwater contamination that may last for decades
(AFCEE 2004; McCarty et al. 2007). Enhanced in situ anaerobic bioremediation is a
promising method to speed up their removal. It involves the stimulation of specialized
anaerobic microorganisms that use chlorinated solvents as electron acceptors for energy
metabolism through organohalide respiration (Yang and McCarty 2000, 2002). Stimulation of
microbial activity is achieved by delivering an organic substrate into the subsurface, which is
fermented to hydrogen, after which it is available as an electron donor for organohalide-

4
respiring bacteria (ORB) (AFCEE 2004). Organic substrate fermentation and organohalide
respiration are both acid-producing processes, the extent of which is directly controlled by the
amount of substrate and CAHs transformed (Adamson et al. 2004; AFCEE 2004; Amos et al.
2008; Chu et al. 2004). For this reason, source zone treatment is more susceptible to
acidification than enhanced natural attenuation of dilute plumes due to the larger mass of
CAHs available (Aulenta et al. 2006; Robinson et al. 2009).
Acidic conditions limit microbial degradation due to the inactivation of anaerobic bacteria at
low pH. Pure strains of dehalogenating bacteria have a range of pH tolerance between 6 - 6.5
and 8 - 9.5 depending on the bacterial strain (Holliger et al. 1993; Krumholz 1997; Neumann
et al. 1994; Scholz-Muramatsu et al. 1995; Sung et al. 2003; Suyama et al. 2001), while
consortia are slightly more tolerant with a maximum pH range of 4 - 9 (Vainberg et al. 2009;
Zhang and Bloom 1999). Fermenting bacteria exhibit a similar behavior with complete
inhibition around pH 4 to 5 (Lee et al. 2002; Roychowdhury et al. 1988).
For field applications, the most common methods to control the pH decrease include the
circulation of a solution containing dissolved alkaline materials (such as sodium or potassium
bicarbonate) in the treatment zone (AFCEE 2004; Payne et al. 2006; Robinson et al. 2009)
and the use of water injections to dilute the substrate and the acidity (Brovelli et al. 20112)
Constant addition of buffering agent requires frequent injections as alkalinity is rapidly
consumed, which probably increases operation costs. In addition, in aquifers with significant
concentrations of Ca2+ or Mg2+, addition of bicarbonate may lead to precipitation of calcite at
neutral pH (Lozecznik et al. 2010), which hinders further treatment.
2 A. Brovelli, D. A. Barry, C. Robinson and J. I. Gerhard (2011). Analysis of acidity production during enhanced reductive dechlorination using a simplified reactive transport model. Submitted, Advances in Water Resources.
5
The aim of this work was to assess the feasibility of an alternative strategy for pH control,
which relies on the use of silicate minerals. Silicate minerals are the most common rock-
forming mineral and their weathering is the predominant buffering mechanism in sediments
with negligible carbonate content (Appelo and Postma 2005). The dissolution of silicates is
accompanied by a release of alkali cations (such as K+, Na+, and Mg2+) and by consumption
of protons. Both processes can increase groundwater pH. Silicate minerals are appealing
buffering agents as
• Dissolution is slow compared with carbonates, and therefore they are long-term sources of
alkalinity (Appelo and Postma 2005);
• The dissolution rate is pH-dependent, that is, minerals dissolve faster in acidic conditions
(Marini 2007; White and Brantley 1995). This enhances their efficacy, as it allows a more
rapid return to nearly neutral conditions while dechlorination is taking place, and increases
their lifetime when the groundwater pH is in the neutral range;
• The solubility is also pH-dependent with a higher solubility at acidic pH and limited
solubility at neutral pH.
In other words, when acidity is produced, minerals dissolve until a near-neutral pH is
reached, then dissolution reduces due to thermodynamic constraints. This prevents the
increase of groundwater pH in the alkaline range, which is as unfavorable to ORB as low pH.
Only a limited number of studies have evaluated the potential of silicate minerals as acid-
neutralizing agents for water remediation. Silicate minerals resulting from industrial
processes such as glass and ceramic production were considered, which contained sodium
and potassium feldspars, nepheline and wollastonite (Fernandez-Caliani et al. 2008; Kleiv
and Sandvik 2000; Likens et al. 2004). In all cases, significant buffering capacity was
observed and it was concluded that these materials can be used to mitigate water acidity and
precipitate/stabilize heavy metals both in the soil (Kleiv and Sandvik 2000) and streams

6
(Fernandez-Caliani et al. 2008; Likens et al. 2004), resulting, for example, from acid mine
drainage leaching. The studies conducted so far are, however, limited in the number of
minerals and geochemical conditions considered. The objective of this study was to consider
a larger spectrum of silicate minerals for acid neutralization than previous work. To this end,
a screening methodology for the selection of the most suitable minerals was developed. The
methodology was applied to the specific case of in situ bioremediation of chlorinated
solvents, but can be extended to any decontamination technology requiring near-neutral pH
conditions.
2 Methods
Silicate dissolution is primarily a surface process, and its dissolution rate depends on the
available specific reactive surface area (Appelo and Postma 2005; Marini 2007; White and
Brantley 1995). Silicate minerals have different thermodynamic and kinetic characteristics
and their dissolution rates vary over several orders of magnitude (Marini 2007). The
methodology used to identify silicate minerals for pH control in the context of in situ
bioremediation consists of three steps, (i) identification of silicate mineral kinetic parameters,
(ii) pre-selection based on thermodynamic considerations and (iii) numerical simulations to
quantify and compare the buffering efficiency of the selected minerals.
Twenty silicate minerals (Table 1) were used as the starting point for the application of the
screening methodology described in this work. These minerals were selected because (i)
detailed studies on their dissolution kinetics were available in the literature, and (ii) their
thermodynamic parameters (solubility constant and enthalpy variation) were available and
tabulated in existing geochemical databases. To limit the number of numerical simulations,
silicate minerals with low reactivity, i.e., a slow dissolution rate in the acidic range (rate
constant < 10-12 mol m-2 s-1) were excluded from the list.

7
2.1 Identification of kinetic parameters
The first step consists in determining the values of key parameters for mineral dissolution
modeling, i.e., thermodynamic and kinetic parameters. Thermodynamic parameters – such as
solubility constant KD and standard enthalpy of the reaction at 25°C ΔH– can normally be
found in thermodynamic databases such as THERMODDEM (Blanc et al. 2007) and
MINTEQA2 (Allison et al. 1991) (Table 1), whereas kinetic rates were not readily available.
For a given temperature and at conditions far from equilibrium, the dissolution rate of most
silicates can be expressed by the empirical rate law (White and Brantley 1995):
( ) ( )H OHpH pHWH OH
10 10n n
r k k k+ −
+ −
− −− −= + + , (1)
where r (mol m-2 s-1) is the dissolution rate, kH+, kW and kOH
- (mol m-2 s-1) are the rate
constants for the acidic, neutral and alkaline ranges, and nH+ and nOH
- are the reaction order
of proton- and hydroxyl-promoted dissolution. Accurate determination of kH+, kW, kOH
-, nH
+
and nOH- is critical for geochemical modeling. In order to estimate these values, published
data from mineral dissolution experiments were fitted with Eq. 1.
For each mineral, two datasets taken from the literature were considered. Only experiments
conducted in similar conditions were adopted, i.e., measurements from flow-through reactors,
far from equilibrium conditions and at a temperature of 25°C. Moreover, only experiments
where steady state conditions were achieved were considered. The estimated parameters
(Table 2) were compared with those reported by Palandri and Kharaka (2004).
2.2 Mineral screening based on thermodynamic considerations
Of the 20 silicate minerals selected, a first screening was performed considering solubility.
This property depends on the solubility constant, KD, and on the ion activity product, which
is related to proton activity and therefore to pH. The dependency of solubility upon pH is

8
illustrated in Fig. 1 for five minerals (forsterite, wollastonite, nepheline, fayalite and
andradite). Solubility is high in the acidic range and decreases by several orders of magnitude
with increasing pH. The relationship, however, differs among minerals. For pH control in the
context of in situ CAH bioremediation, a good buffering agent should have high solubility in
the acidic range (pH 4-6) and low solubility in the neutral-basic range (pH 7-9). High
solubility for acidic conditions results in a rapid return to neutral conditions while low
solubility at high pH (> 7) prevents excessive basification of the groundwater. Solubility in
pure water of the 20 selected minerals was computed at pH 5 and pH 8 at a temperature of
20°C using the geochemical code PHREEQC-2 (Parkhurst and Appelo 1999) and solubility
constants from the MINTEQA2, THERMODDEM and LLNL thermodynamic databases
(provided with PHREEQC-2). Minerals with low solubility at pH 5 (< 1 mmol l-1) were
excluded from the selection as they do not provide sufficient acid-neutralizing potential.
Similarly, minerals with high solubility at pH 8 (above 10 mmol l-1) were excluded, as they
are likely to overshoot pH.
2.3 Numerical model
In order to estimate the acid-neutralization potential of silicate minerals, a batch numerical
model was implemented using PHREEQC-2. The model included all relevant acid and
alkalinity associated reactions occurring in chlorinated solvent-contaminated aquifers
undergoing in situ bioremediation, i.e., mineral dissolution, microbial processes and
chemical speciation. The model was run in batch mode to simulate a well-stirred reactor. In
this work, transport was neglected as it was assumed that groundwater residence time is large
compared to the time scale of geochemical reactions.
9
2.3.1 Acid-generating processes
Two microbial processes are primarily responsible for groundwater acidification during
CAH bioremediation: fermentation of the soluble organic substrate and organohalide
respiration (McCarty et al. 2007; Robinson et al. 2009). In most in situ bioremediation
schemes, dissolved hydrogen gas, the electron donor for ORB, is delivered through
fermentation of an organic substrate such as sodium lactate or linoleic acid,
Organic substrate +wH2O = xCH3COOH + yH2 +zCO2. (2)
The right-hand side of this equation lists the fermentation products, i.e., hydrogen, acetic acid
and carbon dioxide. The stoichiometric coefficients (w, x, y, z) are specific to the organic
substrate used (Kouznetsova et al. 2010; McCarty et al. 2007; Robinson et al. 2009).
Not all hydrogen produced by fermentation is directed to organohalide respiration, as ORB
must compete with other microbial guilds. In CAH source zones, sulfate and iron (III) are the
two predominant competing terminal electron acceptors (AFCEE 2004; Aulenta et al. 2007).
The fraction of hydrogen directed to ORB not only depends on the amount of iron oxides and
sulfate present in the groundwater (AFCEE 2004), but also on microbial populations and
specific field conditions and is therefore difficult to estimate precisely (Curtis 2003; Loffler
et al. 1999). Following Robinson et al. (2009) and Robertson and Barry (2009), our model
assumes that sulfate and iron oxide are present in excess in the system, and that a fraction fmin
of hydrogen produced by fermentation is used by ORB.
Organohalide respiration, i.e., reduction of PCE to ethene is modeled as a sequential reaction
involving four steps,
PCE → TCE C2Cl4 + H2 = C2HCl3 + HCl,
(3)
TCE → DCE C2HCl3 + H2 = C2H2Cl2 + HCl, (4)

10
DCE → VC C2H2Cl2 + H2 = C2H3Cl + HCl, (5)
VC → Ethene C2H3Cl + H2 = C2H4 + HCl, (6)
where PCE stands for perchloroethylene, TCE for tetrachloroethylene, DCE for
dichloroethene and VC for vinyl chloride. If the reaction completes, for each mole of PCE
degraded four moles of hydrochloric acid are produced. The goal of the model is to simulate
the rate at which acidity is produced and not all complex microbial processes. Therefore, in
order to simplify the model and reduce the computational burden, the fermentation rate is not
simulated directly. Instead, the fermentation reaction is combined with organohalide
respiration to give the following overall dechlorination stoichiometry for each chloroethene
(Robinson et al. 2009):
2 i
j 3 2 2
Organic substrate H O + CAH
(1 ) HCl CAH CH COOH H CO
,
min
min
min min min
wy f
fx zy f f y f
+ =
−+ + + +
(7)
where CAHi and CAHj are the parent and daughter CAHs, respectively.
The following assumptions were made regarding the fermentative and organohalide respiring
bacterial guilds:
1. Fermentation is inhibited by high level of hydrogen, as shown by Fennel and Gosset
(1998). The fermentation rate is, therefore, controlled by hydrogen consumption by
organohalide respiration and by other anaerobic respiration processes;
2. Acetate is not used as an electron donor. Robinson et al. (2009) demonstrated that acetate
utilization as an electron donor lowers the overall acidity produced, so this represents the
worst case in terms of acidity production;
3. The concentration of fermentative biomass is high and remains constant;
4. The impact of pH on microbial activity is similar for fermentative biomass and ORB;

11
5. Sufficient organic substrate is provided to ensure complete transformation of the PCE to
ethene;
6. The organic substrate dissolution rate exceeds its fermentation rate.
Organohalide respiration rates were modeled using Monod-type kinetic equations including
competitive and Haldane inhibition (Cupples et al. 2004; Yu and Semprini 2004). The
degradation rate of each chloroethene was computed as
max,PCE PCEPCE
S,PCEreduction
PCE
(pH), k XC
fK
RC
=+
(8)
max,TCE TCETCE
PCE TCES,TCE TCE
CI,
redu
PCE HI
c
,TC
n
E
tio (pH),1 1
k XCf
C CK CR
K K
= + + +
(9)
max,c DCE c DCEc-DCE
TCE c-DCES,DCE DCE
CI,
reduction
TCE HI,c-DCE
(pH) ,1 1
Rk XC
fC CK C
K K
− −= + + +
(10)
max,VC VCVC
TCE c-DCE VCS,VC VC
CI,TCE CI,c-DC
reducti
E HI,
o
VC
n (pH) ,1 1
k XCf
C C CK CR
K K K
= + + + +
(11)
and their temporal dynamics is
PCEPCE redu on ctiRdC
dt= , (12)
reduction reductionTCE
PCE TCE R RdCdt
−= , (13)
reduction reductic-DCE
TCE c-D oCE nR RdCdt
= − , (14)
reductionVC
c- VC reductionDCE R RdCdt
−= , (15)
VC reductionethenedC Rdt
= , (16)

12
where Cj (mol l-1) is the aqueous concentration and kmax,j (mol mg protein-1 d-1) is the
maximum specific utilization rate of CAH j (i.e., j = PCE, TCE, DCE, and VC), X (mg
protein l-1) the dechlorinating biomass concentration and KS (mol l-1) the half-saturation
constant of each chloroethene, KCI (mol l-1) is the competitive inhibition constant and KHI the
Haldane inhibition constant. f(pH) is a pH inhibition function that is described in detail
below (§2.3.2).
Microbial growth is expressed as:
j reduction1,5
d ,i
dX Y k Xdt
R=
= − −∑
(12)
where X (mg protein l-1) is the biomass concentration, Y (mg protein mol Cl released-1) is the
growth yield coefficient, Rj reduction (mol l-1 d-1) is the reduction rate of CAH j and kd (d-1) is
the first-order biomass decay rate. It was assumed that all ORB populations have the same
yield coefficient and decay rate.
2.3.2 pH inhibition function
ORB are highly sensitive to groundwater pH. The dechlorination rate is maximal in the near-
neutral range and decreases in the acidic and basic ranges. Several pH inhibition functions
have been proposed to describe the pH influence on microbial activity (Bailey and Ollis
1986; Lee et al. 2002; Mussati et al. 2005; Schepers et al. 2002). In this study, the Gaussian-
type function employed by Schepers et al. (2002) was used:
( )( )opt
2
pH pHpH exp ,
n
f − = −
σ (13)
where pHopt (= 6.7) is the optimal pH, and n and σ are empirical parameters that were
estimated by fitting published datasets (Vainberg et al. 2009) (Fig. 2).

13
2.3.3 Silicate mineral dissolution
Silicate mineral dissolution is a kinetically controlled process influenced by external factors
such as temperature, pressure, pH, thermodynamic affinity and water composition (Appelo
and Postma 2005; Marini 2007). The general form of the rate law for mineral dissolution far
from equilibrium proposed by Lasaga (1995) was adopted here:
( )( )0D ' 1 Ω ,R r g A
VA
= − (14)
where RD (mol l-1) is the mineral dissolution rate, 'r (mol m-2 s-1) is the rate per unit surface
area (given by Eq. 15), A0 (m2) is the initial surface area, V (l) is the solution volume, Ω (-)
the mineral saturation index, g(A) (-) is a function which quantifies the changes in reactive
surface area as dissolution proceeds.
The rate per unit surface area 'r is a function of temperature, pH and groundwater
composition and is expressed by:
( )
( )
H+
OH
pH' H
HH
pHW WOH
10 1 1 exp298
1 1 exp 102
,98
n
n
W
Er k
f R T
k E kf R T
+
+
+
−
−
−−
−−
= − −
+ − − +
(15)
where EH+, EW and EOH
- (J mol-1) are the activation energies for the acid, neutral and basic
ranges, R (J K−1 mol−1) the universal gas constant, T (K) the absolute temperature and fH+ and
fW are factors accounting for inhibition by ionic species. The energy activation terms used in
this study were taken from Palandri and Kharaka (2004) (Table 3). The effect of groundwater
composition in the acidic and neutral ranges was included through the inhibition factors fH+
and fW (Appelo and Postma 2005):
[ ]AlBC
+
+ +
3+
HBC,H Al,H
AlBC1 1 ,
xx
fLim Lim
= + + +
(16)
14
[ ]AlBC
W
3+
BC, A ,W Wl
A,
lBC1 1
zz
fLim Lim
= + + +
(17)
where Lim is the threshold activity for solute inhibition, [BC] indicates the sum of activities
of the base cations Na+, K+ and Mg2+, [Al3+] is the activity of aluminum and exponents xi and
zi are empirical parameters. The effect of CO2 on the dissolution rate was not included as it is
negligible for partial pressures up to 1 bar (Golubev et al. 2005). The coefficients Lim, xi and
zi were determined for a limited numbers of minerals by Sverdrup and Warfvinge (1995) and
Sverdrup (1990), and were adopted in this work. For most minerals, however, these values
were not available. As discussed in §3.4.5, the model is only slightly sensitive to these
inhibition factors, and therefore they can be neglected in the conditions selected in this study.
The dissolution rate is also controlled by the available reactive surface area, which can
change in time as the minerals dissolve (due, for example, to changes in the size and
distribution of the crystal population, selective dissolution, aging of the mineral) (Appelo
and Postma 2005). In addition, precipitation of secondary mineral phases may coat the
surface of the dissolving mineral (Gaus et al. 2008; Scislewski and Zuddas). Reactive surface
area is, however, not measurable. Also, it is difficult to correlate to the total surface area
because, for instance, dissolution occurs only at certain sites on the mineral surface
(Helgeson et al. 1984). Moreover, the reactive surface area might undergo variations of
several orders of magnitude during dissolution (Brantley et al. 2008). Different models based
on geometrical considerations have been proposed to relate changes in reactive surface area
to mineral dissolution (Emmanuel and Berkowitz 2005; Kieffer et al. 1999; Lichtner 1988).
In this study, the approach of Lichtner (1988) was adopted,
α
0
,( ) mg Am
=
(18)

15
where m0 (mol) is the initial amount of mineral, m (mol) is the current amount of
undissolved mineral and α is an exponent that depends on crystal shape, grain size
distribution (Appelo and Postma 2005; Dixon and Hendrix 1993) and relative rates of
dissolution on different surfaces (Witkamp et al. 1990). For a mono-disperse population of
uniformly dissolving spheres or cubes α = 0.67, while α = 3.4 for a lognormal grain size
distribution. Since this parameter is unknown and variable, α = 0.67 was arbitrarily chosen
for the simulations conducted in this work and a sensitivity analysis was performed to assess
its impact on model results.
Kinetic rate constants determined in laboratory experiments commonly exceed the mineral
weathering rates observed in the field (White et al. 1996; White and Brantley 2003).
Discrepancies were attributed to stirring in laboratory studies (Alkattan et al. 1998; Metz and
Ganor 2001), inaccurate estimation of the mineral surface in aquifers (Brantley et al. 2008)
and different characteristics of the mineral surfaces in the laboratory compared to field
conditions (Davis and Hayes 1986). To correct dissolution rates obtained in the laboratory,
following Vangrinsven and Vanriemsdijk (1992) a safety factor, D, was introduced,
DD ' ,
RR
D= (19)
where RD (mol l-1) is the total mineral dissolution rate obtained from continuous stirred flow
reactor experiments and D 'R is the corrected value. Vangrinsven and Vanriemsdijk (1992)
compared mineral dissolution rates in a number of different experiments and found D ≈ 15
between dissolution rates determined in batch and in porous medium column experiments.
This value was adopted in this work.
Precipitation of secondary minerals was not included due to the lack of a reliable modeling
approach. Precipitation of a new mineral phase occurs when the saturation index exceeds a
critical level, which is different for each mineral and in most cases is unknown (Zhu et al.

16
2010). Moreover, the definition of the initial surface area or of the nucleation sites is
extremely difficult (Marini 2007; Zhu et al. 2010).
2.4 Numerical simulations
2.4.1 Definition of base conditions
The model developed above was set up to simulate conditions of a typical groundwater
undergoing in situ bioremediation. The conditions used were:
• The groundwater composition was defined using major constituents of a typical site
contaminated with chlorinated solvents: K+, 0.2 mmol l-1; Mg2+, 2.3 mmol l-1; Ca2+, 7.2
mmol l-1; Na+, 5.9 mmol l-1; Cl- 0.2, mmol l-1; SO42-, 10.4 mmol l-1; CO3
2-, 5.1 mmol l-1;
pH, 6.8 (Kouznetsova et al. 2010);
• The temperature was set to 20°C: This value corresponds to the upper limit for
groundwater temperature, which is usually between 10 and 20°C (AFCEE 2004). This
value was chosen because microbial rates are much higher at 20°C than at 10°C (Holliger
et al. 1993; Zhuang and Pavlostathis 1995), consequently so is acidity production. In other
words, this is the worst-case condition in term of acidity production;
• The water was in equilibrium with a free phase of pure PCE (1.5 mmol l-1). The solubility
limit of PCE was set to 0.9 mmol l-1 (Yaws 1999);
• The factor fmin was set to 0.4, a typical value for field conditions (AFCEE 2004);
• The organic fermentable substrate used was linoleic acid, which is a major component of
vegetable oil, a substrate often injected in field applications (AFCEE 2004). Linoleic acid
is fermented to hydrogen and acetate following the reaction :
C18H32O2 + 16H2O = 14H2 + 9CH3COOH; (20)
• The microbial kinetic parameters (maximum specific utilization rates, half-saturation
constants, competitive and Haldane inhibition constants) were taken from Yu and

17
Semprini (2004) for the PM culture, a mixed consortium able to convert PCE to ethene
even at high PCE concentration. These kinetic parameters were determined at 20°C. All
microbial processes model parameters used in the base case simulations are listed in Table
4;
• It was assumed that the natural buffering capacity of soil and groundwater was already
consumed, again this is the worst-case scenario.
Three cases were considered:
Case A The pH was fixed at the optimal value for organohalide respiration (pH = 6.7). The
goal was to determine the time needed to complete degradation without pH
inhibition.
Case B This simulation was used to quantify the maximum dechlorination efficiency
without addition of an external buffer.
Case C In this simulation, fayalite was added to the system. The goal was to ascertain the
effect on pH and therefore on PCE degradation efficiency. A total of 10 g of mineral
with a specific surface area of 30 m2 g-1 were used, using the formula defined by
Borkovec et al. (1993), which incorporates the effect of surface roughness. This
corresponds to a powder with grain size around 1.5 μm.
Results were analyzed considering the time required converting 99% of the initial PCE mass
to ethene (t99%). This metric is directly linked to the buffering effect as the only parameter
influencing the dehalogenation rate is pH: A rapid dechlorination (high t99%) reflects a good
buffering capacity of the mineral. t99% of case C above (named tBC,99%) was used as a
reference value in the sensitivity analysis.

18
2.4.2 Global sensitivity analysis
A global sensitivity analysis was conducted to ascertain the contribution of each parameter
influencing mineral dissolution rate. This leads to identification of (i) insensitive parameters
for model reduction and (ii) sensitive parameters that require a more accurate
characterization. The analysis also improved the understanding of the model behavior and
clarified the interactions among parameters. For each parameter considered, the range of
variability found in the literature was used: the model was run using the two extreme values
while keeping the other parameters fixed. The description of all the cases and the values of
the parameters used for the simulation are given in Table 5. Cases 1 to 5 focus on the
influence of the mineral dissolution kinetic parameters kH+, kW, kOH
-, nH+, nOH
-, EH+ and EW.
The importance of the security factor D was investigated in case 6. The influence of the
thermodynamic parameters KD and ΔH was evaluated in cases 7 and 8, respectively. To get a
better understanding of the model behavior, some parameters were evaluated together, in
particular the kinetic rate constants kH+ and kW (case 2) and the energy activation terms, EH+
and EW (case 5). In addition to model parameters, simulations were run to ascertain the effect
of other important variables. The effect of temperature was evaluated in case 9 where the
model was run for 10 and 15°C. We considered also the inhibition of ionic species on
mineral dissolution (case 10) and the representation of the reactive surface area changes
(case 11). In this latter case, the parameter α was changed from 0.67 (uniform grain size
distribution) to 3.4 (log normal distribution of the grains).
The ts99% obtained from each run was compared to tBC,99% and the difference Δt99% = ts99% -
tBC99% was computed. A high Δt99% indicates a marked contribution of the parameter to the
model output and vice-versa.
19
2.4.3 Mineral ranking
The acid neutralizing potential and lifetime of the minerals selected during the preliminary
screening were also quantified, considering the t99% metric and the mass of mineral
consumed per mol of PCE degraded. For each mineral, the appropriate thermodynamic and
kinetic data were included in the model and are listed in Tables 1, 2 and 3. The same amount
of mineral (50 mmol l-1 and surface area of 300 m2 of mineral l-1 of solution) was considered
in all simulations. The results were used to rank the minerals according to their suitability for
field application as buffering agents.
3 Results and Discussion
3.1 Determination of kinetic and thermodynamic parameters
Tables 1-3 report the results of the literature review conducted to collect the available kinetic
and thermodynamic parameters for the 20 silicate minerals considered in this work. The
stoichiometry of each dissolution reaction is also reported (Table 1), as it can be used to
quantify the buffering potential of each mineral through the number of protons consumed per
mole of dissolution. This value varies among the minerals, from 16 mol of protons per mole
of dissolved mineral (cordierite, chlorite) to 2 moles of protons per mole of dissolved mineral
(enstatite,wollastonite). Mineral dissolution kinetic parameters identified using Eq. 1 are
listed in Table 2. For most minerals, the dissolution parameters in the alkaline range (kOH-
and nOH-) could not be determined as most studies only considered the acid-neutral range.
Even though the datasets considered were produced from experiments in similar conditions,
large differences between them were found. These led to uncertainties in the determination of
the parameters as large as 3 orders of magnitude for kH+ and 2 orders of magnitude for kW.
These large ranges are likely due to one or more of the following: uncertainties in estimates
of the available reactive surface area (Aagaard and Helgeson 1982; Gautier et al. 2001;
20
Helgeson et al. 1984), differences in the experimental design and solid phase preparation
such as stirring rate (Metz and Ganor 2001), grinding method, or differences in the initial
structure and composition of the mineral (Palandri and Kharaka 2004). When datasets for the
same mineral were significantly different, a range of values was determined (Table 2). As an
illustration, Fig. 3 shows the results of the fit for the mineral diopside. Two datasets were
used (Golubev et al. 2005; Knauss et al. 1993) to determine the kinetic parameters. Fitting of
the parameters was done for each dataset. As a result, two values were obtained for each
parameter and the upper and lower limits of the kinetic equation were computed (Fig. 3).
All minerals considered have a pH-dependent dissolution rate with the reaction order of
proton-promoted dissolution nH+ between 0.14 and 1 (average value). Comparison of kinetic
parameters showed high variability. In the acidic range, the kinetic constant kH+ varies over 7
orders of magnitude, the fastest and slowest minerals being nepheline and albite. The kinetic
constant in the neutral range kW shows a slightly smaller variation (4 orders of magnitude
between nepheline and albite).
The kinetic constants determined in this work fall in the range reported by Palandri and
Kharaka (2004) for the majority of the minerals. A mismatch was found in seven cases, and
was attributed to different criteria used to select the datasets. In particular, in contrast to the
compilation of Palandri and Kharaka (2004), in this study only datasets using a similar
experimental setup and conditions were considered.
3.2 Mineral screening based on thermodynamic considerations
The values of the solubility in the acid range at pH 5 and in the basic range at pH 8 are
presented in Fig 4. Minerals with a solubility higher than 10 mmol l-1 are likely to lead to an
increase of pH above 9, which is inhibitory to ORB (Vainberg et al. 2009; Zhuang and
Pavlostathis 1995) and therefore they were excluded. On the other hand, in the acidic range

21
solubility should be sufficient to avoid limitation of mineral dissolution due to
thermodynamic constraints. The minerals selected present a wide range of solubility at pH 5
and 20°C ranging from 4.3 mol l-1 for wollastonite to 8.45 × 10⁻⁵ mol l-1 for riebeckite. All
minerals with solubility lower than 1 mmol l-1 were excluded. Minerals were classified in
three classes according to their change in solubility as a function of pH (Table 6).
3.3 Base simulations
Base simulations demonstrated the positive impact of the addition of silicate mineral on
groundwater pH and on the activity of ORB. If the influence of pH on dechlorination is
neglected, degradation of 99% of 1.5 mmol l-1 of PCE to ethene occurs in 17 d (t99%) with
transient accumulation of VC and to a smaller extent of DCE and TCE (Fig. 5a). Until day 2
the PCE concentration is equal to 0.9 mmol l-1 (PCE solubility). After 2 d, the separate PCE
phase was dissolved and the aqueous PCE concentration started to decrease.
When the feedback of pH on ORB activity is considered, without an external source of
alkalinity, the pH dropped below 4.5 after 9 d, stopping the dechlorination (Fig. 5b).
Degradation of PCE was incomplete and, after 18 d, only 64% of the initial mass was
transformed to DCE and VC. When dechlorination ceased, 4.6 mmol of acetate and 2.7
mmol of hydrochloric acid had been produced, indicating that the two processes contribute
in a similar extent to groundwater acidification. This simulation highlights the need of an
external buffer during enhanced bioremediation of CAHs when the natural soil buffering
capacity is small.
The addition of fayalite had a positive impact on the CAHs degradation rates, with t99% = 25
d (Fig. 5c). The pH initially dropped to 5.1 due to rapid conversion of PCE to VC because
dechlorination was faster than mineral dissolution. Afterwards, the pH returned close to
neutral as the transformation of VC to ethene is slower than the previous dechlorination steps

22
(see maximum degradation rates in Table 4) and because acidic conditions further reduced
the activity of ORB. At the end of the simulation, 7 mmol of fayalite were consumed. When
CAH removal was completed, the pH remained stable at 6.87 and mineral dissolution ceased
since solubility of fayalite is very low at neutral pH (Fig. 1). This simulation suggested that,
for the conditions considered, fayalite is a good candidate for groundwater buffering as pH
remains close to neutral. Moreover, only the quantity required to buffer the acidity produced
was used, and the rest remained in the system. This suggests that fayalite is also a good long-
term source of alkalinity.
3.4 Global sensitivity analyses
3.4.1 Influence of mineral dissolution rate parameters
The results of the global sensitivity analysis are presented in the Table 5. The kinetic rate
parameters in the alkaline range (kOH- and nOH
-) have no influence on the degradation rate
(Δt99% = 0) (cases 1 and 4). The reason is that water remains in the acid-neutral pH range for
the entire simulation period. Therefore, the lack of available data for these parameters does
not limit model application. Conversely, kH+ and kW have a significant impact on the model
response. A five-fold decrease of kH+ and kW (case 2.2) increased t99% to 52.3 d (twice as
long as the base case). When these two parameters were an order of magnitude smaller than
in the base case (case 2.3), 99% degradation of PCE was not achieved. Hence, kH+ and kW
directly control the mineral dissolution rate: When they are too low compared with the CAH
degradation rate, the pH drops rapidly inhibiting bacterial activity. Similarly, the security
factor D has a significant impact on the model output (case 6). An increase of D from 15 to
50 increased t99% by 29.6 d.

23
3.4.2 Influence of activation energy
The influence of the activation energy terms EH+ and EW on the model response is very
limited. EH+ was varied between 18.9 to 132 kJ mol-1 and EW between 51 and 104 .9 kJ mol-
1, corresponding to the minimum and maximum values observed for the 20 selected minerals
(case 5). The resulting Δt99% was equal to -0.2 d (minimal values of the activation energy)
and 2.7 d (maximal values of activation energy). Activation energy controls the changes in
the mineral dissolution rate when temperature is different from 25°C. The simulations
reported here considered a temperature of 20°C fairly close to the reference value, which
partially explains the weak sensitivity. Further numerical simulations with lower
temperatures (e.g., 10°C) indicated that, for typical groundwater temperatures, the influence
of activation energies remains limited.
3.4.3 Influence of solubility constant
Riebeckite has the smallest solubility constant among the minerals considered (log KD
= -7.87). For this value (case 7.1), the target 99% PCE degradation is not reached as the
solution rapidly equilibrates with the mineral phase and dissolution halts. Only a total of 0.16
mmol of mineral dissolved within 25 d (compared to 7 mmol l-1 for the base case).
Conversely, an increase of the solubility constant up to 68.4 (value for chlorite) reduced t99%
to its minimum value, i.e., 17 d (case 7.2), which corresponds to an optimal pH over the
entire simulation period. In this case, the solution always remained far from equilibrium with
the mineral phase and mineral dissolution was only controlled by kinetics.
3.4.4 Influence of temperature
A 10°C decrease in temperature increased t99% to 62.9 d (2.5 fold increase) (case 9.1). In the
simulations, temperature changes affect the mineral dissolution rates and solubility constants.

24
The influence of temperature on the dechlorination rate was instead not taken into account
and the same parameters for biological transformations estimated at 20°C were used. The
reason for this approximation was the lack of information about the extent of reduction of the
dechlorination rate with temperature for the PM consortium. Zhuang and Pavlostathis (1995)
studied the influence of temperature on a ORB mixed culture and showed that the rate was
approximately halved reducing the temperature from 20 to 15°C. On the other hand, a change
in ambient temperature from 20 to 15°C leads to a decrease of the mineral dissolution rate of
fayalite by a factor of 1.8 (Eq. 15). This suggests that, in the temperature range 10-20°C, the
change in dechlorination rate will be similar to the change in dissolution rate and buffering
capacity of the mineral, with little or no effect on the ability of the mineral to counterbalance
the acidity produced. The t99% value will increase nevertheless, as the rate at which CAHs are
transformed is reduced at lower temperatures.
3.4.5 Cation inhibition function
The goal of case 10 was to evaluate the importance of the base cations inhibition terms
fH+ and fW in Eq. 15. As discussed previously, these parameters are available for few minerals
only and it was therefore important to ascertain the resulting error on model predictions. For
the groundwater composition considered in this simulations, the decrease in dechlorination
efficiency when the inhibition terms are considered is relatively small, Δt99% = 4.4 d. This
value should be compared with that resulting from the uncertainty in the kinetic rate
parameters kH+ and kW, which is five or more times larger (Δt99% > 20 d). As a result, the two
inhibition terms can be neglected for the conditions used. For higher concentrations of Al3+,
Na+, K+ and Mg2+, this choice should be tested further. For example, additional calculations
showed that, for the case where the sum of the activities of the base cations exceeds 20 mmol
l-1, the dissolution rate of K-feldspar is halved.

25
3.4.6 Surface area evolution
Case 11 investigated the effect of changing the parameter α in Eq. 18, that is, the equation
governing the change in reactive surface area as mineral dissolution proceeds. The parameter
was changed from 0.67 – which corresponds to a monodisperse population of spherical grains
– to 3.4, the value for a lognormal grain size distribution. Simulation results showed a Δt99%
= 1.9 d. It was then concluded that this parameter has little influence, and uncertainties in its
determination introduce only a small change in simulation results.
3.4.7 Summary of global sensitivity analyses
Results of global sensitivity analyses demonstrated that the most influent parameters are the
solubility constant, KD, and the kinetic dissolution rate constants in the acidic and neutral
range kH+ and kW. The security factor D also influenced significantly the model response.
Experimental determination of the kinetic rate constants is associated with a high level of
uncertainty as discussed before. Therefore, additional efforts should be spent to characterize
better those parameters, in particular in field conditions. With current knowledge this method
can still be successful but it might be necessary to overestimate the amount of mineral to be
injected, to guarantee sufficient buffering capacity.
3.5 Comparison among minerals
Additional simulations were used to rank the 12 minerals previously selected on the basis of
their solubility in the acid/alkaline pH range (i.e., those belonging to class 3 in Table 6). The
minerals were ordered considering the time required to reach 99% degradation of the initial
PCE mass, i.e., the more suitable minerals had lower t99% values. Results are reported in
Table 7. Of the twelve minerals tested, five (anorthite, chlorite, diopside, tremolite and
enstatite) had a dissolution rate that was too low to counterbalance acidity produced by the

26
dechlorination. As a result, the target 99% PCE degradation was not reached and byproducts
(mainly vinyl chloride) accumulated. Thus, these minerals were excluded from the list of
candidate buffers. The kinetic constants kH+ and kW for these minerals were less than 10-8
mol m2 s-1 and 10-11 mol m2 s-1, respectively. Among the remaining eight minerals, t99%
varied from 21 d (nepheline) to 54 d (andradite). The minerals with smaller t99% (< 30 d),
namely nepheline, fayalite, glaucophane and lizardite, are the best candidates as acid-
neutralizing agents. This result is partially corroborated by Kleiv and Sandvik (2000), who
recognized the buffering properties of nepheline. The amount of mineral consumed to buffer
the same amount of PCE was also computed (Table 7). Only relatively small variations were
found, ranging from 0.32 to 0.97 g mineral consumed per mmol of PCE transformed.
According to simulation results, dechlorination of 1.5 mmol of PCE will consume 0.7 to 1.5
g l-1 of mineral for a period of approximately one month, depending on the mineral used.
4 Summary and conclusions
The importance of groundwater pH control for enhanced in situ bioremediation of CAHs as
well as other remediation technologies is well recognized. A batch biogeochemical model
was implemented to evaluate the use of silicate minerals as buffering agents during the
treatment of contaminated sites. To the best of our knowledge, this is the first study focusing
on the use of silicate mineral powder in aquifers. Although in this work the technology was
applied to the specific case of CAH bioremediation, the geochemical model could be applied
to other remediation processes requiring maintenance of neutral pH. As it stands, the model
can be used as a design tool to calculate the amount of mineral needed. This requires the
knowledge of the initial mass of CAHs.
Eight potentially suitable minerals were identified through the screening methodology. The
other silicate minerals were excluded as their dissolution kinetic was too low to neutralize
27
the acidity produced by the biological processes. The most promising candidate was
nepheline, due to its relatively rapid dissolution rate. This result extends the work of Kleiv
and Sandvik (2000), who proposed its use as buffering agent for heavy metal stabilization.
The minerals considered in this study can be easily found on the market, as they are used in
industrial processes (such as glass making, ceramics, abrasive) or in mine tailings, and are
therefore relatively inexpensive. In the context of field application, the local availability of
the mineral should also be assessed. The minerals considered in this study are distributed
worldwide and mineralogical databases (e.g., www.mindat.org) can be used to identify local
deposits and availability. For this reason, a detailed evaluation of the treatment costs,
although important, is site-specific and was beyond the scope of this study.
A sensitivity analyses was conducted to identify the parameters that control the model
response and therefore need accurate characterization. It was observed that the most
influential parameters are the mineral dissolution rates in the acidic and neutral ranges, kH+
and kW, the reaction order for protons promoted dissolution, nH+, and the solubility constant
KD. Due to the large uncertainties associated with the determination of the kinetic rate
constants, the results of the sensitivity analysis suggested that model predictions should be
further verified. Groundwater temperature is also important, as it controls both the rate of
acidity production and the buffering capacity of the mineral.
The model includes the main geochemical and microbial processes that control pH evolution.
Interactions between minerals and microorganisms were, however, neglected due to the lack
of reliable data. Possible feedbacks include the microbial enhancement of mineral
weathering rates (Barker et al. 1998; Ullman et al. 1996; Vandevivere et al. 1994) and the
inhibition of bacteria by trace elements release during mineral dissolution (Dopson et al.
2008). The other important process not included in the model is the possible passivation of

28
the mineral reactive surface due to secondary phase precipitation, which would decrease the
dissolution rate and buffering capacity. Microcosm experiments are currently being
conducted to validate the model and ascertain the importance of the different modeling
assumptions.
Acknowledgements
This work was funded by the Swiss National Science Foundation (SNSF) (200021-120160/1). The
authors thank Nicolas Meisser (Cantonal Geology Museum, UNIL, Lausanne) for his useful insights
on the theory of mineral dissolution, and the reviewers for their insightful comments.

29
References
Aagaard, P., & Helgeson, H. C. (1982). Thermodynamic and kinetic constraints on reaction-
rates among minerals and aqueous-solutions.1. Theoretical considerations. American
Journal of Science, 282(3), 237-285, doi:10.2475/ajs.282.3.237.
Adamson, D. T., Lyon, D. Y., & Hughes, J. B. (2004). Flux and product distribution during
biological treatment of tetrachloroethene dense non-aqueous-phase liquid.
Environmental Science & Technology, 38(7), 2021-2028, doi:10.1021/es034737a.
AFCEE (2004).Principles and Practices of Enhanced Anaerobic Bioremediation of
Chlorinated Solvents. Washington, DC: US Department of defense, Air Force Center
for Environmental Excellence and the Environmental Security Technology
Certification Program (ESTCP).
Alkattan, M., Oelkers, E. H., Dandurand, J. L., & Schott, J. (1998). An experimental study of
calcite and limestone dissolution rates as a function of pH from -1 to 3 and
temperature from 25 to 80 degrees C. Chemical Geology, 151(1-4), 199-214,
doi:10.1016/s0009-2541(98)00080-1.
Allison, J. D., Brown, D. S., & Novo-Gradac, K. J. (1991).MINTEQA2/PRODEF2 - A
Geochemical Assessment Model for Environmental Systems: Version 4.0. User's
Manual. Environmental Research Laboratory, Office of Research and Development,
U.S. Environmental Protection Agency, Athens, Georgia.
Amos, B. K., Suchomel, E. J., Pennell, K. D., & Loffler, F. E. (2008). Microbial activity and
distribution during enhanced contaminant dissolution from a NAPL source zone.
Water Research, 42(12), 2963-2974, doi:10.1016/j.watres.2008.03.015.
Appelo, C. A. J., & Postma, D. (2005). Geochemistry, Groundwater and Pollution. Leiden,
The Netherlands: AA Balkema Publishers.

30
Aulenta, F., Majone, M., & Tandoi, V. (2006). Enhanced anaerobic bioremediation of
chlorinated solvents: environmental factors influencing microbial activity and their
relevance under field conditions. Journal of Chemical Technology and Biotechnology,
81(9), 1463-1474, doi:10.1002/jctb.1567.
Aulenta, F., Pera, A., Rossetti, S., Papini, M. P., & Majone, M. (2007). Relevance of side
reactions in anaerobic reductive dechlorination microcosms amended with different
electron donors. Water Research, 41(1), 27-38, doi:10.1016/j.watres.2006.09.019.
Bailey, J. E., & Ollis, D. F. (1986). Biochemical engineering fundamentals. 2nd edition.
New-York: McGraw-Hill.
Barker, W. W., Welch, S. A., Chu, S., & Banfield, J. F. (1998). Experimental observations of
the effects of bacteria on aluminosilicate weathering. American Mineralogist, 83(11-
12), 1551-1563.
Berg, A., & Banwart, S. A. (2000). Carbon dioxide mediated dissolution of Ca-feldspar:
implications for silicate weathering. Chemical Geology, 163(1-4), 25-42,
doi:10.1016/s0009-2541(99)00132-1.
Blanc, P., Lassin, A., & Piantone, P. (2007).Thermoddem a database devoted to waste
minerals. BRGM, Orléans, France. http://thermoddem.brgm.fr.
Borkovec, M., Wu, Q., Degovics, G., Laggner, P., & Sticher, H. (1993). Surface-area and
size distributions of soil particles. Colloids and Surfaces A: Physicochemical and
Engineering Aspects, 73, 65-76, doi:10.1016/0927-7757(93)80007-2.
Brandt, F., Bosbach, D., Krawczyk-Barsch, E., Arnold, T., & Bernhard, G. (2003). Chlorite
dissolution in the acid pH-range: A combined microscopic and macroscopic approach.
Geochimica et Cosmochimica Acta, 67(8), 1451-1461, doi:10.1016/s0016-
7037(02)01293-0.

31
Brantley, S. L., Kubicki, J. D., & White, A. F. (2008). Kinetics of water-rock interaction.
New York: Springer.
Chou, L., & Wollast, R. (1984). Study of the weathering of albite at room-temperature and
pressure with a fluidized-bed reactor. Geochimica et Cosmochimica Acta, 48(11),
2205-2217, doi:10.1016/0016-7037(84)90217-5.
Chu, M., Kitanidis, P. K., & McCarty, P. L. (2004). Possible factors controlling the
effectiveness of bioenhanced dissolution of non-aqueous phase tetrachloroethene.
Advances in Water Resources, 27(6), 601-615, doi:10.1016/j.advwatres.2004.03.002.
Cope, N., & Hughes, J. B. a. (2001). Biologically-enhanced removal of PCE from NAPL
source zones. Environmental Science & Technology, 35(10), 2014-2021.
Cupples, A. M., Spormann, A. M., & McCarty, P. L. (2004). Comparative evaluation of
chloroethene dechlorination to ethene by Dehalococcoides-like microorganisms.
Environmental Science & Technology, 38(18), 4768-4774, doi:10.1021/es049965z.
Curtis, G. P. (2003). Comparison of approaches for simulating reactive solute transport
involving organic degradation reactions by multiple terminal electron acceptors.
Computers & Geosciences, 29(3), 319-329, doi:10.1016/s0098-3004(03)00008-6.
Czupyrna, G. (1989). In situ immobilization of heavy-metal-contaminated soils. Noyes Data
Corp.
Davis, J. A., & Hayes, K. F. Geochemical processes at mineral surfaces. In S. American
Chemical (Ed.), American Chemical Society, Meeting, Washington D.C, USA, 1986.
Dixon, D. G., & Hendrix, J. L. (1993). Theoretical basis for variable order assumption in the
kinetics of leaching of discrete grains. Aiche Journal, 39(5), 904-907,
doi:10.1002/aic.690390520.

32
Dopson, M., Halinen, A. K., Rahrmen, N., Bostrom, D., Sundkvist, J. E., Riekkola-
Vanhanen, M., et al. (2008). Silicate mineral dissolution during heap bioleaching.
Biotechnology and Bioengineering, 99(4), 811-820, doi:10.1002/bit.21628.
Emmanuel, S., & Berkowitz, B. (2005). Mixing-induced precipitation and porosity evolution
in porous media. Advances in Water Resources, 28(4), 337-344,
doi:10.1016/j.advwatres.2004.11.010.
Fennell, D. E., & Gossett, J. M. (1998). Modeling the production of and competition for
hydrogen in a dechlorinating culture. Environmental Science & Technology, 32(16),
2450-2460, doi:10.1021/es980136l.
Fernandez-Caliani, J. C., Barba-Brioso, C., & Perez-Lopez, R. (2008). Long-term interaction
of wollastonite with acid mine water and effects on arsenic and metal removal.
Applied Geochemistry, 23(5), 1288-1298, doi:10.1016/j.apgeochem.2007.11.018.
Fetzner, S. (1998). Bacterial dehalogenation. Applied Microbiology and Biotechnology,
50(6), 633-657, doi:10.1007/s002530051346.
Gaus, I., Audigane, P., Andre, L., Lions, J., Jacquemet, N., Dutst, P., et al. (2008).
Geochemical and solute transport modeling for CO2 storage, what to expect from it?
International Journal of Greenhouse Gas Control, 2(4), 605-625,
doi:10.1016/j.ijggc.2008.02.011.
Gautier, J. M., Oelkers, E. H., & Schott, J. (2001). Are quartz dissolution rates proportional to
BET surface areas? Geochimica et Cosmochimica Acta, 65(7), 1059-1070,
doi:10.1016/s0016-7037(00)00570-6.
Golubev, S. V., Pokrovsky, O. S., & Schott, J. (2005). Experimental determination of the
effect of dissolved CO2 on the dissolution kinetics of Mg and Ca silicates at 25
degrees C. Chemical Geology, 217(3-4), 227-238,
doi:10.1016/j.chemgeo.2004.12.011.
33
Hamilton, J. P., Brantley, S. L., Pantano, C. G., Criscenti, L. J., & Kubicki, J. D. (2001).
Dissolution of nepheline, jadeite and albite glasses: Toward better models for
aluminosilicate dissolution. Geochimica et Cosmochimica Acta, 65(21), 3683-3702,
doi:10.1016/S0016-7037(01)00724-4.
Helgeson, H. C., Murphy, W. M., & Aagaard, P. (1984). Thermodynamic and kinetic
constraints on reaction-rates among minerals and aqueous-solution.2. Rate constants,
effective surface-area, and the hydrolysis of feldspar. Geochimica et Cosmochimica
Acta, 48(12), 2405-2432.
Hodson, M. E. (2006). Does reactive surface area depend on grain size? Results from pH 3,
25°C far-from-equilibrium flow-through dissolution experiments on anorthite and
biotite. Geochimica et Cosmochimica Acta, 70(7), 1655-1667,
doi:10.1016/j.gca.2006.01.001.
Holliger, C., Schraa, G., Stams, A. J. M., & Zehnder, A. J. B. (1993). A highly purified
enrichment culture couples the reductive dechlorination of tetrachloroethene to
growth. Applied and Environmental Microbiology, 59(9), 2991-2997.
ITRC (2005).Technical and Regulatory Guidance for In Situ Chemical Oxidation of
Contaminated Soil and Groundwater, 2nd ed. ISCO-2
Kieffer, B., Jove, C. F., Oelkers, E. H., & Schott, J. (1999). An experimental study of the
reactive surface area of the Fontainebleau sandstone as a function of porosity,
permeability, and fluid flow rate. Geochimica et Cosmochimica Acta, 63(21), 3525-
3534, doi:10.1016/s0016-7037(99)00191-x.
Kleiv, R. A., & Sandvik, K. L. (2000). Using tailings as heavy metal adsorbents - The effect
of buffering capacity. Minerals Engineering, 13(7), 719-728.
34
Knauss, K. G., Nguyen, S. N., & Weed, H. C. (1993). Diopside dissolution kinetics as a
function of pH, CO2, temperature and time. Geochimica et Cosmochimica Acta,
57(2), 285-294.
Knauss, K. G., & Wolery, T. J. (1986). Dependence of albite dissolution kinetics on pH and
time at 25-degrees-C and 70 degrees-C. Geochimica et Cosmochimica Acta, 50(11),
2481-2497, doi:10.1016/0016-7037(86)90031-1.
Kouznetsova, I., Mao, X. M., Robinson, C., Barry, D. A., Gerhard, J. I., & McCarty, P. L.
(2010). Biological reduction of chlorinated solvents: Batch-scale geochemical
modeling. Advances in Water Resources, 33(9), 969-986,
doi:10.1016/j.advwatres.2010.04.017.
Krumholz, L. R. (1997). Desulfuromonas chloroethenica sp. nov. uses tetrachloroethylene
and trichloroethylene as electron acceptors. International Journal of Systematic
Bacteriology, 47(4), 1262-1263.
Lasaga, A. C. (1995). Fundamentals approaches in describing mineral dissolution and
precipitation rates. In A. F. White, & S. L. Brantley (Eds.), Chemical Weathering
Rate of Silicate Minerals, Reviews in Mineralogy. (pp. 23-86). Mineralogic Society of
America.
Lee, Y. J., Miyahara, T., & Noike, T. (2002). Effect of pH on microbial hydrogen
fermentation. Journal of Chemical Technology and Biotechnology, 77(6), 694-698,
doi:10.1002/jctb.623.
Lichtner, P. C. (1988). The quasi-stationary state approximation to coupled mass-transport
and fluid-rock interaction in a porous-medium. Geochimica et Cosmochimica Acta,
52(1), 143-165, doi:10.1016/0016-7037(88)90063-4.

35
Likens, G. E., Buso, D. C., Dresser, B. K., Bernhardt, E. S., Hall, R. O., Macneale, K. H., et
al. (2004). Buffering an acidic stream in New Hampshire with a silicate mineral.
Restoration Ecology, 12(3), 419-428.
Loffler, F. E., Tiedje, J. M., & Sanford, R. A. (1999). Fraction of electrons consumed in
electron acceptor reduction and hydrogen thresholds as indicators of halorespiratory
physiology. Applied and Environmental Microbiology, 65(9), 4049-4056.
Lowson, R. T., Comarmond, M. C. J., Rajaratnam, G., & Brown, P. L. (2005). The kinetics of
the dissolution of chlorite as a function of pH and at 25 degrees C. Geochimica et
Cosmochimica Acta, 69(7), 1687-1699, doi:10.1016/j.gca.2004.09.028.
Lozecznik, S., Sparling, R., Oleszkiewicz, J. A., Clark, S., & VanGulck, J. F. (2010).
Leachate treatment before injection into a bioreactor landfill: Clogging potential
reduction and benefits of using methanogenesis. Waste Management, 30(11), 2030-
2036, doi:10.1016/j.wasman.2010.04.024.
Marini, L. (2007). Geological sequestration of carbon dioxide: thermodynamics, kinetics,
and reaction path modeling. Elsevier.
Mast, M. A., & Drever, J. I. (1987). The effect of oxalate on the dissolution rates of
oligoclase and tremolite. Geochimica et Cosmochimica Acta, 51(9), 2559-2568.
MaymoGatell, X., Chien, Y. T., Gossett, J. M., & Zinder, S. H. (1997). Isolation of a
bacterium that reductively dechlorinates tetrachloroethene to ethene. Science,
276(5318), 1568-1571, doi:10.1126/science.276.5318.1568.
McCarty, P. L., Chu, M. Y., & Kitanidis, P. K. a. (2007). Electron donor and pH relationships
for biologically enhanced dissolution of chlorinated solvent DNAPL in groundwater.
European Journal of Soil Biology, 43(5-6), 276-282,
doi:10.1016/j.ejsobi.2007.03.004.

36
Metz, V., & Ganor, J. (2001). Stirring effect on kaolinite dissolution rate. Geochimica et
Cosmochimica Acta, 65(20), 3475-3490.
Mussati, M. C., Fuentes, M., Aguirre, P. A., & Scenna, N. J. (2005). A steady-state module
for modeling anaerobic biofilm reactors. Latin American Applied Research, 35(4),
255-263.
Neumann, A., Scholzmuramatsu, H., & Diekert, G. (1994). Tetrachloroethene metabolism of
Dehalospirillum multivorans. Archives of Microbiology, 162(4), 295-301.
Oelkers, E. H., & Schott, J. (2001). An experimental study of enstatite dissolution rates as a
function of pH, temperature, and aqueous Mg and Si concentration, and the
mechanism of pyroxene/pyroxenoid dissolution. Geochimica et Cosmochimica Acta,
65(8), 1219-1231, doi:10.1016/s0016-7037(00)00564-0.
Palandri, J. L., & Kharaka, Y. K. (2004).A compilation of rate parameters of water-mineral
interaction kinetics for application to geochemical modeling. U.S. Geological Survey
Open File Report 2004-1068.
Parkhurst, D. L., & Appelo, C. A. J. (1999).User's Guide to PHREEQC—a computer
program for speciation, reaction-path, 1D-transport, and inverse geochemical
calculations. Technical Report 99-4259. Water-Resources Investigations. Report 99-
4259. Denver, CO: U.S. Geological Survey.
Payne, F. C., Suthersan, S. S., Nelson, D. K., Suarez, G., Tasker, I., & Akladiss, N. (2006).
Enhanced reductive dechlorination of PCE in unconsolidated soils. Remediation
Journal, 17(1), 5-21, doi:10.1002/rem.20109.
Pokrovsky, O. S., & Schott, J. (2000). Kinetics and mechanism of forsterite dissolution at 25
degrees C and pH from 1 to 12. Geochimica et Cosmochimica Acta, 64(19), 3313-
3325.
37
Robinson, C., & Barry, D. A. (2009). Design tool for estimation of buffer requirement for
enhanced reductive dechlorination of chlorinated solvents in groundwater.
Environmental Modelling and Software, 24(11), 1332-1338,
doi:10.1016/j.envsoft.2009.03.012.
Robinson, C., Barry, D. A., McCarty, P. L., Gerhard, J. I., & Kouznetsova, I. (2009). pH
control for enhanced reductive bioremediation of chlorinated solvent source zones.
Science of the Total Environment, 407(16), 4560-4573,
doi:10.1016/j.scitotenv.2009.03.029.
Roychowdhury, S., Cox, D., & Levandowsky, M. (1988). production of hydrogen by
microbial fermentation. International Journal of Hydrogen Energy, 13(7), 407-410.
Schepers, A. W., Thibault, J., & Lacroix, C. (2002). Lactobacillus helveticus growth and
lactic acid production during pH-controlled batch cultures in whey permeate/yeast
extract medium. Part II: kinetic modeling and model validation. Enzyme and
Microbial Technology, 30(2), 187-194.
Scholz-Muramatsu, H., Neumann, A., Messmer, M., Moore, E., & Diekert, G. (1995).
Isolation and characterization of Dehalospirillum multivorans gen. nov., sp. nov., a
tetrachloroethene-utilizing, strictly anaerobic bacterium. Archives of Microbiology,
163(1), 48-56.
Schott, J., & Berner, R. A. (1985). Dissolution mechanisms of pyroxenes and olivines during
weathering. In J. I. Drever (Ed.), The Chemistry of Weathering Hingham,
Massachusetts, USA: Kluwer Academic.
Scislewski, A., & Zuddas, P. (2010). Estimation of reactive mineral surface area during
water-rock interaction using fluid chemical data. Geochimica et Cosmochimica Acta,
74(24), 6996-7007, doi:10.1016/j.gca.2010.09.015.
38
Sung, Y., Ritalahti, K. M., Sanford, R. A., Urbance, J. W., Flynn, S. J., Tiedje, J. M., et al.
(2003). Characterization of two tetrachloroethene-reducing, acetate-oxidizing
anaerobic bacteria and their description as Desulfuromonas michiganensis sp. nov.
Applied and Environmental Microbiology, 69(5), 2964-2974.
Suyama, A., Iwakiri, R., Kai, K., Tokunaga, T., Sera, N., & Furukawa, K. (2001). Isolation
and characterization of Desulfitobacterium sp strain Y51 capable of efficient
dehalogenation of tetrachloroethene and polychloroethanes. Bioscience Biotechnology
and Biochemistry, 65(7), 1474-1481.
Sverdrup, H. (1990). The kinetics of base cation release due to chemical weathering.
University Press, Lund, Sweden.
Sverdrup, H. U., & Warfvinge, P. (1995). Estimating field weathering rates using laboratory
kinetics of primary silicate minerals in natural soil environment in relation to a
chemical weathering model. In A. F. White, & S. L. Brantley (Eds.), Chemical
weathering rates of silicates of silicate minerals. (Vol. Rev. Mineral.31, pp. 485-541).
Tole, M. P., Lasaga, A. C., Pantano, C., & White, W. B. (1986). The kinetics of dissolution of
nepheline (NaAlSiO4). Geochimica et Cosmochimica Acta, 50(3), 379-392.
Ullman, W. J., Kirchman, D. L., Welch, S. A., & Vandevivere, P. (1996). Laboratory
evidence for microbially mediated silicate mineral dissolution in nature. Chemical
Geology, 132(1-4), 11-17.
Vainberg, S., Condee, C. W., & Steffan, R. J. (2009). Large-scale production of bacterial
consortia for remediation of chlorinated solvent-contaminated groundwater. Journal
of Industrial Microbiology & Biotechnology, 36(9), 1189-1197, doi:10.1007/s10295-
009-0600-5.

39
Vandevivere, P., Welch, S. A., Ullman, W. J., & Kirchman, D. L. (1994). Enhanced
dissolution of silicate minerals by bacteria at near-neutral pH. Microbial Ecology,
27(3), 241-251.
Vangrinsven, J. J. M., & Vanriemsdijk, W. H. (1992). Evaluation of batch and column
techniques to measure weathering rates in soils. Geoderma, 52(1-2), 41-57.
Weissbart, E. J., & Rimstidt, J. D. (2000). Wollastonite: Incongruent dissolution and leached
layer formation. Geochimica et Cosmochimica Acta, 64(23), 4007-4016.
White, A. F., Blum, A. E., Schulz, M. S., Bullen, T. D., Harden, J. W., & Peterson, M. L.
(1996). Chemical weathering rates of a soil chronosequence on granitic alluvium .1.
Quantification of mineralogical and surface area changes and calculation of primary
silicate reaction rates. Geochimica et Cosmochimica Acta, 60(14), 2533-2550.
White, A. F., & Brantley, S. L. (1995). Chemical weathering rates of silicate minerals.
Mineralogical Society of America.
White, A. F., & Brantley, S. L. (2003). The effect of time on the weathering of silicate
minerals: why do weathering rates differ in the laboratory and field? Chemical
Geology, 202(3-4), 479-506, doi:10.1016/j.chemgeo.2003.03.001.
Witkamp, G. J., Vandereerden, J. P., & Vanrosmalen, G. M. (1990). Growth of Gypsum. 1.
Kinetics. Journal of Crystal Growth, 102(1-2), 281-289, doi:10.1016/0022-
0248(90)90912-5.
Wogelius, R. A., & Walther, J. V. (1992). Olivine dissolution kinetics at near-surface
conditions. Chemical Geology, 97(1-2), 101-112.
Yang, Y. R., & McCarty, P. L. (2000). Biologically enhanced dissolution of tetrachloroethene
DNAPL. Environmental Science & Technology, 34(14), 2979-2984.

40
Yang, Y. R., & McCarty, P. L. (2002). Comparison between donor substrates for biologically
enhanced tetrachloroethene DNAPL dissolution. Environmental Science &
Technology, 36(15), 3400-3404, doi:10.1021/es011408e.
Yaws, C. L. (1999). Chemical properties handbook: physical, thermodynamic,
environmental, transport, safety, and health related properties for organic and
inorganic chemicals. New York, USA: McGraw-Hill.
Yu, S., & Semprini, L. (2004). Kinetics and modeling of reductive dechlorination at high
PCE and TCE concentrations. Biotechnology and Bioengineering, 88(4), 451-464.
Zhang, H., & Bloom, P. R. (1999). The pH dependence of hornblende dissolution. Soil
Science, 164(9), 624-632.
Zhu, C., Lu, P., Zheng, Z. P., & Ganor, J. (2010). Coupled alkali feldspar dissolution and
secondary mineral precipitation in batch systems: 4. Numerical modeling of kinetic
reaction paths. Geochimica et Cosmochimica Acta, 74(14), 3963-3983,
doi:10.1016/j.gca.2010.04.012.
Zhuang, P., & Pavlostathis, S. G. (1995). Effect of temperature, pH and electron-donor on the
microbial reductive dechlorination of chloroalkenes. Chemosphere, 31(6), 3537-3548,
doi:10.1016/0045-6535(95)00204-L.

41
Tables
Table 1 Dissolution reactions and thermodynamic parameters of the selected silicate
minerals.
Silicate
mineral Dissolution reaction
Log KD
(T = 25°C) a ΔH [J mol-1] a
Albite NaAlSi3O8 + 4H+ + 4H2O = Al3+ + Na+ + 3H4SiO4 4.14 -95 623
Almandine Fe3Al2Si3O12 + 12H+ = 2Al3+ + 3Fe2+ + 3H4SiO4 42.16 -465 683
Andradite Ca3Fe2Si3O12 + 10H+ + H2O = 0.5O2 + 3Ca2+ + 2Fe2+ + 3H4SiO4 16.79 -137 101
Anorthite Ca(Al2Si2)O8 + 8H+ = 2Al3+ + Ca2+ + 2H4SiO4 25.31 -314 358
Chlorite Mg5Al2Si3O10(OH)8 + 16H+ = 5Mg2+ + 2Al3+ + 3H4SiO4 + 6H2O 68.38b -634 275b
Cordierite Mg2Al3(AlSi5)O18 + 16H+ + 2H2O = 4Al3+ + 2Mg2+ + 5H4SiO4 49.41 -660 411
Diopside CaMg(SiO3)2 + 4H+ + 2H2O = Ca2+ + Mg2+ + 2H4SiO4 21.73 -158 241
Enstatite MgSiO3 + 2H+ + 1H2O = Mg2+ + H4SiO4 11.83 -95 552
Fayalite Fe2SiO4 + 4H+ = 2Fe2+ + H4SiO4 19.02 -159 491
Forsterite Mg2SiO4 + 4H+ = 2Mg2+ + H4SiO4 28.60 -219 449
Glaucophane Na2(Mg3Al2)Si8O22(OH)2 + 14H+ + 8H2O = 2Al3+ + 3Mg2+ +
2Na+ + 8H4SiO4 36.99 -397 394
Grossular Ca3Al2Si3O12 + 12H+ = 2Al3+ + 3Ca2+ + 3H4SiO4 49.36 -449 383
Jadeite NaAl(SiO3)2 + 4H+ + 2H2O = Al3+ + Na+ + 2H4SiO4 7.55 -100 168
Leucite KAlSi2O6 + 2H2O + 4H+ = 2H4SiO4 + Al3+ + K+ 6.42 c -92 465c
Lizardite Mg3Si2O5(OH)4 + 6H+ = 3Mg2+ + H2O + 2H4SiO4 32.56 -245 718
Nepheline Na(AlSi)O4 + 4H+ = Al3+ + Na+ + H4SiO4 14.07 -146 839
Riebeckite Na2(Fe3Fe2)Si8O22(OH)2 + 12H+ + 9H2O = 0.5O2 + 5Fe2+ + 2Na+
+ 8H4SiO4 -7.81 -18 281
Spodumene LiAlSi2O6 +4H+ = + Al3+ + Li+ + 2H2O + 2SiO2 6.99 d -89 181d
Tremolite (Ca2Mg5)Si8O22(OH)2 + 14H+ + 8H2O = 2Ca2+ + 5Mg2+ +
8H4SiO4 67.25 -520 914
Wollastonite CaSiO3 + 2H+ + H2O = Ca2+ + H4SiO4 14.02 -88 220 a from THERMODDEM database except where indicated otherwise b from PHREEQC database c from MINTEQ database d from LLNL database

42
Table 2 Dissolution rate kinetic parameters of selected silicate minerals obtained by fitting Eq. 1 to literature datasets.
Silicate mineral
Acid mechanism Neutral mechanism
Basic mechanism Reference of datasets
log kH+
log [mol m-2 s-1] nH
+
log kW
log [mol m-2 s-1] log kOH
-
log [mol m-2 s-1] nOH
-
Albite [-11; -10.16] [0.457; 1] [-12.4; -12.56] [-16.3; -15.6] [-0.5; -0.572] Chou and Wollast (1984); Knauss and Wolery (1986)
Almandine -5.2 1 -10.7 -13.71 -0.35 Sverdrup (1990) andradite -5.2 1 -10.7 - - Sverdrup (1990) Anorthite -8.2 0.55 -11.2 - - Berg and Banwart (2000); Hodson (2006) Chlorite [-10.9;-9.79] [0.25-0.49] -13 -16.79 -0.43 Brandt et al. (2003); Lowson (2005) Cordierite -3.8 1 -11.2 - - Sverdrup (1990) Diopside [-8.88; -9.46] [0.28;0.41] [-11.21; -11.01] - - Knauss et al. (1993); Golubev et al.(2005) Enstatite [-8.98; -9.02] [0.24; 0.6] -12.72 - - Schott and Berner (1985); Oelkers and Schott
(2001) Fayalite [-5.9; -4.8] [0.69; 1] -9.5 - - Sverdrup (1990); Wogelius and Walther (1992) Forsterite [-6.78; -6.70] [0.37; 0.74] [-10.7; -10.1] - - Pokrovsky and Schott (2000) Golubev et al.
(2005) Glaucophane -5.6 0.7 -10.1 - - Sverdrup (1990) Grossular -5.1 1 -10.7 - - Sverdrup (1990) Jadeite [-8.82; -6] [0.7; 0.72] [-12; -9.5] -14 -0.3 Sverdrup (1990); Hamilton et al. (2001) Leucite -6 0.7 -9.2 - - Sverdrup (1990) Lizardite -5.7 0.8 -12.4 - - Sverdrup (1990) Nepheline -3.47 0.97 -8.61 - - Tole et al. (1986) Riebeckite -7.7 0.7 -12.2 - - Sverdrup (1990) Spodumene -4.6 0.7 -9.3 - - Sverdrup (1990) Tremolite [-11.9; -8.4] [0; 0.7] [-12.5; -10.6] - - Mast and Drever (1987); Sverdrup (1990) Wollastonite [-8.72;-7.13] [0; 0.28] - - - Weissbart and Rimstidt (2000); Golubev et al
(2005)

43
Table 3 Activation energy terms of silicate mineral dissolution in acid, neutral and basic
range a.
Silicate mineral Activation energy
EH+
[kJ mol-
1]
EW [kJ mol-1] EOH- [kJ mol-
1]
Albite 65 69.8 71
Almandine 94.4 103.8 37.8
Andradite 94.41 103.8 n.d.b
Anorthite 16.6 17.8 n.d.
Chlorite 88 88 88
Cordierite 113.3 28.3 n.d.
Diopside 96.1 40.6 n.d.
Enstatite 80 80 n.d.
Fayalite 94.4 94.4 n.d.
Forsterite 67.2 79 n.d.
Glaucophane 85 94.4 n.d.
Grossular 85 103.8 n.d.
Jadeite 132.2 94.4 n.d.
Leucite 132.2 75.5 56.6
Lizardite 75.5 56.6 n.d.
Nepheline 62.9 65.4 37.8
Riebeckite 56.6 47.2 n.d.
Spodumene 94.4 66.1 n.d.
Tremolite 18.9 94.4 n.d.
Wollastonite 54.7 54.7 n.d. a Data are from Palandri and Kharaka (2004). b n.d. = not determined

44
Table 4 Parameters for the microbial dechlorination model.
Parameter and units Value Maximum degradation rates [μmol mg-protein-1 d-1] a kPCE,max 13.3 kTCE,max 124 kDCE,max 22 kVC,max 2.4 Half velocity constants [μmol l-1] a Ks,PCE 3.9 Ks,TCE 2.8 Ks,DCE 1.9 Ks,VC 602 Haldane inhibition constants [μmol l-1] a KH,PCE 900 KH,DCE 6000 KH,VC 7000 Competitive inhibition constants [μmol l-1] a KCI,PCE 3.86 KCI,TCE 2.76 KCI,DCE
1.90 KCI,VC 602.00 Biomass yields [mg-protein/μmol Cl-] b Y 4.8 × 10⁻³ First-order decay constant [d-1] c kd 2 × 10⁻² pH inhibition function parameters d n [-] 3.5 σ [pH units] 2.1 pHopt [pH units] 6.7 Fraction of H2 used for organohalide respiration [-] f fmin 0.35 a Yu and Semprini (2004) b MaymoGatell et al.(1997) c Fennell and Gossett (1998) d Parameters fitted from data of Zhuang and Pavlostathis (1995) e Assumed. The minimal value was chosen as it represents the worst case in term of groundwater acidification. f Average value between 0.2 and 0.5 (AFCEE 2004) g Calculated from (Vangrinsven and Vanriemsdijk 1992)

45
Table 5 Result of global sensitivity analysis. Case-specific parameters/conditions used and value of ts99% and Δt99%. Case Parameters Units Base case value Sensitivity value 1 BC value Case 1.1 Case 1.2 log kOH
- log [mol m-2 s-1] - -16.3 -13.7 Results ts99% 25 25 Δt99% 0 0 2 BC value Case 2.1 Case 2.2 Case 2.3 log kW log [mol m-2 s-1] -5.35 -4.85 -5.85 -6.35
log kH+ log [mol m-2 s-1] -9.5 -9 -10 -10.5
Results ts99% 17 52.3 Not reached Δt99% -8 27.3 - 3 BC value Case 3.1 Case 3.2 nH
+ - 0.85 0.28 1 Results ts99% 17 30.6 Δt99% -8 5.6 4 BC value Case 4.1 Case 4.2 nOH
- - 0.85 0 1 Results ts99% 25 25 Δt99% 0 0 5 BC value Case 5.1 Case 5.2 EW [kJ mol-1] 94.4 51 104 EH
+ [kJ mol-1] 94.4 18.9 132 Results ts99% 24.8 27.7 Δt99% -0.2 2.7 6 BC value Case 6.1 Case 6.2 Security factor D - 15 1 50 Results ts99% 17 54.6 Δt 99% -8 29.6 7 BC value Case 7.1 Case 7.2 Case 7.3 Solubility constant KD - 19.02 -7.8 68.4 1 Results
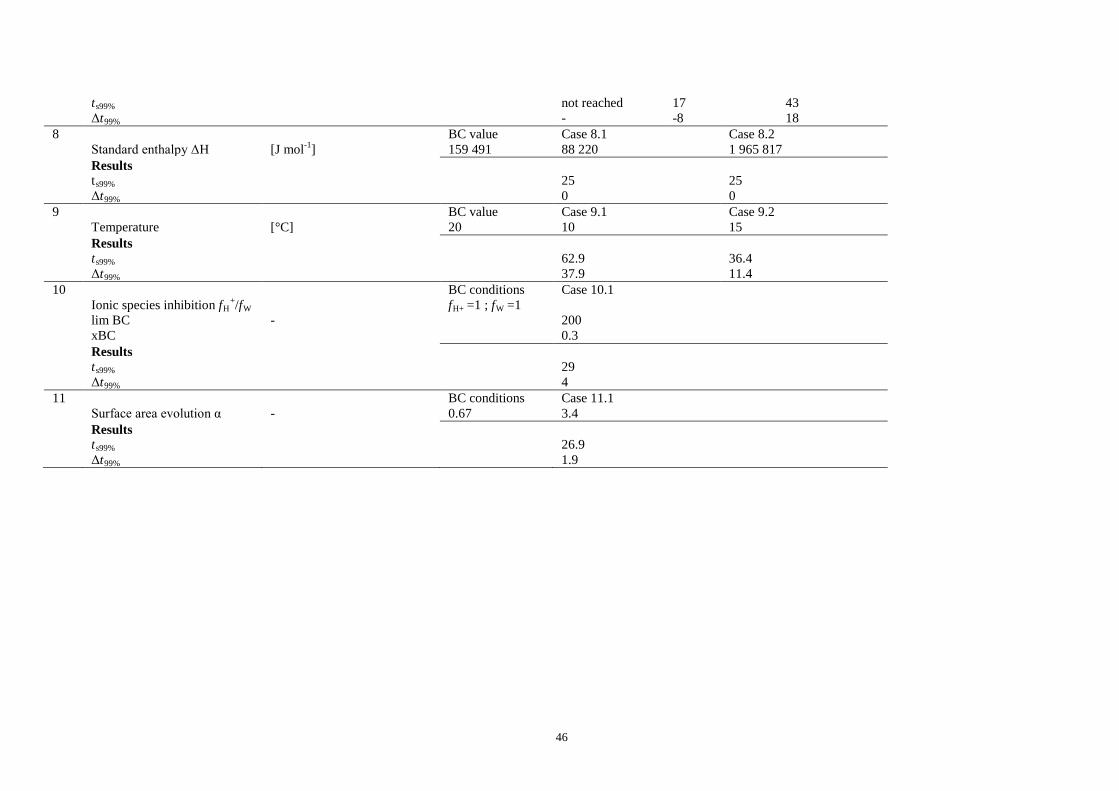
46
ts99% not reached 17 43 Δt99% - -8 18 8 BC value Case 8.1 Case 8.2 Standard enthalpy ΔH [J mol-1] 159 491 88 220 1 965 817 Results ts99% 25 25 Δt99% 0 0 9 BC value Case 9.1 Case 9.2 Temperature [°C] 20 10 15 Results ts99% 62.9 36.4 Δt99% 37.9 11.4 10 BC conditions Case 10.1 Ionic species inhibition fH
+/fW fH+ =1 ; fW =1 lim BC - 200 xBC 0.3 Results ts99% 29 Δt99% 4 11 BC conditions Case 11.1 Surface area evolution α - 0.67 3.4 Results ts99% 26.9 Δt99% 1.9

47
Table 6 Mineral classification based on the solubility constant in acid and alkaline
conditions. Minerals belonging to class 1 have a solubility at pH 8 in excess of 10 mmol l-1,
while minerals belonging to class 2 have a solubility at pH 5 below 1 mmol l-1. Minerals
from the third class have a suitable solubility to be used as buffering agent (solubility above
1 mmol l-1 at pH 5 and below 10 mmol l-1 at pH 8).
Class 1
Excessive solubility at pH 8
Class 2
Insufficient solubility at pH 5
Class 3
Appropriate solubility at pH 5 and 8
Forsterite Riebeckite Cordierite
Wollastonite Albite Anorthite
Enstatite Leucite Glaucophane
Spodumene Andradite
Jadeite Almandine
Nepheline
Grossular
Chlorite
Tremolite
Diopside
Lizardite
Fayalite

48
Table 7 Results of the screening methodology. Nepheline has the smallest t99% and is therefore the best candidate as buffering agent.
Silicate mineral t99% Grams of mineral per mmol of PCE transformed
Nepheline 21 0.54
Fayalite 24.8 0.97
Glaucophane 29.8 0.51
Lizardite 29.8 0.45
Grossular 35 0.50
Almandine 46.8 0.74
Cordierite 48.6 0.32
andradite 53.8 0.49
Anorthite not reached -
Chlorite not reached -
Diopside not reached -
Tremolite not reached -
Enstatite not reached -

49
Figures
Fig. 1 Influence of pH on solubility of five silicate minerals (andradite, fayalite, forsterite,
nepheline and wollastonite). For all these minerals, solubility decreases with increasing pH.
Fig. 2 pH versus dechlorination rate for a mixed organohalide respiring consortium. The
filled diamonds represent the experimental data determined by Vainberg et al. (2009) and the
line represents the fit of these data with Eq. 13.
Fig. 3 Diopside dissolution rate versus pH. The points represent the data obtained by
Golubev et al. (2005) and Knauss et al. (1993). The lines were obtained by fitting these
datasets to Eq. 1. For each dataset a different value of the three parameters kH+, nH
+ and kW
was obtained. Therefore, two values were available for each parameter. The continuous line
was computed with the average value while the dotted lines were computed with the minimal
and maximal values.
Fig. 4 Logarithm of mineral solubility at pH 5 (a) and pH 8 (b) for the 20 selected silicate
minerals. These solubility values were calculated at 20°C in pure water. The solubility values
vary by several orders of magnitude among minerals
Fig. 5 Dechlorination pattern and pH evolution for the case A (pH constant at its optimal
value) (a), case B (pH inhibition) (b) and case C (introduction of 300 m2 l-1 of fayalite) (c).

34
56
78
910
0
0.5 1
1.5
pH
Dechlorination rate (mg l −1 h−1)
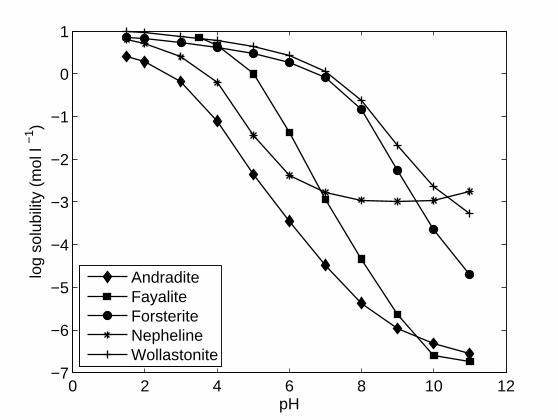
0 2 4 6 8 10 12−7
−6
−5
−4
−3
−2
−1
0
1
pH
log
solu
bilit
y (m
ol l
−1 )
AndraditeFayaliteForsteriteNephelineWollastonite

0 2 4 6 8 10 12−11.5
−11
−10.5
−10
−9.5
−9
−8.5
pH
log
diss
olut
ion
rate
(m
ol m
−2 s
−1 )
upper limitlower limitGolubev (2005)modelKnauss (1993)


0 5 10 15 20 250
1
2
Time (d)
0 5 10 15 20 255
6
7
8 PCETCEDCEVCEthpH
0 5 10 15 20 250
1
2
Chl
oroe
then
e co
ncen
trat
ion
(mm
ol l
−1 )
Time (d)0 5 10 15 20 25
5
6
7
8
pH0 5 10 15 20 25
0
1
2
Time (d)0 5 10 15 20 25
5
6
7
8
a
b
c