evaluation of student thinking on the abcc a master’s
TRANSCRIPT

EVALUATION OF STUDENT THINKING ON THE ABCC
A Master’s Project Presented to
the Faculty of Fresno Pacific University
In Partial Fulfillment of the Requirements for the
Master of Arts Degree
By Brenda R. Royce
July 2012

ii
Accepted in partial fulfillment of the requirements for the Master of Arts Degree at Fresno Pacific University.
Committee Chair
Committee Member
Dean

iii
I grant Hiebert Library permission to make this thesis available for use by its own patrons, as well as those of the broader community through inter-library loan. This is understood to be within the limitations of copyright.
Signature
Date

iv
I grant permission for the reproduction of parts of this thesis without further authorization from me, on the condition that the person or agency requesting reproduction absorbs the cost and provides acknowledgment of authorship.
Signature
Date

v
Acknowledgements
Major projects are seldom the exclusive work of one person; they are nearly always the
product of various voices that encourage, mentor, collaborate, critique, and support. Though this
thesis bears my name, I am deeply indebted to those who have fulfilled one or more of these
critical roles over the last two years. It is with deep gratitude that I thank Jeanne Janzen, the
Curriculum and Teaching program director and outstanding encourager of teachers, for being a
sounding board and patient advisor through all aspects of my graduate studies, and especially for
being willing to let me take on a little less conventional project for this program. I also thank Dr.
Steve Pauls, thesis advisor and project mentor, for his support and genuine interest in this
project. I am particularly grateful to my husband, Mark, and our daughters, Hannah and Haylie,
for their love, encouragement, and understanding throughout the long hours of my graduate
studies and thesis work. Thanks for giving me the freedom to pursue my dream. I also thank Dr.
Sharon Osborn Popp for suggesting this study, and then giving long-distance tutoring in the
statistics of assessment needed for this project – all with a smile. I also could not have finished
without the willing help of Larry Dukerich, a long-time colleague and collaborator in chemistry
and instigator of the ABCC, who has provided critical feedback and help on several fronts for
this study. Of course, I thank Dr. Doug Mulford and Dr. Guy Ashkenazi, who are each authors of
a portion of the ABCC questions, for their support and feedback during this study. I’m grateful
to Dr. Colleen Megowen-Romanowicz for providing valued assistance with qualitative analysis
and coding procedures, and to Dr. Kathy Harper for listening, encouraging, and pointing me to
critical pieces in the PER literature at the start of this project. Finally, I must thank all those at
my school who supported me through this endeavor, beginning with Dr. James Bushman, my
principal, for his support of my continued education and professional development. I also could
not have managed these last two years without the help of my department and grade level
colleagues who picked up some of the supervision slack at school for two years while I pursued
my studies; I owe you. Probably the greatest acknowledgment of support goes to my chemistry
students from 2010-11 for their encouragement and interest in this project, and especially for
those who volunteered to take a chemistry test that “doesn’t count” for a grade!

vi
Abstract
An outgrowth of recognizing the role of alternative conceptions in learning has been the
development of concept inventories designed to measure how well students select the
scientifically accepted form of concepts over the alternative conceptions they harbored before
instruction. In chemistry, this has led to the development of a conceptual test called the
Assessment of Basic Chemistry Concepts (ABCC), a process that is still underway and is the
subject of this study. In order to better characterize the effectiveness of the ABCC as a
conceptual measure, three data strands were analyzed and correlated. These are: 1) item analysis
of two sets of post-test data given to high school chemistry students in the spring semesters of
2010 and 2011, 2) think-aloud interviews of 19 high school students in the fall after the
completion of introductory chemistry, and 3) review of proposed concept statements for the
ABCC by a small panel of experienced chemistry instructors. The think-aloud interviews and
the concept review were conducted during the 2011-2012 school year. The results of this study
indicate that the ABCC (v2.6) has sufficient reliability to be used for distinguishing between
groups (coefficient alpha = .798), which makes it useful for classroom evaluation of teaching and
learning and for research regarding teaching practices. There were three items that were not
well-functioning according to the item analysis of post-test data. Student think-aloud interviews
were used to determine whether misconceptions pertinent to teaching and learning chemistry
were influencing these data.
Keywords:
conceptual assessment, Assessment of Basic Chemistry Concepts, chemistry, high school, education research

vii
Table of Contents
ABSTRACT................................................................................................................................... vi TABLE OF CONTENTS.............................................................................................................. vii CHAPTER 1 INTRODUCATION ..................................................................................................1
Background.............................................................................................................................1 Alternative Conceptions ................................................................................................1 Measuring Conceptual Growth......................................................................................2
Statement of Intent..................................................................................................................2 Rationale .................................................................................................................................3 Research Question ..................................................................................................................6
CHAPTER 2 REVEW OF LITERATURE .....................................................................................8 Overview.................................................................................................................................8 Theoretical Foundations. ........................................................................................................8 Conceptual Challenge of Learning Science..........................................................................10 Concept Inventories and Education Research. .....................................................................13 Current State of Chemistry Concept Inventories. .................................................................18 Process for the Development and Evaluation of Concept Inventories. ................................21 Qualitative Research and the Think Aloud Method. ............................................................22 Summary. ..............................................................................................................................27 CHAPTER 3 METHODOLOGY ..................................................................................................29
Overview...............................................................................................................................29 Research Design & Procedures.............................................................................................29
Phase 1: Item analysis data .......................................................................................30 Phase 2: Think-aloud interviews and ABCC concept interviews.............................30 Population and sampling procedure..........................................................................32 Data analysis .............................................................................................................34 Validity and reliability ..............................................................................................36 Instruments used for data collection .........................................................................37 Data collection process .............................................................................................38
Timeline ................................................................................................................................43 Limitations of Study .............................................................................................................44
CHAPTER 4 PRESENTATION AND ANALYSIS OF DATA...................................................45
Overview...............................................................................................................................45 Concept list questionnaire.........................................................................................45 Item analysis and think-aloud data ...........................................................................46
Results...................................................................................................................................56 Concept list questionnaire results .............................................................................56

viii
Item analysis and think-aloud results........................................................................60 Conclusions...........................................................................................................................96 Recommendations...............................................................................................................102
REFERENCES ............................................................................................................................106 APPENDICES .............................................................................................................................114
Appendix A: Forms ............................................................................................................114 Figure A1. IRB Approval .......................................................................................114 Figure A2. Parent Notification and Consent Form .................................................115
Appendix B: Research Documents .....................................................................................118 Figure B1. ABCC v2.6 contact information ...........................................................118 Figure B2. ABCC Think-Aloud Interviewer Notes................................................119 Figure B3. ABCC Video Analysis Code List .........................................................121 Figure B4. ABCC Concept Questionnaire Form ....................................................122

1
Chapter One: Introduction
A curious pattern has been noticed in how people respond when they discover they are
talking to a chemist. It would appear from how often the words, “Chemistry! I hated chemistry!”
have been heard as a spontaneous response that the study of chemistry has been frustrating and
unproductive for many students. A look at the literature on alternative conceptions of scientific
ideas that students hold coming into our classes sheds some light on why science, including
chemistry, is often difficult for students. These common-sense notions (also called naïve beliefs,
misconceptions, or alternative conceptions) are often incomplete, naïve, or inaccurate
understandings of scientific ideas that arise from common but unexamined experiences,
incomplete information, or even from the everyday usages of scientific terms such as energy,
force, or charge.
Background
Alternative conceptions. Alternative conceptions have been found to be stubbornly
persistent in spite of instruction because students tend to incorporate the new ideas they are
studying into their existing understanding rather than abandon the old ideas. When new
information doesn’t fit their existing conceptions, students will often use the new idea presented
by the teacher long enough to get by and then abandon it, or attempt to make it fit in with little
change to their original concept, often undetected by the teacher (Bransford, Brown, & Cocking,
2000; Kind, 2004). This, of course, raises the questions of how educators can know whether
learning experiences have, in fact, changed the students’ understanding.

2
Measuring conceptual growth. An outgrowth of recognizing the role of alternative
conceptions in learning has been the development of concept inventories designed to measure
how well students select the scientifically accepted form of concepts over the alternative
conceptions they harbored before instruction (Engelhardt, 2009; Hestenes, Wells, &
Swackhamer, 1992; Libarken, 2008). In chemistry, this has led to the development of a
conceptual test called the Assessment of Basic Chemistry Concepts (ABCC), a process that is
still underway and is the subject of this study.
Both of the parent assessments to the ABCC were developed for college courses. Initial
analysis of student responses on the ABCC was on a sampling of 188 high school chemistry
students, which produced a Cronbach’s alpha of about 0.75 (Osborn Popp, 2010), indicating
sufficient reliability for measuring groups but not individuals (Engelhardt, 2009). In addition,
the analysis revealed some concerns with selected questions confirming the need to better
understand why students responded as they did, and to more carefully document the concepts
and alternative conceptions that are present in the current form of the ABCC (Osborn Popp,
2010).
Statement of Intent
The purpose of this mixed methods study is to collect two types of data to supplement the
item analysis being completed on 2010-11 ABCC post-test results of high school chemistry
students. One type of data to be collected is to ascertain the reasoning students use while
answering each of the questions on the ABCC using think-aloud protocol. Students who have
completed chemistry will be selected based on their spring 2011 ABCC results to represent a
cross section of the sample population. These students will be asked to think out loud as they
work through each question on the ABCC. Video and audio will be recorded for each

3
participant and then analyzed for patterns of reasoning and for the mental models participants
invoked during the interview process (Creswell, 2009; Ericsson & Simon, 1998; Otero &
Harlow, 2009; Ramey, n.d.; Silverman, 2001; Strauss, 1987; Strauss & Corbin, 1998; van
Someren, Barnard, & Sandberg, 1994).
Secondly, a panel of experienced high school and college introductory chemistry
instructors will review a list of concepts via questionnaire as to how well the concepts are being
assessed in the questions of the ABCC as part of the assessment of content validity (Engelhardt,
2009). The think-aloud data and content questionnaire, along with two sets of unpublished item
analysis of student responses from high school students’ post-course ABCC data (Osborn Popp,
2010, 2011) will be evaluated for correlations between their reasoning patterns and their
response patterns on the test. Inferences drawn from this analysis will be used to form
recommendations for modifications to the ABCC for the purpose of improving its validity, as
well as the next steps for testing the validity of these modifications.
Rationale
The ability to measure the conceptual gain of students through concept inventories
provides educators an additional route for assessing the effectiveness of their teaching. The
Force Concept Inventory (FCI) in physics set off a wave of reform efforts and research literature
when it demonstrated that common teaching practices for introductory high school and university
physics were not producing substantial conceptual change in the core concepts of motion and
force. Unlike physics education research (PER) literature, a survey of the chemistry education
research (CER) literature produced very few articles referring to actual research into the
effectiveness of teaching approaches in chemistry using any of the concept inventories
mentioned above, especially at the introductory chemistry level. This observation might suggest

4
either a lack of interest in this type of research among chemistry education researchers or the
lack of a tool that is seen as robust enough to produce trusted data.
In chemistry a few conceptual inventories that have been created were cited in the
literature. No literature was found that relied on any of these as part of subsequent education
research. The only published articles found described the development and evaluation of the
inventories. The two most cited instruments are the Chemistry Concepts Inventory (CCI)
developed by Mulford and Robinson (2002) and the Chemistry Concept Inventory (ChCI)
developed by Pavelich, et al. (2004). The CCI was created to assess conceptual change in
general chemistry students in college, while the ChCI was developed to aid in assessing whether
students entering an engineering program had sufficient understanding of core chemistry
concepts needed for the courses in their engineering program. The ChCI is constructed at a level
that would not be appropriate for a first year chemistry course, especially in high school.
Another unpublished conceptual device, the Matter Concept Inventory (MCI), has unpublished
student data indicating fairly strong internal reliability. However, the questions of the MCI
assess basic concepts of matter that may be more appropriate for chemistry readiness assessment
than chemistry concept growth assessment (L. Dukerich, personal communication, August 1,
2011; S. Osborn Popp, personal communication, July 11, 2011).
In order to provide an inventory that might meet the needs for assessing conceptual
growth in an introductory class, including high school courses, the CCI was selected and blended
with six energy concept questions (Zimrot & Ashkenazi, 2007) to broaden the concept base. The
resulting assessment was named the Assessment of Basic Chemistry Concepts. However, the
weaknesses previously identified in the CCI item analysis remained and were subsequently
identified in preliminary item analysis data for the ABCC. In order to understand what is
5
causing the problems for certain questions (specifically, poor point biserial results for
distractors), data needs to be collected that would reveal the reasoning behind the students’
selection of certain distractors on the weaker questions. For now, inferences about student
understanding in these questions cannot be clearly drawn from ABCC results (Osborn Popp,
2010; S. Osborn Popp, personal communication, July 11, 2011).
In order to discern whether test construction or student understanding is at the root of the
more problematic questions, additional data need to be collected to distinguish between
responses that reflect the students’ genuine understanding of the concepts and those that reflect a
problem in the structure of the test. This will require an effective method of revealing the
thinking that the students are using while taking the test. A common method for investigating
reasoning used during conceptual tasks is the think-aloud interview in which participants state
their thinking while completing the task. The interviewer records the process using video, audio,
and coded notes that are reviewed, looking for patterns in the thinking of the participants that can
be related to the circumstances of the task (Avanzo, 2008; Brock, Vert, Kligyte, Waples, Seiveir,
& Mumford, 2008; Ericsson & Simon, 1998; Otero & Harlow, 2009; Ruiz-Primo, Shavelson, Li,
& Schultz, 2001; van Someren, et al., 1994). Additionally, a comprehensive concept list for the
questions of the ABCC is currently incomplete. Such a list will aid in the analysis of student
data and provide a more complete description of the ABCC for those who may consider it for
their research purposes. This researcher aims to correct this deficiency as part of the proposed
study.
The outcomes from this study will be used to make any recommendations for
modifications to the questions on the ABCC, as well as recommendations for further work on
evaluating the reliability and validity of the test. The ultimate development of a reliable and

6
well-validated conceptual assessment would be of interest for those wanting to identify more
effective methods for teaching chemistry, as well as for classroom teachers interested in
effectively monitoring the conceptual progress of their students. With a sufficiently strong
conceptual assessment developed, it is hoped that research into more effective methods for
teaching introductory chemistry can be identified.
Research Question
The primary research question for this study provides the overall framework for this
study. Three additional sub-questions describe specific inquiry needed to address the primary
question. The relationships between the three data sources and the research questions for the
study can be seen graphically in Figure 1.
Primary research question.
What do think-aloud interview data, concept analysis, and item analysis of student
responses reveal about the validity and reliability of the current form of the ABCC?
Research sub-questions.
1. What are the relationships between descriptions of student reasoning/mental models
revealed in think-aloud interviews and item analysis data of student responses on the
ABCC?
2. What are the relationships between descriptions of student reasoning/mental models
revealed in think-aloud interviews and the concepts identified in the test items?
3. What are the relationships between student reasoning/mental models used as revealed in
think-aloud interviews and the alternative conceptions identified in the distractors?

7
Figure 1. Schematic drawing of the relationships between the three data sets used for this study and the research questions and sub-questions.

8
Chapter Two: Review of the Literature
Overview
The intent of this study is to provide additional data for the evaluation of the
effectiveness of the ABCC for measuring conceptual growth in introductory chemistry students.
This review of the literature was conducted to understand two primary themes related to this end.
The first theme focused on the theoretical foundations for learning with specific interest in
understanding the conceptual challenges of learning chemistry. In addition, the review attempted
to identify papers describing the history and development of concept inventories and their impact
on science education research, including the current state of chemistry concept inventories.
The second theme of the literature review focused on background information needed to
develop the methodology for this study. This led to a review of literature on accepted practices
for developing and evaluating conceptual tests, followed by literature on qualitative methods of
research. Specific articles on the theory and practice of think-aloud interviews are included.
Theoretical Foundations
The learning process has been a topic of research for many decades, with a growing body
of knowledge available to researchers and educators. One key idea that has had a significant
influence on education in recent decades is constructivist theory of learning, the idea that
knowledge is actively constructed from prior knowledge by the learner as opposed to an external
reality that is passed on to students who simply take in the new information (Bransford, et al.,
2000, pp. 10-11). Cakir (2008) discusses the foundations of constructivist theory of learning,
which can be seen in the theories developed by Jean Piaget, David Ausubel, and Lev Vygotsky
during the twentieth century. While each of these learning theorists have their own distinct
emphases, Cakir argues that all three hold to the idea that learners must take in new information

9
and weave it into their existing structure of understanding, a foundational idea for the
constructivist’s view. Piaget refers to our knowledge structures as mental patterns, while
Ausubel uses the idea of mental networks he calls schemata, both of which describe human
understanding as an interconnected framework of information in our minds (p. 194-196; see also
Bransford, et al., pp. 10-11). Kirschner (2002) points out that the process of developing these
schema effectively lowers the cognitive load a person experiences while carrying out a task by
clumping numerous, whole concepts or processes into a smaller number of knowledge units that
the mind can access as a whole. This could be seen as synonymous to retrieving information
from a computer as a whole folder that may also contain subfolders, rather than as single
documents that must then be individually kept organized on a desktop. By clumping, or filing by
meaning and use, we can gain automaticity with complex skills and tasks (Kirchner, 2002, p. 3).
Vygotsky, additionally, sees two distinct types of knowledge: spontaneous knowledge gained
through daily experiences in life, and non-spontaneous knowledge that is gained systematically
in a formal learning setting such as school (Cakir, 2008, p. 194). In the filing analogy, these
would be distinguished as randomly collected documents filed with little purposeful organization
as contrasted with well-ordered, purposeful, and neat files with a hierarchy of organization that
can be searched easily.
When learners are faced with new information, whether informally or formally, the new
information must be assimilated into the current schemes, or cognitive structures. If the new
information does not fit well, “existing schemes must be changed or new ones made” to
accommodate the new ideas (Cakir, 2008, p. 194). Using Vygotsky’s identification of
spontaneous knowledge that has been informally gained and is, therefore, “non-systematic,
unorganized knowledge” (Cakir, 2008, p. 194), we can see the difficulty students may have in

10
learning something that is not intuitively obvious, and so not likely to fit their current informal
knowledge. These less organized bits of informally gained understanding would tend to be less
easily accessed during a lesson because they are not systematically linked for meaningful
retrieval and may, therefore, not be retrieved at the appropriate time for integration. It is the
experience of this author that these unexamined “facts” held by students can form some of the
more challenging barriers to learning something new. The next portion reviews the impact that
these prior, inadequate, or incorrect information, sometimes referred to an alternative
conception, has on learning, especially in science.
Conceptual Challenge of Learning Science
The awareness of persistent alternative conceptions was poignantly raised by two videos,
A Private Universe and Minds of Our Own (Harvard-Smithsonian, 1987, 1997). These videos
showed the personal concepts of seasons held by Harvard graduates and other students that
persisted in spite of instruction – even in graduates at a prestigious university. Recognizing the
presence and role of alternative conceptions has significantly affected our views of teaching. In
How People Learn (Bransford, et al., 2000), the authors point out that “children’s interpretations
of the new information are much different than what adults intend” (p. 70). Students bring their
prior understanding with them, as we saw in the theories of Piaget, Ausubel, and Vygotsky.
Alternative conceptions are also referred to as misconceptions, naïve beliefs, or prior conceptions
(Bransford, et al., 2000; Halloun and Hestenes, 1985; Kind, 2004; Roth, 1985). Halloun and
Hestenes (1985) referred to the alternative conceptions they identified in mechanics as common
sense concepts because they are often grounded in students’ everyday experience with how
things appear to work (what Vygotsky would call spontaneous knowledge) or from applying the
usually broad meanings of everyday language to scientific terminology.

11
The process of reconciling the new ideas students encounter in class with their prior
understanding does not always produce the desired learning outcome. Roth (1985) describes the
challenge students face when attempting to learn a concept that differs from their personal, yet
incorrect, theories. To correctly assimilate the new idea, the student “must first recognize that
the new concept…is related to notions they hold” for that concept, and then link the new idea to
both the scientifically consistent part of their understanding, as well as “to incompatible prior
knowledge” (Roth, 1985, p.3). Then, the student must be able to recognize “that their own
notions are at least partially in conflict with the scientific explanation”, and that the “scientific
explanation provides a more convincing and powerful alternative to their own notions” (Roth,
1985, p. 3). Roth is, in part, describing the need for students to be metacognitive in their
learning – to “monitor their own understanding carefully, making note of when additional
information [is] required for understanding, [and] whether new information was consistent with
what they already knew” (Bransford, et al., 2000, p. 18).
At times, the students’ alternative conceptions make the new ideas difficult to understand,
but, as Bransford, et al. (2000), tell us, “this confusion can at least let them identify the existence
of a problem,” prompting them to seek out clarification (p. 70). However, students may not
always experience this cognitive conflict. Students have also been found to weave the new idea
into the structure of their existing understanding “while deeply misunderstanding the new
information” and not being aware their understanding is incorrect, which can be missed by the
teacher in the course of instruction (Bransford, et al., 2000, p. 70).
Zimrot and Ashkenazi (2007) describe the assimilation process as moving “from naïve
conceptual models to a consensus model” via “intermediate stages which combine parts of both
models” to form a “hybrid model” (p. 197), much like the descriptions of Bransford, et al. cited

12
in the previous paragraph. These hybrid models may result in an improvement to the students
understanding or it may cause a distortion of the concept we desire the student to understand as
the student attempts to make it fit with their existing mental scheme. To compound the problem
for students, some alternative conceptions have been found expressed in published science
textbooks students use to study (Abinbola & Baba, 1996) or are harbored by the teachers
themselves (Yip, 1998). It is no wonder that true conceptual change can be difficult to achieve.
Kind (2004) describes a number of common misconceptions about matter gleaned from
an extensive review of the misconception literature in chemistry. According to Kind, many of
the naïve ideas students have about matter stem from only being able to observe matter at the
macroscopic level, while the behavior of matter is best explained by its invisible, particulate
nature. This is not a concept young people are likely to arrive at on their own. After all, the idea
of the atom has been an accepted part of the canon of scientific knowledge for barely 200 years.
The great majority of introductory chemistry students are faced with the challenge of
assimilating new information effectively, as outlined by Roth (1985) and described previously on
pages 10-11, making it important that they have the opportunity to confront their inevitable naïve
models of matter and recognize the superiority of the scientific view.
Recommendations from the literature for handling student alternative conceptions remind
us of the importance of teachers knowing which alternative conceptions are common and provide
significant barriers to learning so student understanding can be adequately probed during
instruction to find where alternative conceptions continue to lurk in students’ thinking.
(Bransford, et al., 2000, p. 71; Kind, 2004; Stieff, et al., 2009, p. 14-15; Stiger & Heibert, 1999,
p. 91; Zimrot & Ashkenazi, 2007, p. 209-210).

13
Concept Inventories and Education Research
Science concept inventories are a multiple-choice test written on a conceptual level with
common alternative conceptions embedded in the distractors (Lindell, Peak, & Foster, 2006).
The purpose of these assessments is to measure how well a student can distinguish the accepted
scientific concept from the common-sense ideas that they may have held at the beginning of a
course (Evans, et al., 2003; Engelhardt, 2009; Hake, 2007; Hestenes, Wells, & Swackhamer,
1992; Lindell, et al., 2006; Mulford, 2002; Pavelich, Jenkins, Birk, Bauer, & Krause, 2004).
In order to know whether the learning experience is effectively changing some of these
stubborn alternative concepts, a method of reliably assessing the whether students have
effectively adopted the scientific form of these concepts is needed. The development of the
Force Concept Inventory (Halloun & Hestenes, 1985; Hestenes, Wells, & Swackhamer, 1992)
ushered in an awareness of whether teaching had significantly changed one set of alternative
conceptions of physics students. Hestenes and Halloun’s results from the FCI in the early 1990s
made the presence of alternative conceptions personal to physics instructors as they began to see
how little change was actually occurring in their students’ conceptual understanding of the basic
physics concepts of force and motion (Hake, R. R., 2007; Hestenes, et al., 1992). These reports
sparked studies looking for alternative conceptions in other scientific concepts, including
chemistry (Kind, 2004; Horton, 2009; Vaarik, Taagepera, & Tamm, 2008; Yip, 1998). In some
cases these alternative conceptions are sufficiently critical that they make real understanding of
the subject quite difficult (Bransford, et al., 2000; Horton, 2009; Kind, 2004).
As it became evident through the use of the FCI that students could achieve good grades
in a course and still harbor significant alternative conceptions about core ideas (such as force and
motion is for physics), educational researchers began developing conceptual assessments in other

14
content areas, including engineering, biology, astronomy, chemistry, and statistics (Avanzo,
2008; Beichner, 2007; Hestenes, et al., 1992; Libarkin, 2008; Mulford & Robinson, 2002;
Pavelich, Jenkins, Birk, Bauer, & Krause, 2004).
In the wake of so many published inventories, Lindell, et al. (2006) raised concern that
“there does not seem to be a concise definition of what exactly a concept inventory actually
measures,” calling for a need to differentiate between what would more appropriately be termed
concept surveys than a concept inventory. In addition, the authors noted that there has not been a
uniform approach to developing the different concept inventories found in the literature (p. 14).
After reviewing the differences in the reported methods for developing these assessments,
Lindell and her colleagues called for the education research community “to determine guidelines
for developing these instruments” and for establishing a “new classification scheme” for
identifying the type of instrument (Lindell, et al., 2006, p. 17). This call for clearer definition in
methodology was met by a group of physics education researchers who prepared a series of
presentations edited by Charles Henderson and Kathleen Harper (2009). This series of articles
includes an overview by Paula Engelhardt (2009) for developing conceptual assessments
appropriate for educational research, as well as methods for qualitative research by Valerie Otero
and Danielle Harlow (2009). These articles, along with Lindell, et al. (2006), provide both
guidance and critique criteria for those interested in pursuing education research using
conceptual assessments.
Being able to measure students’ conceptual change using a concept inventory is
beneficial to educators for several reasons. According to Libarkin (2008), concept inventories
generally serve two primary purposes: assessment and diagnosis. Classroom teachers can
diagnose the state of students’ concepts coming into a class and then again at the end to see the
15
effect of instruction. Year to year data from a conceptual assessment can allow a teacher to
monitor change in teaching effectiveness. Pretest data could be used to guide planning to
address alternative conceptions. This type of data is unlikely to be published since it is primarily
for internal evaluation, but is used in at least some college and high school courses.
Secondly, concept inventory data has been used to evaluate readiness for students
entering a course or program and to identify current alternative conceptions that would need to
be addressed with a specific class. This was the motivator behind the Chemical Concept
Inventory (ChCI) when it was found that “students did carry misconceptions out of their
chemistry courses that could impact understanding of engineering concepts” (Pavelich, et al.,
2004, p. 2). The ChCI was developed so that faculty could “determine the extent of
misconceptions about chemistry” their students came with to the engineering program in order to
appropriately adapt their instruction to address the identified misconceptions (Pavelich, et al.,
2004, pp. 1-2).
Thirdly, educators can use concept inventories to evaluate the effectiveness of changes in
a teaching program or method (Engelhardt, 2009; Libarkin, 2008). A study from Finland by
Savinainen & Scott (2002) used the Force Concept Inventory to monitor students’ conceptual
change as new methods of instruction were introduced. The study was carried out with upper
secondary Finnish physics students as a means to evaluate changes made in the teaching methods
in Finnish physics classes. In another study, researchers from the University of Minnesota used
the FCI to look for gender effects in an “introductory calculus-based physics course” that used
“cooperative group problem solving” as a core instructional practice (Docktor & Heller, 2008,
p.1). The ability to monitor conceptual change revealed that, in spite of similar grades between

16
males and females in the classes, there were significant differences in conceptual growth as
measured by the FCI (Docktor & Heller, 2008).
While well-constructed concept inventories can provide information to both teachers and
researchers, limitations have also been identified that must be considered when selecting a
concept inventory and interpreting its results. Even when two conceptual assessments were
intended to monitor similar concepts, there can still be differences in what they actually measure,
and therefore, the applications for which they are best suited. Thorton, Kuhl, and Marx (2009)
studied the correlation between scores produced with the Force Concept Inventory (FCI) and the
Force and Motion Conceptual Evaluation (FMCE), both ostensibly for measuring conceptual
understanding of the force concept. While they found a strong correlation (slope of 0.52 and
correlation coefficient of 0.78) between scores given as posttests to similar student populations,
there were also differences that were evident. For one, the FMCE was found to produce lower
scores overall indicating a more difficult test (as seen in the slope of 0.52; a slope of 1 would
indicate the same pattern of distribution in the scores and therefore very similar test difficulty).
The FMCE also tests the force concept for one-dimensional motion while the FCI tests a broader
application of the force concept that includes both one- and two-dimensional motion. The
analysis presented for these two tests “highlight how risky it can be to over rely on single-
number scores and normalized gain calculation for any single exam” (Thornton, et al., 2009, p.
7). In the view of Thornton, et al. (2009), the FMCE may provide a better assessment of
“students’ understanding of Newton’s laws”, while the FCI, with its “wider range of topics may
make it the more fitting evaluative instrument” for a more general look at an introductory
physics course (p. 7).

17
Rebello and Zollman (2003) investigated whether open-ended versions of FCI questions
would produce different patterns of wrong responses a decade after the initial publication of this
assessment. To evaluate this, they gave selected questions to introductory physics students as
free response questions. The results revealed that participants in their study gave answers in
significant numbers that were not among the response options in the distracters on certain
question in the FCI, even though the percent answering correctly had not changed significantly.
In their summary, Rebello and Zollman (2003) suggest that while the FCI does a good job of
revealing the percent of students that are able to answer correctly, there may be limitations on the
inferences that may be made regarding which alternative conceptions the students actually
harbor. The authors offer a general warning that “pre/post-comparisons” may not “accurately
reflect the level of student understanding they have acquired” (p. 124).
Gender differences can also complicate the interpretation of concept inventory responses.
Docktor and Heller (2008) have noted that female physics students tend to score lower on the
FCI than their male classmates, even when their final exam grades do not show the same gap.
McCullough and Metzler (n. d.) reported that male and female students show significantly
different response patterns on selected questions of the FCI. When these questions are given a
slightly altered context, such as substituting an eagle dropping an object while in flight for an
object being dropped from an airplane in flight, or a baby pushing a bowl off the high chair
replacing the context of a cannon shot, a different pattern of response emerges between males
and females in each question set. Sometimes the context change helps female students identify
the correct response more frequently, while other times it improves the male students’ response
(McCullough & Metzler, n. d.). In either case, this study provides evidence that the context of a

18
question an influence the response, leaving a measure of uncertainty about how well the
respondent understands the concept, as opposed to the context.
Current State of Chemistry Concept Inventories
Doug Mulford created a chemistry concept inventory as part of his master’s work
(Mulford, 1996). The Journal of Chemistry Education published an article reporting the
development and evaluation of the assessment in 2002 (Mulford & Robinson, 2002). A modified
version of the test was posted to the journal’s website, JCEOnline, for teachers to use.
A group working with the Foundation Coalition developed another concept inventory in
chemistry, as well. This inventory, aimed at students who had completed at least two semesters
of college chemistry, was based on the work of Steven Krause, a materials and chemical
engineer at Arizona State University who had developed a conceptual inventory in materials
science. The new inventory was called the Chemistry Concept Inventory (ChCI). As noted in
the previous section, the authors had found that their engineering students were carrying
misconceptions out of their chemistry classes, motivating the development of an inventory for
diagnosing the conceptual understanding of incoming students. (Pavelich, et al., 2004).
Libarkin (2008) identified both Mulford’s inventory and the Foundation Coalition chemistry
inventory as “unpublished”, indicating, “peer-reviewed publications describing their
development were unavailable” at the time the paper was published (p. 4).
One last chemistry inventory that could be found was developed as part of an action
research project by a group of teachers at Arizona State University in 2001 to identify common
misconceptions in chemistry and identify or create questions associated with these conceptions.
These teachers were working with Modeling Instruction, a successful active engagement
teaching method in physics developed by David Hestenes and Malcolm Wells (Jackson,

19
Dukerich & Hestenes, 2008; Wells, Hestenes & Swackhamer, 1992). Their inventory, the Matter
Concept Inventory (MCI), began as a larger collection of questions, which were reviewed and
edited down with the assistance of Larry Dukerich to thirty items in 2003. By 2004, a fairly
clean version of the MCI was available and began to be used as a potential conceptual
assessment for those working on adapting chemistry to Modeling Instruction, a successful active
engagement teaching method in physics developed by David Hestenes and Malcolm Wells
(Jackson, et al., 2008; Wells, Hestenes & Swackhamer, 1992). After collecting data on high
school chemistry students’ pre- and posttest responses it was evident that, while the initial data
on internal reliability looked good, the test was probably not difficult enough to be used as a
measure of conceptual growth for a high school chemistry course, but would probably work well
for a middle school course, or as a readiness assessment for a full introductory chemistry (L.
Dukerich, private communication, August 1, 2011). The longer version of this inventory, also
given the name chemistry concept inventory, is attributed to David Boyer and Consuelo Rogers
and is available online (Boyer & Rogers, 2001).
In reviewing these inventories, it is evident that there is not a single, obvious choice with
adequate documentation of validity and reliability for assessing effectiveness of reform efforts in
chemistry for research purposes, particularly for high school. The MCI, as noted above, appears
to assess concepts more suited to diagnosing readiness for chemistry rather than growth in an
introductory course. The ChCI was designed for college engineering students, and not suited for
introductory chemistry. Mulford’s assessment is aimed for a first semester college chemistry
course. Of the three, the CCI would be more closely suited to the content expectations of a high
school course. However, the Cronbach’s alpha (also called coefficient alpha), a measure of
reliability, reported for the posttest of the CCI was 0.716, which is “generally accepted as

20
satisfactory and suggests that students are not responding randomly” (Mulford & Robinson,
2002, p. 740). Engelhardt (2009) in her paper on developing and evaluating a conceptual
inventory describes coefficient alpha values between 0.7 and 0.8 as “okay, sufficient for group
measurements, not individuals.” Values from 0.8 to 0.9 are considered “fairly high, possible for
measurement of individuals” (Engelhardt, 2009, p. 24). However, additional work would be
needed to address concerns within selected questions that Mulford acknowledges are needed (L.
Dukerich, private communication, April 10, 2010). Additionally, no published research could be
found on chemistry reforms or assessments of student growth that relied on Mulford’s CCI as the
research tool. Whether this is an indication that no research is being done that would require a
device such as the CCI or that the CCI is not accepted among chemistry education researchers as
a sufficiently validated assessment is unclear. Libarkin’s (2008) classification of all then known
chemistry inventories as “unpublished” may provide evidence for the latter conclusion.
Teachers using Modeling Instruction, a reform-based pedagogy in physics developed by
Hestenes and Wells (Wells, et al., 1995), who desired to adapt chemistry instruction to this
method have been very interested in finding or creating an assessment tool that would aid in
evaluating whether this work is being effective. After deciding not to move forward with the
MCI, their attention turned to Mulford’s CCI as the most viable option available. In 2009 Guy
Ashkenazi and Larry Dukerich expanded the CCI to include six conceptual questions on
temperature and energy when it was noted that none of the questions address energy changes in
matter. The added energy questions had been created by Ashkenazi and Zimrot as part of work
with interactive lecture demos (ILD), which is described in their paper (Zimrot and Ashkenazi,
2007; G. Ashkenazi, private communication, July 31, 2011 and August 13, 2011). The expanded
assessment was renamed the Assessment for Basic Chemistry Concepts (ABCC), and began to

21
be evaluated for internal reliability using responses from high school chemistry students.
Unpublished results point to some specific questions that would need additional information
regarding student thinking to be able to ascertain the reasons for the response patterns (Sharon
Osborn Popp, 2010, 2011), which is the subject of this present study.
Processes for Development and Evaluation of Concept Inventories
In order to make decisions as to possible changes to the content or structure of the
ABCC, it is important to know the accepted processes used for developing and evaluating a
conceptual assessment that one desires to use for research purposes. Several examples of the
development of concept inventories were found in the literature that provide descriptions of what
has been done or remains to be done on inventories under development (Avanzo, 2008; Evans, et
al., 2003; Halloun & Hestenes, 1985; Lindell, Peak & Foster, 2006; Mulford & Robinson, 2002;
Pavelich, et al., 2004; Rebello & Zollman, 2003; Thorton, et al., 2009). Dr. Kathy Harper
specifically recommended Engelhardt’s paper as a readable introduction to the test theory behind
the development and evaluation of conceptual multiple-choice tests. Some key elements related
to this study identified in Engelhardt’s work, and evident in many of the other papers cited
above, are found in a flowchart (Engelhardt, 2009, p. 7) and simplified here:
1. Formulate the objectives
2. Construct test items
3. Perform content validity
4. Perform reliability check
5. Distribution
The outcome of items 2, 3, and 4 indicate a need to return to a previous step, as needed,
until a sufficiently robust assessment has been created. As related to the ABCC, some work has

22
been done on items 1, 3, and 4, though additional work is warranted. Clearly, item 2 has been
done, but is open to revision based on further work. This framework is being used to guide the
planning for a more complete evaluation of the ABCC, and to decide what is most critical for
this current study to be able to make clear decisions for the next steps.
Based on the known history of the ABCC, re-evaluating the objectives (item 1) would be
advisable. The test now consists of questions from two separate development efforts that have
undergone some revision to address face validity concerns. Currently, there is no single
document outlining the concepts and alternative conceptions addressed by each question on the
ABCC. Such a document would facilitate analysis of student response data for this test.
Engelhardt (2009) recommends enlisting a panel of experts to review the questions for this
purpose (p. 14). She also describes a few tables suitable for organizing the concepts included on
the assessment (p. 10).
Initial, unpublished item analysis data for the ABCC has flagged some questions from the
ABCC whose results are not easily interpreted. Sharon Osborn Popp, the statistician who carried
out the item analysis, has recommended using think-aloud interviews to associate student
reasoning with the responses on the ABCC in order to have a stronger basis for determining if
the questions are, in fact, assessing the ideas we believe them to assess (private communication,
July 11, 2011).
Qualitative Research and the Think-Aloud Method
Test data does not stand apart from its context. The human experience of wrestling with
ideas as people solve problems is an important element in understanding student learning.
Quantitative assessments have limited ability to shed light on this human side of learning. Elliot
Eisner (1994) repeatedly makes this point in his book The Educational Imagination. The

23
qualities of the learning experience are as important to the story of what the student gains as
quantitative test data. And so, to better understand what the quantitative data from the ABCC
means, it will be important to also learn more about the students’ experience as they read and
answer the test questions. This type of information can be obtained by having student verbalize
their thinking as they work while capturing their thoughts through a combination of video, audio,
and written records for analysis. This qualitative research method is often referred to in the
literature as the think-aloud method or protocol analysis (Ericsson, 2006; Ericsson & Simon,
1998; Ramey, n. d.; van Someren, et al., 1994). This approach has “gained acceptance as a
central and indispensable method for studying thinking” (Ericsson & Simon, 1998, p. 182).
The think-aloud method is primarily used in two areas of study: understanding expert
thinking and understanding cognitive processes. In the first area of study, researchers capture
and analyze how experts approach tasks within their field in order to understand the
characteristics of expert thinking (Ericsson, 2006), or to create knowledge-based computer
systems that can make expert knowledge available to a wider audience, such as creating a
medical diagnosis computer program (van Someren, et al., 1994). The second application of
think-aloud methods is more applicable to education and, therefore, to this study – that of
shedding light on the cognitive process, both generally and for specific processes used to solve
problems such as ethical or diagnostic decision-making, reading comprehension, and software
comprehension (Berne, 2004; Brock, et al., 2008; Ericsson & Simon, 1998; Karahasanovic,
Unni, Sjøberg, & Thomas, 2009; Lucas & Ball, 2005; Ruiz-Primo, et al., 2001; Sainsbury, 2003).
Think-aloud protocol is distinct from methods that ask participants to describe and
explain their thinking. In thinking aloud, participants simply verbalize their thoughts as they
occur during the requested activity. No reflection or elaboration on what they said is elicited.

24
On the other hand, when describing and explaining their thinking, “participants have to go
beyond merely verbalizing spontaneously generated thoughts to produce the thoughts that
contain descriptions and explanations” (Ericsson & Simon, 1998, p. 181). Ericsson and Simon
(1998) have demonstrated that having participants simply verbalizing their thoughts as they
focus on carrying out the task (rather than on what they are saying) does not significantly alter
the thought process. When participants must also describe or explain their thinking (rather than
simply reporting it), the additional processing can cause their thought process to change.
Under the circumstances, participants also monitor their speech to ensure that it is
understandable, and they make corrections and further explications of their
thought, whenever necessary. In particular, we argued that these requirements for
verbalized explanations biased participants to adopt more orderly and rigorous
strategies to the problems that were easier to communicate in a coherent fashion,
but in turn altered the sequence of thoughts. (Ericsson & Simon, 1998, p. 183)
The authors refer to this type of verbalized thinking as “reactive verbalization,” while referring
to thinking aloud as “nonreactive verbalization” since “the evidence is consistent that the course
of the thought process can be inferred in considerable detail from thinking-aloud protocols.”
(Ericsson & Simon, 1998, pp. 181-184).
Analysis of think-aloud protocol falls under the general practices of qualitative data
analysis (QDA). Qualitative methods used by social scientists are described by numerous
writers, including Creswell (2009), Strauss & Corbin (1998), Silverman (2001), and Seidel
(1998). These methods are useful for analyzing the records of interviews and observations of
people’s actions, interactions, responses, and thoughts. According to Strauss and Corbin (1998),
qualitative methods are appropriate for “research that attempts to understand the meaning or

25
nature of experience of persons with problems,” or to “explore substantive areas about which
little is know or about which much is known to gain novel understandings” (p. 11). Unlike
quantitative research that typically begins with a hypothesis and attempts to support or refute it
(deductive analysis), qualitative research works inductively by building patterns from the data
that may result in a theory for the area of inquiry (Creswell, 2009, p. 175).
The records produced in using qualitative methods may be in forms such as notes, video
or audio recordings, artifacts, or diaries (Creswell, 2009, pp. 178-183). A common practice is to
go through the details of the data records and code for meaningful terms, ideas, or events within
the record. After coding, say, an interview, the researcher begins reflecting on the meaning of
various segments of the coded data to look for significance, connection, or for further questions
to ask. The qualitative researcher would then make memos capturing reflections on specific
portions of the data. Periodically, the collection of memos is reviewed for further reflection on
how the ideas within them relate or play off each other. Insights gained in reflecting on coding
and memos may take the researcher back to collect further data, to reconsider coding schemes, or
to reorganize memos through a new lens as the analysis deepens. The goal of qualitative
analysis is to find patterns of response that provide insight into the situation being studied, such
that concepts involved may be defined and correlated to each other in a robust and predictive
description of the area of inquiry (Otero & Harlow, 2009; Silverman, 2001; Strauss, 1987;
Strauss and Corbin, 1998; van Someren, et al., 1994).
Seidel (1998) describes the qualitative analysis process as repeated cycles of noticing,
collecting, and thinking, using the analogy of solving a jigsaw puzzle. His analogy points to the
non-linear nature of qualitative analysis since a jigsaw puzzle most usually is solved in sections
as bits of “data” on the pieces begin to form meaningful collection that appear to fit together

26
coherently. The emergent meaning then guides the solver to look for additional pieces with
similar “data patterns”, including finding ways of linking one collection of fitted pieces with
another as similarities are found between their “data patterns”. It is the hope of this study to
identify patterns in student thinking within the think aloud protocol that would shed light on why
certain responses are selected on the ABCC in a similar manner to the jigsaw analogy.
The results of qualitative data analysis may also be correlated to sources of quantitative
data in a mixed methods approach to produce a more complete picture of the research question
than either method alone would accomplish (Creswell, 2009, pp. 14-15). In mixed methods
research the sequencing of the two types of data will depend on the nature of the research
question. One method is to collect the two types of data sequentially, allowing the analysis of
the first to help define at least some aspect of the second stage of data collection. A second
method is to concurrently collect both types of data and then examine the data sets for
corroboration. Thirdly, the two types of data may be collected concurrently. In this approach,
one data type plays a subordinate role, or is “embedded in”, the first type (Creswell, 2009, pp
212-216). Due to the fact that this current study emerged from an item analysis of existing
student response data for the ABCC, with the think-aloud interviews being sought to provide
insight into the response patterns from students on this assessment, this research effort would be
best characterized as a sequential quantitative-qualitative mixed methods study.
Summary
The learning theories of Piaget, Ausebel, and Vygotsky provide a view of knowledge as a
network or schema. As new information is learned, the current schema must be adjusted to
accommodate the new information. Existing information that is informally acquired may not be
systematically linked into the knowledge structure, and, in its unintegrated form, can persist even

27
when the older understanding contradicts valid new information. Knowledge that is inconsistent
with accepted concepts creates a barrier for learning, including chemistry. These common sense
beliefs arise from many sources, including everyday experience with the world and cultural
language, and are challenging to replace with more scientific understandings. In order to identify
the presence of alternative conceptions both before and after instruction, conceptual assessments
such as concept inventories have been developed in a number of disciplines in the last two
decades. The best known of these was the Force Concept Inventory, which helped initiate a
wave of reform in physics instruction. In chemistry, however, the main concept inventories that
were created (the CCI and ChCI) have not been utilized in this same fashion. This may be due to
the fact that the available concept tests are either not of sufficient validity to perform robust
research in the effectiveness of instructional approaches in changing students conceptual
understanding of chemistry, or that the available tests are not suited to the studying growth of
introductory concepts as the FCI was. In attempt to fill this gap, the Assessment of Basic
Chemistry Concepts was created using the CCI and an addition set of energy-related questions
provided by Dr. Guy Ashkenazi.
The ABCC has undergone some initial evaluation and revision to address some language
issues in the questions, such as making sure the relative length of distractors do not give clues to
the answer (Engelhardt, 2009). A full evaluation of its validity and reliability has not been
completed. In order to more fully document the concepts found in the ABCC and provide
insight into the students’ reasoning during the test, two additional sets of data are proposed for
this study: an interview via questionnaire of experienced high school and college instructors in
introductory chemistry to gain consensus on the concepts being assessed, and think-aloud
protocol collected on a sampling of students who completed chemistry in the spring of 2011 as

28
they retake the ABCC in the fall of 2011. These results of the analysis of the think-aloud
protocol will be correlated to the item analysis of student responses from the spring of 2010 and
2011 to determine what think-aloud interview data, concept analysis, and item analysis of
student responses reveal about the validity and reliability of the current form of the ABCC.

29
Chapter Three: Methodology
Overview
The motivation for developing and refining the ABCC is to have an adequate assessment
device that can provide chemistry teachers with a means to monitor conceptual development in
their classes, and to compare the effectiveness of teaching methods or programs in developing
key concepts in chemistry. A review of the item analysis of an initial set of student response
data indicates more information is needed to understand some of the response patterns and
determine how well the ABCC in general, as well as specific questions noted in the item
analysis, are able to accurately and reliably reveal student understanding of key chemistry
concepts. This chapter outlines the research questions that frame this study, and then discusses
the procedures for data collection and analysis needed to address the research questions
delineated in the Introduction to this thesis.
Research Design & Procedures
The study was conducted using a mixed methods approach that employs both sequential
and concurrent data collection. The first phase of this study utilized unpublished item analysis
data from student responses on ABCC post-tests administered by high school chemistry teachers
as part of their classes. These data will guide the planning of the second concurrent phase of
data collection. The concurrent phase consisted of think-aloud interviews of high school
students answering selected questions from the ABCC along with an interview of chemistry
instructors via a questionnaire regarding the conceptual content of the ABCC. The item analysis
data was compared to the think-aloud data in a sequential explanatory design. The concurrently
embedded concept questionnaire results were analyzed alongside the think-aloud data to help
ascertain whether the concepts students use in answering the ABCC questions are in close

30
alignment with the concept the questions were intended to assess (Creswell, 2010, pp. 210-216).
Figure 1 in the first chapter illustrates the relationship between the research questions and the
data to be collected for this study.
Phase 1: Item analysis data. The data used for the first phase was collected during the
spring of 2010 and 2011 from chemistry teachers who elected to use the ABCC as part of the
assessment process in their chemistry courses. Some of these teachers voluntarily submitted
their student response data for further analysis of the pooled data. An initial item analysis of the
188 student post-test responses received from spring 2010 revealed areas where it would be
difficult to draw clear inferences from students’ responses, indicating the need for additional data
regarding students’ thinking as they make their selections. A second set of test results from 368
students was collected in the spring of 2011 and analyzed by Dr. Osborn Popp in September
2011. The data from the item analysis of the 2010 and 2011 administration of the ABCC served
to identify less well-functioning items on the ABCC, which was then used to select the focus test
items from the ABCC for this study. These item analysis data were one of the three data sets that
were compared during the analysis phase of the study.
Phase 2: Think-aloud interviews and ABCC concept interviews. In the second stage
of data collection both quantitative and qualitative data were concurrently collected based on
concerns raised by the item analysis in the first phase. The qualitative think-aloud interview
method is an accepted research method among educators for revealing how students think during
problem solving (Berne, 2004; Brock, et al., 2008; Ericsson, 2006; Otero & Harlow, 2009; Ruiz-
Primo, et al., 2001; Strauss & Corbin, 1998; van Someren, et al., 1994). This approach was
selected to inquire into the reasoning of high school students as they take the ABCC. A sample
of Fresno County high school juniors were selected from students who attend an accelerated high
31
school program where the researcher teaches. These students had completed chemistry in May
2011 and were invited to participate in think-aloud interviews for the questions from the ABCC.
The participating students had already taken the ABCC as part of their chemistry course the
previous school year, and were selected from among those who volunteered so that the test group
would be representative of the distribution of students by performance on the ABCC from the
previous spring. Each participating student was asked to answer selected questions from the
ABCC out loud in a private setting with the researcher. The interview with each student took
from 20 to 60 minutes in most cases, though one weaker student took about 90 minutes due to
uncertainty about the answers. This researcher, an experienced high school chemistry teacher,
conducted all the interviews and coded the focus test items from the ABCC to identify concepts
and reasoning patterns used by the students. These were examined for evidence of the chemistry
concepts students associated with each question as well as the reasoning participants used for
selecting or rejecting the response items for the selected focus test items from the ABCC. The
interviews were conducted during the fall semester of 2011, and analyzed in the spring of 2012.
The concept interview process was selected for this study because there is not currently a
single document outlining the concepts and alternative concepts by question for the ABCC.
Engelhardt (2009) recommends the use of a panel of at least five experts in the field be used to
review concepts inventories for the conceptual content of the assessment. For this study a panel
of five chemistry teachers (three college instructors and two high school instructors) agreed to
complete a questionnaire asking for the assessment of how well the chemistry concept statements
offered in the questionnaire were represented in each question of the ABCC. This information
was used to identify whether the breadth and frequency of concepts is sufficient for internal
triangulation of concepts between questions, as well as providing a guide for interpreting the

32
responses from students. A list of concepts perceived in the ABCC was created by this
researcher and reviewed by Larry Dukerich, who has been instrumental in the process of
developing the ABCC for high school chemistry. From this concept list, a concept map was
created to show the interconnections of the concepts found in the ABCC. Larry Dukerich and
Dr. Guy Ashkenazi reviewed the ABCC concept map, and revisions were made based on their
evaluation. The questionnaire was created by pairing each question to one or more concept
statements it appeared to assess, and asking respondents to rate how well the concept is assessed
by that question using a 5-point Likert scale (see Figure B4 in the appendix). The questionnaire
data was collected during the spring and early summer of 2011.
The three data sets from phase one and two were analyzed to identify any relationships
between the intended concepts being probed, the response patterns from students, and the
thought processes used by students while answering the questions. Specifically, the data will be
examined for evidence of how well the questions elicit thinking in the students about the
concepts the questions were intended to probe. See Figure 1 on page 7 shows the relationship
between data sets and the research questions for the study. The data were analyzed with two
goals in mind: 1) to shed light on the concepts and reasoning students use while answering the
questions of the ABCC, and 2) to provide needed information for making recommendations for
the continued refinement of the ABCC.
Population and sampling procedure. Because the ABCC is aimed at introductory
chemistry concepts, the three types of data identified in the previous section will be focused on
students from introductory high school chemistry and teachers of introductory chemistry courses.
The three study populations that were to gather this data are outlined here.

33
Post-test sampling for item analysis. Post-test results from the ABCC were gathered
from five high school chemistry teachers with varying degrees of teaching experience. An
invitation to submit student results was posted on the chemistry modeling listserve hosted by
Arizona State University in 2010 and 2011. At the time of the invitation, the listserve had
approximately 700 subscribers, most of whom are high school or college chemistry teachers.
The number of teachers on the listserve who use the ABCC as part of their course assessment
process is unknown. Teachers outside of the modeling chemistry community were not included
because the ABCC has not been published and is currently only available on a password
protected website accessible to teachers using Modeling Instruction. As a result, it is unlikely to
be currently in use by teachers outside of this community. The participating teachers voluntarily
provided response data from their students for inclusion in an item analysis as part of an initial
evaluation of the ABCC. These post-tests were given as part of the normal assessment process
used by these teachers in their courses. No personal identification information beyond gender
was attached to the individual student’s data sent for the item analysis (and this one identifier
was not utilized in this study since the data was not disaggregated except by performance on the
ABCC), nor are student responses traceable to an individual teacher in the item analysis report.
The only form of the data used in this study was the summary report of the item analyses for the
two data sets. This report simply summarized the overall statistical results for each question and
for the data set as a whole.
Student sampling for think-aloud interviews. Think-aloud interviews were conducted
with a sampling of juniors at a high school in Fresno County who were selected from students
who attend an accelerated high school program where the researcher teaches. These students had
completed chemistry in the spring of 2011 and had taken the ABCC as a pre- and post-test for

34
that course. This provided a pool of 120 students from which to select participants for the think-
aloud interviews. The qualified students were placed into three groups according to their
performance on the ABCC post-test (low, medium, and high scores, dividing the score range
approximately into thirds), which were designated Group A, B, and C, respectively. All students
from the 2010-11 chemistry classes were invited to participate, and informed consent letters were
given to those who expressed interest in participating. Those that returned the signed consents
letters were placed in the appropriate group based on their past performance. The target sample
size for the study is 3-4 students each for the Groups A and C, and 8-10 for Group B, reflecting
the proportions of students in each score range. Consent letters were received from 20 students
by the stated deadline: two from Group A, eleven from Group B, and seven from Group C. All
volunteer students were accepted from Groups A and B, while the first five who returned the
consent forms were accepted for Group C. An attempt was made to enlist one or two more for
Group A by personally inviting several students who would fit the desired performance range.
While two or three students expressed interest in participating, only one additional student
returned a signed consent form in time to participate for a total of three students in Group A.
All students who were confirmed for participation completed the think-aloud interviews.
Teacher sampling for ABCC concept interviews. The ABCC concept questionnaire was
given to a panel of six experienced chemistry teachers at the high school and college level.
These teachers were invited via email to participate. Five of the six completed the questionnaire
in sufficient time to include in the data for this study.
Data analysis. Dr. Sharon Osborn Popp provided item analysis results for ABCC post-
test from 2010 and 2011. The analysis was run on the MicroCAT Testing System using the Item
and Test Analysis Program. Statistics for each question and its distractors were printed in tabular

35
form, followed by a summary of the scale statistics. The values from the item analysis primarily
utilized for this study were the point biserial correlations and proportion endorsing for each
response. Statistical measures for the overall performance of the ABCC for each data set
included the mean score and standard deviation, along with the coefficient alpha, the mean
discrimination index, the mean proportion endorsing, and the mean point biserial correlation.
The video and notes from the think-aloud interviews were coded into a spreadsheet by
observation categories using procedures outlined by Strauss and Corbin (1998), Silverman
(2001), and van Someren, et al. (2004). An excel spreadsheet was set up with columns for
selected observations. Observations of students’ reasoning and concepts used were coded into
the appropriate observation column along with brief comments as appropriate. Selected portions
of the student interviews were also transcribed from the video records into the spreadsheet to
support observations and inferences drawn from the interviews. The codes used within each
observation category in the spreadsheet are outlined in Figure B3 in Appendix B
The numerical ratings from each reviewer were collected into a single table for each
question-concept pair in the questionnaire. The average rating the five responses was calculated
for each pair, as well. Additional comments made in the open-ended portion of the questionnaire
were summarized by question at the end of the summary table and reviewed for important
patterns in the panel’s observations. These data were compared to the concepts expressed by the
students in the think-aloud interviews as part of the analysis process.
As a mixed method design, the coded transcripts of the interviews were examined for
the frequencies of certain approaches, concepts, or alternative conceptions students use for each
question. Where multiple patterns of thought were found among the students, these were tallied
in the spreadsheet to provide quantitative summaries of the patterns seen. These various data

36
from the interviews were compared to the frequencies of the answers identified within the item
analysis and to the key concepts the panel of chemistry instructors identified for each question to
ascertain how well these correlate to one another.
Validity and reliability. Validity is a measure of the ability of an assessment to measure
what it says it measures, while reliability addresses the reproducibility of the data from an
assessment (Creswell, 2010; Engelhardt, 2009; Strauss & Corbin, 1998). The validity and
reliability of the ABCC is a central issue behind this study. The validity and reliability of this
study are addressed in the following sections for each of the study data sources.
Item analysis of post-test responses. One element affecting reliability is sample size and
representativeness for the larger population. The population of students used for the item
analysis of the 2010 and 2011 post-test data (N=188 and N=368, respectively) is of adequate size
to be sufficient for the purposes of this study. The item analysis of post-test responses carries
within its design a number of measures of internal reliability for the ABCC such as Cronbach’s
alpha (or coefficient alpha), point biserial data for each response item, variance, and standard
error of measurement.
Think-aloud interviews. The reliability and validity of the interviews was addressed by
using a standard interview process in an environment free of undue distraction for each student.
The room selected for the interviews is one that is only occasionally by faculty and staff with a
small conference table located near a large window that could provide indirect lighting for the
videotaping. The room was reserved for private use during the interviews and signs placed on
the door indicating research was in progress and requesting not to be disturbed. This researcher
coded the interviews using a defined coding list and spreadsheet developed in an iterative

37
process during the early part of the analysis phase of the study (see Figure B3). When necessary,
video segments were reviewed and coding records updated to reflect refinements in the process.
ABCC content questionnaire. The ABCC concept questionnaire was examined for
clarity in the instructions by one other chemistry instructors to determine that the form and
language of the questionnaire was understandable before being sent to participants. Since the
Likert scales used in the questionnaire produce quantitative data and the sample size is limited,
these were analyzed by examining the frequency and range of the individual responses, along
with the mean of the ratings to evaluate the reliability of the results. The open-ended responses
summarized by question. The comments were considered in interpreting the ratings data.
Inter-rater reliability procedure for think-aloud interviews. Reliability of the coding
process is typically demonstrated by crosschecking interpretations of the same material between
two or more different coders (Creswell, 2010, p. 190; Silverman, 2001, p. 229). The interviews
were coded by the researcher, an experienced high school chemistry teacher, to identify concepts
and strategies used by the students. Because of the limited scope of the coding categories and
the semi-quantitative nature of the data collected, along with time limitations, only the researcher
completed the analysis of the videos. However, the interpretation of the analysis of the videos
was discussed with a second experienced high school teacher who is very familiar with the
ABCC as a check on the interpretive process.
Instruments used for data collection. The item analysis results of existing data from
the Spring 2010 and Spring 2011 post-tests provided by Osborn Popp. Additional data collection
instruments were used for the think-aloud interviews and for the concept review portions of this
study. These are discussed below.

38
ABCC questions for think-aloud interviews. The ABCC consists of 28 multiple-choice
questions. Ten questions are single questions, while nine of the questions paired with a question
that asks students to provide a reason for their answer to the first questions (for a total of 18
questions). The item analysis data from 2010 uses version 2.5, while the item analysis from
2011 is based on version 2.6. The version that was used for phase 2 of this study is version 2.6.
Version 2.6 differs from version 2.5 only in distracter D in question 14. The change in version
2.6 restores question 14 to the original form used in Mulford’s Chemical Concept Inventory
(CCI). Version 2.6 of the ABCC was used for the think-aloud interviews, with selected focus
test items identified for analysis that are based on the areas of concern seen in the item analysis
data from 2010 and 2011. The three criteria for inclusion as a focus test items are 1) statistical
indicators that the question is not well-functioning, 2) concern about the question construction,
or 3) lack of prior analysis of the question present in the literature. The validity and reliability
of this instrument is the subject of this study.
The think-aloud interviews were conducted on all 28 questions of the ABCC, version 2.6
(see Figure B1). The specific questions selected for the think-aloud interviews will be identified
using the 2010 and 2011 item analysis data. The focus will be on selecting questions where
concerns have been raised, along with selected additional questions that can provide support for
interpreting the questions where there are concerns.
ABCC concept questionnaire. Responses to a questionnaire were elicited from five
expert chemistry teachers at the high school and college level to determine which chemistry
concepts are perceived in the questions of the ABCC. The questionnaire presented one or more
suggested concept statement(s) for each question on the ABCC. The participating reviewers
were asked to rate how appropriately the question assesses the concept using a Likert-like scale

39
(1= concept is not assessed by this question to 5 = concept is clearly and appropriately assessed
by this question). An open-ended responses were requested at the end of the questionnaire for
additional comments or observations the interviewee feels are pertinent to each question. One
reviewer embedded comments into the questionnaire. The concept list for the questionnaire was
created by the researcher and reviewed by another experienced chemistry instructor for clarity
and consensus before being adapted to questionnaire form and sent to participating instructors.
Three of the reviewers inadvertently received a version of the questionnaire that had omitted
Question 14, so that ratings were only received from two reviewers for the concepts paired with
this question.
Data collection process.
ABCC item analysis data. The data for the item analysis was collected in May and June
of 2010 and 2011 prior to the initiation of this study, and is being provided by Dr. Sharon Osborn
Popp. All ABCC test results used for the item analysis were collected as part of the standard
assessment practices for the teachers, and were submitted to Osborn Popp to aid in the evaluation
of the ABCC. Specific student or teacher identification data were not included in the item
analysis results that will be used for this study, ensuring the privacy of both the teachers and
students involved.
Think-aloud data collection. Once the student participants had been identified according
to the sampling procedures described above, interviews were scheduled with each student during
the remainder of the Fall 2011 semester. The interviews were conducted on the participants’
high school campus at times convenient to the student and the researcher. Several interviews
were conducted after class on school days. However, most of the students preferred to schedule
their interviews on Saturday. Three Saturdays were selected by consensus between the

40
researcher and the students. Students signed up for a 1-hour block during designated openings.
When needed, alternative times were negotiated to accommodate schedules. The interviews
were conducted in a seldom-used storage and workroom on campus, which was reserved on the
main room-scheduling calendar for the school to ensure an uninterrupted interview. Video and
audio recordings were made during each interview, except one in which the record mode was not
properly activated. During the interviews, written notes were taken by the interviewer to note
significant comments or events during the interview process and to be sure the students
comments were understandable to the researcher, including the interview that was not
videotaped. If the researcher did not understand a students words or line of reasoning, the
student was prompted to repeat or elaborate briefly before going on. Occasionally, one of the
students would ask a direct question of the researcher regarding a question, to which the
researcher would attempt to elicit the thinking of the student using questioning techniques, and
only respond more directly if the student seemed unable to move on without some satisfactory
response from the researcher. These few moments were, of course, evident in the video record
of the interview, and so could be taken into consideration in the analysis and interpretation of the
student’s thinking. In addition to the video records and researchers notes, the answer sheet for
the ABCC was collected and the student’s copy of the ABCC with the exception of the first two
interviews where the test copy was not specifically collected. The test copy began to be
collected after a student requested to draw something out on the test. Beginning with this
student, all remaining test copies were filed with the answer sheet and the interview notes from
each session as another piece of evidence for the students’ reasoning.
According to Ramey (n. d.) and van Someren, et al., (1994), there are important steps to
setting up a think-aloud interview for each participant. The comfort of the participant and

41
absence of unnecessary distractions are critical, along with the clarity of the instructions, and the
use of a warm-up activity before beginning the actual interview. To achieve these, the student
was seated in a comfortable chair at a small conference table out of view of the hallway window.
The table was facing a north window that would provide adequate indirect lighting for video and
a pleasant atmosphere from the natural lighting. The camera was positioned to capture video of
the student and the student’s workspace along with the audio of the student and the interviewer
without being intrusive or unnecessarily distracting to the student. The researcher could also be
seen on one side of the video image. The video and audio was captured using a small digital
camera with a built-in microphone designed for capturing high-quality sound for web videos.
The camera was mounted on a floor tripod at one corner of the table opposite the student. The
ability to use available light kept the equipment needed simple and unobtrusive.
The interviewer greeted each student at the door and led him or her to the interview area
at the back of the room. She helped put the student at ease by clearly explaining the purpose, the
materials, and the process that would be used. Then, before beginning the interview or the
recording process, the interviewer had the student practice thinking aloud while solving a
moderately simple Tangram puzzle, the interviewer gave feedback during this 3-4 minute
process to help the student get voice levels in a good range and become a bit more comfortable
expressing his or her thinking aloud, and also made sure the student was able to be successful
with the puzzle, if needed. The interviewer remained seated in a student chair throughout the
interview, like the participant, and off to one side while maintaining a clear view of the student
and his or her work during the interview. Once the student appeared to understand what was
expected, the camera was set to record, and the student began working through each question. A
set of numbered cards large enough to be read by the camera were placed on the table next to the

42
interviewer flipped over to indicate the question the student was working on so that it would be
easier to identify the desired question during the analysis of the videos.
Once students completed the ABCC questions, the interviewer occasionally requested
clarification on some aspect of the student’s descriptions during the interview, if needed. The
use of retrospective questions following a think-aloud session are discussed by van Someren, et
al (1994, p. 26) as a means of clarifying pauses or fragments of thought within the think-aloud
record. All records of the interviews (test copy, answer sheet, interviewer notes, and video files)
were labeled to identify the participant, time, and date. Immediately after each interview, the
video files were logged and transferred to the computer where they would be analyzed and
converted to mp3 files. After all the interviews were completed, the videos were edited to create
a single video for each focus test items containing all the interview segments from each student
sequenced from low performance to high performance based on their spring 2011 post-test
scores. This sequencing matched the student order in the coding spreadsheet, and facilitated
finding patterns in student responses that might correlate to ability on the ABCC.
ABCC content questionnaire. Potential participants identified according the sampling
procedure described in a previous section were contacted via email to be invited to participate.
Those that agreed to complete the interview questionnaire were provided with a copy of the
ABCC and questionnaire by email. The response rate was monitored to ensure sufficient
numbers of questionnaires are completed to provide an adequate data for the purpose of checking
the content validity of the ABCC (Engelhardt, 2009, p. 14). The suggested minimum was just
met with a panel of five participants. A copy of the questionnaire is in the appendix (see Figure
B4).

43
Timeline
This research began in late September 2011 and was completed in June of 2012. The
major tasks for this research, with the implementation period are outlined by research strand in
list form below.
ABCC Item Analysis and Think-Aloud Interviews
1. September 2011: Secure item analysis results for identifying areas of concern in
the ABCC for this study.
2. Late September-October 2011: recruit student participants for the think-aloud
interviews and schedule the interviews
3. Late October – November 2011: conduct think-aloud interviews
4. January-May 2012: coding and analysis of interviews; review analysis with a
second experienced teacher
ABCC Content Interviews via Questionnaire
1. October-November 2011: construct ABCC concept statements for each ABCC
question;
2. Winter 2012: review concept list and questionnaire construction with two other
and identify potential expert panel participants via researchers professional
network
3. Spring 2012: recruit expert panel participants and send ABCC content
questionnaires to
4. Spring 2012: send ABCC content questionnaire to expert panel participants and
receive completed ABCC content questionnaires
5. June 2012: analyze results of questionnaire
Analysis and Conclusions
1. May-June 2012: correlate results of the ABCC item analysis data, think-aloud
interviews, and ABCC content questionnaires
44
2. May-June 2012: form conclusions and recommendations based on the data
analysis
Limitations of Study
This purpose of this study is to provide evidence for evaluating whether additional
changes are warranted in the item in the ABCC for the purpose of improving the validity of the
device. The sampling levels used for student interviews and item analysis should provide
sufficient information for this purpose. These data, however, would not be sufficient for the final
evaluation of the effectiveness of the ABCC as a research instrument. A larger study population
would be needed for item analysis that would intentionally secure a more representative cross-
section of students and teachers in the data once the recommendations of this study are
addressed. A follow-up to the ABCC content questionnaire may also be needed using a larger
review panel to clarify the cause of variability seen in the reviewer’s responses, and to verify
whether any adjustments made to the questions would alter the content domain of the
assessment.

45
Chapter Four: Presentation and Analysis of the Data Overview
The purpose of this study is to better understand student data from the ABCC by
comparing student think-aloud data to patterns of student responses in item analysis data and the
assessed concepts from the ABCC. This chapter will discuss the results of the concept
questionnaire followed by a comparison of the item analysis results with student reasoning used
during the think-aloud interviews.
Concept list questionnaire. The ability to interpret student responses on the ABCC
would be stronger with clear statements of what the questions are assessing. While Mulford’s
work included descriptions of the chemical concepts the CCI development was based on, the
questions adopted from the CCI had undergone some revision, including omission of selected
questions that did not address concepts that were considered central to high school chemistry,
and six energy questions added that had been developed by Ashkenazi (Zimrot and Ashkenazi,
2007; G. Ashkenazi, private communication, July 31, 2011 and August 13, 2011). As a result,
no single statement of what the ABCC measures had been made prior to this study. During the
fall of 2011 a set of concept statements was created for each question on the ABCC which was
then reviewed by chemistry educators in two stages, as described under the Research Method for
this project. The resulting 23 concept statements were each labeled from A to W.
During the spring and early summer of 2012, three college chemistry professors and three
high school chemistry teachers were approached to review the concept list using the ABCC
Concept List questionnaire (see Figure B4 in Appendix). The reviewers were asked to rate each
concept question on a Likert scale from 1 (concept is not assessed by this question) to 5 (concept
is being assessed clearly and appropriately). Five of those invited to review the concept list
46
responded. Their ratings were compiled and an average rating was calculated. A concept map
(see Figure 6) was created from the list to show the relationships between the concepts and the
frequency of related concepts in the ABCC. Each concept in the map is identified with a unique
letter in the lower left corner of the concept box. Number at the bottom of the concept statement
lists the questions associated with each concept. A combination of the question number and
concept letter (i.e., Concept 2B) will be used throughout this study to refer to specific question-
concept pairs. The map was reviewed by Dukerich and Ashkenazi during the fall and winter of
this study, and edited based on their feedback. The ratings will be discussed under Analysis of
Findings.
Item analysis and think-aloud data. One of the hallmarks of a well written multiple-
choice assessment question is the ability to discriminate between those who have the
understanding to perform well and those whose understanding is weak. Statisticians use several
measures to tease out this information from test data. The primary measures considered for this
project are item analysis based on proportion endorsing, point-biserial correlation values,
discrimination, and option analysis, along with probability curves. These will be explained in
this section.
During the 2009-10 and 2010-11 school years, two sets of post-test data on the ABCC
were collected prior to this study as part of a preliminary look at the reliability and validity of the
ABCC. These two data sets will be referred to as the Spring 2010 post-test data, and the Spring
2011 post-test data. Item analysis was run on each of the two sets of data. Based on the item
analysis, most questions are consistent with well-functioning assessment items. An overview of
the statistics for these two sets of data is in Table 1. The two sets of data differ in population
size, mean score, and mean point biserial, with stronger indicators for the Spring 2011 data. The

47
internal consistency reliability estimate using coefficient alpha, a mean split-half correlation,
(Cronbach, 1951) is .750 (Spring 2010) and .798 (Spring 2011). According to Engelhardt
(2009), reliability estimates above 0.70 for multiple-choice tests are acceptable to “identify areas
of difficulty and evaluate teaching” (p. 24). The ABCC in its current form does appear to have
sufficient internal reliability to meet these objectives. A handful of the questions showed point
biserial data and answer frequencies for distractors that were not consistent with these preferred
patterns. The same trends were seen in the probability curves, as well. These less-desirable
response patterns could be indicative of problems in the structure of the question prompt or its
answer items. The patterns might also be revealing a misconception that students are using to
answer the question.
Table 1. Summary of ABCC post-test item analysis
Statistical Measure N Mean
Score Standard Deviation
Coefficient Alpha
Mean Proportion
Correct
Mean Discrimination
Index
Mean Point
Biserial Spring 2010
post-test 188 12.069 4.660 .750 .431 .397 .474
Spring 2011 post-test 368 15.416 5.100 .798 .551 .437 .525
The item analysis used for the ABCC looked primarily at the proportion of students who
answer correctly and the point biserial correlation value. Another common measure is
discrimination value, which compares the difference in the proportion of high-performing
students and low-performing students endorsing a particular answer option. Generally, the larger
the discrimination value, the better the test question distinguishes between high-performing and
low-performing students on that question. The point biserial correlation provides a similar (but
not identical) indicator as the discrimination value, so for simplicity, it will be used in the
analysis for this study. The point biserial is generated by comparing the correct and incorrect

48
item responses with total score on the test. A high value for the point biserial would be
indicative of a question in which high-performing students are more likely to answer correctly
and low-performing students are more likely to answer incorrectly. The same two measures
(proportion endorsing a specific response and the point biserial) were also applied to the
individual distractors within each question, showing the proportion selecting each answer option
for the low-performing students and for the high performing students, as well as the strength and
direction of the correlation between response to that item and overall performance (Crocker &
Algina, 2006; Engelhardt, 2009, p. 28-31; Osborn Popp, private communications, 2011-2012).
In addition to the tables of item analysis results, probability graphs were generated for the
2011 data set. These graphs display the trends in the probability of a student of a particular
performance level (based on overall raw score) has of selecting a given answer option. This
analysis is similar to the item response curves used by Morris, et al, (2006) in evaluating student
responses to selected questions on the Force Concept Inventory, which plots the frequency of
each answer option vs. the overall FCI score. The probability graph used in this study plots
probability of a certain response on the vertical axis against a scale of overall performance called
the person location scale on the horizontal axis. Since the sample populations were relatively
small in the available ABCC data collected prior to this study, the trend lines were generated by
only comparing the high-performing group of students to the low-performing group in each data
set. This produces a clean, linear correlation that is easy to read and provides sufficient
information to see which items are able to discriminate between high and low performing
students. From these two-point probability curves we can identify which distractors exhibit the
desired negative slope from low to high performing students, and a steady upward trend for the
correct answer. These responses would indicate a higher probability of low-performing students

49
selecting an incorrect response and a high-performing student selecting the correction response
on that test question. In addition to the two-point probability lines for each answer option, a
single curve is overlaid, called the item characteristic curve (ICC). This curve gives an overall
estimate of the probability of students answering correctly across the performance range.
(Crocker & Algina, 2006; Osborn Popp, private communications, 2011-2012).
Interpreting item analysis results and probability curves. In this section a statistically
strong question and a statistically weaker question will be compared to show how these statistical
measures are used for the evaluation of a conceptual test. Question 2 is a good predictor of
student ability, according to its item analysis. In contrast, item analysis results of Question 14
show it is not strongly correlated to student performance. The item analysis results and the
probability graphs for these two questions will be compared to contrast the difference in their
statistical indicators to facilitate the discussion in the Analysis of Findings section where the
implications for the focus test items for this study will be discussed in depth. The item analysis
results for Questions 2 and 14 are presented in Table 2 and Table 3 and will be used as examples
for this discussion.
Table 2. Item Analysis of ABCC Question 2: Spring 2011 Post-test
Item Statistics Alternative Statistics Proportion Endorsing
Question Number
Proportion Correct
Point Biserial
Alt.
(* = Key) Total Low High Point
Biserial 2 0.54 0.46 1 (A) .00 .00 .00 --- 2 (B) .02 .04 .01 -0.10 3 (C) .33 .50 .13 -0.29 4 (D) .11 .18 .01 -0.24 5 (E)* .54 .28 .86 +0.46 Other .00 .00 .00 ---

50
Table 3. Item Analysis of ABCC Question 14: Spring 2011 Post-test
Item Statistics Alternative Statistics Proportion Endorsing
Question Number
Proportion Correct
Point Biserial
Alt.
(* = Key) Total Low High Point
Biserial 14 0.33 0.19 1 (A) .00 .01 .00 -.05
2 (B) .06 .11 .03 -.14 3 (C)* .33 .30 .46 +.19 4 (D) .61 .59 .51 -.24 Other .00 .00 .00 ---
Proportion Correct. The proportion correct is a ratio of the number of correct responses
to the total number of responses. This value is also sometimes called the Item Difficulty, or “p-
value”. The higher this value for a particular test item, the easier it is to answer correctly for that
item. The proportion correct for Question 2 (Q2) is .54, indicating that 54% of the students
answered this question correctly, while in Question 14 (Q14), the proportion correct is 0.33
(33%). The proportion correct for Q2 ranges from 28% for low-performing students to 86% for
high-performing students, which shows that understanding this concept is correlated with the
overall performance on the ABCC. For Q14 the proportion correct ranges from 30% for low-
performing students to 46% for high-performing students. While high-performing students do
select the correct answer more frequently than low-performing students, the percentage
answering correctly is still below 50% even for stronger students. This means just over 50% of
the high-performing students answer this question incorrectly. From the data in Table 3, it is
seen that the most-frequently selected wrong answer for Q14 is Option D (61%), with high-
performing students endorsing this answer is 51% of this group. Option D offers an appealing
response to about half of the strongest students.
Point Biserial Values. The point biserial value for a statistically strong question would
have a significantly positive value to indicate a much higher frequency of selection among high-
performing students versus low-performing students. A negative point biserial value would

51
indicate this option is negatively correlated with overall student scores on the ABCC. As is seen
in Q2, the point biserial for Option E (correct) is +.46, while the point biserial values for the
distractors ranges from -.10 to -.29. For each distractor, high-performing students are
significantly less likely to select these options than the low-performing students, while the
correct option shows a very significant increase in frequency of selection among high-
performing students in comparison to the low-performing students. In Q14, negative point
biserial values are also seen for each of the distractors, even for the highly selected Option D.
The key concern for this question is the low rate of selection for the correct answer, while one
distractor is endorsed by over half of the students across all performance ranges.
Probability Graphs. The probability graph for a test item displays the relationship
between the probability of selecting a given answer option in relationship to estimated examinee
ability. The probability graphs were generated in a Rasch model analysis for dichotomous items
(Rasch, 1960/1980; Wright & Stone, 1979) conducted using RUMM (Rasch Unidimensional
Measurement Models), version 2.71 (Andrich, Lyne, Sheridan, and Luo, 1997). Under the Rasch
model, a correct response is modeled as a logistic function of the difference between an estimate
of an examinee’s ability and an item’s difficulty. Estimates of examinee ability and item
difficulty can be compared on the same linear logistic scale (in log-odd units, or logits). Positive
logit values represent higher ability and higher degree of item challenge while negative logit
values represent lower ability and lower degree of item challenge. The estimated examinee
ability axis uses a scale from -∞ to +∞ in log odd units (or logits) with the zero point is set at the
mean item difficulty. Those below zero perform more poorly than average, while those above
zero perform better than average. The actual mean may be to one side of the person locator zero
point, depending on the difficulty of the question. In the graphs created for the ABCC data, the

52
probability curves were generated from a comparison of the low- and high-performing students
only. This produces a linear probability curve, which is easier to interpret and adequate for the
level of analysis needed for this project. Each option is labeled with a number corresponding to
the labels given in the Alternatives (Alt.) column in the item analysis tables, i.e., the curve
labeled “1” for the Q2 graph corresponds to answer option “A” in Q2. A single curved line (the
item characteristic curve, or ICC) overlays the graph and indicates the overall probability of a
correct response in each portion of the person location scale. The probability graphs for Q2 and
Q14 are shown in Figures 2 and 3 below.
Figure 2. Probability Curves for ABCC Question 2: Spring 2011 Post-test
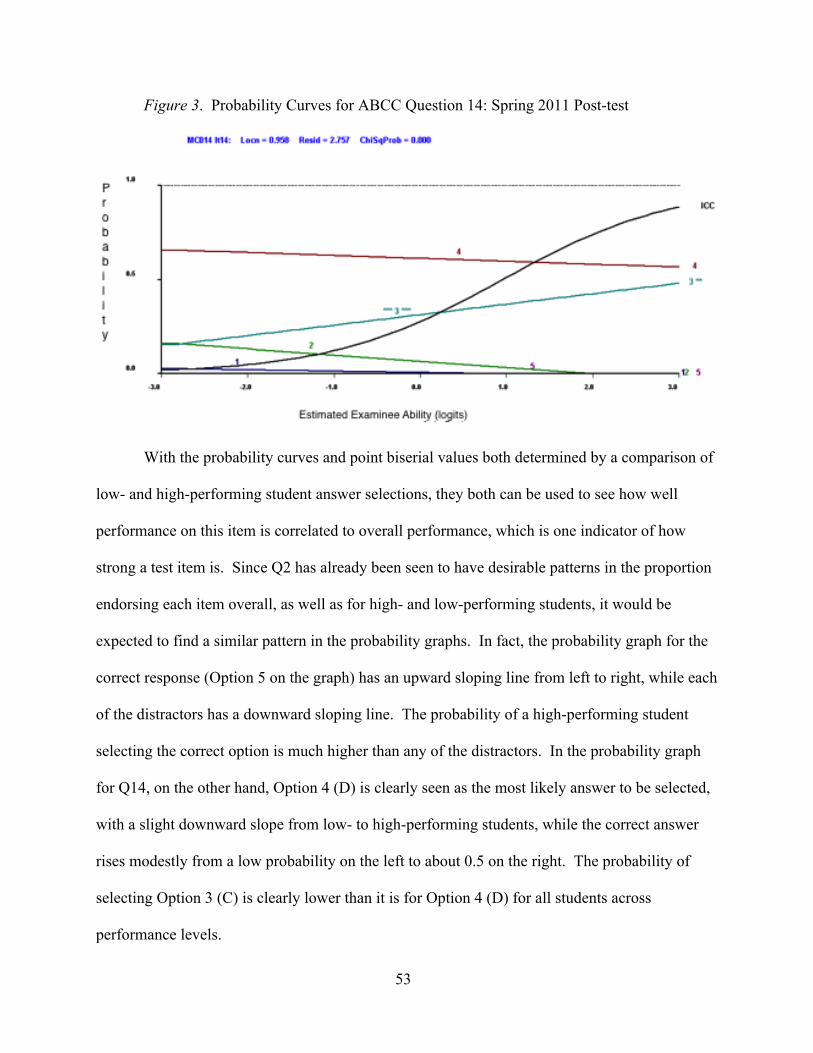
53
Figure 3. Probability Curves for ABCC Question 14: Spring 2011 Post-test
With the probability curves and point biserial values both determined by a comparison of
low- and high-performing student answer selections, they both can be used to see how well
performance on this item is correlated to overall performance, which is one indicator of how
strong a test item is. Since Q2 has already been seen to have desirable patterns in the proportion
endorsing each item overall, as well as for high- and low-performing students, it would be
expected to find a similar pattern in the probability graphs. In fact, the probability graph for the
correct response (Option 5 on the graph) has an upward sloping line from left to right, while each
of the distractors has a downward sloping line. The probability of a high-performing student
selecting the correct option is much higher than any of the distractors. In the probability graph
for Q14, on the other hand, Option 4 (D) is clearly seen as the most likely answer to be selected,
with a slight downward slope from low- to high-performing students, while the correct answer
rises modestly from a low probability on the left to about 0.5 on the right. The probability of
selecting Option 3 (C) is clearly lower than it is for Option 4 (D) for all students across
performance levels.

54
The statistics seen for Q14, along with a few other questions on the ABCC, raises the
question as to why these questions do not produce the desired answer pattern. In order to
distinguish whether the less desirable statistical patterns arise from question construction or from
student misconceptions, students were interviewed using a think-aloud method to record the
thought processes students were using while taking the test. The procedure used for this is
elaborated in the Research Method section of this report. In summary, students took the test in a
quiet environment and verbalized their thoughts as they worked through each question on the
ABCC. This process was recorded on video along with hand-written notes for each question (see
Appendix, Figure B2) to be sure the student’s reasoning was being expressed in an
understandable manner during the interview process and to note significant comments for later
reference. If the student’s meaning was not clear during the interview process, the researcher
would ask for clarification. If students seemed to get stuck, the interviewer would gently direct
them back to the question or to pertinent comments the student had made, attempting not to
influence the actual thought process the student was using. These interviews were coded and
analyzed for patterns in student thought (See Appendix, Figure B3).
Focus test items. Seven question or question pairs from the ABCC were identified for
analysis where further elaboration into student thinking was needed to interpret the results or
where a concern about test construction was found. Two individual questions and one question
pair were found to be less well functioning than desired. These are Question 9 (Q9) regarding
bonding and energy, Question 14 (Q14) looking at students’ understanding of the size of an
atom, and paired Questions 20 and 21 (Q20/21) addressing solution equilibrium. Figure 4 plots
the proportion correct, the point-biserial value, and the discrimination index against the question
number. As can be seen in the graph, these four questions (Q9, Q14, and Q20/21) are found at

55
the minimum points for discrimination and the point-biserial correlation, well below most of the
other values. These questions do not function as well in discriminating between low- and high-
performing students. Question pair 12 and 13 was selected because it had answer options in Q12
that were unsupported by an associated explanation in Q13. The three sets of paired questions
(23/24, 25/26, and 27/28) that probe aspects of the energy concept were selected for analysis
because student interview data has not been published for these questions, and these questions
had a somewhat lower level of agreement among the reviewers as to what was being assessed.
All seven focus test items are marked on Figure 4. The item analysis for these questions will be
examined alongside the results of the think-aloud interviews in an attempt to shed light on the
student reasoning that is producing these effects, and to determine whether it is due to
misconceptions we wish to monitor using the ABCC, or to some other issue.
Figure 4. Statistical measures by ABCC question, with focus test items identified
0.00
0.10
0.20
0.30
0.40
0.50
0.60
0.70
0.80
0.90
1.00
0 5 10 15 20 25 30
Propor1on Correct
Pt-‐Biserial (correct)
Discrimina1on
ABCC Question
9
14
27/ 28
20/21
12/13
23/24, 25/26

56
Results
This section begins with a discussion of the results of the concept questionnaire. In the
second section, the seven focus test items (with paired questions treated as one item as they are
in the concept questionnaire and concept map) will be discussed in light of item analysis data,
student reasoning from think-aloud interviews, and the concept review data. For Questions
12/13 and the last six energy questions, the mapping of explanation to answer was also addressed
in the discussion.
Concept list questionnaire results. The concept questionnaire asked reviewers to rate
31 question-concept pairings from the ABCC for how well the question assesses the associated
concept using a 5-point Likert scale (see Figure B4). In this discussion, each statement that was
reviewed will be referred to as a question-concept pair and labeled by the question number and
the concept letter identifier (i.e., concept 2B refers to concept B reviewed for question 2). Most
of the concept statements were unique to a specific question. Some concept statements were
reviewed for more than one question, i.e. concept A (mass is conserved during any physical or
chemical change within a closed system) was reviewed for Questions 1, 4, 12/13, and 18/19. On
the other hand, certain questions such as Questions 27/28 were reviewed for more than one
concept statement (Concepts T, U, V, and W, in this case). The best-triangulated concepts are
those associated with conservation of mass (1A, 1D, 4A, 5D, 7/8D, 12/13A, and 18/19A) with
average reviewer ratings ranging from 4.0 to 5.0. The concept of solution concentration was
rated 4.4 for concept 15K, and 4.0 for concept 20/21K.
The actual distribution of ratings for each question-concept statement pair can be seen in
the bar graph in Figure 5 below. Each bars is labeled with the concept identification letter and
ABCC question number used in the concept map (Figure 6) and concept questionnaire (Figure
B4). Where more than one concept statement was reviewed for the same question, the graph

57
bars were shaded alike and bracketed at the bottom to indicate they represent concepts that are
associated with the same question. The frequency table for the average ratings is summarized in
Table 4.
Figure 5. Average ratings for question-concept pairs from the concept questionnaire
Table 4. Frequency of average ratings for concept statements by range
Range: Average Rating 5.0 4.5-4.9 4.0-4.4 3.5-3.9 3.0-3.4 <3.0
Frequency 6 12 7 4 1 1
The mean rating for each of the 31 question-concept pairs ranged from 2.6 to 5.0 with an
overall mean rating of 4.4 and a median of 4.8. Six of the concept/question pairs earned a rating
of five by all reviewers. The question-concept pairs receiving the highest rating are Concepts
3C, 4A, 5E, 10/11H, 20/21P, and 22Q (see Figure 6 or Figure B4 for the concept statements).
Twelve additional question-concept pairs fell in the range of 4.5-4.9 by being given ratings of 4
or 5 by all reviewers (except Q23/24, where reviewer A alone gave the first concept statement

58
for this question a rating of 3-4 which was calculated as a rating of 3.5). Six of the
question/concept pairs received an average rating below 4.0, ranging from 2.6 to 3.9. The lowest
rated concept statement received a split rating in which three reviewers gave it a rating of 1 while
the remaining two gave the statement a rating of 5, indicating a vastly different view of whether
question pair 27/28 assesses this concept. The other three concepts associated with Q27/28 had
one rating of 1.5 compared to 4 or 5 from the other reviewers. Concepts 20/21P and 20/21Q also
had a similar split in the ratings. These clearly need additional clarification.
Overall, there is moderate to strong agreement with the concept list created for the ABCC
for this project with 25 of the 31 question-concept statement pairs receiving an average rating of
4.0 or higher. The statements that fell below 4.0 should be further investigated to identify the
reasons for the lower ratings, and edited to produce stronger concept statements. Reviewers
were able to offer comments about the concept statements or their rationale for the rating given
to a question-concept pair. Mulford suggested additional concepts for consideration on three
questions that, in his opinion, are significant to how students think in selected questions. For
example, in Question 1, which addresses what is conserved in a chemical reaction, students often
miss this question because they do not adequately distinguish atoms from molecules, as seen in
his interviews during the development of the CCI (Mulford, 1996). He recommended that a
statement related to this important distinction be included. While additional work is needed to
have a more definitive concept list for the ABCC, many of these statements do appear to
represent key ideas the ABCC is assessing which can help those who use the ABCC in their
interpretation of student results.

59
Figure 6. ABCC Concept Map

60
One characteristic of a well-written assessment is having multiple questions assessing the
same concept or objective. Engelhardt (2009) recommends three questions per objective “so that
the responses can be triangulated” (p. 11). The CCI, from which most of the questions on the
ABCC were taken, began with a list of concepts common in introductory chemistry about which
students often hold misconceptions. These guided Mulford’s selection of questions for the CCI.
The six energy questions from Ashkenazi were also created around key misconceptions about
temperature and energy. The concept map of the ABCC (Figure 6) shows that most of the
concept statements reviewed for this study center around conservation, structure of matter, and
energy. While there are several questions in each broad category, only two of the concept
statements are associated with at least three questions or question pairs that Engelhardt (2009)
recommends as a minimum. These are concepts A and D, which are closely related statements
regarding the conservation of mass. Three others (concepts B, K, and S) have two associated
questions. The ability to triangulate any one specific concept would be limited in the ABCC,
except in the case of concepts A and D. Still, examining student results in light of the broader
categories the concepts have been placed in may help identify possible strengths or weaknesses
in student thinking in the broader concept categories.
Item analysis and think-aloud results. For each focus test items in which the item
analysis raised concerns, the student responses frequencies in the item analysis were compared to
the rationales provided during the think-aloud interviews. For each question, the text of the
question will be presented with an asterisk by the correct answer, along with the item analysis
data for the 2011 post-test data and the probability graph. Other data summary tables or
diagrams as needed. Individual students from the test group are identified by pseudonyms
throughout this discussion to protect the students’ identity.

61
Question 9
Question 9 is included in the analysis for this project because of the low point biserial
correlation for all answer options and the fact that it has two incorrect responses that are selected
by more than half the students between them. The correct answer (Option C) receives a total
endorsement by 44% of the 368 students in the 2011 post-test administration, while Option D
received 35% total endorsement (see Table 5). The point biserial values for Options C and D are
both small, with little discrimination between low- and high-performing students. This question
probes students’ understanding of energy changes as bonds break and form during a chemical
reaction. The concept statement reviewed for this question, “bond breaking requires an increase
in potential energy of a system, while bond forming lowers its potential energy” received a
strong average rating of 4.8. According to Kind (2004, p. 66), it is a common misconception that
breaking bonds releases energy, rather than increasing the potential energy between the once-
bonded atoms.
The presence of this misconception is readily seen in the item analysis (Table 6) for this
question. A little less than half the students (44%) in the spring 2011 post-test sampling
correctly identified the formation of the hydrogen-oxygen bond as the cause of the energy release
during the synthesis of water. The most common wrong response (35%) in the 2011 group was
Energy is released when hydrogen burns in air according to the equation
2H2 + O2 2H2O
Which of the following is responsible for the release of energy?
A. Breaking hydrogen bonds. B. Breaking oxygen bonds. C. Forming hydrogen-oxygen bonds.* D. Both (a) and (b) are responsible.

62
to assign responsibility for the energy release to breaking bonds in both the hydrogen molecules
and the oxygen molecules. The remaining students (21%) are split unevenly between assigning
responsibility to the breaking of oxygen bonds only (19%) or the breaking of hydrogen bonds
only (2%).
Table 5. Item Analysis of ABCC Question 9: Spring 2011 Post-test
Item Statistics Alternative Statistics Proportion Endorsing
Question Number
Proportion Correct
Point Biserial
Alt.
(* = Key) Total Low High Point
Biserial 9 0.44 0.03 1 (A) 0.02 0.03 0.03 +0.03 2 (B) 0.19 0.18 0.03 -0.06 3 (C)* 0.44 0.39 0.44 +0.03 4 (D) 0.35 0.39 0.36 -0.01 Other 0.00 0.00 0.00 ---
The fact that students who believe bond-breaking releases the energy would selectively
single out the breaking the oxygen bonds (Option B) or the hydrogen bonds (Option A) over both
bonds (Option D) had been noted with curiosity by this researcher in past administrations of the
ABCC. The reason for this answer pattern could be seen in students’ perception of how this
reaction proceeds. Some did not see that the hydrogen atoms must separate to form water, taking
their clues from the chemical formulas of both substances rather in image of the molecules
before and after the reaction. Others relied on verbal clues from the question for what was
burning rather than mentally tracking the reaction process. Examples of this second reason are
Megan and Chloe, who both assigned the responsibility for the energy release to hydrogen bonds
breaking (Option A) by noting that the prompt only stated that hydrogen was burning. As a
result, both students rejected any answers that included oxygen. Chloe explained her selection
by saying, “the statement doesn’t say ‘when hydrogen and oxygen are burned,’” even though the
reaction equation includes oxygen as part of the reaction. On the other hand, the five students
who selected Option B rationalized their answer with some form of the argument that the

63
hydrogen atoms don’t break apart since the reaction begins with H2 and H2 is still evident in the
water molecule (H2O).
It appears these students do not readily consider the spatial arrangement of atoms in a
water molecule as part of their thinking, even though they commonly drew the “Mickey Mouse
ears” picture of a water molecule with hydrogen atoms separately attached to the oxygen atom
all through their chemistry course. They had apparently adopted this image of the water
molecule from earlier instruction or other experience some time before taking high school
chemistry, but had not thought about what it was communicating very deeply. This researcher
has noted that for some students, the angled water molecule often is subtly morphed by a number
of students in class into a cluster of three atoms all touching each other. Based on the responses
to this question, that simple shift in representing a water molecule represents a lack of
understanding of molecular geometry and bonding. Tim explained that no hydrogen bonds are
being broken because “the hydrogen is being attached to by oxygen…O2 is going to O,” while
Rae explained her selection by saying, “It’s going to be B because hydrogen stays together,
while oxygen breaks apart.” This tendency to overlook bond-breaking in the hydrogen molecule
and assign the energy change solely to breaking the oxygen bond was also noted in the
interviews conducted by Mulford (1996) during his development of the CCI.
During the think-aloud interviews, students’ reasoning was not always grounded in
appropriate bonding principles even when they selected the correct option. Among the six
students who answered correctly in the think-aloud interviews, four of them correctly explained
that bonds require an energy input to break the atoms apart, and that forming a bond results in a
release of energy. The other two students decided that no bonds were being broken during the
reaction; bonds were only being formed as the hydrogen and oxygen came together to form

64
water. As a result, they rejected the answers that cited bond breaking, leaving Option C as the
only remaining answer. Even among the four who cited that bond breaking requires an input of
energy, two appeared to also only see the oxygen molecule being broken during the reaction. So,
of the six correct answers, only two students appeared to avoid both the common conceptual
pitfalls that were evident in many of the student’s reasoning.
Figure 7. Probability Curves of ABCC Question 9: Spring 2011 Post-test
The item analysis (Table 5) for Question 9 indicates that a correct answer for this
question is not strongly correlated with overall performance (point biserial = +0.03). In fact, all
of the point biserial values for the four answer options have relatively low absolute values. The
presence of nearly level probability curves (Figure 7) for both Options 3 and 4 (corresponding to
answer Options C and D) is also indicative of relatively poor discrimination between low- and
high-performing students in this question. During the think-aloud interviews, it was evident that
two key misconceptions are at play in the student reasoning: the direction of energy flow when
bonds are broken, and recognition of which bonds are being broken and formed. The number of
correct responses for the think-aloud test group on this question dropped from nine selecting

65
Option C during their spring 2011 end-of-course post-test to six selecting Option C for the fall
20111think-aloud administration of the test, a one-third loss. This speaks to the common-sense
appeal of the misconception that bonds store energy that is released when the bond is broken.
Ellen, a mid-performing student, explained, “I know there is energy stored in bonds, and when
you break bonds, energy is released,” (emphasis added) even though this idea was repeatedly
challenged in class. Jose, a high-performing student, also exhibited this line of reasoning when
he explained, “pushing two things together and forcing them to form together will require
energy, but breaking two things apart will have more energy released than is input.” Rae, a mid-
performing student, explained, “When bonding, you are not releasing energy, you are creating a
form of energy, uh, attraction.” In this last comment, the fairly common lack of distinction
between energy and force can be seen contributing to this misconception.
There were also three students in the test group who began their thinking for this question
by arguing for the need to add energy to break bonds, only to shift their reasoning part way
through the process to conclude that bonds release energy when broken. In a reverse scenario,
Henry and Will first explained that bonds release energy when broken, but self-corrected soon
after to select the correct answer. Both of these students were among the top scorers in the
delayed post-test. That even the students who performed well on the ABCC are actively
rejecting the bond-as-energy-container misconception while thinking about this question speaks
to the strong appeal of this misconception. Kind (2004, p. 66) offers the image of an egg
breaking and releasing its contents as a conceptual analogy to the way students envision energy
changes when a bond is broken.
It is also interesting to note, at the time of the delayed post-test, all of the test group was
concurrently taking biology where the language of high energy bonds is commonly used to

66
explain how molecules such as ATP participate in the transfer of energy within the cell. This
raises the question whether additional instruction may have influenced some of these students to
abandon their emerging concept of bonds as a low energy arrangement of atoms and revert to the
idea of the bond as a container of energy.
Questions 12/13
The concern found in this question pair is none of the explanation options in Question 13
support Options D or E for Question 12 in which mass increases. Options 13A, 13C, and 13E
are based on the misconception that confuses density and weight (or mass). Options 13A and
13C state very nearly the same idea, differing primarily in their specificity. Our everyday
experience with gases is that they are “light”. A balloon is easily batted around because the gas
12. A 1.0-gram sample of solid iodine is placed in a tube and the tube is sealed after all of the air is removed. The tube and the solid iodine together weigh 27.0 grams.
The tube is then heated until all of the iodine evaporates, filling the tube with iodine gas. After heating, the total weight will be:
A. less than 26.0 grams. B. 26.0 grams. C. 27.0 grams. D. 28.0 grams. E. more than 28.0 grams.
13. What is the reason for your answer to question 12?
A. A gas weighs less than a solid. B. Mass is conserved. C. Iodine gas is less dense than solid iodine. D. Gases rise. E. Iodine gas is lighter than air.

67
has little mass, but this observation is unrelated to the question of whether the mass remains the
same when the total amount of the solid becomes a gas. Option 13D is also related to common
experience, in this case of watching a released gas rise (as in steam) or diffuse into a larger
environment. This researcher has heard students argue that a perfume in the gas phase will rise
first before it will diffuse in other directions, changing directions because it bounces off the
ceiling. Option 13D does not logically lead as strongly to the conclusion that the gas will have
less mass. However, Options 13D, along with 13E, is very infrequently selected in our 2011
post-test data (2% and 1% respectively). See Table 6 for the item analysis results for these two
questions, and Figure 9 for a map of the relationships between Q12 and Q13 answer options.
The probability curves are offered in Figure 8 for reference.
Table 6. Item Analysis of ABCC Questions 12/13: Spring 2011 Post-test
Item Statistics Alternative Statistics
Proportion Endorsing
Question Number
Proportion Correct
Point Biserial
Alt.
(* = Key) Total Low High
Point Biserial
12 0.74 0.52 1 (A) .13 .32 .00 -.41 2 (B) .08 .20 .01 -.30 3 (C)* .74 .43 .94 +.52 4 (D) .04 .04 .05 -.01 5 (E) .00 .01 .00 -.09 Other 0.00 0.00 0.00 ---
13 0.79 0.51 1 (A) .11 .29 .00 -.41 2 (B)* .79 .50 .98 +.51 3 (C) .07 .16 .01 -.25 4 (D) .02 .02 .01 -.02 5 (E) .01 .04 .00 -.14 Other 0.00 0.00 0.00 ---

68
Figure 8. Probability Curves of ABCC Questions 12/13: Spring 2011 Post-test
Figure 9. Mapping of Question 12 onto Question 13

69
To remedy the lack of logical explanations for the system gaining mass, Question 12 was
posed to 102 high school students in several types of science courses at two public high schools.
The students were asked to explain their answers to Q12 in their own words. Of the 102 students
polled, 18% answered that mass would increase as iodine becomes a gas. The two most common
explanations for the increase in mass were wordings similar to 1) becoming a gas produces more
particles, and 2) the tube was heated. Other explanations were the gas/air fills the tube, the
iodine spreads out more, and more collisions between particles causes more weight. These
responses offer options to replace one or two of the existing choices so the few students who feel
the mass increases would have reasonable explanations available to them in Question 13.
Question 14
This question ostensibly assesses students’ understanding of the size of an atom. From
its earliest use in what would become the ABCC, student responses on this item have presented
statistical difficulty because of the high proportion of students who select the incorrect Option D.
As can be seen in Table 7 of the item analysis of this question from the spring 2011 data, there is
a moderately strong point biserial value for the correct answer with only 33% of the students
answering correctly, while Option D is selected by nearly two-thirds (61%) of students overall,
including 51% of the high-performing students. Option D clearly presents a compelling response
for most students, as is also seen in the probability curves in Figure 10.
What is the approximate number of carbon atoms it would take placed next to each other to make a line that would cross this dot:
A. less than 10 B. 1,000 C. 10,000,000 * D. 6 x 10²³

70
Table 7. Item Analysis of ABCC Question 14: Spring 2011 Post-test
Item Statistics Alternative Statistics Proportion Endorsing
Question Number
Proportion Correct
Point Biserial
Alt.
(* = Key) Total Low High Point
Biserial 14 0.33 0.19 1 (A) .00 .01 .00 -.05
2 (B) .06 .11 .03 -.14 3 (C)* .33 .30 .46 +.19 4 (D) .61 .59 .51 -.24 Other .00 .00 .00 ---
Figure 10. Probability Curves of ABCC Question 14: Spring 2011 Post-test
The explanations given by students in the test-group to Question 14 fell into seven
general explanations. Table 8 summarizes the tally for the number of students utilizing the most
common reasoning strategies. Students often appealed to more than one category in their
explanations, which is reflected in the totals. Responses of seven students from the test group
fell into two or three different reasoning categories.

71
Table 8. Frequency of Students’ Reasoning Responses for Question 14
Reasoning Category Frequency* 1. Atoms are extremely small, so there would an extremely high number 12 2. Option D is familiar 7 3. Attempts to “remember” the answer (successful or not) 2 4. Avogadro’s number has something to do with counting atoms 2 5. Recalls class experience related to the size of atoms 2 6. Recalls and uses known size of atoms (about 0.1 nm)* 1 7. One mole (Option D) is too much carbon for the size of the dot* 1 * Several students appealed to more than one category in their explanations
The two reasoning categories marked with an asterisk should be associated with the
strongest understanding of the size of the atom, especially in distinguishing between Options C
and D. In fact, Tim used Reason 7 to arrive at the correct answer, concluding that one mole of
carbon would have to be bigger than a small dot. However, the second student to answer
correctly, Gary, appealed to class experience. He recalled discussing the size of an atom early in
the year while the concept of the mole was not introduced until later. As a result, he rejected
Avogadro’s number as a possible answer without providing an explanation for why that number
of atoms could not fit across the dot. On the other hand, Jose (a high-performer) began with a
good estimate of the size of a carbon atom (Reason 6) and attempted to calculate how many
would fit across a 1 mm dot. Unfortunately, he used an incorrect conversion factor between
nanometers and millimeters, and so arrived at Option B as his answer. All remaining students in
the test-group selected Option D for this question.
As can be seen in Table 8, the top reason given by students for selecting Option D is that
atoms are extremely small, which is actually correct at a basic level. The students appear to
reason that because atoms are extremely small, it would require a very large number of them to
fit across even a small dot, leading 16 of the 19 test-group students to select the largest number
available. What was not heard in their comments was a practical appreciation for the scale of the

72
size of the atom or the number needed to have enough matter to produce a mass big enough see.
The students’ basic concept of atomic size is resulting in an incorrect response due to what seems
to be a lack of personal reference for the size of very large and very small numbers. This is
consistent with the experience of this researcher of watching students become uncomfortable
when the magnitude of numbers they were using strayed too far outside the range of about 0.01
to 1000. Brian Butterworth (1999) argues that human beings have a natural sense of numerosity,
or ‘number sense’, for quantities in typical counting ranges. He states, “Nature provides an inner
core of ability for categorizing small collections of objects in terms of their numerosities, which I
have called the Number Module. For more advanced skills, we need nurture: acquiring the
conceptual tools provided by the culture in which we live” (p. 97). The magnitude for atom
counts in this question far exceeds the range of our typical experience in counting, and even, it
seems, the nurtured sense of numerosity for many high school students based on the results for
Question 14 from the ABCC.
Without a personal concrete sense for the magnitude of atom counts in macroscopic
samples, students’ mental description of the size of atoms, which can be inferred from their
comments as the non-specific statement, “atoms are extremely small”, simply acknowledges the
tininess of atoms without actually comprehending their size. This appears to lead students to
select the largest number available, i.e., an extremely large value. Chloe, a middle-performing
student, explained her selection this way: “Atoms are THE smallest thing. My instinct is to
circle the last one; it is the biggest.” Owen simply stated, “I don’t know…I’m going for the
biggest number.” Maria expressed a similar thought, saying, “Oh, uh, carbon atoms are very
small, so…definitely not A or B…so, I think D.” When pressed for an explanation for her
selection, she simply stated, “I just thought D was the bigger number, so…yeah.” This reasoning

73
to the largest available answer was often reinforced by the familiarity of Avogadro’s number
given as Option 14D. Chloe went on to explain, “I think 1023 is somebody’s
number…Avogadro? It seems familiar. I remember doing a worksheet with atoms…how
many…how big atoms were…can’t say for sure…going to go with D.” Selection due to
familiarity was the second-most frequent reason evident in the students’ explanations, with seven
students commenting to this effect.
It is also telling that frequency of the correct answer within the test-group dropped from
six in the spring 2011 administration of the ABCC to two in the think-aloud administration in the
fall of 2011, evidently being replaced by Avogadro’s number. While the overall average score
for this group on the ABCC rose somewhat between the two post-test administrations (16.8 to
18.5), the frequency for the correct answer on Question 14 dropped by two-thirds, similar to the
drop in correct responses in Question 9. According to the reasoning heard in the think-aloud
interviews, both questions were heavily influenced by a common but poor conceptual
understanding. In Question 9, a noted common misconception leads students to answer
incorrectly 54% of the time in the Spring 2011 post-test administration of the ABCC. In
Question 14, a poor understanding of magnitude appears to significantly influence students’
answer selection, which may hamper a students’ ability to conceptualize atomic size, but does
not seem to significantly hinder students from grasping other critical concepts about matter since
this question does not correlate well to overall performance on the ABCC. It would also appear
the conceptual challenge associated with Questions 9 and 14 may reassert themselves in
students’ thinking after some time has passed since instruction, causing some who held the idea
well enough to answer correctly at the end of the course to be drawn again to the largest number
available.

74
Questions 20/21
The key idea in this question is that a saturated solution, with solid salt in equilibrium
with the aqueous salt, will not change concentration by removing solvent via simple evaporation.
As the water evaporates, the equilibrium is shifted toward the solid state, and the concentration
of the salt in solution remains constant.
The item analysis (see Table 9) and probability curves (see Figure 11) on the next two
pages for these paired questions, show at least one distractor in both questions is selected more
frequently than the correct answer, even among higher-performing students. The student
explanations offered during the think-aloud interviews revealed three general strands of
understanding. The most common was the concentration would increase as water was removed
20. Salt is added to water and the mixture is stirred until no more salt dissolves. Some solid salt does not dissolve and settles to the bottom of the beaker, as shown in the figure below. The water is allowed to evaporate until the volume of solution is half the original volume. (Assume the temperature remains constant.)
The concentration of salt in solution A. increases. B. decreases. C. stays the same.*
21. What is the reason for your answer to question 20?
A. There is the same amount of salt in less water. B. More solid salt forms on the bottom of the beaker. * C. Salt does not evaporate and is left in solution. D. The salt evaporates along with the water.

75
because the ratio of salt-to-water would have to increase with less water present. The second
most common response was to correctly identify this system as a saturated solution, recognizing
that as water was removed some salt would have to precipitate out of solution. The third line of
reasoning seemed to confuse the concept of concentration with the total amount of salt present in
the beaker.
Table 9. Item Analysis of ABCC Questions 20 and 21: Spring 2011 Post-test
Item Statistics Alternative Statistics
Proportion Endorsing
Question Number
Proportion Correct
Point Biserial
Alt.
(* = Key) Total Low High
Point Biserial
20 0.24 0.11 1 0.66 0.57 0.63 +0.04 2 0.10 0.20 0.07 -0.22 3* 0.24 0.23 0.30 +0.11 Other 0.00 0.00 0.00 ---
21 0.13 0.34 1 0.48 0.38 0.44 +0.03 2* 0.13 0.06 0.30 +0.34 3 0.33 0.40 0.24 -0.13 4 0.06 0.16 0.02 -0.28 Other 0.00 0.00 0.00 ---
The most commonly selected response to Question 20 was the concentration of the salt in
solution increases (Option A, 66% overall). The point biserial for this option is slightly positive,
as is the slope of the probability curve. It is the most-selected answer by students across all
performance levels on the ABCC, including high-performing students. The verbal explanations
for most students during the interview typically followed a simple ratio reasoning: if the amount
of water decreases by evaporation, but the amount of salt does not decrease, then the ratio of salt-
to-water would have to increase. It was clear that these students understood what concentration
of a solution means. However, they missed the significance of the undissolved salt on the
bottom of the beaker. The concept of saturation was not part of their reasoning. As Chloe
stated, “The salt in the bottom was in more water, now it is in less water…so there's no way it
stays the same ‘cause you're changing the water level...I think it is increases because...salt stayed

76
constant throughout.” Of the eleven test-group students who selected Option A for Question 20,
eight students selected Option A for Question 21 and three students selected C. Options 21A and
21C were almost exclusively paired with Option 20A. A few students seemed uncertain when
trying to select between Options 21A and 21B for their explanation. A couple of students
commented that Options 21A and 21C seemed similar, but selected 21A because is seemed more
specific in its language.
Figure 11. Probability Curves of ABCC Questions 20/21: Spring 2011 Post-test

77
Students who selected Option B for Question 20, on the other hand, did not appear to
have a clear concept of what concentration means. Rather, they focused on the amount of salt
present in the beaker. Maria expressed her thoughts as “the concentration of salt in
solution…hm… now there's less water, but does that mean there's less salt? Does the salt
evaporate? Hm...um, I don't think so (faltering) - or the salt probably does [evaporate], but it's
mainly water, so I think the concentration of salt still decreases a little bit.” It is evident that
Maria was not considering salt concentration to mean the ratio of salt to water. Her primary
concern was whether the amount of salt decreased, confusing this with the concentration of the
salt in solution. Naomi, who also selected Option B, gave a similar rationale. Both students
selected Option D for Question 21, which captured their idea that some of the salt was
evaporating with the water, which to them meant the quantity of salt present in the beaker would
go down slightly.
The item analysis for Question 20 shows that only about 25% of the students in the 2011
post-test administration answered correctly on this question. In the think-aloud test-group, six of
the students answered Question 20 correctly with five students following up with the appropriate
reason (Option B in Question 21). Rae, who answered Question 20 correctly, also selected
Option 21C (salt does not evaporate...). Her explanation, however, was a bit confused, and
seemed more consistent with the conceptual understanding of the two students who said the
concentration was increasing. Rae’s explanation indicated she was also considering the total
amount of salt present rather than the salt-to-water ratio. However, she did not believe that salt
was either added to the beaker or evaporated with the water, leading her to say the concentration
(amount) remained the same. The remaining five students who selected Option 20C used
language consistent with saturation in their explanations. Henry explained, "since the solid salt

78
forms at the bottom (circles solid salt), that means it can't dissolve anymore salt?... If the water
evaporates, the salt that went with it would settle to the bottom, too.” Jose said, “the
concentration of the salt in solution actually stays the same because, before the water was
allowed to evaporate, there was already solid salt at the bottom so it was already...um... I forget
the word for it, but um...the solution is full of salt and it can take no more…the concentration
will stay the same, uh, full of salt (laughs).” Interestingly, none of the students in the test-group
who answered correctly on both questions directly referenced the concept of equilibrium in their
discussion.
The response patterns seen in the item analysis appear to reveal three levels of
understanding to this scenario. Those who understand the concept of a saturated solution can
reason accurately to the correct answers in both questions. Those who understand the concept of
concentration, but probably not that of saturation, will view the concentration as increasing and
consistently select Options A or C for Question 21 as explanation. The third, and smallest group
appears to lack a clear idea of concentration and, instead, analyzes the situation from the
perspective of the amount of salt in the beaker. The less desirable item response statistics appear
to be directly associated with problems of student understanding of the concepts rather than test
construction.

79
Questions 23/24 and 25/26
An electric heater, which provides a constant rate of heat output, heats a mixture of ice and water from 0ºC to 5ºC (32°F - 41°F) in five minutes.
23. Choose the graph which best describes the change in temperature of the water (T) as a function of time (t), neglecting any heat loss to the environment:
A. The temperature stays constant for a while, then rises (A)
B. The temperature rises more slowly at first, then faster (B)
C. The temperature rises more rapidly at first, then slower (C)
D. The temperature rises at a constant rate (D)
A small block of solid aluminum is taken out of the freezer and heated by an electric heater, which provides a constant rate of heat output, from -5°C to 5°C (23°F - 41°F). 25. Choose the graph which best describes the change in the average temperature of the
aluminum (T) as a function of time (t), neglecting any heat loss to the environment:
A. The temperature stays constant for a while, then rises (A)
B. The temperature rises more slowly at first, then faster (B)
C. The temperature rises more rapidly at first, then slower (C)
D. The temperature rises at a constant rate (D)
24. What is the reason for your answer to question 23?
A. It is hard to warm up something cold; it becomes easier to heat as it warms up.
B. At first, the energy supplied goes into overcoming attractive forces in the solid.
C. Very cold things absorb heat more quickly.
D. The heat output increases the thermal energy of the system at a constant rate.
E. The motion of water molecules in ice is restricted.

80
These two sets of paired question probe the relationship between energy input and
temperature for systems undergoing phase change (Q23/24) and those that only undergo
temperature change (Q25/26). The concept statements for these two pairs (see Figure B4)
received an average rating from the reviewers of 4.7 for concept 23/24R (energy added to a
substance undergoing a phase change increases the potential energy of the particles; the thermal
motion of the particles remains relatively constant) and 4.8 for concept S (energy added to a
substance not undergoing a phase change increases the thermal motion of the particles; this is
seen as an increase in temperature.) As can be seen in the item analysis (see Tables 10 and 11)
and the probability curves (Figures 12 and 13), these four questions are statistically well-
functioning with strong positive point biserial values for the correct items ranging from .44 to
.50. The incorrect options all have negative point biserial values with the proportion endorsing
from the high-performing group ranging from .01 to .08 for all but two distractors in Q23 and
Q24. These two distractors (Option D in both questions) describe a system going through a
steady temperature increase. The proportion endorsing Option D in Q23 and in Q24 by high-
performing students is .14 and .15 respectively. While this is not a high percentage, as was seen
for distractors for items such as Q9 or Q14, this pair reveals that even among the high-
performing students a lingering misconception is held by a portion of the students.
26. What is the reason for your answer to question 25?
A. It is hard to warm up something cold; it becomes easier to heat as it warms up.
B. At first, the energy supplied goes into overcoming attractive forces in the solid.
C. Very cold things absorb heat more quickly.
D. The heat output increases the thermal energy of the system at a constant rate.
E. The motion of the aluminum particles in the solid is restricted.

81
Table 10. Item Analysis of ABCC Questions 23 and 24: Spring 2011 Post-test
Item Statistics Alternative Statistics Proportion Endorsing
Question Number
Proportion Correct
Point Biserial
Alt.
(* = Key) Total Low High Point
Biserial 23 .46 .44 1 (A)* .46 .22 .77 +.44
2 (B) .23 .38 .07 -.29 3(C) .08 .12 .02 -.15 4 (D) .23 .28 .14 -.13 Other .00 .00 .00 ---
24 .48 .48 1 (A) .18 .35 .02 -.36 2 (B)* .48 .21 .80 +.48 3 (C) .05 .07 .02 -.09 4 (D) .26 .33 .15 -.17 5 (E) .03 .04 .01 -.05 Other .00 .00 .00 ---
Figure 12. Probability Curves of ABCC Questions 23/24: Spring 2011 Post-test

82
Table 11. Item Analysis of ABCC Questions 25 and 26: Spring 2011 Post-test
Item Statistics Alternative Statistics Proportion Endorsing
Question Number
Proportion Correct
Point Biserial
Alt.
(* = Key) Total Low High Point
Biserial 25 0.49 0.50 1 (A) 0.20 0.32 0.08 -0.24
2 (B) 0.22 0.32 0.05 -0.26 3 (C) 0.08 0.13 0.04 -0.17 4 (D)* 0.49 0.23 0.84 +0.50 Other 0.00 0.00 0.00 ---
26 0.51 0.50 1 (A) 0.18 0.32 0.04 -0.27 2 (B) 0.21 0.31 0.08 -0.25 3 (C) 0.06 0.09 0.03 -0.13 4 (D)* 0.51 0.25 0.85 +0.50 5 (E) 0.05 0.04 0.01 -0.06 Other 0.00 0.00 0.00 ---
Figure 13. Probability Curves of ABCC Questions 25/26: Spring 2011 Post-test

83
In paired test questions that seek both the students’ answer and reason in each question
pair, knowing how many right answers are given for each question does not adequately describe
how well the students are performing on the question pair. The quality of a students
understanding is better seen by seeing which answer options were paired together for that
question set. The test group’s responses were analyzed to see what patterns exist in the answer
pairs they selected. Table 12 shows the frequency of the various answer pairs given by the test
group for Q23/24 and Q25/26. The correct answer pair is bold and highlighted in red, while
incorrect pairs are highlighted in gray. Answer pairs that are logically inconsistent (excluding
those consistent with the logic of common misconceptions) are marked with an asterisk.
Table 12. Frequency of answer-pair selection for Q23/24 and Q25/26 in test-group
Answer Options for Q23
Answer Options for Q25
23A 23B 23C 23D 25A 25B 25C 25D 24A 1 2 1* 0* 26A 2 4 0* 0* 24B 9 1 0* 0* 26B 0 1 0* 0* 24C 0* 0* 0 0* 26C 0* 0* 1 0* 24D 0* 0* 0* 5 26D 0* 0* 0* 11 24E 0* 0* 0* 0* 26E 0* 0* 0* 0*
* Logically inconsistent pairing
As can be seen in Table 12, there are a limited number of answer pairs students select,
with most falling in the same regions in both question pairs: some combination of graphs A or B
with explanation A or B, or graph D combined with explanation D. These combinations
represent logically consistent combinations (even if based on a misconception). Only one
student selected a logically inconsistent pairing in Q23/24. No logically inconsistent pairings
were found in the test-group answer selections for Q25/26. This pattern of responses suggests
84
that this group of students was operating from one or more identifiable underlying beliefs with
an internal logic rather than simply guessing. This underlying logic was heard in the students’
explanations, as well.
Table 12 also reveals that the students tended to either pair Options A and B in Q23 or
Q25 with Options A and B in Q24 or Q26. These options represent a changing rate of
temperature rise, with little or no initial temperature change. The other common combination is
Option D in Q23 or Q25 in combination with Option D in Q24 or Q26. These represent a
constant increase in temperature with added energy. In Q23/24, nine students answered
correctly, while another four answered with a conceptually similar pairing of Options A and B.
What seemed to separate those who from those who answered with the similar, but incorrect
pairings of Options A and B was how clearly they seemed able to articulate the effect of phase
change on temperature change. Five students selected the pairing representing constant
temperature change (a misconception for this question). The pattern is reversed in Q25/26. As
can be seen in the pairings for these two questions, 11 students selected the constant temperature
rate pairing (correct for these questions). Seven of the remaining eight students picked a
combination of Options A and B in each questions, but did not associate the flat or low slope of
the graph with phase change. Instead, they tended to associate it with the idea that cold things
warm more slowly. Only one student selected Option C for both questions. The students’
reasoning for this is discussed below.
In the think-aloud test group, nine of the 19 test-group students answered correctly, with
another five students choosing Option D for both Q23 and Q24. The reasons given for Option D
during the interviews included various statements to the effect that the energy being added would
directly affect the temperature. Naomi explained “there is a heat output, so I think the release of

85
energy from the heat, I think it would (pause) immediately impact the temperature of the water”.
In Brandy’s explanation, she defends her selection of Option D in both questions by saying
“because of the fact that if it is constant, the electric heater releases a constant rate of heat output,
the temperature of the water must have a constant increase of heat each time, each minute.” The
confusion of energy (or heat) and temperature is evident in her word selection. She states that
the temperature of the water must have a constant increase of heat and then selects the graph
indicating a constant increase in temperature. Owen and Tim both calculated an average rate of
temperature change of 1°C/minute from the information in the prompt, and assumed the system
changed as a constant rate that matched their calculated value. Neither of these two students
mentioned the phase change from ice to liquid water in their discussion.
It was also noticed in the interviews that some students had difficulty selecting between
the first two graphs in Q23. Both Options A and B have a steady rise in temperature after a
period of little or no temperature change. Both options were selected by students who explained
that the ice would need to use the energy initially for melting, with the temperature rising
significantly only after the ice had melted. One student rejected Option 23A because the
temperature plateau at the beginning was interpreted to mean nothing was happening. Two
students described the beginning sections of Options A and B in Q23, which have a low or zero
slope, as region in the graph where the ice was using the energy to “break bonds” between the
molecules, indicating a lack of distinction in at least their terminology between bonds and
intermolecular forces. Option A for Q24 (“it is hard to warm up something cold…”), which is
the most-probable answer selected by low-performing students, offers a possible explanation for
both Options 23A or 23B. Three of the test-group students selected Option 24A to either of the
first two graphs in Q23.

86
While a constant rate of temperature change is the most-often selected wrong answer in
Q23/24 where phase is changing, some combination of graphs A and B in Q25, which are
associated with a period of little or no temperature change followed by a steeper temperature
increase, are most commonly explained using Options B in Q26 (it is hard to warm up something
cold…). Two of the five students who believed the ice-water mixture in Q23 would have a
constant temperature change also said that a block of solid aluminum would not warm at a
constant rate, with the remaining three students also saying both systems would change at a
constant temperature rate. Another five students consistently believed the temperature would not
change steadily in either scenario. Interestingly, four of these five students cited a belief that
cold things are harder to warm than warmer things, rather than needing to overcome attractive
forces in a solid (associated with phase change).
Even when students answered correctly for Q23/24, they did not necessarily answer
Q25/26 correctly. Of the nine who were correct for Q23/24, seven also answered Q25/26
correctly. One of the nine who answered Q23/24 correctly selected Option C for both Q25 and
Q26 (rate of temperature change decreases with time). Her explanation was that the temperature
would rise steadily at first but would begin to level off as it got closer to the heater’s
temperature. She evidently understood the intended concept, including that of thermal
equilibrium, but overlooked the detail that the final temperature in the question was rather low
for the temperature of an electric heater, making it highly unlikely that the temperature would
begin to level off during the time period of the question. Additionally, there were four students
who answered Q25/26 correctly who did not answer Q23/24 correctly. Three of these students
said both the water and the aluminum were undergoing a steady temperature increase, selecting
Option D in both question pairs.

87
In summary, some common misconceptions students hold about energy and temperature
are evident in the answer patterns between these two questions. These misconceptions appear to
include confusing temperature with energy, and the belief that added energy (or ‘heat’) always
changes the temperature, which may be influenced by the difference in the common use of the
word heat as a term that references temperature versus the scientific use as a term for transferred
energy. Additionally, a portion of the students appear to hold the belief that temperature doesn’t
change as easily in cold things as it does in hot things, producing non-constant heating curves.
The mental models students have for energy also do not appear to adequately distinguish
between an energy change in the system that produces a phase change, and one that produces a
change in temperature.
Questions 27/28
A copper cup containing 100 mL of hydrochloric acid, HCl (aq), is placed in a styrofoam cup containing 200 mL of water (see diagram). Both containers are initially at 20ºC. Copper is a good conductor of heat, whereas styrofoam conducts heat poorly. When baking soda (NaHCO3) is added to the HCl solution in the copper cup, the solution bubbles vigorously, and by the end of the reaction, the temperature of the solution drops to 10ºC. 27. What is the temperature of the water in the styrofoam cup several minutes
after the reaction is completed?
A. Twater < 20ºC .
B. Twater = 20ºC .
C. Twater > 20ºC .

88
The prompt for Question 27 is one of the longest and most complex prompts on the
ABCC. The scenario involves an endothermic reaction, but asks students to evaluate
temperature changes due to the system-surroundings interaction after the reaction rather than to
examine the reaction itself, and then, in Q28, asks for the reason for their answer to Q27. The
answer options to Q28 are also among the longest and most complex found on the ABCC. The
review of the four concept statements offered for Q27/28 were rated lower than the overall
average rating of 4.4, and included the lowest rated concept statement (W) from the
questionnaire. Among the panel of reviewers there is not strong agreement about what this
question pair is assessing at least in terms of the concept statements offered in the questionnaire.
Each concept statement had at least one reviewer give it a 1 or 2 while others gave these
statements ratings of 4 or 5. Concept W (Endothermic reactions can occur without an input of
energy from the surroundings) had a pronounced disagreement among the reviewers. It was
given a rating of 1 by three of the reviewers and a rating of 5 by the other two. One of the
reviewers who rated all four concept statements for Q27/28 low felt that, though this is an
endothermic reaction, the question is really assessing thermal transfer. A second reviewer felt
Concept W was not assessed because it would have to be inferred from a null response for
28. What is the reason for your answer to question 27?
A. A decrease in temperature in one place is compensated by an increase in another place.
B. Chemical energy is converted into thermal energy during the reaction.
C. In order for the chemical reaction to take place, energy must be transferred from the water in the styrofoam cup to the solution in the copper cup.
D. In a heat-releasing reaction, the system gives off energy to the surroundings and the temperature of the system decreases.
E. The solution in the copper cup cools during the reaction, causing energy to flow from the outside water through the copper.

89
Option C. Yet two others (one college instructor and one high school teacher) gave this concept
statement a rating of 5 as well as a 4 or 5 to the other three concepts associated with Q27/28.
The author of the question pair (Ashkenazi) gave Concepts T, V, and W a rating of 5, and
Concept U a rating of 4 indicating the statements capture fairly well the intent of the author in
writing this question. In fact, four different concept statements were created because the question
appeared to this researcher to probe several facets related to the reaction and temperature change
that made a single statement difficult. Further discussion would be needed to better understand
the reasons behind the rating discrepancy since only two commented on the reasons for their
ratings.
Table 13. Item Analysis of ABCC Questions 27 and 28: Spring 2011 Post-test
Item Statistics Alternative Statistics Proportion Endorsing
Question Number
Proportion Correct
Point Biserial
Alt.
(* = Key) Total Low High Point
Biserial 27 0.56 0.22 1 (A)* 0.56 0.46 0.67 +0.22
2 (B) 0.09 0.12 0.01 -0.16 3 (C) 0.31 0.37 0.31 -0.11 4 (D)** 0.00 0.01 0.00 -0.06 Other 0.03 0.00 0.00 ---
28 0.28 0.29 1 (A) 0.12 0.15 0.09 -0.07 2 (B) 0.09 0.11 0.05 -0.09 3 (C) 0.10 0.14 0.09 -0.09 4 (D) 0.38 0.44 0.23 -0.19 5 (E)* 0.28 0.13 0.54 +0.39 Other 0.03 0.00 0.00 -0.07
** Option D was selected by a few, but is not an answer option in Q27 – miss-marked?
The item analysis for the results for the spring 2011 post-test data in Table 13 show a
discrepancy between the total proportion correct for Q27 (.56) and the proportion correct for the
explanation in Q28 (.28). Evidently, students are twice as likely to interpret the temperature
change correctly as they are to offer the correct explanation for that change. Not only Q27 have
a higher proportion endorsing the correct answer, the discrimination between the low- and high-
performing students was relatively small (.10). The low-performing students had a proportion

90
endorsing of .46, while the proportion of high performing students was .56. This is also evident
in the probability curves for these questions (see Figure 14).
Figure14. Probability Curves of ABCC Questions 27/28: Spring 2011 Post-test
On the probability curve for Q27, Option A (line 1) has a probability significantly above
zero at -3.0 logits indicating a significant number of low-performing students can be expected to
get this question correct. By contrast, the probability curve for the correct Option E in Q28 (line
5) and the ICC are both skewed to the left indicating that why the temperature of the water
decreased is not well understood by many students.
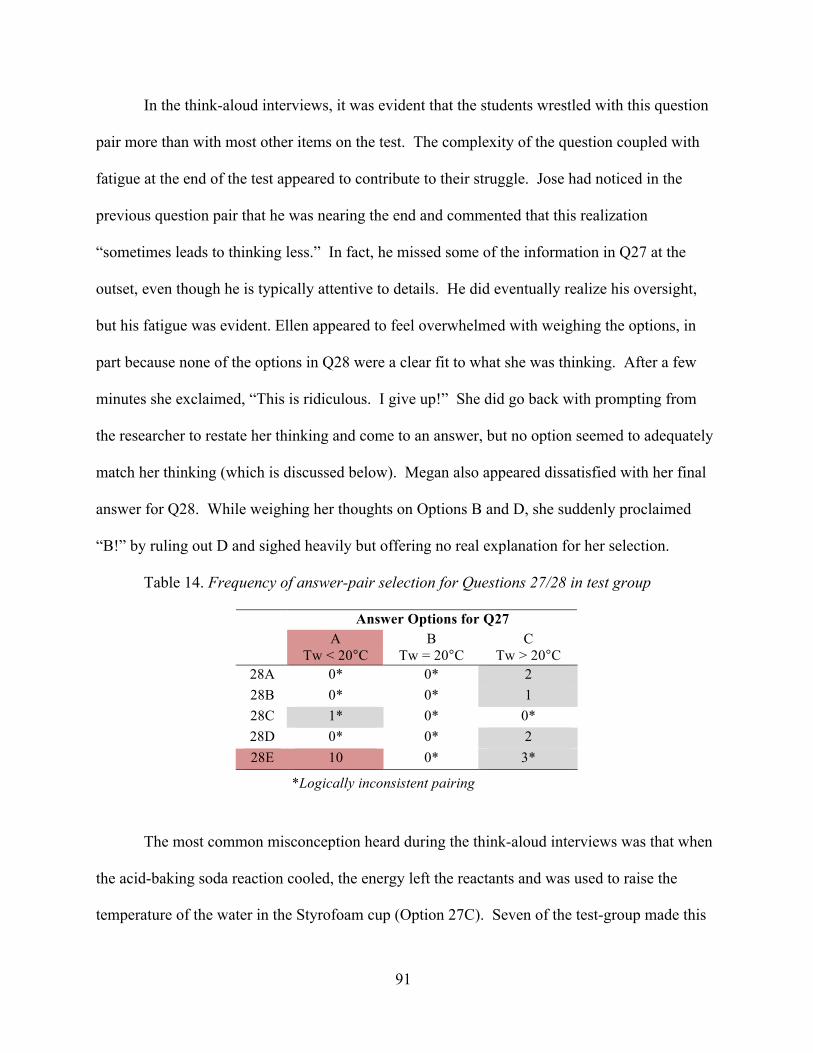
91
In the think-aloud interviews, it was evident that the students wrestled with this question
pair more than with most other items on the test. The complexity of the question coupled with
fatigue at the end of the test appeared to contribute to their struggle. Jose had noticed in the
previous question pair that he was nearing the end and commented that this realization
“sometimes leads to thinking less.” In fact, he missed some of the information in Q27 at the
outset, even though he is typically attentive to details. He did eventually realize his oversight,
but his fatigue was evident. Ellen appeared to feel overwhelmed with weighing the options, in
part because none of the options in Q28 were a clear fit to what she was thinking. After a few
minutes she exclaimed, “This is ridiculous. I give up!” She did go back with prompting from
the researcher to restate her thinking and come to an answer, but no option seemed to adequately
match her thinking (which is discussed below). Megan also appeared dissatisfied with her final
answer for Q28. While weighing her thoughts on Options B and D, she suddenly proclaimed
“B!” by ruling out D and sighed heavily but offering no real explanation for her selection.
Table 14. Frequency of answer-pair selection for Questions 27/28 in test group
Answer Options for Q27 A
Tw < 20°C B
Tw = 20°C C
Tw > 20°C 28A 0* 0* 2 28B 0* 0* 1 28C 1* 0* 0* 28D 0* 0* 2 28E 10 0* 3*
*Logically inconsistent pairing
The most common misconception heard during the think-aloud interviews was that when
the acid-baking soda reaction cooled, the energy left the reactants and was used to raise the
temperature of the water in the Styrofoam cup (Option 27C). Seven of the test-group made this

92
error. However, the explanation for this answer in Q28 varied considerably. Table 14 below
summarizes the frequency of each answer pair selected by the test group for Q27/28. As in
Table 12 for Q23/24 and Q25/26, the correct answer pair is bolded and highlighted in red, while
the incorrect answer pairs selected are highlighted in gray. Logically inconsistent pairings are
marked with an asterisk. According to this data, 11 students answered Q27 correctly, and 13
answered Q28 correctly. However, one must look at the answer pairing used to know how many
are likely to be grasping the concept reasonably well. It can be seen in Table 14 that only 10 of
the students who had answered Q27 or Q28 correctly (11 and 13 students, respectively) had
selected the correct answer to both questions.
The rationale for six of the seven students selecting Option 27C was that they believed
the reactants would cool only by giving some of their energy to the water. However, they did not
all have the same reasons for their answers. Gary and Tim both selected Option 28A for their
explanation. Gary began his explanation with the assumption that energy was leaving the
reaction mixture and moving to the water. All subsequent comments were built on that idea.
Tim was very unsure how to answer Q27, and decided to find a satisfactory explanation in Q28
that he could then match to an answer in Q27. As he addressed the options for Q28, it became
clear that he believed the temperature drop in the copper cup would be due to a loss of energy
from that solution to the surroundings. For example, Tim explained his rejection of Option 28E
by saying, “it would be saying that the water would be giving energy to the HCl solution, but the
HCl solution was given to say it dropped degrees, so it would be losing energy, not gaining. So
that would be A.” He also seemed to have overlooked Option 28D, which would have been a
good match to his verbal explanation.

93
Megan was the one student to explain a rise in the temperature of the water with Option
28B (conversion of chemical to thermal energy). She had narrowed her choices to Options B
and D and rejected D by saying, “To me that’s not right. I’m not talking about the system” and
then announcing “B!” for Q28 without further explanation. As pointed out earlier, her
explanation did not appear to be based in conviction, and may have come to a point of guessing.
The students selecting Option 28D to explain an increase in the temperature of the water
assumed the system (HCl solution) released heat from the outset. Rae explained she knew the
energy flowed outward because the reaction mixture got hot. She explained, “I came up with the
heating up because of the 'bubbles vigorously', and ‘bubbles vigorously’ reminds me of boiling
water...vigorously shows the energy (words unclear) molecules constantly colliding into each
other.” She selected Option 28D because it contained the phrase “heat releasing” without
commenting on the rest of the sentence. Carlos selected this same answer pair because the
reactant mixture “has to release energy, so I would guess the water would increase…this one
(points to reactant mixture in the diagram) drops to 10°C, so the energy must have gone
outward.”
The surprising answer pair for Q27/28 was the use of Option 28E to explain a rise in the
temperature of the water, which is logically inconsistent. Two of the students who selected this
pair are lower performing students (Kelly and Ellen) who appeared to be confused by the
wording in the prompt and the options for Q28. Kelly was vague about the reason for her choice
in Q28. When she read Option 28B, she exclaimed, “This has something to do with chemical
energy? I thought this was about thermal energy!” She also seemed unsure how to handle the
conductivity information for the Styrofoam and copper. Ellen was the one who had wanted to
quit on this question because none of the options for Q28 seemed to fit her thinking. Her reason

94
for her ambivalence and ultimately selecting Option 27C did not come out not until the end of a
lengthy discussion. Eventually, it became evident that she believed the reactant mixture gave
energy to the water causing the water to be warmer than 20°C and the reactant mixture to be
cooler than 20°C by the same temperature difference. As a result, she reasoned that the two
solutions should eventually come to thermal equilibrium and return to 20°C. She expressed
uncertainty because the question did not explicitly state how long after the reaction she was
supposed to describe the temperature of the water. By her reasoning, Q27 could have been
answered by either Option B or Option C, depending on whether thermal equilibrium had been
reestablished. She believed energy would first flow from the reaction mixture to the water and
then back again, which made it hard for her to decide between distractors that indicated direction
of energy flow. She selected Option 28E to go with Option 27C because 28E said the energy
would flow from the water through the copper, which she believed would happen after the initial
reaction had warmed the water.
The third student, Nick, to select this answer pair (Option 27C and Option 28E) offered
an accurate argument for the temperature of the water decreasing. Nick is one of the high-
performing students, and explained that “the water would be less than 20°C because the solution
which was an endothermic reaction, the energy would be transferred, would try to reach
equilibrium…[reading 28E] ‘the solution in the copper cup cools during the reaction’ causing the
copper cup to cool, which then the energy from the water flows through the copper.” Yet, Nick
selected Option 27C (temperature would rise) when his explanation clearly said he thought the
water would cool. It appears that Nick confused the symbol “>” in the answer option “Twater >
20ºC” to mean the temperature dropped.

95
The students in the think-aloud interviews performed better on the delayed post-test for
this question pair in the Fall 2011 than they had in the end-of-course post-test in the Spring 2011:
five students answered Q27/28 correctly on the spring post-test and ten answered correctly in the
fall administration. In all three of the final energy question pairs (Q23/24, Q25/26, and Q27/28)
the number of students getting these question correct about doubled. This raises the question of
whether the concept of energy in these three contexts, which is challenging for most students,
continued to develop for these students after instruction had ended. This is in contrast to the
results of Question 9, also based on the energy concept, in which the Fall 2011 responses showed
several students had reverted to the common misconception of bonds as containers of energy by
the fall administration of the test.
This question pair is challenging in its content and in the complexity of the question
prompt (Q27) and answer options (Q28). Being placed at the end of the test means students will
also be experiencing some mental fatigue by this point. The students’ verbal explanations tended
to be more vague than in most of the previous questions. Still, there was one primary
misconception that was evident in a number of the students’ thinking: they believed the reaction
mixture cooled by releasing energy to the water in the Styrofoam cup and subsequently warming
the water. The transfer of thermal energy to chemical energy did not appear to be considered by
the majority of the students. The misconception evident in this question pair appears to be very
similar to the idea seen in Q23/24 and Q25/26 that energy transfer is always directly related to
temperature change. None of the students in the test group felt the temperature would remain
constant. Ellen was the only student who seriously considered Option 27B (Tw = 20°C),
because she believed the reaction mixture and the water would make equal and opposite changes

96
in temperature during the reaction, and eventually come to thermal equilibrium by returning to
20°C.
Conclusion
The purpose of this study is to address what think-aloud interview data, concept analysis,
and item analysis of student responses reveal about the validity and reliability of the current form
of the ABCC. The item analysis of student post-test data in 2010 and 2011 indicate the internal
reliability of the ABCC, as measured by the coefficient alpha (.750 and .798, respectively) is
sufficient for distinguishing between groups. This satisfies the intended use of the ABCC in
assessing student learning between various populations. Prior to this study, the questions of the
ABCC had been reviewed for some of the guidelines for good question writing cited by
Engelhardt (2009, p.11). Specifically, questions had been reviewed and edited to keep answer
options to similar lengths within a given question, and to be sure prompts were clear and direct.
During this study, questions were evaluated for other items cited by Engelhardt, such as checking
to be sure all answer options were plausible, especially in the paired questions. Question 13 was
found to be missing plausible responses as explanations to Options D and E in Q12, which is
summarized in a later paragraph.
Based on the item analysis of the Spring 2011 post-test administration of the ABCC to
high school chemistry students (N=368), the majority of the test items exhibit statistical
measures consistent with well-functioning questions. The internal consistency reliability
estimate (coefficient alpha, see Table 1) for both data sets is 0.750 and 0.798 for Spring 2010 and
2011, respectively, which sufficiently meet the guidelines for multiple choice tests being used to
measure group characteristics (Engelhardt, 2009, p.24), which is in line with the intended
purpose of the ABCC. Seven questions or question pairs were identified for study in this project.

97
Questions 9, 14, and 20/21 were selected because they appeared to be less well-functioning
based on statistical measures from the item analysis results (Figure 4). The skewed statistics for
Questions 9 and 20/21 could be traced to identifiable misconceptions or inadequate
understanding about bonding (Q9) and saturated solutions (Q20/21) that are affecting the
outcomes for these questions. In Q9 two common misconceptions were identified in the
students’ reasoning during the think-aloud interviews: a) bonding stores (increases) energy, or
the bond-as-energy-container concept, and b) the hydrogen-hydrogen bond does not break during
the formation of water. This first misconception appears to stem from a poor concept of energy
and bonding, including confusion of the ideas of energy and force. The second seems to arise, in
part, from the similarity in the symbolic representations of the hydrogen and water molecules (H2
and H2O) coupled with an apparent poor understanding of bonding and geometry. In Questions
20/21, students appear to have an inadequate concept of a saturated solution and the equilibrium
condition associated with it, entirely missing the cues to that effect in the prompt. Those who
did recognize the saturated condition of the solution appeared to view the solution as having
reached holding capacity rather than invoking a shift in the equilibrium condition. Because the
competing misconceptions used by the students are tied to the target concept of Q9 and Q20/21,
these questions do appear to distinguish how well the target concept for each question is
functioning in the students’ thinking.
In contrast, the underlying issue in student reasoning for Question 14 appears to be
students’ struggle to conceptualize the very large and small numbers associated with atomic
counts and size rather than a competing misconception about atomic size. The students had
internalized a correct understanding as far as they seemed to have the conceptual capacity
regarding atomic size, but did not have a concrete grasp of the magnitude involved. As a result,

98
their imprecise concept of atomic size (“atoms are extremely small”) was translated into an
equally imprecise concept of the numbers of atoms in an object (“there are an extremely large
number of atoms in things I can see”). The presence of Avogadro’s number in the distractors
served to distract students based on familiarity of this number from their studies or on being the
largest available number. It also served to inform students who did have a properly developed
conceptual understanding of 6.02 x 10²³ to recognize this was too large a value for the number of
atoms in a small dot. Because a very high proportion of high schoolers appear to be influenced
by a poor understanding of magnitude, Question 14 may not shed significant light on students’
understanding of atomic size as suggested by the overt content of the question. Instead, it may
be functioning as an indicator of how developed students’ sense of magnitude is coupled with
understanding the practical implications of Avogadro’s number of atoms. In addition, the review
of the two concepts paired with this question (14I and 14J) produced ratings (4.0 and 3.5,
respectively) that were lower than the overall average of the ratings (4.4) on the concept
questionnaire.
Question pair 12/13 was selected for analysis, not because of poor statistical
performance, but because the answer options in Q12 do not map completely onto the explanation
options in Q13. Conspicuously missing were explanations that would logically lead to a gain in
mass of the tube of iodine while four of the options in Q13 map to an apparent loss of weight.
Options C, D, and E are less frequently selected in the Spring 2011 post-test item analysis (7%,
2%, and 1%, respectively), and would be logical choices for possible removal in order to insert
one or two of the new options. In response to this finding, additional data was collected by
giving Question 12 coupled with an open-ended version of Question 13 to 102 high school
science students to find explanations students gave when they expect a gain in mass for Q12 .

99
These students came from high school physical science, biology, chemistry (regular and honors),
and honors anatomy/physiology to provide a variety of student backgrounds. The data was
compiled by teachers at the school site where the question was given and forwarded to the
researcher as a summary with no student information other than the title of the course associated
with the response summary.
The two most frequent explanations offered by those students who said the tube and solid
iodine would gain in mass after the iodine became a gas were 1) evaporating produces more
particles, and 2) heating increases mass, which might serve as replacements for the two options
in Q13 that very few students choose. Unfortunately, the think-aloud results for these two
questions was not helpful in understanding student reasoning for the incorrect options because
the test group scored perfectly for Q12/13 during the Fall 2011 interviews.
For two of the final three energy question pairs (Q23/24 and Q25/26), approximately half
the students answered correctly, ranging from a proportion correct of 0.46 to .51 in the Spring
2011 post-test item analysis, compared to an average proportion correct in this administration of
the ABCC of .55. This would indicate that these questions are somewhat harder than average for
this assessment. Still, the questions are a bit better than average in discriminating between low-
and high-performing students with point-biserial values ranging from .44 to .50 (overall average
point-biserial was 0.40.) The think-aloud test group revealed common misconceptions were at
play in the students’ reasoning. These misconceptions appear to include confusing temperature
with energy, and the belief that added energy (or ‘heat’) always changes the temperature, which
may be influenced by the difference in the common use of the word heat as a term that
references temperature versus the scientific use as a term for transferred energy. Additionally, a
portion of the students appear to hold the belief that temperature doesn’t change as easily in cold

100
things as it does in hot things, producing non-constant heating curves. There was some evidence
in the think-aloud explanations that suggested students might be influenced by their everyday
experience with cold objects. It may be that very cold things are simply perceived as cold with
little differentiation as to how cold, until it can change classification to being warm. Similarly,
warming water may be perceived as not warming quickly until there is noticeable evidence of
being hot such as steam forming. It would be interesting to pursue this line of thinking more
carefully with students. The mental model students have for energy also does not appear to
adequately distinguish between energy change that produces a phase change and energy change
that produces temperature change within a system.
In the final question pair (Q27/28), the statistical measures for the two questions are
significantly different. This is evident in the graph of statistical measures for each question on
the ABCC (see Figure 4) as the lines for the proportion correct and the point-biserial cross each
other between these two questions. Question 27 has an average difficulty for the ABCC but a
fairly low discrimination between low- and high-performing students. Question 28 is difficult
with about half the proportion correct as Q27, but is about average in its ability to distinguish
low- and high-performing students. The common misconceptions involved seem to have more
effect on selecting an explanation in Q28, than in identifying what will happen to the temperature
of the water in Q27. The students appear to have a stronger intuitive sense for the situation
because of common experience with cold objects causing other objects to get colder than they
have theoretical foundations for understanding and explaining that change, especially when an
endothermic chemical reaction is involved.
The most common misconception heard in the think-aloud interviews for this question
pair was that the drop in temperature is the result of energy leaving the reaction mixture. This is

101
consistent with the idea that energy change is always directly related to temperature change
observed in Q23/24 and Q25/26. A lack of discrimination between temperature and energy
appears to be at the root of students’ misconceptions in all three questions. Students visibly
struggled with answering this question pair, especially in selecting the explanations in Q28. The
prompt to Q27 and the answer options to Q28 are among the longest on the ABCC, adding to the
challenge students’ often have with the concept of energy. The language of the answer options
in Q28 appeared to be a problem for several of the students in the test group. For instance, the
word “compensated” in Option 28A bothered a couple of the students, while in Option 28C the
fact that the distractor was indicating energy must first be transferred before the reaction can take
place often seemed misunderstood. One student who had adequately explained why the water
temperature dropped selected Option C as his explanation. Apparently he focused on the
direction of energy flow and missed the causal sequence indicated in the sentence. Additionally,
a student who’s reasoning was clearly correct ended up selecting the wrong answer for the
temperature change of the water, apparently misinterpreting the meaning of the “greater than”
symbol. He verbally explained why the temperature would go down, but selected Option C that
indicates the water’s temperature would increase.
The concept list reviewed for this study was found to have fairly strong agreement by the
reviewers for most question-concept pairs as to the appropriateness of the question for assessing
the associated concept, with an overall rating of 4.4 on the questionnaire with a range of 2.6 to
5.0 for individual question-concept pairs. Twelve of the thirty-one question-concept statements
were given a below-average rating, with six of these that also fell below a rating of four. A
rating of 3 (concept is being assessed only somewhat well) would indicate that the reviewers felt
the concept statement is not assessed adequately in the question. The concept statements that fell

102
below a rating of four would be considered weaker than desired for characterizing the assessed
concepts in the ABCC. A low rating could be indicative that the reviewer felt the concept
statement in its current form is not adequately expressed, that the statement is simply not a good
match to the question, or that another concept is being assessed in the associated question more
strongly than the one stated. Mulford suggested some alternative concepts to consider based on
his experience with the questions. The concept map allows the clustering of the concepts
around key ideas to be seen, as well as how frequently the concept statements appear to be
assessed within the ABCC. Only a few of the concept statements are assessed by multiple
questions, which would allow for these concepts to be triangulated within student data. The
questions from within one larger concept category, such as energy, may be compared to say
whether various facets of the larger concept are forming a coherent idea for the students. The
size of the review panel was sufficiently large enough to provide a preliminary evaluation,
meeting the minimum desired number of five participants.
Recommendations
The ABCC was developed to provide a conceptual assessment of chemistry concepts that
are common to an introductory course and assess how well students embrace the accepted
concept in the face of common misconceptions students commonly hold for these important
ideas. The ABCC (v2.6) was found to have sufficient internal reliability, as estimated by
coefficient alpha (.798), to make this test appropriate for use in distinguishing between groups
(Engelhardt, 2009), which is useful for evaluating teaching and learning within populations of
students or teachers. Most of the items on the test appeared to be well-functioning with regard to
patterns in the proportion endorsing and the point biserial correlations for answer options in these
questions. Three questions were identified that are not well-functioning by these measures. An

103
additional item was found to have answer options in the first of two paired questions that did not
have plausible options available in the explanations of the second question. Based on student
explanations in the think-aloud interviews, the last six energy questions presented both
conceptual challenges as well as possible concerns in the language of the prompts and answer
options for high school students. In response to these findings, some recommendations are
offered here.
The statistical concerns about Questions 9 and 20/21 appear to be related to common
misconceptions about matter or inadequate understanding of an important chemical concept.
These questions have the potential to distinguish between students who have and have not
successfully mastered these ideas, even if it is common for students to wrestle with the concepts
involved. As a conceptual assessment, these questions appear to fulfill their function. Question
14, however, appears to be more strongly influenced by students’ conceptual weakness with very
large and very small numbers rather than a specific misconception about matter. In fact, the
students embrace the very small size of the atom and the very large number of atoms we handle
in everyday things. They simply do not appear to have the conceptual tools for grasping the
magnitude of these numbers. In addition, the poor statistics associated with Q14 skew the
overall statistical performance of the ABCC. For these reasons this researcher believes
consideration should be given to removing this question from the ABCC while retaining Q9 and
Q20/21 as valuable measures of challenging concepts in chemistry.
The lack of answer options in Question 13 available to explain a mass increase in the tube
and iodine may influence students who hold this view when they cannot find an adequate
explanation. The explanations found in the open-ended student responses to Q13 should be
considered for inclusion in the answer options to Q13 in a future version of the ABCC. The two

104
most common themes from the student responses were 1) evaporating produces more particles,
and 2) heating increases the mass. Since four of the five current answer options are logically
associated with a gain in mass, and Options D and E have the lowest proportion endorsing these
answers, it is recommended that consideration be given to replacing these two options with the
two explanations suggested above.
Questions 23/24 and 25/26 attempted to assess students’ understanding of how
temperature is affected during a phase change and when there is no phase change. It was noted
that some students missed the fact that a mixture of both ice and water were being heated in
Q23/24. This information is embedded near the end of the first sentence, while the constant rate
of energy input is the first idea presented in the prompt. The sequence in Q25/26 is reversed,
with a description of the system first, followed by the energy input information. It may be
helpful to students to rewrite the prompt in Q23 to also have the system information in the
beginning of the prompt, giving Q23 and Q25 a more parallel construction. In addition, the
presence of two temperature scales appears to add to the information load more than it helps
clarify critical temperatures for the test group students. With the common use of the Celsius
scale in U. S. high schools, it may be beneficial to eliminate the Fahrenheit scale information to
simplify the prompts.
The verbal complexity of Questions 27 and 28 appeared to cause students to struggle
more with answering these questions. Some consideration should be given to whether the ideas
in could be stated more simply without compromising the intended concepts in the statements.
The fact that energy is known to be a challenging concept appears to make addressing these
questions a little more challenging due to their placement at the end of the ABCC. The similarity
of their content and style would recommend keeping these three question pairs together, as they

105
currently are in the ABCC. The level of challenge should also be taken into account in the
sequencing of the questions, with consideration given to moving them to an earlier position in
the ABCC.
It is recommended that further dialog among a larger panel of chemistry instructors be
enlisted to refine the concept list for the ABCC. Where there is not good agreement about the
concepts being represented in selected questions, alternative wordings or even alternative
concepts may need to be considered. It may also be appropriate to create a list of misconceptions
statement to be included rather than only providing positive statements of chemistry concepts
associated with this assessment. A refined list with stronger agreement among experienced
chemistry instructors across all concepts would provide a better basis for common interpretation
of the results of the ABCC, including how well this instrument may triangulate specific concepts.
If changes are made to the ABCC in response to these recommendations, additional post-
test data would need to be collected for a sufficiently large student population in order to analyze
the effects of the changes on the statistical characteristics of the resulting test.

106
References Abinbola, I. O. & Baba, S. (1996). Misconceptions & alternative conceptions in science
textbooks: The role of teachers as filters. The American Biology Teacher, 58(1), 14-19.
Retrieved from http://www.jstor.org/stable/4450067?seq=1
Andrich, D., de Jong, J. H. A. L., & Sheridan, B. (1997). Diagnostic opportunities with the Rasch
model for ordered response categories. In J. Rost & R. Langeheine (Eds.) Applications of
latent trait and latent class models in the social sciences. (pp. 59-70). Munster/New
York: Waxmann.
Avanzo, C. (2008). Biology concept inventories: Overview, status, and next steps. BioScience,
58(11), 1-11. doi:10.1641/B581111
Beichner, R. J. (2007). Assessment Instrument Information Page. Retrieved from North Carolina
State University, Department of Physics website at http://www.ncsu.edu/
per/TestInfo.html
Berne, J. (2004). Think-aloud protocol and adult learners. Adult Basic Education, 14(3), 153-
173. Retrieved from http://ez.fresno.edu:2096/ehost
Boyer, D. & Rogers, C. (2001). Chemistry concept inventory. Retrieved from
http://www.daisley.net/hellevator/cci/cciv5.pdf
Bransford, J. D., Brown, A. L., & Cocking, R. R. (Eds.). (2000). How people learn: Brain, mind,
experience, and school: Expanded edition, Washington, D.C.: National Academy Press.
Retrieved from http://www.nap.edu
Brock, M. E., Vert, A., Kligyte, V., Waples, E. P., Sevier, S. T., & Mumford, M. D. (2008).
Mental models: An alternative evaluation of a sensemaking approach to ethics

107
instruction. Science and Engineering Ethics, 14, 449-472. doi: 10.1007/s11948-008-
9076-3
Butterworth, B. (1999). What Counts: How every brain is hardwired for math. New York, NY:
The Free Press
Cakir, M. (2008). Constructivist approaches to learning science and their implications for
science pedagogy: A literature review. International Journal of Environmental &
Science Education, 3(4), 103-206. Retrieved September 9, 2011 from ERIC
Creswell, J. W. (2009). Research design: Qualitative, quantitative, and misted methods
approaches (3rd ed.). Thousand Oaks, CA: SAGE Publications, Inc.
Crocker, L., & Algina, J. (2006). Introduction to classical and modern test theory. Pacific Grove,
CA: Wadsworth.
Cronbach, L. J. (1951). Coefficient alpha and the internal structure of tests. Psychometrika, 16,
297-334.
Docktor, J. & Heller, K. (2008). Gender differences in both force concept inventory and
introductory physics performance. In E. Henderson, M. Sabella, & L. Hsu (Eds.), 2008
Physics Education Research Conference.
Eisner, E. (1994). The educational imagination: The design and evaluation of school programs
(3rd ed.). New York, NY: Macmillan College Publishing Company
Engelhardt, P. V. (2009). An introduction to classical test theory as applied to conceptual
multiple-choice tests. In C. Henderson & K. A. Harper (Eds.), Getting Started in Physics
Education Research. College Park, MD: American Association of Physics Teachers.
Retrieved from http://www.per-central.org/document/ServeFile.cfm?ID=8807

108
Ericsson, K. A. (2006). Protocol analysis and expert thought: Concurrent verbalizations o
thinking during experts’ performance on representative tasks. In K. A. Ericsson, N.
Charness, R. R. Hoffman, & P. J. Feltovich (Eds.), The Cambridge Handbook of
Expertise and Expert Performance. New York, NY: Cambridge University Press.
Retrieved from http://industry.biomed.cas.cz/kamil/clanky/ericsson%202002%20
chapter%2013.pdf
Ericsson, K. A., Simon, H. A. (1998). How to study thinking in everyday life: Contrasting think-
aloud protocols with descriptions and explanations of thinking. Mind, Culture and
Activity, 5(3), 178-186. Retrieved from http://octopus.library.cmu.edu/cgi-
bin/tiff2pdf/simon/box00071/fld05467/bdl0001/doc0001/simon.pdf
Evans, D. L., Gray, G., Krause, S., Martin, J., Midkiff, C., Notarous, B., Pavelich, M. …Wage,
K. (2003). Progress on Concept Inventory Assessment Tools. Proceedings of the 33rd
ASEE/IEEE Frontiers in Education Conference, p. T4G1-T4G8.
Hake, R. R. (2007). Six lessons from the physics education reform effort. Latin American
Journal of Physics Education, 1, 24-31 Retrieved from http://journal.lapen.org.mx/sep07/
LAJPEVol%201%20No%201%20_2007_.pdf#page=27
Halloun, I. A. & Hestenes, D. (1985). Common sense concepts about motion. American Journal
of Physics, 53(11), 1056-1065. Retrieved from http://modeling.asu.edu
/R&E/Hestenes_CommonSenseConcept.pdf
Harvard-Smithsonian Center for Astrophysics (Producer). (1987). A private universe [DVD].
Available from http://www.learner.org/resources/seried28.html
Harvard-Smithsonian Center for Astrophysics (Producer). (1997). Minds of our own [DVD].
Available from http://www.learner.org/resources/seried26.html

109
Henderson, C. & Harper, K. (Eds.). (2009). Getting Started in Physics Education Research.
College Park, MD: American Association of Physics Teachers. Retrieved from
http://www.per-central.org/document/ServeFile.cfm?ID=8807
Hestenes, D., Wells, M., & Swackhamer, G. (1992), The force concept inventory, The Physics
Teacher, 30, 141-158. Retrieved from Arizona State University website
http://modeling.asu.edu/R&E/FCI.PDF
Horton, C. (2009). Student alternative conception in chemistry. Retrieved from Arizona State
University website http://modeling.asu.edu/modeling/Chem-AltConceptions3-09.doc
Jackson, J., Dukerich, L., & Hestenes, D. (2008), Modeling instruction: An effective model for
science education. Science Education, 17(1), 10-17. Retrieved from Arizona State
University website http://modeling.asu.edu
Karahasanovic, A., Unni, N. H., Sjøberg, D. I. K., & Thomas, R. (2009). Comparing of
feedback-collection and think-aloud methods in program comprehension studies.
Behavior & Information Technology, 28(2), 139-164. doi: 10.1080/01449290701682761
Kind, V. (2004). Beyond appearances: Student misconceptions about basic chemical ideas (2nd
ed.). Retrieved from Royal Society of Chemistry http://www.rsc.org/images/
Misconceptions_update_tcm18-188603.pdf
Kirschner, P. A. (2002). Cognitive load theory: Implications of cognitive load theory on the
design of learning. Learning and Instruction, 12, 1-10. Retrieved from http://igitur-
archive.library.uu.nl/fss/2006-1214-210904/kirschner_02_cognitive_load_theory_
implications_cognitive.pdf
Libarkin, J., (2008). Concept inventories in higher education science, Manuscript prepared for
the National Research Council Promising Practices in Undergraduate STEM Education

110
Workshop 2, Washington, D. C. Retrieved from https://www.msu.edu/~libarkin/
Publications_files/Libarkin_CommissionedPaper.pdf
Lindell, R. S., Peak, E., & Foster, T. M. (2006). Are they all created equal? A comparison of
different concept inventory development methodologies. In L. McCullough, L. Hsu, and
P. Heron (Eds.). 2008 Physics Education Research Conference. Retrieved from
EBSCOHost.
Lucas, E. J. & Ball, L. J. (2005). Think-aloud protocols and the selection task: Evidence for
relevance effects and rationalization processes. Thinking & Reasoning, 11(1), 35-66.
doi: 10.1080/13546780442000114
McCollough, L. & Metzler, D. E. (n. d.). Differences in male/female response patterns on
alternative-format versions of FCI items. Retrieved August 14, 2011 from
http://piggy.rit.edu/franklin/perc2001/McCullough.doc
Mestre, J. P. (2001). Cognitive aspects of learning and teaching science. In S. J. Fitzsimmons &
L. C. Kerpelman (Eds.). Washington, DC: National Science Foundation (NSF 94-80).
Retrieved September 9, 2011 from ERIC.
Morris, G., Bran-Martin, L., Harshman, N., Baker, S. D., Mazur, E., Dutta, S., Msoughi, T., &
McCauley, V. (2006). Testing the test: Item response curves and test quality. American
Journal of Physics, 74(5) 449-453. DOI: 10.1119/1.2174053
Mulford, D. R. (1996), [thesis] unpublished, copy from D. Mulford August 2011
Mulford, D. R. & Robinson, W. R. (2002). An inventory for alternate conceptions among first-
semester general chemistry students. Journal of Chemistry Education, 79(6) 739-744.
Osborn Popp, S. (2010). [Item analysis of chemistry students’ responses on the ABCC from
spring 2010 end-of-course administration]. Unpublished raw data.

111
Osborn Popp, S. (2011). [Item analysis of chemistry students’ responses on the ABCC from
spring 2011 end-of-course administration]. Unpublished raw data.
Pavelich, M., Jenkins, B., Birk, J., Bauer, R., & Krause, S. (2004). Development of a chemistry
concept inventory for use in chemistry, materials, and other engineering courses.
Proceedings of the 2004 American Society for Engineering Education Annual Conference
& Exposition. Retrieved from http://www.foundationcoalition.org/events/
news/conferencepapers/2004asee/pavelich.pdf
Powell, K. (2003), Science education: Spare me the lecture. Nature 425, 234-236. doi:
10.1038/425234a
Ramey, J. (n.d.). Methods for successful “thinking out loud” procedures. University of
Washington. Retrieved from http://www.scs.ryerson.ca/~cps613/F10/Lab6
/EncouragingSubjects.pdf
Rasch, G. (1960/1980). Probabilistic models for some intelligence and attainment tests.
Copenhagen: Danish Institute for Educational Research, 1960. Expanded edition,
Chicago: The University of Chicago Press, 1980.
Rebello, N. S. & Zomman, D. A. (2003). The effect of distracters on student performance on the
force concept inventory. American Journal of Physics 72(1), 116-125. Retrieved from
http://krex.k-state.edu/dspace/bitstream/2097/2460/1/zollman%202004.pdf
Roth, K. J. (April, 1985). Conceptual change learning and student processing of science texts.
Paper presented at the Annual Meeting of the American Education Research Association.
Chicago, IL
Ruiz-Primo, M. A., Shavelson, R. J., Li, M., & Schultz, S. E. (2001), On the validity of cognitive
interpretations of scores from alternative concept-mapping techniques. Educational

112
Assessment, 7(2), p. 99-141. Retrieved from Stanford University website
http://www.stanford.edu/dept/SUSE/projects/ireport/articles/concept_maps/On%20the%2
0validity%20of%20Cognitive%20Interpretations%20of%20Scores%20from.PDF
Sainsbury, M. (2003). Thinking aloud: Children’s interactions with text. Reading, 37(3), 131-
135. doi: 10.1046/j.0034-0472.2003.03703007.x
Savinainen, A., & Scott, P. (2002). Using the force concept inventory to monitor student learning
to plan teaching. Physics Education, 37(1), 53-58. Retrieved from http://kotisivu.
dnainternet.net/savant/FCI_monitoring.pdf
Seidel, J. V. (1998). Qualitative Data Analysis, Qualis Research. Retrieved from
ftp://ftp.qualisresearch.com/pub/qda.pdf
Silverman, D. (2001). Interpreting Qualitative data: Methods for analyzing talk, text and
interaction (2nd ed.). Thousand Oaks, CA: SAGE Publications
Stieff, M., Ryu, M., & Yip, J. (April, 2009). Speaking across levels-teacher & student
perspectives of chemistry. Paper presented at the Annual Meeting of the American
Educational Research Association, San Diego, CA.
Stiger, J. W. & Heibert, J. (1999). The teaching gap: Best ideas from the world’s teachers for
improving education in the classroom. New York, NY: Free Press
Strauss, A., Corbin, J. (1998). Basics of qualitative research: Techniques and procedures for
developing grounded theory. Thousand Oaks, CA: SAGE Publications
Thornton, R. K., Kuhl, D., Cummings, K., & Marx, J. (2009). Comparing the force and motion
conceptual evaluation and the force concept inventory. Physical review Special Topics –
Physics Education Research 5, 1-8. doi: 10.1103/PhysRevSTPER.5.010105

113
Vaarik, A. Taagepera, M. & Tamm, L. (2008). Following the logic of student thinking patterns
about atomic orbital structures, Journal of Baltic Science Education, 7(1) 27-36
van Someren, M. W., Barnard, Y. F., & Sandberg, J. A. C. (1994). The think aloud method: A
practical guide to modeling cognitive processes. San Diego, CA: Academic Press
Wells, M., Hestenes, D., & Swackhamer, G. (1995). A modeling method for high school physics
instruction, American Journal of Physics, 63(7), 606-619. Retrieved from Arizona State
University website http://modeling.asu.edu
Wright, B. D., & Stone, M. H. (1979). Best Test Design: Rasch Measurement. Chicago: MESA
Press.
Yip, D. (1998). Identification of misconceptions in novice biology teachers and remedial
strategies for improving biology learning. International Journal of Science Education,
20(4), 461-477.
Zimrot, R. & Ashkenazi, G. (2007). Interactive lecture demonstrations: A tool for exploring and
enhancing conceptual change. Chemistry Education Research and Practice, 8(2), 197-
211. Retrieved from http://www.rsc.org/images/Ashkenazi%20paper2%20 final _tcm18-
85042.pdf

114
Appendix A Forms
Figure A1. IRB approval (copy of email notification) 9/29/11 Brenda: The IRB has approved your proposal numbered 1112.13. Data collection may now begin. Please be advised, however, of the following stipulations of approval.
· FPU IRB approval for proposal 1112.13 expires one year from the date of approval. If data collection should need to take place after 9/29/11, you will need to submit a “Research Project Continuation” form (available on the FPU website). · If you decide to make any changes in your study, you must submit those changes to the IRB within three (3) working days and wait for approval by the IRB before you implement them (i.e., changes in the study’s methodology, investigator, consent forms, etc.). · If any unanticipated risks or new information that may impact the risks and/or benefits to study participants arise, you must report them to the IRB within three (3) working days and wait for their approval by the IRB before continuing with your study. · If any serious and unexpected adverse event occurs, it must be reported to the IRB within twenty-four (24) hours. Less serious adverse events must be reported to the IRB within three (3) working days.
The IRB maintains the authority to terminate or suspend approval of research that is not being conducted in accordance with the proposal approved by the IRB or that has been associated with unexpected serious harm to subjects. Please keep a copy of this e-mail, as well as its attachment, for your records. Should you have any questions or concerns, please do not hesitate to contact me. I can be reached at (559) 453-7186 or at [email protected]. Jim Ave Chair, Institutional Review Board Fresno Pacific University

115
Figure A2: Parental Permission Form
Parental Permission Form for Participation in a Research Study Fresno Pacific University
Researcher: Brenda Royce Study Title: Evaluating Student Thinking on Conceptual Questions in Chemistry Introduction
I am currently working on the research phase of my masters in education this year. As part of my thesis research, I will be gathering information that will help strengthen the effectiveness of a conceptual assessment in chemistry that is beginning to be used in chemistry courses across the nation, including the chemistry course at University High School. Why is this study being done?
The conceptual chemistry test used in our course at University High School is currently being evaluated for its level of effectiveness at showing how well it can show conceptual understanding of core ideas in chemistry. A well-developed conceptual test for chemistry can help teachers monitor student growth in class and help us identify more effective teaching methods. Part of the data needed for the evaluation of the test is information on the actual thinking students use to answer these questions. I will be collecting this data as part of my research. What are the study procedures? What will my child be asked to do?
The participating students will be asked to answer a set of conceptual chemistry questions from our chemistry pre/post test while saying out loud what they are thinking as they select their answers. This is called a “think-aloud interview”. Each student will have a chance to practice this process on a sample problem before they begin so we both know that the procedure is clear. The process will be videotaped to ensure that we have an accurate record of what each student says. I will also make notes during the interview and occasionally prompt the student if needed to continue. The students do not have to worry about being right or wrong in what they say, or whether they get the right answers. They just need to be open about what they think during their work.
In order to get a broad sampling of students that is as unbiased as possible, I will be accepting more potential participants than will probably be scheduled for interviews. Students who return signed forms will be placed in a pool anonymously. From this pool student will be chosen so that there is adequate representation of our junior class in terms of gender and of the range of performance on the chemistry post-test last May. I will notify the selected students and schedule an interview time. What are the risks or inconveniences of the study?
The interviews should each take about an hour (possibly less). These will take place in the UHS chemistry classroom and will be scheduled as conveniently as possible before or after classes. If it is found to be more convenient for some students, interviews may also be scheduled in the evenings or on a Saturday at the school. There is no risk to the student. Participation will not affect the student’s standing in any class or activity associated with the school. No personal information will be asked, except that the

116
students express their reasoning as accurately as they can. The students have answered all these questions before as part of their chemistry class, so they will have thought about the questions before. What are the benefits of the study?
Each participant will be contributing to our understanding of how students think about chemistry. This information is helpful to chemistry educators for planning more effective learning experiences. The intent is to refine this assessment so that it can be more effective in helping teachers know how well they are teaching, and in measuring how well various teaching methods affect student learning. Are there costs to participate?
There is no cost to the student or the family for participating beyond an hour or less of the student’s time.
How will my child’s information be protected?
No information about your child will be publically presented in a manner that can be specifically linked to your child. The only information about your child that will be associated with his/her interview will be age, gender, and the original score on the chemistry course post-test from May 2011. Your child’s personal information and image will not be included in the thesis or any future report or paper that references this data. I will personally carry out the analysis of the data. One or two other science educators will also analyze selected interviews for comparison purposes to demonstrate reliability of the analysis process. These colleagues will not be given personal information about the individuals in the interviews they analyze, and will hold all information in the videos in confidence, as per a signed a agreement. Once the data analysis is complete, the videos will be electronically archived in my personal files through the duration of this masters research and the larger test evaluation project that it is contributing to. When the video data is no longer needed for these projects, all video files will be completely deleted. All records generated from the video data will not hold any identifier that can be linked back specifically to your child.
Can my child stop being in the study and what are my and my child’s rights?
Your child does not have to be in this study if you do not want him/her to participate. If you give permission for your child to be in the study, but later change your mind, you may withdraw your child at any time. There are no penalties or consequences of any kind if you decide that you do not want your child to participate. Whom do I contact if I have questions about the study?
I will be happy to answer any question you have about this study. If you have further questions about this study or if you have a research-related problem, you may contact me at University High at 278-8263 or by email at [email protected]. If you have any questions concerning your child’s rights as a research participant, you may contact the Fresno Pacific University Institutional Review Board (IRB) at 559-453-7186 or at [email protected].

117
Parental Permission Form for Participation in a Research Study Fresno Pacific University
Return Slip
Researcher: Brenda Royce Study Title: Evaluating Student Thinking on Conceptual Questions in Chemistry By signing this consent for participation, you are agreeing to allow your child to participate in a video-taped think-aloud interview for a set of conceptual chemistry questions. Documentation of Permission: I have read information about this research study and understand what is involved. I have decided that I will give permission for my child to participate in the study described above. Its general purposes, the particulars of my child’s involvement and possible risks and inconveniences have been explained to my satisfaction. I understand that I can withdraw my child at any time. My signature also indicates that I have received a copy of this parental permission form. Please return this form to Mrs. Royce no later than October 12, 2011. ____________________ ____________________ __________ Child Signature: Print Name: Date: ____________________ ____________________ __________ Parent/Guardian Signature: Print Name: Date: Relationship to Child (e.g. mother, father, guardian): _____________________________ ____________________ ____________________ __________ Signature of Person Print Name: Date: Obtaining Consent

118
Appendix B Research Documents
Figure B1: ABCC version 2.6 contact information
Assessment of Basic Chemistry Concepts
This instrument is based on the Chemical Concepts Inventory developed by Doug Mulford
(2002). It was modified by staff at the Modeling Instruction Program in the Summer of 2009 for
use with high school students. The test consists of 28 multiple choice questions. Question 29
serves to indicate that you are taking the updated version of this instrument. Carefully consider
each question and indicate the one best answer for each. Several of the questions are paired. In
these cases, the first question asks about a chemical or physical effect. The second question then
asks for the reason for the observed effect.
Record your answers on the answer sheet.
DO NOT write on this copy of the test.
Contact Information
The full text of the ABCC is not cited here. Those interested in using the ABCC as an
instructional assessment or for research may contact Brenda Royce ([email protected]) or
Larry Dukerich ([email protected]) for further information about the ABCC and access to the
test document.

119
Figure B2. ABCC Think-Aloud Interviewer Notes
ABCC Interview Notes Student ______________________ Date ____________ Time _______
1
2
3
4
5
6
7
8
9
10
11
12
13
14

120
15
16
17
18
19
20
21
22
23
24
25
26
27
28

121
Figure B3. ABCC Video Analysis Code List
ABCC Think-Aloud Interviews 2011-12 CODING INFORMATION
COLUMN TITLE EXPLANATION
Grp Subgroup: A = Low scoring; B = Middle scoring; C = High scoring (from Sp11 post-‐test)
Clip Ord Order in clip sequence for single-‐question videos (1st, 2nd, etc)
Ans Answer student gave for this question/question pair (bold = correct)
Name Student's first name
Code Category CODE EXPLANATION
Reasoning Note patterns of reasoning
IC Stayed with initial concept/line of reasoning heard in explanation throughout answering
CS
Shifted to different concept/line of reasoning; note what appeared to cause the shift (own reasoning, recall of relevant info, info in the prompt, info in the distractors. or other)
Concept Main concept student appears to use:
TC Target concept used (using correct idea)
MC Misconception -‐ common (note main idea of misconception)
ALT Alternative/unexpected idea used appropriately
PART Partial understanding observed -‐ mixed correct and incorrect concepts
Answer Main concept student appears to use:
CA Comes to correct answer with fairly accurate reasoning
CU Correct answer; appears ungrounded; confused or unclear reasons
IG Incorrect answer, but grounded in a common misconception
IU Incorrect answer; appears ungrounded; confused or unclear reasons
GS Student just guesses -‐ no sign of knowing why
FAM Cites familiar language of selection
Misconception Record misconception(s) student appears to be using
Reason Answer Answer to the second of paired questions. Use same code selection as "Answer" codes above.
Notes Other notes, quotes from student, comments or observations pertinent to student's processing

122
Figure B4. ABCC Concept Questionnaire
ABCC v2.6 Concept List Please rate (1-5) how strongly you feel these statements describe the key concept being assessed in each question from the ABCC. Type the number from the scale below you feel best describes the relationship between each concept statement and the question it is aligned with in the rating column. Comments may be made at the end. 1 2 3 4 5
concept is not assessed by this
question
concept is being assessed only
somewhat well
concept is being assessed clearly and
appropriately
Q# Concept Statement Rating 1 A. Mass is conserved during any physical or chemical change within a closed
system
1 D. Matter is conserved in a chemical reaction because atoms are neither created nor destroyed, only rearranged into new groupings.
2 B. Phase change occurs when the molecules of a substance take a new spatial arrangement, but do not themselves change
3 C. The water that forms on a cold surface results from the condensation of water vapor present in the atmosphere
4 A. Mass is conserved during any physical or chemical change within a closed system
5 D. Matter is conserved in a chemical reaction because atoms are neither created nor destroyed, only rearranged into new groupings.
5 E. In a chemical reaction, atoms or molecules react in fixed ratios, even when an excess of a reactant is present
6 B. Phase change occurs when the molecules of a substance take a new spatial arrangement, but do not themselves change
6 F. Molecules in the solid and liquid phases are packed closely, while those in the gas phase are widely separated
7/8 D. Matter is conserved in a chemical reaction because atoms are neither created nor destroyed, only rearranged into new groupings.
9 G. Bond breaking requires an increase in potential energy of a system, while bond forming lowers its potential energy

123
10/11 H. Density is an intrinsic property that depends on the substance and not on the amount present
12/13 A. Mass is conserved during any physical or chemical change within a closed system
14 I. Atoms are extremely small, but have a finite size that can be determined (on the order of 0.1nm)
14 J. A mole of a substance (Avogadro’s number of particles) has a mass that can readily be read on a balance
15 K. Concentration is the ratio of the amount of solute to the volume of solution
16/17 L. The energy needed to make a 1°C change in the temperature of a substance depends on both the mass and the type of substance
18/19 A. Mass is conserved during any physical or chemical change within a closed system
18/19 M. The mass of a compound is equal to the sum of the masses of the elements that make up the compound
18/19 N. Atoms in the gas phase have mass; the mass of these atoms remains the same when they change phase or participate in a reaction
20/21 K. Concentration is the ratio of the amount of solute to the volume of solution
20/21 O. Saturation occurs when the solid and dissolved phases of a substance are in equilibrium with each other
20/21 P. Evaporating solvent from a saturated solution (at constant temperature) does not change the concentration of the solution
22 Q. Some physical properties, characteristic of a collection of particles, do not apply to individual particles of the substance.
23/24 R. Energy added to a substance undergoing a phase change increases the potential energy of the particles; the thermal motion of the particles remains relatively constant
23/24 S. Energy added to a substance not undergoing a phase change increases the thermal motion of the particles; this is seen as an increase in temperature
25/26 S. Energy added to a substance not undergoing a phase change increases the thermal motion of the particles; this is seen as an increase in temperature

124
27/28 T. Thermal energy is transferred between systems by collisions of particles, with the net energy flow moving from faster/hotter particles to slower/colder particles
27/28 U. During a chemical reaction, there is a transfer of energy between the potential and thermal energy of the system, resulting in a temperature change in the system.
27/28 V. Temperature is not a conserved quantity
27/28 W. Endothermic reactions can occur without an input of energy from the surroundings.
Comments: