evaluation of the batch press as a laboratory tool …
TRANSCRIPT

EVALUATION OF THE BATCH PRESS AS A LABORATORY TOOL TO SIMULATE HIGH AND MEDIUM-PRESSURE
ROLLER CRUSHERS
by
JAN CORNELIUS RUDOLPH VAN SCHOOR
Submitted in partial fulfilment of the requirements for the degree
MAGISTER
in
METALLURGICAL ENGINEERING
in the
FACULTY OF ENGINEERING, BUILT ENVIRONMENT AND INFORMATION TECHNOLOGY
University of Pretoria
30 November 2012
©© UUnniivveerrssiittyy ooff PPrreettoorriiaa

ii
ACKNOWLEDGEMENTS
I would like to thank and herewith express my appreciation to the following people:
The Project Manager at Foskor, Steph van der Merwe, for allowing me to do the first
tests in France.
The Manager, Research and Development, Dr. Willem van Niekerk and Marinus du
Plessis at Kumba Resources for sponsoring this study.
The many personnel at Kumba Technology for all their inputs in doing most of the
execution of the project.
My family for their tolerance and support during this research project.
Professor R F Sandenbergh for his guidance.
Mr Ian Smith of AARL for managing the tests at AARL.
SOLI DEO GLORIA
©© UUnniivveerrssiittyy ooff PPrreettoorriiaa

iii
TABLE OF CONTENTS
ACKNOWLEDGEMENTS ii
TABLE OF CONTENTS iii
ABSTRACT vi
CHAPTER 1 1
PROBLEM STATEMENT 1
1.1 INTRODUCTION 1
1.2 PROBLEM STATEMENT 2
1.2.1 ENERGY RELATIONSHIPS 3
1.2.2 PARTICLE SIZE DISTRIBUTIONS 8
1.2.3 BENCH SCALE EQUIPMENT 10
1.2.4 SUMMARY 12
CHAPTER 2 13
COMPARISON BETWEEN THE HOROMILL, LOESCHE MILL AND THE
BATCH PRESS 13
2.1 INTRODUCTION 13
2.2 METHODOLOGY TO DETERMINE THE VALUE OF OPERATING
WORK INDEX AND THE ENERGY VERSUS REDUCTION RATIO
RELATIONSHIP 14
2.3 EXPERIMENTAL SETUP 14
2.3.1 BATCH PRESS 15
2.3.2 PILOT HOROMILL 20
2.3.3 PILOT LOESCHE MILL AT AARL 20
2.4 RESULTS AND DISCUSSION 21
2.4.1 COMPARISON BETWEEN THE ENERGY CONSUMPTION OF THE
BATCH AND PILOT MILLS 21
2.4.1.1 FOSKOR ORE 21
2.4.1.2 ROSH PINAH ORE 27
2.4.1.3 TITANIUM SLAG 35
2.4.1.4 BANDED IRON STONE 39
2.4.2 PARTICLE SIZE DISTRIBUTIONS 43
2.4.2.1 COMPARISON BETWEEN THE ROSIN-RAMMLER AND OTHER
EXPRESSIONS 43
©© UUnniivveerrssiittyy ooff PPrreettoorriiaa

iv
2.4.2.2 COMPARISON BETWEEN BATCH PRESS AND HOROMILL FOR
FOSKOR ORE, AS WELL AS LOESCHE PILOT MILL FOR OTHER
ORE TYPES 51
2.4.2.2.1 FOSKOR ORE 51
2.4.2.2.2 ROSH PINAH ORE 54
2.4.2.2.3 TITANIUM SLAG 55
2.4.2.2.4 BANDED IRON STONE 57
2.4.3 CIRCULATING LOAD 57
CHAPTER 3 59
SUMMARY OF RESULTS AND COMPARISONS 59
3.1 ENERGY RELATIONSHIPS 59
3.2 PARTICLE SIZE DISTRIBUTIONS 61
3.3 CONCLUSIONS 62
REFERENCES 63
APPENDIX 1 65
A.1 INDUSTRIAL ROLLER MILLS 65
A.1.1 DUAL ROLLER PRESSES 65
A.1.2 VERTICAL ROLLER MILLS 66
A.1.3 HOROMILL 69
APPENDIX 2 71
DETAIL DATA FOR THE TESTS WITH FOSKOR ORE 71
APPENDIX 3 76
DETAIL DATA FOR THE TESTS WITH TITANIUM SLAG 76
APPENDIX 4 80
DETAIL DATA FOR THE TESTS WITH ROSH PINAH ORE 80
©© UUnniivveerrssiittyy ooff PPrreettoorriiaa
v
Nomenclature:
d = Particle size defined in the Rosin-Rammler formula (µm)
E = Energy per unit mass consumed (kWh/ton)
F = Feed size to a crusher or mill (in general) (µm)
F80 = 80% mass passing size of the feed (µm)
F50 = 50% mass passing size of the feed (µm)
F25 = 25% mass passing size of the feed (µm)
Kic = Fracture toughness of material, and in this formula
= The stress needed for crack propagation and
a = The crack length (µm)
m = Constant, the so-called Rosin-Rammler slope.
n = Factor characteristic of the comminution device, product size range and material.
This factor describes the relationship between product size and energy consumption
E 1/Pn
OWi = Operating work index, determined by measuring the energy consumption, feed
size and product size for the specific device (kWh/ton)
P = Product size of the crusher or mill (in general) (µm)
P80 = 80% mass passing size of the product (µm)
P50 = 50% mass passing size of the product (µm)
P25 = 25% mass passing size of the product (µm)
Wi = Work index, a factor that depends on the comminution device, Bond work index
in the case of ball mills (kWh/ton)
x = Screen aperture (µm)
Y = Cumulative size distribution (% passing)
©© UUnniivveerrssiittyy ooff PPrreettoorriiaa
vi
ABSTRACT
High and medium-pressure roller crushers operate on the principle of inter-particle
crushing by crushing material in a packed bed. Although reference in the study is
made to high-pressure roller crushers, the work was done with medium–pressure
roller crushers i.e. the Loesche mill and the Horomill. The difference in pressures
between these equipment and high-pressure grinding rolls (HPGR) from
measurements done by FCB, the supplier of the Horomill, was that the medium-
pressure equipment operates at pressures of 30 MPa whilst the HPGR operates at
pressures as high as 100 MPa. In this study, the differences between single particle
and inter-particle crushing and the applicability of the batch press to predict the
energy consumption and particle size distributions for medium-pressure roller
crushers were investigated. Two phases of crushing were identified and investigated.
The first phase occurs when the material is still being drawn into the gap between the
rollers. The second phase, called packed bed crushing, occurs when the material is in
the gap between the rollers. Crushing and milling energy requirements are discussed
with specific reference to the energy models proposed by Bond and Rittinger along
with the shortcomings of both these models. These models postulate that the
comminution energy is an inverse function of product size. This is proven to be true in
this study, but where certain constants are suggested in the aforementioned
correlations, this study revealed that these constants are not fixed for all applications
but varies for different types of ore. The results were determined for 80% as well as
50% mass passing size. Kick proposed that the energy requirements are a function of
the reduction ratio. A model used for roller crushers that is similar to what Kick
proposed was also investigated. This was also found to be valid but again, the
coefficients in the model vary for the different materials. A new method for predicting
the work index of an ore for inter-particle crushing was investigated, which involves
using a piston press in which a bed of material is pressed to a predetermined
pressure. The proposed method was evaluated using pilot test data obtained with a
Horomill, as well as with a pilot Loesche mill. The results indicate that the correlation
between the batch press and the pilot mills are poor. The Rosin-Rammler description
for particle size distribution was applied and compared with other descriptions. The
particle size descriptions of products from the batch press and pilot mills were
compared and although there are differences, the batch press can be used to prepare
material for initial research in a project. From this study it is clear that, especially
©© UUnniivveerrssiittyy ooff PPrreettoorriiaa

vii
when tests are done on an unknown ore body, a work index such as Bond’s, cannot
be used for plant design and economic studies unless some pilot plant tests are done
to confirm the relationship between energy consumed and product size.
©© UUnniivveerrssiittyy ooff PPrreettoorriiaa
1
CHAPTER 1
PROBLEM STATEMENT
1.1 INTRODUCTION
Inter-particle crushing is achieved when a bed of particles, rather than single
particles, is subjected to forces high enough to cause fracture of the particles. This is
at present achieved with medium- and high-pressure roller crushers and to some
extent in cone crushers operating under choke feed conditions. Although the crushing
and milling of material with medium- and high-pressure roller crushers is not new in
the world of comminution, its application in the mining industry is still in the early
stages. Medium-pressure roller crushers have been in use for over 30 years to mill
coking coal for pulverised coal injection in blast furnaces, manganese dioxide and
various minerals in the cement industry. Limiting over-grinding is a major potential
advantage of inter-particle crushing. To pursue this benefit, a large-scale roller
crusher (Loesche) was installed at Foskor in order to limit the over-grinding of apatite.
Over-grinding of apatite causes significant losses during flotation. In the late 1980’s,
Schönert (1988), focused on one of the advantages of inter-particle crushers, namely
a potential saving in energy. He found that by milling material with high-pressure roller
crushers, energy savings of as high as 50% could be achieved compared to ball mills.
Work done by Eicke (1979), Kanda et al (1996), Fandrich et al (1997), Lim and Weller
(1998), Mayerhauser (1990), Norgate and Weller (1994), Schönert (1991),
Schwechten and Milburn (1990), and Van der. Meer (1997), confirmed that this
significant increase in efficiency could indeed be achieved.
Another advantage, and this is where focus in this field should be, is the narrower
particle size distributions that can be achieved compared to ball and rod milling. In
most beneficiation processes too much fine material, normally expressed as minus
38 m material, leads to a loss of valuable minerals. Flotation recovery of the fine
fractions is lower, magnetic separation of minus 38 m material is more difficult and
under normal circumstances high slimes contents has a negative impact on
beneficiation. Viljoen, et al (2001), and Van der Linde and Bester (1998), confirmed
this for the flotation of nickel and phosphate ores respectively. The lack of focus on
the advantage of changing the particle size distribution to improve downstream
©© UUnniivveerrssiittyy ooff PPrreettoorriiaa

2
beneficiation processes is surprising in view of the major benefits that can be
achieved. The reasons are that the mining industry is very conservative to changes in
technology, due in part to the high cost involved in introducing new technology in
existing plants and the added risk in introducing new technology in green field
projects. From a research perspective, the lack of internationally accepted test
equipment and procedures contribute to the lack of focus in this field.
1.2 PROBLEM STATEMENT
The first challenge facing researchers in this field is to know whether the commonly
used comminution laws and particle size descriptions apply to inter-particle crushing.
The second is to design bench-scale methods and procedures, i.e. small-scale tests,
to predict the performance of production equipment. With regard to the latter, Daniel
(2001), proposed that the simulation of the HPGR should be done in three stages.
The first is the portion of the feed that is by-passed in the crushers. This happens at
the edges of the rollers where material is not pressed to the same extent as in the
middle. This is a number that the suppliers of the HPGR must provide. In the case of
the Loesche mill there is no bypass. The second stage is when material is crushed
from the feed size to the gap size between the rollers. Particles larger than the gap
size are crushed as single particles. Daniel (2001), suggested the Whiten crusher
model for simulation of this stage. Of note is that there is not a fixed gap size.
Particles larger than the gap size as well as particles with compression strength
higher than the applied pressure will open the bed resulting in a certain amount of
single particle crushing. The third stage is when the particles are compressed in the
bed in an inter-particle mode. For the Loesche or Horomill, i.e. medium pressure
mills, the percentage single particle crushing is expected to be higher than in a
HPGR, where higher pressures are applied. The gap size varies more with lower
pressures. This might lead to less favourable comparisons between the batch press
and the medium pressure pilot mills.
©© UUnniivveerrssiittyy ooff PPrreettoorriiaa

3
1.2.1 ENERGY RELATIONSHIPS
When considering the comminution behaviour of particles, either as single particles or
in a packed bed, one needs a mathematical model to describe two aspects of the
characteristic behaviour of material:
The relationship between the degree of comminution and the energy input and
The description of the size distribution of the product.
The energy needed to mill material to a specific particle size was proposed by Austin
(1964), to be inversely related to some function of the product size for relative large
size reductions:
E 1/(P80) n 1
Where: E = Energy consumed per unit mass
P80 = 80% mass passing screen size of the material (µm)
n = Factor characteristic of the comminution device, product size range and
material.
The P80 parameter is extensively used in the design of ball and rod mill circuits and
was well researched by Bond for the design of mills by Allis Minerals (Bond, 1952).
The factor n changes with degree of comminution. This was researched by Hukki
(1975). Hukki used calcite and crushed the material to products over a large size
range. He found that the energy consumption per ton is as expected, an inverse
function of particle size (P80), but also that it increases strongly at smaller particle
sizes, as indicated in figure 1.
©© UUnniivveerrssiittyy ooff PPrreettoorriiaa

4
Figure 1: Energy requirements for comminution of limestone as determined by Hukki
(1975), illustrating the range of applicability of Kick’s, Bond’s and
Rittinger’s laws as indicated by the different applicable values for the
exponent in the equation E (P80) n.
The energy consumption per unit mass vs. particle size relationship may be divided
into three regions, larger than 10000 µm, between 10000 µm and 100 µm and smaller
than 100 µm. Above 10000 µm the energy consumption per unit mass is independent
of size, between 100 m and 10000 m the exponent approximates –0.5 and below
100 µm it approximates –1. These regions define the so called “comminution laws” of
Kick, Bond and Rittinger, respectively.
The region above 10 mm approximates Kick’s law which states that the energy
needed to crush a piece of rock is a function of the reduction ratio
(Jankovic et all, 2008):
E ln(F80/P80) 2
Bond found that for the size ranges typical of ball mills, the energy consumed per unit
mass is inversely related to the square root of the product size for a constant feed
size, i.e.
0
20
40
60
80
100
120
140
1 10 100 1000 10000
En
erg
y C
on
su
mp
tio
n (
kW
h/t
on
)
Product Size (um)
Energy consumption plotted as a function of product size
Exp.data Rittinger Bond Kick
©© UUnniivveerrssiittyy ooff PPrreettoorriiaa

5
E 1/(P80)0.5 3
Or more specifically (Bond, 1952):
E = 10WiB (1/(P80) 0.5 – 1/(F80)
0.5) 4
Where: E = Energy consumed per unit mass (kWh/ton)
F80 = 80% mass passing size of the feed (µm).
WiB = Bond work index (kWh/ton), i.e. the energy required to mill material
from relative large feed sizes to a P80 of 100 µm.
P80 = 80% mass passing size of the product (m).
Note that the value of the constant 10 in the equation relates to the fact that if the P80
is 100 µm and the feed size is large, the square root of P80 becomes 10. Thus the
energy consumed equals the work index.
For fine product sizes, i.e. below 100 m, the energy needed to mill a single particle
increases exponentially. In this range the energy consumed is inversely related to
product size Austin (1964):
E = 100WiR (1/P80 - 1/F80) 5
Where: WiR = Work index as described by Rittinger, as with Bond, the energy
needed per unit mass to mill material to a P80 of 100 µm.
However, there is reason to believe that the size ranges where the different laws
apply might differ for different applications. A better description would be as follows:
E = Wi(100n)(1/P80n-1/F80
n) 6
Where: Wi = Work index
n = is the coefficient applicable to the specific system, i.e. material,
apparatus and product sizes.
©© UUnniivveerrssiittyy ooff PPrreettoorriiaa

6
The work index of a material is the energy per ton needed to mill material from a very
large size (1/F80 0) to a product size of 100 µm. For the energy to equal the work
index the inverse of the product size must be 1 when P80 is 100 µm. Thus a term 100n
is added.
Wi = E/(100n)/(1/P80n-1/F80
n) 7
In the tests done in this study, the term operating work index is used (OWi). It has the
same meaning in the equations. The difference is that in a large part of the industry,
when this value is determined from plant or test data, it is referred to as an operating
work index whereas a work index refers to a number determined in a recognised
batch test such as the Bond work index.
Kapur et al (1990), as well as Daniel (2001), found that there is a power relationship
between reduction ratio and consumption per unit mass for roller mills.
F50/P50 = aEn+1 8
or
E = k((F50-P50)/P50))1/n 9
Where: a, n, k = constants.
E = Energy consumed per unit mass (kWh/ton)
From their work it is suggested that the value of n for roller crushers is 1. However
their work was done with conventional roller mills. It is believed that this would differ
for medium- and high pressure roller crushers.
Where Bond and Rittinger define energy as a function of the inverse of the product
size, Kick, as shown in equation 2, expresses energy per unit mass consumed as a
function of reduction ratio. Hukki suggested that Kick’s law is valid at large product
sizes. Although, in this study, material is milled to product sizes that correlates with
what is described by Bond and Rittinger, it is advisable to also follow a different
approach. Since the relationship as indicted in equation 8 and 9 and that of Kick are
©© UUnniivveerrssiittyy ooff PPrreettoorriiaa

7
similar and already found to describe roller crushers, it will be investigated in this
study.
There are three reasons why it is expected that the comminution laws as stated by
Bond and Rittinger might not be valid in medium- and high pressure roller crushers.
The first can be seen from figure 1. There is an area where neither Rittinger nor Bond
describes the experimental data. It is unlikely that the value of n will change from 0.5
to 1.0 at an exact unique product size. There must be a transition from 0.5 to 1.0. The
conclusions that Hukki made was with limestone, and it is likely that the size ranges
will be different for different ore types. The second reason has to do with the fact that
ball mills and crushers were used for the tests by Bond. In ball mills individual
particles are nipped between balls and in crushers the particles are nipped between
the crushing elements and very little packed bed comminution occurs. It therefore can
not be assumed that what this concept will apply to medium- and high pressure roller
crushers. The last and perhaps the most important reason has to do with the fact that
the different laws apply to different particle size ranges.
Whenever a particle is subjected to a compressive force, tensile forces excited within
the particle may cause a crack to develop inside the material. The energy needed to
grow this crack is a function of the length of the crack, the inherent toughness of the
material and the surface energy required to create the new surface area resulting
from crack growth. Ore consists of various mineral particles bonded together. When
crushed, ore will start to crack firstly along major flaws or cracks. These flaws are
caused by acts of nature such as movements in the ore crust and mostly by the
blasting process used in the mining of the ore. Crushing of the large lumps of ore will
also excite smaller flaws in the ore that may act as loci where secondary cracks can
develop. Eventually, as the lumps of ore decrease in size, the number as well as the
size of the flaws will also decrease. The stress required for crack propagation is an
inverse function of the flaw size (Guy, 1960):
Kic = f (a) 0.5 10
1/(a) 0.5 11
Where: Kic = Fracture toughness of the material, (Pa,m0.5)
= Stress needed for crack propagation (Pa) and
©© UUnniivveerrssiittyy ooff PPrreettoorriiaa
8
a = Crack length. (m)
This explains why the energy consumption is small with large particles, which typically
contains large flaws and increases almost exponentially at smaller sizes.
With inter-particle crushing the power consumption per ton is generally lower than
with ball mill and cone crushing. Kapur et al (1992), as well as Kellerwessel (1990),
did work with copper and gold ores. They indicated that when material is crushed in a
packed bed, numerous flaws are excited on the grain boundaries between mineral
particles whilst the particles are still fairly large, i.e. above 3 mm. It can therefore be
expected that when the material is crushed to smaller sizes the energy requirements
will be lower than expected, due to the numerous micro cracks already present in the
material. From figure 1 it follows that Bond’s law applies at intermediate sizes and
Rittinger’s law at the smaller ranges. The result of the induced flaws might well
change the size at which the value of n changes to -0.5 and –1. Whenever a
comminution circuit is researched, the assumption should not be made that any of the
laws apply. A better approach would be to determine the relation between product
size and energy consumption, and from these data determine the value for the factor
n in the formula E 1/Pn. It is also important to take note of another comment that
Hukki made. The use of the 80% mass passing size to describe the particle size is
questioned. It does not describe the total size distribution and with inter-particle
crushing, his point is even more valid. Work done by Kellerwessel (1989), to compare
cone crushers with high-pressure grinding rolls, showed that for the same P80 the size
distribution of the product of the high-pressure grinding rolls, is finer than that of the
cone crusher. In this study comparison between the batch press and the pilot mills
was based on the P80, P50 and in some cases P25, to take this into account.
1.2.2 PARTICLE SIZE DISTRIBUTIONS
The two most commonly used algorithms to describe the particle size distribution of
an ore are the Gaudin-Schumann formula,
Y = (ax) n 12
Where: Y = Cumulative size distribution (mass % passing).
©© UUnniivveerrssiittyy ooff PPrreettoorriiaa
9
x = Screen aperture.
a, n = Constants,
and the Rosin-Rammler distribution,
Y = 1 - exp(-(d/d63.5) m) 13
Where: Y = Cumulative size distribution (mass % passing)
d = Screen aperture size (µm)
d63.5 = 63.5% mass passing this screen size (µm)
m = Constant, the so-called Rosin-Rammler slope
When plotting the data on a ln-ln scale, the graph is a straight line that represents
Gaudin-Schumann’s formula. When plotted as ln-ln on the y-axis and ln on the x-axis,
the Rosin-Rammler slope m can be determined from the graph. Although not a
fundamental approach, the Rosin-Rammler description is the most widely used of the
two, and generally fits the data well. Hukki (1975), however, questioned the validity of
this approach, as the data typically does not present a straight line, but deviates at
the larger and smaller particle sizes. When material is milled in a rod or ball mill, a
large percentage of the very fine material, normally –38 m material is created
through the abrasion of particles. Nipping of material between two balls will result in a
range of particle sizes. However, abrasion of particles will result in only fine material,
whilst the parent particle does not significantly change in size causing the deviation
from the Rosin-Rammler plot at the fine end. It is not clear why it deviates at the
coarse end. With inter-particle crushing the amount of abrasion is less, as there is
less movement between particles. As this results in fewer fines and while larger
particles are also crushed, the Rosin-Rammler plot is expected to be more of a
straight line with a larger slope. Discussions with Foskor revealed that in their
experience the Loesche pilot mill and the large Loesche mill do give products with
size distributions closer to a Rosin-Rammler prediction. As the cumulative particle
size distribution is a sigmoidal curve, other exponential descriptions were investigated
in this study to determine if a more accurate description than the Rosin-Rammler
description could be found.
©© UUnniivveerrssiittyy ooff PPrreettoorriiaa

10
1.2.3 BENCH SCALE EQUIPMENT
Facilities to do inter-particle crushing tests are limited to the manufacturers and few
research facilities. Approximately one ton of material is required for the determination
of the energy consumption and to get an idea of the product size distribution. To get
this amount from drill cores is not a problem, but if a study on a heterogeneous ore
has to be launched and any optimisation has to be done, up to a hundred tons could
be needed. There is also a problem with the size of the rollers of the pilot plant
equipment. The mill at Anglo American Research Laboratories (AARL) has 200 mm
diameter rollers with a gap size of less than 3 mm. The Horomill at FCB has a gap of
10 mm. Tests with the Horomill were done with material with a top size of 30 mm. All
the feed larger than the gap size is not subjected to inter-particle crushing. If one
takes into account that the mill at Foskor is being fed with 80 mm top size, a large
proportion of the behaviour of the ore is not included in the studies. Doing any
fundamental work with pilot mills of this size, does yield good initial indications of
communition behaviour, but cannot contribute to the understanding of the effect of
large feed sizes, either on the energy consumption or the particle size distributions.
The batch press is an apparatus that offers such an opportunity. The press is
schematically shown and described in section 2.3.1.
This press could address the following disadvantages of the current equipment as the
following may be done:
Small scale tests with limited amount of material.
Determination of the influence of the bed pressure on the product particle size
distribution.
Determination of the influence of bed pressure on the selective milling of the softer
and harder minerals.
Determination of the influence of oversize feed to the mill.
Determination of the influence of the particle size distribution on downstream
process.
Determination of the influence of bed thickness on the particle size distributions.
©© UUnniivveerrssiittyy ooff PPrreettoorriiaa

11
Comparison between different ore types and variations within an ore type in an ore
body.
In any comminution system, the relationship between feed size, product size and
energy consumption is needed to extrapolate beyond the test limits. In many cases
the feed size to the full-scale mill, is larger than the samples available or treatable in
the test program. In the case of Foskor, the feed size to the pilot mills was limited to
30 mm, but the feed size to the large mill is 80 mm. Since Foskor had been using
cone crushers at the time to crush the material from 80 mm to 10 mm, the data from
these crushers were used to extrapolate from a feed size of 30 mm to 80 mm. It was
expected that to crush the material from 80 mm to 30 mm in a Horomill would use
less energy than a cone crusher, with the result that a mistake would lead to a slight
over-design of the Horomill. This could be justified, given the risk of the project. Any
additional production would have been to the benefit of Foskor. However, if it is
known from small tests how much energy is needed, the scale-up can be done more
accurately. If there are good enough correlations between the batch press and the
pilot mill, the test can include larger particles. This will also solve another problem. It
is not known what the influence of the full scale feed size on the product size is.
Increasing the feed size causes a less dense bed that could have an influence on the
comminution process. It is not possible to test this on a pilot plant.
The determination of the bed pressure in a roller mill is an issue that has not yet been
solved. The pressure presently measured is the force of the roller on the bed of
particles divided by the product of the width and length of roller. The total force can be
measured, but the definition of the area or the description of the force distribution is
presently unsatisfactory. At the entrance of the bed, the force is nil and increases to a
maximum where the material is packed to a maximum density. Small and large rollers
have different nip or compression angles and according to Schönert (1988), the
increase in pressure is a function of the compression angle. At present there is no
certainty on how the bed pressure in a large mill should be measured.
With the batch press it is possible to vary the pressure on the bed and do numerous
tests to study the influence of pressure and bed thickness on the fracture behaviour of
the material. It also solves the problem of determining the influence of milling
©© UUnniivveerrssiittyy ooff PPrreettoorriiaa

12
conditions on downstream processes, as different samples can be prepared easily.
Using the batch press, a better understanding of the material may be obtained at a
relatively low cost before embarking on more expensive pilot plant work.
The approach in this study was to determine the relationship between energy
consumption and product size for the particular material and size range. The Rosin-
Rammler description will be compared to other similar descriptions to determine if the
accuracy of the particle size distribution of a sample can be improved.
1.2.4 SUMMARY
To simulate inter-particle crushing processes, an energy relationship between the
feed size and product size must be determined. Tests must indicate whether the size
ranges as stated by Hukki can be used or whether it will be different for inter-particle
crushing. To describe the particle size distribution of the products, the Rosin-Rammler
relationship will be compared with other sigmoidal or S-curve descriptions.
©© UUnniivveerrssiittyy ooff PPrreettoorriiaa
13
CHAPTER 2
COMPARISON BETWEEN THE HOROMILL, LOESCHE MILL AND THE BATCH PRESS
2.1 INTRODUCTION
The main requirements for a comparative test between comminution devices of this
nature are:
Good sampling practices to ensure that the material tested in the press and mill is
the same.
The material must be milled to the same range of product sizes.
The product sizes must stretch from coarser to finer than the liberation size of the
minerals. The energy required to mill material from coarser to just finer than the
liberation size, can increase suddenly as a result of the higher competency of
single mineral particles.
It is good practice to compare materials of different characteristics such as hard
and soft materials, as well as coarse and fine-grained material.
Although not a specific requirement, it is a good idea to also evaluate the influence of
the milling process on the downstream processing of the material, for example the
influence of fines creation on flotation performance.
To fulfil these requirements four types of materials were tested:
A mixed sulphide ore from the Rosh Pinah mine. This is an ore of medium
hardness that typically have to be crushed to between 150m and 50m as the
liberation size of the various minerals varies from 106 to 75m.
Titanium slag, which is very soft and which should be crushed to a top size of
850 m with the specific requirement that the -106m fraction must be minimized.
Apatite ore from Foskor. This is a coarse grained ore of medium hardness. The
main reason for using this ore is that it has been well researched in not only a
Horomill but also a pilot ball mill.
Banded iron stone with a liberation size of less than 100m.
©© UUnniivveerrssiittyy ooff PPrreettoorriiaa
14
The objectives of the tests were to compare the batch press with a roller mill with
regard to energy consumption, particle size distributions of the products and
circulating load. The validity of Bond’s law, Rittinger’s law and the Rosin-Rammler
descriptions of particle size distributions will be tested with the results obtained in the
tests.
2.2 METHODOLOGY TO DETERMINE THE VALUE OF OPERATING WORK INDEX AND THE ENERGY VERSUS REDUCTION RATIO RELATIONSHIP
The method used to determine the values is based on the fact that the value of the
operating work index equals the amount of energy to crush and mill material from a
very large feed size to an 80% mass passing product size of 100 µm. Therefore this
is a constant for the material. This is then calculated for each data point using
equation 7 and a guessed value for the coefficient n. The value of n is changed until
all the calculated operating indices are the same. If this is achieved, it means that the
value of the coefficient is valid for all sizes from the smallest product size tested to the
feed size. If it is not achieved, one reason could be that the value of the coefficient n
is different for the feed size and the product size. This can be understood if
remembering that the graph in figure 1 implies this value changes with product size.
The value of OWi*100n/F80n is the amount of energy required to crush material from a
very large size to the particular F80. However, this will make predictions even more
difficult because now two values must be guessed. Another reason could be that the
relationship between energy and product size, while material is still being nipped into
the gap, is different from that achieved when material is being crushed in the gap
between the rollers.
2.3 EXPERIMENTAL SETUP
A pilot plant Horomill, a pilot plant Loesche mill, a laboratory roller mill and a batch
press were used for the experiments, details of which will be given in the following
paragraphs.
©© UUnniivveerrssiittyy ooff PPrreettoorriiaa

15
2.3.1 BATCH PRESS
The batch press consists of a cylinder with inside dimensions of 150 mm deep by 140
mm inside diameter as shown in figure 2 and a piston with an inside diameter of 138
mm and a height of 200 mm.
The presses were all fitted with load cells and displacement gauges and all the data
were recorded. A 24-mV signal was sent to a personal computer where the force and
displacement were recorded as an ASCII file. The bed of ore was compressed by
controlling the maximum pressure applied.
Figure 2: Schematic representation of the batch press.
Lower bed
Load cell
Piston
Cylinder
Ore sample
Hydraulic
Cylinder
200 mm
138 mm
50 mm
240 mm
50 mm
50 mm
250 mm
©© UUnniivveerrssiittyy ooff PPrreettoorriiaa

16
The tests were done as follows:
The cylinder was filled with a certain amount of material, approximately 1 kg, and
the material pressed to the desired pressure. It was important not to handle the
material extensively or vibrate it as this caused segregation.
The material was removed, screened on a limiting screen, recording the mass of
the coarse and fine fractions. Fresh feed was added to the coarse fraction to keep
the amount of ore in the cylinder at 1 kg and homogenising by mixing in a bowl
with a spatula taking care to prevent segregation of the material.
The process was repeated until the mass of the fine fraction remained constant.
Five to eight repetitions were normally necessary to achieve this.
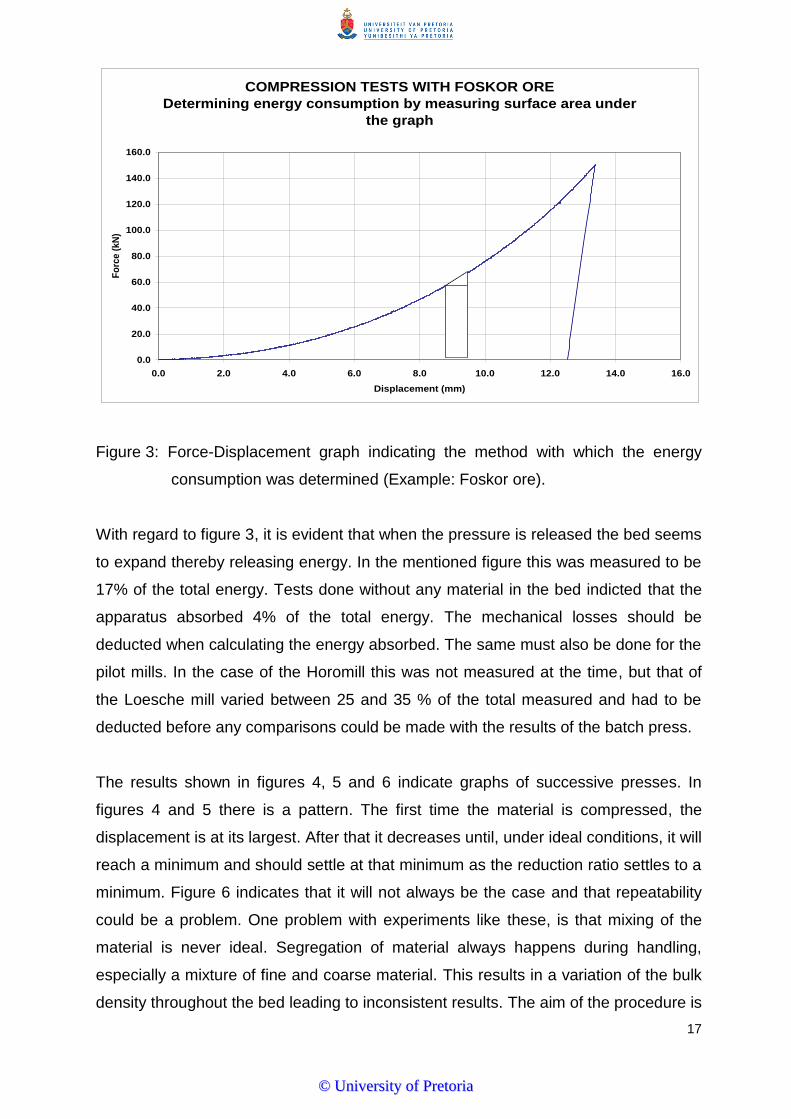
Typical results obtained are shown in figures 3 to 5. In figure 3 it is shown how the
energy was calculated.
Energy consumption was determined using the formula: energy equals force times
distance. From a plot of force versus displacement this can be determined as the
energy equals the surface area under the graph. This was done by determining the
surface areas between discrete data points as shown in figure 6. The rectangular and
triangle in the graph indicates the area between two sets of data points. As there are
more than a thousand data points, the discrete areas are very small. Using this
method will be as accurate and even more than trying to integrate the formula of the
graph.
©© UUnniivveerrssiittyy ooff PPrreettoorriiaa
17
Figure 3: Force-Displacement graph indicating the method with which the energy
consumption was determined (Example: Foskor ore).
With regard to figure 3, it is evident that when the pressure is released the bed seems
to expand thereby releasing energy. In the mentioned figure this was measured to be
17% of the total energy. Tests done without any material in the bed indicted that the
apparatus absorbed 4% of the total energy. The mechanical losses should be
deducted when calculating the energy absorbed. The same must also be done for the
pilot mills. In the case of the Horomill this was not measured at the time, but that of
the Loesche mill varied between 25 and 35 % of the total measured and had to be
deducted before any comparisons could be made with the results of the batch press.
The results shown in figures 4, 5 and 6 indicate graphs of successive presses. In
figures 4 and 5 there is a pattern. The first time the material is compressed, the
displacement is at its largest. After that it decreases until, under ideal conditions, it will
reach a minimum and should settle at that minimum as the reduction ratio settles to a
minimum. Figure 6 indicates that it will not always be the case and that repeatability
could be a problem. One problem with experiments like these, is that mixing of the
material is never ideal. Segregation of material always happens during handling,
especially a mixture of fine and coarse material. This results in a variation of the bulk
density throughout the bed leading to inconsistent results. The aim of the procedure is
COMPRESSION TESTS WITH FOSKOR ORE
Determining energy consumption by measuring surface area under
the graph
0.0
20.0
40.0
60.0
80.0
100.0
120.0
140.0
160.0
0.0 2.0 4.0 6.0 8.0 10.0 12.0 14.0 16.0
Displacement (mm)
Fo
rce
(kN
)
©© UUnniivveerrssiittyy ooff PPrreettoorriiaa

18
to reach a stable state where the amount of energy per mass new product should be
constant. Another factor that influenced the repeatability is the so called stiffness of
the hydraulic system. Hydraulic systems do have inconsistency due to expansion of
hydraulic hoses and valves. The presses used in the work with Foskor ore were not
designed to be used with ore, but was available at Kumba as part of the steel testing
facility. The one used at AARL was designed for the purpose of testing ore. When
designing a press of this nature, stiffness must be maximised. If the inconsistency in
the graphs is too big the experiments must be repeated, making sure experimental
errors are kept to a minimum. The number of presses should also be increased until
repeatability is achieved.
Figure 4: Force–displacement graphs obtained in compression tests on Foskor ore
at a pressure of 50 kN indicating the graphs of progressing presses.
Between presses the minus 300 µm material was removed with a screen.
COMPRESSION TESTS WITH FOSKOR ORE
50kN and 300um Screen
0.0
10.0
20.0
30.0
40.0
50.0
60.0
0.0 2.0 4.0 6.0 8.0 10.0 12.0 14.0
Displacement (mm)
Fo
rc
e (
kN
)
1st 2nd 3rd 4th 5th
1st to 5th Press
©© UUnniivveerrssiittyy ooff PPrreettoorriiaa

19
Figure 5: Force–displacement graphs obtained in compression tests on Foskor ore
at a pressure of 150 kN indicating the graphs of progressing presses.
Between presses the minus 300 µm material was removed with a screen.
Figure 6: Force–displacement graphs obtained in compression tests on Foskor ore
at a pressure of 400 kN indicating the graphs of progressing presses.
Between presses the minus 300 µm material was removed with a screen.
COMPRESSION TESTS WITH FOSKOR ORE
150kN and 300um Screen
0.0
20.0
40.0
60.0
80.0
100.0
120.0
140.0
160.0
0.0 2.0 4.0 6.0 8.0 10.0 12.0 14.0 16.0 18.0
Displacement (mm)
Fo
rce
(kN
)
1st 2nd 3rd 4th 5th
1st to 5th Press
COMPRESSION TESTS WITH FOSKOR ORE
400kN and 300um Screen
0.0
50.0
100.0
150.0
200.0
250.0
300.0
350.0
400.0
450.0
10.0 11.0 12.0 13.0 14.0 15.0 16.0 17.0 18.0 19.0 20.0
Displacement (mm)
Fo
rc
e (
kN
)
1 2 3 4 5
1
2 34
4
5
©© UUnniivveerrssiittyy ooff PPrreettoorriiaa

20
2.3.2 PILOT HOROMILL
The detail of the test is given in the report by FCB on the project (Evrard and
Cordonnier, 1995). The experimental set-up consisted of:
Five-ton feed hopper.
Feed conveyor with installed belt scale.
Horomill.
Feed conveyor to TSV air classifier.
Coarse fraction recycle conveyor with installed belt scale.
Fine fraction pneumatic conveying to a bag house.
The Horomill (see figure 53) used in this study consisted of a shell of 0.8 m diameter
by 1 m long. Inside the mill a roller was installed onto which pressure was applied by
a set of hydraulic cylinders. The shell was driven by an electric motor and gearbox.
Material was fed into the feed end, pressed between the roller and shell and as the
bed was compressed to a cake, it was loosened by a set of scrapers inside the mill
before being pressed again. This technique enabled the mill to press the material
three to five times before exiting the mill. The material was fed to the Horomill at feed
rates that varied between 1.97 and 3.71 dry ton per hour at a top size of 30 mm and
an 80% mass passing size of 16 mm. Pressures varied between 25 and 30 bar
hydraulic pressure that gave approximately 30 MPa pressure on the bed. The latter
figure was calculated by the FCB and they did not reveal the way they did it, as it was
sensitive information at the time.
2.3.3 PILOT LOESCHE MILL AT AARL
The setup at AARL was as follows for the Rosh Pinah, titanium slag and iron ore
tests:
The mill consisted of two 200 mm diameter rollers applying pressure onto a
320 mm diameter table (see figure 51 and 52)
The mill was fed from a bin with a conveyor equipped with a scale.
©© UUnniivveerrssiittyy ooff PPrreettoorriiaa

21
The product was swept from the table by an air stream and transported through
the internal classifier to a cyclone and bag house. The oversize joined the feed on
the table.
The total energy consumption used during each test was measured by a torque
converter that was installed on the drive shaft of the mill.
For the milling of the titanium slag an 850 m aperture external screen was
installed and the oversize was added to the feed.
Samples were taken of the feed, circulating load and final product at regular
intervals.
The feed rate to the mill varied between 0.22 to 0.34 dry tons per hour for the
Rosh Pinah ore and 0.3 tons per hour for the slag.
Top size of Rosh Pinah ore varied between 10 and 3 mm. That of the slag was 5
mm.
The top size of the banded iron stone varied between 5 and 3 mm and the feed
rate was 0.3 ton per hour.
The hydraulic pressures applied varied between 115 and 200 Bar. Unfortunately
the specific pressure could not be measured due to lack of information by the
manufacturer to convert the hydraulic pressure to specific pressure.
2.4 RESULTS AND DISCUSSION
2.4.1 COMPARISON BETWEEN THE ENERGY CONSUMPTION OF THE BATCH
AND PILOT MILLS
2.4.1.1 FOSKOR ORE
Figures 7 to 9 illustrate the operating work index and the energy consumption
required to crushed Foskor ore from a top size of 30 mm to product sizes smaller than
500 µm in the Horomill and from 10 mm to smaller than 500 µm in the batch press.
These graphs indicate operating work index and the energy consumption as a
function of product size for 80% mass passing size, 50% mass passing size and 25%
mass passing size. In figure 10, the operating work index and energy consumption
are shown when milling Foskor ore in a pilot plant ball mill. This was from tests done
©© UUnniivveerrssiittyy ooff PPrreettoorriiaa

22
at FCB and is taken from Evrard and Cordonnier (1995). The product size in this
graph is defined as the 80% mass passing size. The experimental data and the
calculated energy consumption are shown to indicate to what extent the calculated
energy correlates with the experimental data.
Figure 11 is a plot of reduction ratio as a function of energy consumption for the
Horomill and the batch press.
Table1 summarises the results from these tests.
Figure 7: Energy consumption and operating work index plotted as a function of the
P80 obtained with the Horomill and batch press on apatite ore from Foskor.
Energy Consumption and Operating Work Index plotted as a
function of Product Size P80 for Foskor Ore
0.0
1.0
2.0
3.0
4.0
5.0
6.0
7.0
8.0
9.0
10.0
11.0
12.0
0.0 100.0 200.0 300.0 400.0 500.0
P80 (um)
En
erg
y C
on
su
mp
tio
n (
kW
h/t
)
Horomill(experimental data)l Batch Press(experimental data) OWi(Horomill)
OWi(Batch Press) Horomill(calculated energy) Batch Press(calculated energy)
EHoromill = 9.5*1001.01
(1/P1.01
-1/F1.01
)
EBatch Press = 5.3*1000.24
(1/P0.24
-1/F0.24
)
©© UUnniivveerrssiittyy ooff PPrreettoorriiaa

23
Figure 8: Energy consumption and operating work index plotted as a function of the
P50 obtained with the Horomill and batch press on apatite ore from Foskor.
Figure 9: Energy consumption and operating work index plotted as a function of the
P25 obtained with the Horomill and batch press on apatite ore from Foskor.
Energy Consumption and Operating Work index plotted as a
function of Product Size P50 for Foskor Ore
0.0
1.0
2.0
3.0
4.0
5.0
6.0
7.0
8.0
9.0
10.0
0.0 50.0 100.0 150.0 200.0 250.0 300.0
P50 (um)
En
erg
y C
on
su
mp
tio
n(k
Wh
/t)
Horomill(experimental data) Batch Press(experimental data) OWi(Horomill)
Horomill(calculated energy) Batch Press(calculated energy) OWi(Batch Press)
EHoromill = 7.5*1002.3
(1/P2.3
-1/F2.3
)
)
EBatch Press = 4.7*1000.85
(1/P0.85
-1/F0.85
)
Energy Consumption and Operating Work index plotted as a
function of Product Size P25 for Foskor Ore
0.0
1.0
2.0
3.0
4.0
5.0
6.0
0.0 50.0 100.0 150.0
P25 (um)
En
erg
y
Co
ns
um
pti
on
(kW
h/t
)
Horomill(experimental data) Batch Press(experimental data)
OWi(Horomill) Horomill(calculated energy)
Batch Press(calculated energy) OWi(Batch Press)
EHoromill = 2.4*1000.82
(1/P0.82
-1/F0.82
)
EBatch Press = 3.74*1000.68
(1/P0.68
-1/F0.68
)
©© UUnniivveerrssiittyy ooff PPrreettoorriiaa

24
Figure 10: Plot of energy consumption and operating work index plotted as a function
of product size and for Foskor ore in a pilot ball mill.
Figure 11: Relationship between reduction ratio and energy consumption for Foskor
ore.
Energy Consumption and Operating Work index plotted as a
function of Product Size P80 for Foskor Ore
Energy = 12.0*1001.05
(1/P1.05
-1/F1.05
)
0.0
2.0
4.0
6.0
8.0
10.0
12.0
14.0
0.0 200.0 400.0 600.0 800.0
P80 (um)
En
erg
y C
on
sum
pti
on
(kW
h/t
)
Ball Mill(experimental data) OWi(ball mill) Ball Mill(calculated energy)
Reduction Ratio as a function of Energy Consumption for Foskor Ore
F50/P50Horomill = 11.7E0.45
+1
F50/P50Batch= 1.61E0.59
+1
0.0
5.0
10.0
15.0
20.0
25.0
30.0
0.0 1.0 2.0 3.0 4.0 5.0 6.0
Energy Consumption (kWh/ton
Red
ucti
on
Rati
o (
F5
0/P
50)
Horomill Batch Press
©© UUnniivveerrssiittyy ooff PPrreettoorriiaa

25
Table 1: Values of operating work indices and coefficient n for Foskor ore as well
as the constants needed to describe the reduction ratio versus energy
relationship.
Values of OWi and n for the Loesche mill, batch press and ball mill
Horomill
F80
(µm)
F50
(µm)
F25
(µm)
P80
(µm)
P50
(µm)
P25
(µm)
OWi N OWi n OWi n
15300 3000 493 9.51 1.05 7.5 2.31 2.01 0.82
Batch press
F80
(µm)
F50
(µm)
F25
(µm)
P80
(µm)
P50
(µm)
P25
(µm)
OWi N OWi n OWi n
2008 620 270 5.33 0.24 4.7 0.85 3.74 0.68
Ball Mill
Owi n
12 1.05
Values describing the reduction ratio vs. energy relationship
Horomill Batch press
F50
(µm)
a n F50
(µm)
a n
3000 11.7 0.45 620 1.62 0.59
Comparison with the Bond/Rittinger formula and the suggested prediction of
Kapur et al (1990), and Daniel (2001)
The first question to be answered, is to what extent the results compare with the
formulas suggested by Bond and Rittinger. Bond postulated that energy is a function
of 1/Pn where n equals 0.5 and Rittinger suggested that n equals 1. The results
actually show the following:
©© UUnniivveerrssiittyy ooff PPrreettoorriiaa

26
From figure 7 and table 1 in the case of 80% mass passing size of the product the
value of n for the Horomill is 1.01 and for the batch press 0.24. From figure 8 and
table 1 for the 50% mass passing size it is 2.31 and 0.85 respectively and for 25%
mass passing size in figure 9 and table 1 these values are 0.82 and 0.68. No
trends can be derived from these data.
From figure 10, the results from the pilot plant ball mill show that the value of n
equals 1.05. So even for a pilot ball mill this value differs from what Bond
postulated.
The operating work indices for 80% mass passing size are 9.51 kWh/ton for the
Horomill and 5.33 kWh/ton for the batch press. For 50% mass passing size these
are 7.50 kWh/ton and 4.7 kWh/ton and for 25% mass passing size, 2.41 kWh/ton
and 3.74 kWh/ton.
Kapur et al (1990), as well as Daniel (2001), suggested that the reduction ratio for
roller mills can be described as a function of (energy) n where n equals 1. The value of
n for the Horomill is 0.45 and 0.59 for the batch press. This can be seen in figure 11.
The value of n for the Horomill is not near the suggested value of 1.0. If the reduction
ratio-energy relationship is to be used, the batch press can not predict this
relationship for the Horomill.
Comparison between Horomill and batch press.
Figure 7 indicates that the operating work index for the Horomill is 9.51 kWh/ton
and 5.33 kWh/ton for the batch press. The values of the coefficient are 1.01
versus 0.24. If there was a constant relationship between the work indices
obtained from the Horomill and batch press, this could be used as a scale-up
factor. The problem however, is the values of the coefficients are too far apart and
therefore, in this case, the results from the batch press cannot be used to simulate
the Horomill.
In the case of the 50% mass passing size from figure 8 the work indices are
7.5 kWh/ton for the Horomill and 4.7 kWh/ton for the batch press. For the Horomill
the values of the coefficient equals 2.31 and for the batch press 0.85. Again, the
differences are too large for the batch press to be used as a simulator.
©© UUnniivveerrssiittyy ooff PPrreettoorriiaa

27
Figure 9 shows that when using the 25% mass passing size the energy
consumption of the batch press and the Horomill differ too. The operating work
indices are 2.01 kWh/ton for the Horomill and 3.74 kWh/ton for the batch press.
For the Horomill the values of the coefficient n equals 0.82 and for the batch press
0.68. One word of caution about using the 25% mass passing size or smaller, in
many cases this particle size is smaller than 38 m and screening below this size
is not practical and inaccurate.
2.4.1.2 ROSH PINAH ORE
Figures 12 to 15 indicate the relationship between product size and energy
consumption for the Loesche pilot mill and the batch press. This is done for 80% and
50% mass passing sizes. No 25% mass passing sizes was used as this was less
than 10 m. Figure 16 indicates the energy consumption of the mill and the operating
work indices for the ball mill at Rosh Pinah. Only the trend line for the energy
consumption is shown to keep the graph readable. This information is from data
gathered by the author during a study done on this mill in 2002. This graph was
added to emphasize that even with ball mills Bond‘s law does not always apply.
Figures 17 to 18 indicate the relationship between reduction ratio and energy
consumption to compare the data with the prediction of Kapur et al (1990), and Daniel
(2001). In table 2 the values of OWi and n are shown.
©© UUnniivveerrssiittyy ooff PPrreettoorriiaa

28
Figure 12: Operating work index plotted as a function of P80 passing size for the
product of the pilot Loesche mill and batch press on Rosh Pinah ore.
Figure 13: Energy consumption as a function of the P80 obtained with the pilot
Loesche mill on Rosh Pinah ore.
Operating Work Index plotted as a function of Product Size P80 for
Rosh Pinah Ore
0.0
1.0
2.03.0
4.0
5.0
6.0
7.0
8.09.0
10.0
11.0
12.0
0.0 50.0 100.0 150.0 200.0
P80(um)
Op
era
tin
g W
ork
In
de
x (
kW
h/t
)
LM 3 mm top size LM 5 mm top size LM 10mm top size
BP 3 mm top size BP 5 mm top size BP 10 mm top size
Energy Consumption plotted as a function of Product Size P80 for
Rosh Pinah Ore
0.0
2.0
4.0
6.0
8.0
10.0
12.0
14.0
16.0
0.0 50.0 100.0 150.0 200.0
P80(µm)
En
erg
y
Co
ns
um
pti
on
(kW
h/t
)
LM 3 mm top size LM 5 mm top size
LM 10 mm top size LM 3 mm top size(calculated energy)
LM 5 mm top size(calculated energy) LM 10 mm top size(calculated energy)
BP 3 mm top size BP 5 mm top size
BP10 mm top size BP 3 mm top size(calculated energy)
BP 5 mm top size(calculated energy) BP 10 mm top size(calculated energy)
ELM3mm = 6.68*1001.10
(1/P1.10
-1/F1.10
)
ELM5mm = 7.68*1001.22
(1/P1.22
-1/F1.22
)
ELM10mm =9.89*1001.36
(1/P1.36
-1/F1.36
)
EBP3mm = 2.67*1000.77
(1/P0.77
-1/F0.77
)
EBP10mm = 3.04*1000.68
(1/P0.68
-1/F0.68
)
EBP5mm = 3.04*1000.65
(1/P0.65
-1/F0.65
)
©© UUnniivveerrssiittyy ooff PPrreettoorriiaa

29
Figure 14: Operating work index plotted as a function of P50 passing size for the
product of the pilot Loesche mill and batch press on Rosh Pinah ore.
Figure 15: Energy consumption as a function of the P50 obtained with the pilot
Loesche mill on Rosh Pinah ore.
Operating Work Index plotted as a function of Product Size P50 for
Rosh Pinah Ore
0.0
1.0
2.0
3.0
4.0
5.0
0.0 25.0 50.0 75.0 100.0
P50(um)
Op
era
tin
g W
ork
In
dex (
kW
h/t
)
BP 3 mm top size 5 BP mm top size BP 10 mm top size
LM 3 mm top size LM 5 mm top size LM 10 mm top size
Energy Consumption plotted as a function of Product Size P50 for
Rosh Pinah Ore
2.0
7.0
12.0
17.0
0.0 10.0 20.0 30.0 40.0 50.0 60.0
P50(um)
En
erg
y C
on
su
mp
tio
n (
kW
h/t
)
BP 3 mm top size BP 5 mm top size
BP 10 mm top size BP 3 mm top size(calculated energy)
BP 5 mm top size(calculated energy) BP 10 mm top size(calculated energy)
LM 3 mm top size LM 5 mm top size
LM 10 mm top size LM 3 mm top size(calculated energy)
LM 5 mm top size(calculated energy) LM 10 mm top size(calculated energy)
EBP3mm = 1.69*1000.79
(1/P500.79
-1/F500.79
)
EBP10mm = 1.77*1000.79
(1/P500.79
-1/F500.79
)
EBP5mm = 1.73*1000.79
(1/P500.79
-1/F500.79
)
ELM3mm = 3.37*1000.83
(1/P0.83
-1/F0.83
)
ELM5mm = 3.43*1000.95
(1/P0.95
-1/F0.95
)
ELM10mm = 4.42*1000.95
(1/P0.95
-1/F0.95
)
©© UUnniivveerrssiittyy ooff PPrreettoorriiaa

30
Figure 16: Energy consumption and operating work indices plotted as a function of
P80 passing size for the product of the Rosh Pinah ball mill. The latter is for
two different size ranges
Figure 17: Plot of reduction ratio and energy consumption to indicate the values of the
constants a and n in the formula F50/P50 = a*En+1. The plot is for the
Loesche pilot mill
Operating work index plotted as a function of Product size P80
for the Rosh Pinah ball mill for different size ranges
0.0
5.0
10.0
15.0
20.0
25.0
30.0
35.0
0.0 20.0 40.0 60.0 80.0 100.0 120.0 140.0
P80(µm)
Op
erat
ing
wo
rk in
dex
(kW
h/t
on
)
60 to 120 µm 100 to 120 µm
Energy consumption from plant data Power (Energy consumption from plant data)
60 to 120 µm: n = 0.18
Owi = 19.9
100 to 120 µm: n = 0.72
Owi = 11.1
Rosh Pinah Ore:Plot of Reduction Ratio as a function of Energy
Consumption for the Loesche Mill
F50/P50(3mm) = 4.6*Energy1.04
+1
F50/P50(5mm) = 1.5*Energy1.14
+1
F50/P50(10mm) = 16.8*Energy0.66
+1
0.0
20.0
40.0
60.0
80.0
100.0
120.0
140.0
160.0
180.0
200.0
0.0 5.0 10.0 15.0 20.0 25.0
Energy Consumption (kWh/ton)
Re
du
cti
on
Ra
tio
F5
0/P
50
Loesche Mill 3 mm Feed Loesche Mill 5 mm Feed Loesche Mill 10 mm Feed
©© UUnniivveerrssiittyy ooff PPrreettoorriiaa

31
Figure 18: Plot of reduction ratio and energy consumption to indicate the values of the
constants a and n in the formula F50/P50 = a*En+1. This is for the pilot batch
press.
Table 2: Values of operating work indices and coefficient n for the Loesche mill and
batch press on Rosh Pinah ore.
Values of OWi and n for the Loesche mill and batch press
Top
size
Loesche mill Batch press
F80(µm) F50(µm) P80 P50 F80(µm) F50(µm) P80 P50
OWi n OWi n OWi n OWi n
3 mm 1500 530 6.68 1.10 3.33 0.83 1500 530 2.67 0.77 1.69 0.79
5 mm 3000 1600 7.18 1.22 3.43 0.95 3000 1600 3.04 0.65 1.73 0.80
10 mm 5800 3350 9.89 1.36 4.42 0.95 5800 3350 3.04 0.68 1.71 0.79
Comparison with the Bond/Rittinger formula and the suggested prediction of
Kapur et al (1990), and Daniel (2001)
The values of n for the Loesche mill, (80 % mass passing size), are quite different
from that predicted by Bond and even higher than that predicted by Rittinger. The
Rosh Pinah Ore:Plot of Reduction Ratio as a function of Energy
Consumption for the Batch Press
F50/P50(3mm) = 3.4*Energy1.15
+1
F50/P50(5mm) = 8.3*Energy1.27
+1
F50/P50(10mm) =19.6*Energy1.15
+1
0.0
20.0
40.0
60.0
80.0
100.0
120.0
140.0
0.0 1.0 2.0 3.0 4.0 5.0
Energy Consumption (kWh/ton)
Re
du
cti
on
Ra
tio
F5
0/P
50
Batch press 3 mm Feed Batch press 5 mm Feed Batch press 10 mm Feed
©© UUnniivveerrssiittyy ooff PPrreettoorriiaa

32
values of n for the batch press are almost identical for the 80% and 50% mass
passing size and is also different from that predicted by Bond and Rittinger
When studying figures 12 to 14 it is clear that the values of OWi, although
scattered, are constant for the range of product sizes in which the tests were
conducted. As with Foskor ore, this leads to the conclusion that the formula
E = OWi(100n)(1/Pn-1/Fn), is a valid description of the energy, product size and
feed size relationship.
Figure 16 is the calculated operating work index for the ball mill at Rosh Pinah.
Two graphs are shown, for all the product sizes, 80% mass passing size of 60 to
120 µm and for the range 100 to 120 µm 80% mass passing product sizes. The
operating work index for the total range of data is 19.9 kWh/ton and the value of
the coefficient is 0.18. The values for only the 100 to 120 µm are 11.2 kWh/ton
and 0.78. The latter operating work index is a good figure as the energy to crush
the material at the plant from 80 % mass passing sizes of 80000 µm to 5460 µm is
1.7 kWh/ton. If this is added to the energy required by the ball mill to mill the ore to
a P80 of 100 µm, 10.0 kWh/ton, from figure 16, a work index of 11.7 kWh/ton is
expected. However, the value of 0.72 for the coefficient is quite different from what
is expected from a Bond prediction.
The values of the constants a and n in the model of Kapur et al (1990), and
Daniel (2001), are shown in table 3.
Table 3: Values of the constants a and n in the formula describing reduction ratio
as a function of energy.
Values of a and n in the formula F50/P50 = a*En+1
Top Size Loesche mill Batch press
a n A n
3 mm 1.5 1.14 3.4 1.15
5 mm 4.6 1.04 8.3 1.27
10 mm 16.8 0.55 19.6 1.15
These results indicate that the value of n for both the Loesche mill and batch press
are similar except for the 10 mm top size and not too far from the suggested value
of 1. The value of a differs with top size and between the Loesche pilot mill and batch
©© UUnniivveerrssiittyy ooff PPrreettoorriiaa
33
press. If the model suggested by Kapur et al (1990), and Daniel (2001), for roller
crushers is valid, the value of the constant a should be constant. This suggests that
their proposal do not apply for the medium pressure roller crushers.
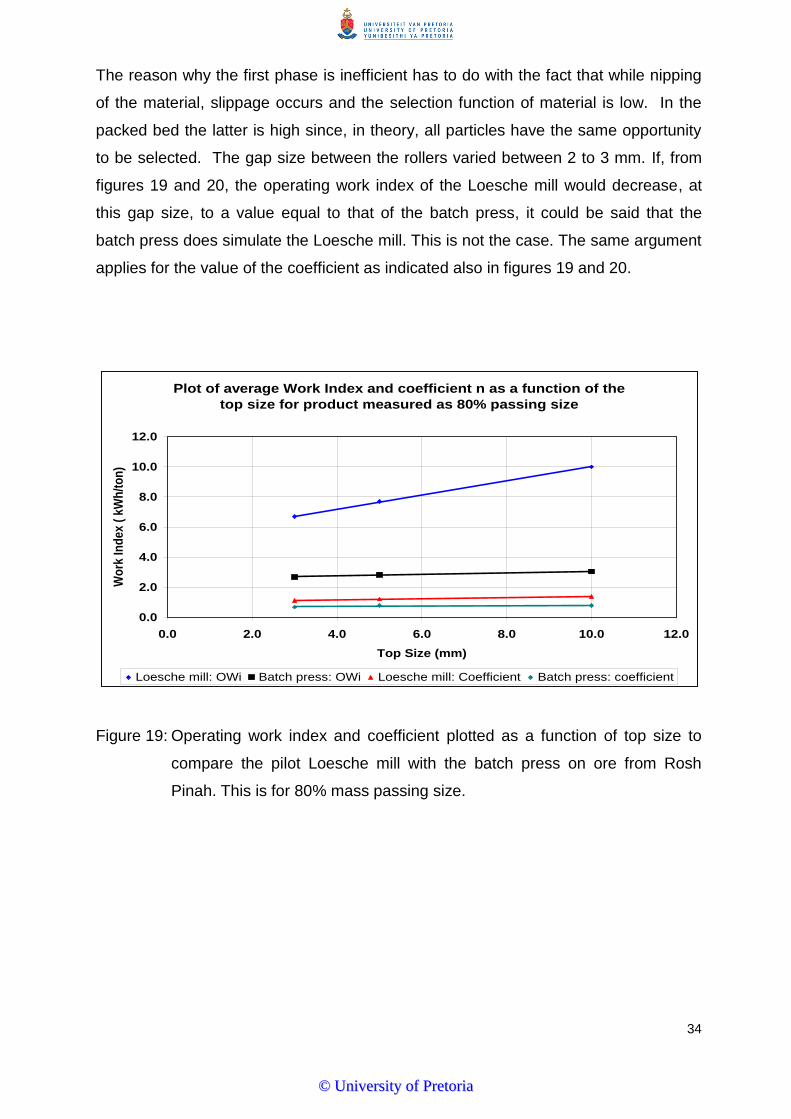
Comparison between the Loesche mill and the batch press.
In figures 12 to 15 the Loesche pilot mill is compared with the batch press. From
these figures and table 2 for 80% mass passing it can be seen that the operating
work index as well as the value of the coefficient of the batch press is much lower
than that of the Loesche mill. The difference between the operating work indices for
the 50% mass passing size is still high although the values of the coefficient for the
Loesche mill and batch press are almost the same. The value of the operating work
index as a function of top size is plotted in figure 19. From this graph the operating
work index decreases with decreasing top size. This does give weight to the model by
Daniel (2001), that there are two phases of breakage, the first when material is being
nipped into the gap and the second when material is being crushed in the packed
bed. The first phase from all these results is the less efficient phase. Roller presses
are low pressure crushers with no packed bed crushing. To confirm that the operating
work index of a roller crusher is high, Rosh Pinah material was crushed in a roller
press. Using equation 6 and the value of the coefficient to be between 1.1 and 1.36,
the same as with the Loesche mill tests, the values of the operating work indices in
table 4 varied between 109.3 and 28.7 for a value of 1.1 for the coefficient and 354.9
to 52.6 for a coefficient of 1.36.
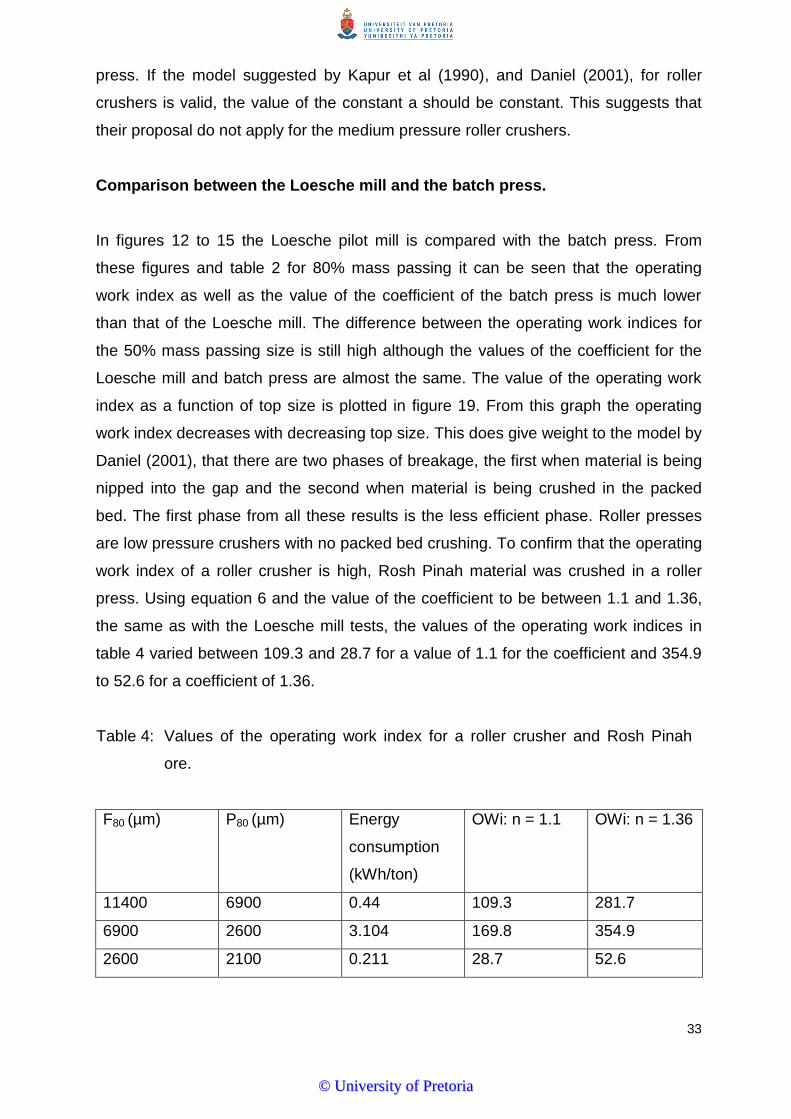
Table 4: Values of the operating work index for a roller crusher and Rosh Pinah
ore.
F80 (µm) P80 (µm) Energy
consumption
(kWh/ton)
OWi: n = 1.1 OWi: n = 1.36
11400 6900 0.44 109.3 281.7
6900 2600 3.104 169.8 354.9
2600 2100 0.211 28.7 52.6
©© UUnniivveerrssiittyy ooff PPrreettoorriiaa
34
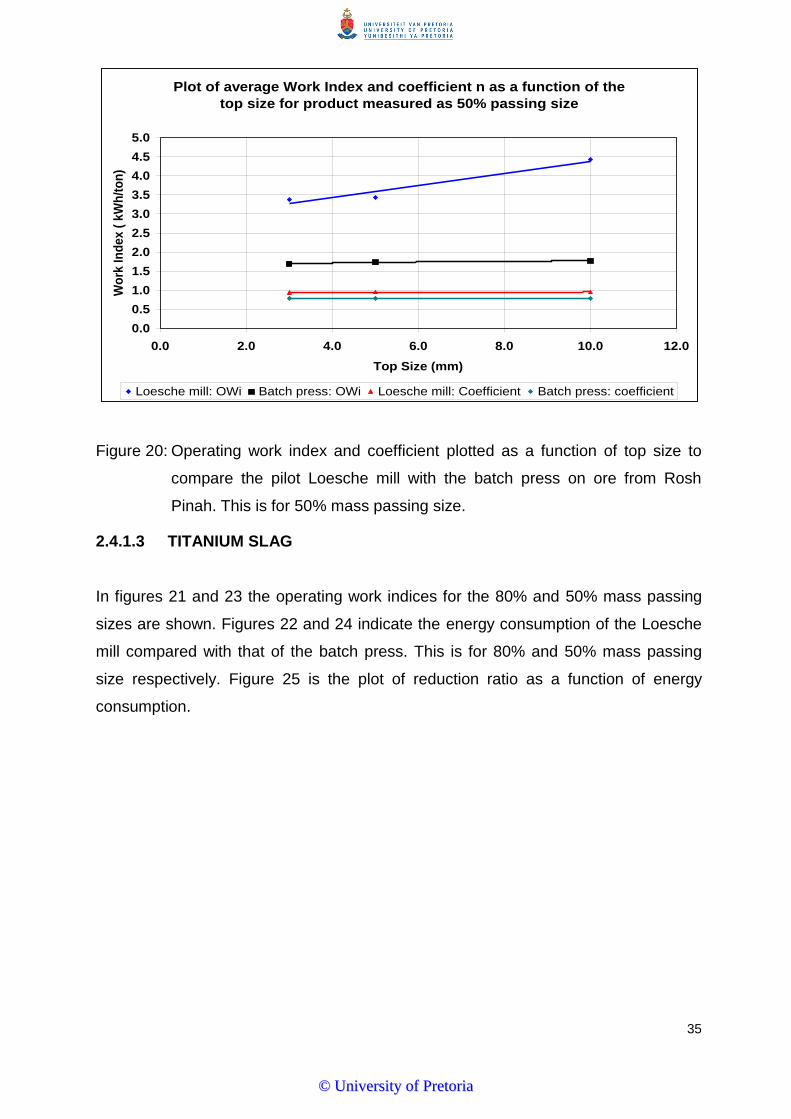
The reason why the first phase is inefficient has to do with the fact that while nipping
of the material, slippage occurs and the selection function of material is low. In the
packed bed the latter is high since, in theory, all particles have the same opportunity
to be selected. The gap size between the rollers varied between 2 to 3 mm. If, from
figures 19 and 20, the operating work index of the Loesche mill would decrease, at
this gap size, to a value equal to that of the batch press, it could be said that the
batch press does simulate the Loesche mill. This is not the case. The same argument
applies for the value of the coefficient as indicated also in figures 19 and 20.
Figure 19: Operating work index and coefficient plotted as a function of top size to
compare the pilot Loesche mill with the batch press on ore from Rosh
Pinah. This is for 80% mass passing size.
Plot of average Work Index and coefficient n as a function of the
top size for product measured as 80% passing size
0.0
2.0
4.0
6.0
8.0
10.0
12.0
0.0 2.0 4.0 6.0 8.0 10.0 12.0
Top Size (mm)
Wo
rk I
nd
ex
( k
Wh
/to
n)
Loesche mill: OWi Batch press: OWi Loesche mill: Coefficient Batch press: coefficient
©© UUnniivveerrssiittyy ooff PPrreettoorriiaa
35
Figure 20: Operating work index and coefficient plotted as a function of top size to
compare the pilot Loesche mill with the batch press on ore from Rosh
Pinah. This is for 50% mass passing size.
2.4.1.3 TITANIUM SLAG
In figures 21 and 23 the operating work indices for the 80% and 50% mass passing
sizes are shown. Figures 22 and 24 indicate the energy consumption of the Loesche
mill compared with that of the batch press. This is for 80% and 50% mass passing
size respectively. Figure 25 is the plot of reduction ratio as a function of energy
consumption.
Plot of average Work Index and coefficient n as a function of the
top size for product measured as 50% passing size
0.0
0.5
1.0
1.5
2.0
2.5
3.0
3.5
4.0
4.5
5.0
0.0 2.0 4.0 6.0 8.0 10.0 12.0
Top Size (mm)
Wo
rk In
dex (
kW
h/t
on
)
Loesche mill: OWi Batch press: OWi Loesche mill: Coefficient Batch press: coefficient
©© UUnniivveerrssiittyy ooff PPrreettoorriiaa

36
Figure 21: Operating work index as a function of 80% mass passing size for the batch
press and the Loesche mill on titanium slag.
Figure 22: Energy consumption as a function of 80% mass passing size for the batch
press and the Loesche mill on titanium slag.
-
5.00
10.00
15.00
20.00
25.00
30.00
35.00
40.00
45.00
0.0 100.0 200.0 300.0 400.0 500.0 600.0 700.0 800.0 900.0
Op
era
tin
g W
ork
In
dex (
kW
h/t
)
P80(µm)
Operating Work Index plotted as a Function of Product Size P80 for Titanium slag
Loesche Mill Batch press
Energy Consumption plotted as a function of Product Size P80 for
Titanium slag
0.0
1.0
2.0
3.0
4.0
5.0
6.0
7.0
0.0 100.0 200.0 300.0 400.0 500.0 600.0 700.0 800.0 900.0
P80(µm)
En
erg
y C
on
su
mp
tio
n(k
Wh
/t)
Loesche Mill Batch press
Loesche Mill(calculated energy) Batch press(calculated energy)
ELoesche Mill = 35*1000.9
*(1/P800.9
-1/F800.9
)
EBatch press = 3.6*1000.5
*(1/P800.5
-1/F800.5
)
©© UUnniivveerrssiittyy ooff PPrreettoorriiaa

37
Figure 23: Operating work index as a function of 50% mass passing size for the batch
press and the Loesche mill on titanium slag.
Figure 24: Energy consumption as a function of 50% mass passing size for the batch
press and the Loesche mill on titanium slag.
Operating Work Index plotted as a Function of Product Size P50 for
Titanium slag
0.0
10.0
20.0
30.0
40.0
50.0
60.0
70.0
0.0 100.0 200.0 300.0 400.0 500.0 600.0
P50(µm)
Op
era
tin
g W
ork
In
de
x
(kW
h/t
)
Loesche Mill Batch press
Energy Consumption plotted as a function of Product Size P50 for
Titanium slag
0.0
1.0
2.0
3.0
4.0
5.0
6.0
7.0
0.0 100.0 200.0 300.0 400.0 500.0 600.0
P50(µm)
En
erg
y C
on
su
mp
tio
n(k
Wh
/t)
Loesche Mill Batch press
Loesche Mill(calculated energy) Batch press(calculated energy)
ELoesche Mill= 55*1000.06
(1/P500.06
-1/F500.06
)
EBatch press= 5.55*1001.4
(1/P501.4
-1/F501.4
)
©© UUnniivveerrssiittyy ooff PPrreettoorriiaa

38
Figure 25: Plot of reduction ratio to energy consumption for titanium slag using 50%
mass passing size as the product size.
The following comments can be made from the results:
In figure 21 it can be seen that the operating work index is a constant for both the
Loesche mill and the batch press. However, in figure 23 the operating work index
is not constant for the Loesche mill. This is the best fit that could be obtained. The
value of the coefficient from figure 24 in this case is 0.06, an extremely low value.
If the value of the operating index were to be more constant, the value of the
coefficient must be even lower. For comparison with the batch press it is not
important how much lower this value is, as it is already significant smaller than the
value of 1.4 for the batch press.
From figures 22 and 24, the values of the operating work indices for the Loesche
mill are 35 kWh/ton and 55 kWh/ton for 80% and 50% mass passing size
respectively. Those for the batch press are 3.6 kWh/ton and 5.6 kWh/ton for 80%
and 50% mass passing size respectively. The differences are too big for the batch
press to be used as a simulator for the Loesche mill.
From figures 22 and 24 the values of the coefficients for the Loesche mill are 0.9
and 0.06 for 80% and 50% mass passing size respectively. Those obtained in the
batch press are 0.5 and 1.4 for 80% and 50% mass passing size respectively.
Plot of Reduction Ratio to Energy Consumption for Titanium slag
F50/P50LM = 0.73E1.75
+1
F50/P50Batch press = 3.4E0.41
+1
0.0
1.0
2.0
3.0
4.0
5.0
6.0
7.0
8.0
9.0
10.0
0.0 1.0 2.0 3.0 4.0 5.0
Energy consumption (kWh/ton)
Re
du
cti
on
Ra
tio
(F
50
/P5
0)
Loesche Mill Batch Press
©© UUnniivveerrssiittyy ooff PPrreettoorriiaa

39
Again the differences are too big for the batch press to be a used as a simulator
for the Loesche mill.
Figure 25 indicates that the coefficient n in the function: F50/P50 = aEn+1 is 1.75 for
the Loesche mill and 0.4 for the batch press. Again, largely different from Kapur et
al (1990), and Daniel’s (2001), suggestions of 1. As with the energy-passing size
relationships, there are large differences between the Loesche mill and batch
press.
2.4.1.4 BANDED IRON STONE
Figures 26 and 28 are the graphs indicating the relationship between operating work
index and products sizes. These are for different top sizes and product sizes as
indicated in the graphs. Two top sizes, 3 mm and 5 mm were tested. The results of
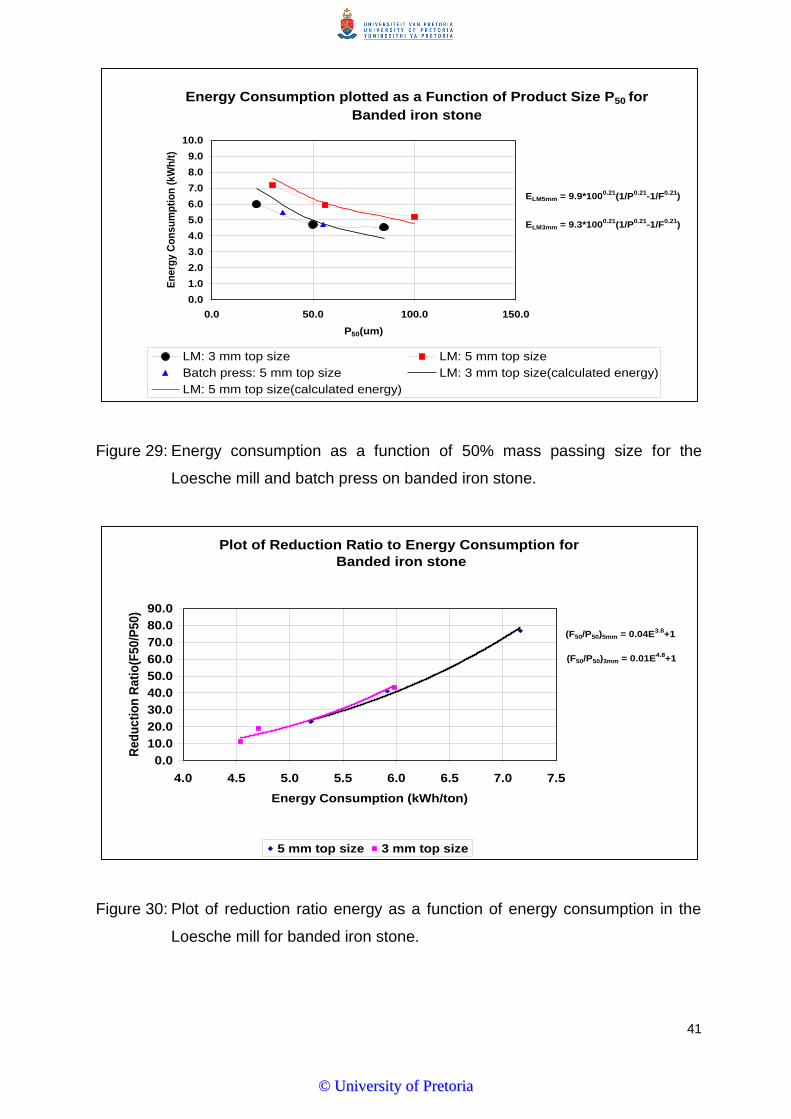
the batch press are also shown. In figures 27 and 29 the relationships between
energy consumption and product size, are illustrated. Figure 30 is the plot of
reduction ratio versus energy consumption for the Loesche mill.
Figure 26: Operating work index plotted as a function of 80% mass passing size for
the Loesche mill and batch press for banded iron stone.
Operating Work Index as a function of Product Size P80 for Banded
iron stone
0.0
2.0
4.0
6.0
8.0
10.0
12.0
14.0
16.0
0.0 50.0 100.0 150.0 200.0 250.0
P80(um)
Op
era
tin
g W
ork
In
de
x (
kW
h/t
on
)
LM:3 mm top size LM:5 mm top size Batch Press:5 mm top size
©© UUnniivveerrssiittyy ooff PPrreettoorriiaa

40
Figure 27: Energy consumption as a function of 80% mass passing size for the
Loesche mill and batch press on banded iron stone.
Figure 28: Operating work index plotted as a function of 50% mass passing size for
banded iron stone.
Energy Consumption plotted as a Function of Product Size P80 for
Banded iron stone
0.0
2.0
4.0
6.0
8.0
10.0
0.0 50.0 100.0 150.0 200.0 250.0
P80(um)
En
erg
y C
on
su
mp
tio
n
(kW
h/t
)
LM:3 mm top size LM:5 mm top size
Batch press: 5 mm top size LM:3 mm top size( calculated energy)
LM:5 mm top size( calculated energy)
ELM5mm = 13.4*1000.21
(1/P0.21
-1/F0.21
)
ELM3mm = 13.2*1000.21
(1/P0.21
-1/F0.21
)
Operating Work index as a function of Product Size P50 for Banded
iron stone
0.0
2.0
4.0
6.0
8.0
10.0
12.0
14.0
16.0
0.0 20.0 40.0 60.0 80.0 100.0 120.0
P50(um)
Op
era
tin
g W
ork
in
de
x (
kW
h/t
on
)
LM:3 mm top size LM:5 mm top size Batch Press:5mm top size
©© UUnniivveerrssiittyy ooff PPrreettoorriiaa
41
Figure 29: Energy consumption as a function of 50% mass passing size for the
Loesche mill and batch press on banded iron stone.
Figure 30: Plot of reduction ratio energy as a function of energy consumption in the
Loesche mill for banded iron stone.
Energy Consumption plotted as a Function of Product Size P50 for
Banded iron stone
0.0
1.0
2.0
3.0
4.0
5.0
6.0
7.0
8.0
9.0
10.0
0.0 50.0 100.0 150.0
P50(um)
En
erg
y C
on
su
mp
tio
n (
kW
h/t
)
LM: 3 mm top size LM: 5 mm top size
Batch press: 5 mm top size LM: 3 mm top size(calculated energy)
LM: 5 mm top size(calculated energy)
ELM5mm = 9.9*1000.21
(1/P0.21
-1/F0.21
)
ELM3mm = 9.3*1000.21
(1/P0.21
-1/F0.21
)
Plot of Reduction Ratio to Energy Consumption for
Banded iron stone
(F50/P50)5mm = 0.04E3.8
+1
(F50/P50)3mm = 0.01E4.8
+1
0.0
10.0
20.0
30.0
40.0
50.0
60.0
70.0
80.0
90.0
4.0 4.5 5.0 5.5 6.0 6.5 7.0 7.5
Energy Consumption (kWh/ton)
Red
ucti
on
Rati
o(F
50/P
50)
5 mm top size 3 mm top size
©© UUnniivveerrssiittyy ooff PPrreettoorriiaa

42
Comparison with the Bond/Rittinger formula and the suggested prediction of
Kapur et al (1990), and Daniel (2001)
The operating work indices and coefficients from figures 27 and 29 are shown in
table 5.
Table 5: Operating work indices and coefficients for banded iron stone.
Values of OWi and n for banded iron stone
Top Size F80 Owi n F50 OWi N
5 mm 3350 13.4 0.21 2300 9.9 0.21
3 mm 1750 13.2 0.21 950 9.3 0.21
Batch press 3350 9.1 0.21 2300 15.7 0.18
The following deductions can be made from the data:
In figures 26 and 28 the calculated operating work indices are shown. The
operating work indices for 80% and 50% mass passing sizes for both the 3 mm
and 5 mm top size are not constant over the range of particle sizes tested. To get
the operating work indices to be constant, the value of the coefficient n must be
reduced to even lower than 0.001. At these low values the value of the operating
index would increase to as high as 2000. This is not a true reflection of the
operating work index. From graph 27, the energy consumption to mill the 3 mm
top size material to 100 µm is 5.5 kWh/ton. In this case the feed size is 1750 µm
80% mass passing size. The energy needed to crush the material from a relative
large feed size to 100 µm equals the operating index of the material. To determine
this energy, it is necessary to add the energy needed to crush the material to 1750
µm. In 2001 Bateman was tasked to do Bond work indices on this material (Cook,
2001). These values range from 20.5 at a P80 of 190 µm to 22.1 at a P80 of 96 um.
Making the assumption that the Bond index is valid to crush the material to 3 mm
and using equation 4, the amount of energy is 5.3 kWh/ton. Adding this to the 5.5
kWh/ton, the total energy to crush and therefore, operating work index would be
10.8 kWh/ton. If this value is then used to determine the value of the coefficient n
from using equation 6, this amounts to 0.18. Similarly, for the top size of 5 mm the
value of n would be 0.13. In figure 27 it is clear that the fit between the calculated
©© UUnniivveerrssiittyy ooff PPrreettoorriiaa

43
energy and tests results is not a good fit. In figure 29, if the value of the coefficient
is taken to be the same, the operating work indices are 9.9 and 9.3 for the 5 mm
and 3 mm material. Although an assumption, the fit in this case is not a good one
either. It also does not improve with different values of the operating work index
and the coefficient.
From figure 30 the value of the coefficient n is 3.8 and 4.8 for 5 mm and 3 mm
respectively and not 1 as suggested by Kapur et al (1990), and Daniel (2001).
Comparison between the Loesche mill and the batch press.
From the graphs it can be seen that there is a marked difference between the
energy needed to mill the material from 5 mm to 100 µm with the batch press and
the Loesche mill. Because of the uncertainty around the values of the coefficients
obtained from the tests, it is difficult to make a comparison between the batch
press and the Loesche mill. Unfortunately, only two data points is shown for the
batch press, as the rest of the tests with the batch press were not successful.
2.4.2 PARTICLE SIZE DISTRIBUTIONS
2.4.2.1 COMPARISON BETWEEN THE ROSIN-RAMMLER AND OTHER
EXPRESSIONS
Hukki (1975), stated that the Rosin-Rammler expression does not sufficiently
describe particle size distributions. In this study it will be shown that in some cases
this is true and that this expression should be used with care. The advantages of the
Rosin-Rammler model will be discussed and compared with other models for
describing particle size distributions.
The other models used in this discussion are:
Gaussian Model: y = aexp((-(b-x)2)/(2c2)) 14
Weibull Model: y = a-bexp(-cxd) 15
Normalised Weibull: y = ((aexp(-b(x/dx)d))100 16
Truncated Rosin-Rammler y = 100(exp(-a(x/b)dmax))/(1-exp(-a)) 17
Where: a,b,c and d are constants
©© UUnniivveerrssiittyy ooff PPrreettoorriiaa

44
x is the particle size defined as percentage retained on a specific screen
aperture (µm)
dx refers to a specific particle size, d50 is the 50% mass passing size, d80
the 80% mass passing size and dmax is the maximum particle size (µm)
A few reasons why the particle size distribution of an ore sample must be modelled
are:
Particle sizes are used to model unit processes such as mills, crushers, cyclones
etc. From these models, mass balances are determined. Therefore accurate size
distributions will result in accurate mass balances.
Specific sizes play an important role in modeling, such as the P80 which is
important in energy calculations.
Comparisons between various unit processes, such as comparing the product of a
rod mill with that of Loesche mill. In this case it is the slope of the graph that is the
important measurement.
The Rosin-Rammler model is a normalised Weibull model. The value of the x-axis is
divided by a constant dx, which equals a specific value on the x-axis. There is a
relationship between the constant b and the passing size dx. In the case of dx equals
d50, the constant is 0.693. With the constant b equals to 1, dx changes to d63.5 passing
size. The value of these models are twofold; the constant d is an indication of the
slope of the percentage passing size curve, whilst the term dx indicates a point on the
curve, such as d50, d80 d25, etc.. The value of a model such as this lies in the fact that
before the mid ‘80s in the previous century, metallurgists used calculators and graph
paper to determine the value of the slope of the curve. By integrating the equation, as
discussed in Chapter 1, section 2.2.1, this gives a practical solution for determining
the slope of the curve. Today, computers open other avenues. With curve fit
packages the particle size description can be done with more ease and with different
models. However, the problem with these packages is that many models could fit the
data. Unfortunately there is no fundamental approach to guide metallurgists in
selecting the most appropriate model and until such an approach has been
developed, it is advisable to keep to sigmoid curves.
In the figures 31 to 39 the above models will be compared to see which describe the
data the best and whether they are sufficient to be used for modeling. Table 6
©© UUnniivveerrssiittyy ooff PPrreettoorriiaa

45
contains the standard errors for the comparisons. This was determined using
curveExpert 1.4, a fairly common and user friendly package.
Figure 31: Particle size distribution of Foskor ore, milled in a rod mill, indicating
different models describing the data.
Figure 32: Particle size distribution of Foskor ore, milled in a Horomill, indicating
different models describing the data
Comparison between various descriptions of the screen
analysis of a Rod Mill product
0.0
20.0
40.0
60.0
80.0
100.0
0.0 200.0 400.0 600.0 800.0 1000.0 1200.0 1400.0
Screen Aperture (um)
% R
etai
ned
Rod mill data Gaussian Model Normalised Weibull
Rosin Rammler Weibull Model Truncated Rosin_Rammler
Comparison between various descriptions of the screen
analysis of a Horomill product
0.0
20.0
40.0
60.0
80.0
100.0
0.0 200.0 400.0 600.0 800.0 1000.0 1200.0 1400.0
Screen Aperture (um)
% R
etai
ned
Horomill data Gaussian Model Normalised Weibull
Rosin Rammler Weibull Model Truncated Rosin_Rammler
©© UUnniivveerrssiittyy ooff PPrreettoorriiaa
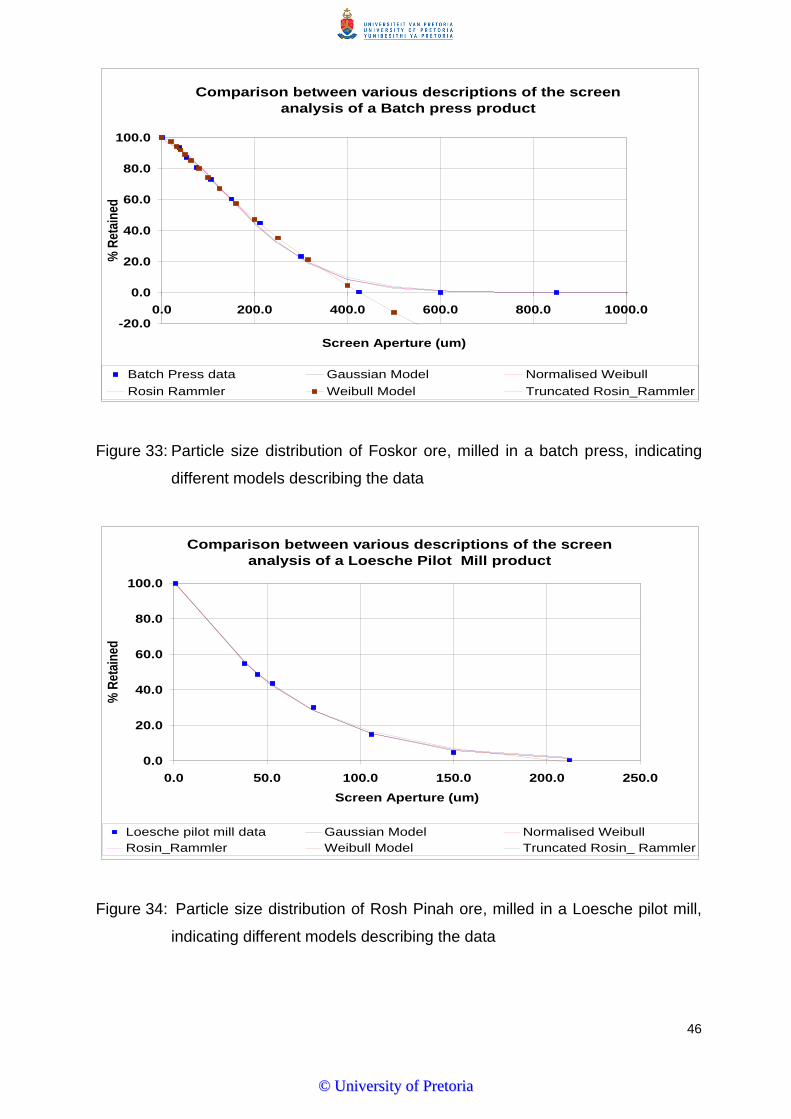
46
Figure 33: Particle size distribution of Foskor ore, milled in a batch press, indicating
different models describing the data
Figure 34: Particle size distribution of Rosh Pinah ore, milled in a Loesche pilot mill,
indicating different models describing the data
Comparison between various descriptions of the screen
analysis of a Batch press product
-20.0
0.0
20.0
40.0
60.0
80.0
100.0
0.0 200.0 400.0 600.0 800.0 1000.0
Screen Aperture (um)
% R
etai
ned
Batch Press data Gaussian Model Normalised Weibull
Rosin Rammler Weibull Model Truncated Rosin_Rammler
Comparison between various descriptions of the screen
analysis of a Loesche Pilot Mill product
0.0
20.0
40.0
60.0
80.0
100.0
0.0 50.0 100.0 150.0 200.0 250.0
Screen Aperture (um)
% R
etai
ned
Loesche pilot mill data Gaussian Model Normalised Weibull
Rosin_Rammler Weibull Model Truncated Rosin_ Rammler
©© UUnniivveerrssiittyy ooff PPrreettoorriiaa

47
Figure 35: Particle size distribution of Rosh Pinah ore, milled in a batch press,
indicating different models describing the data
Figure 36: Particle size distribution of banded iron stone, milled in a Loesche pilot mill,
indicating different models describing the data
Comparison between various descriptions of the screen
analysis of a Batch press product
0.0
20.0
40.0
60.0
80.0
100.0
0.0 50.0 100.0 150.0 200.0 250.0
Screen Aperture (um)
% R
etai
ned
Batch press data Gaussian Model Normalised Weibull
Rosin_Rammler Weibull Model Truncated Rosin_ Rammler
Comparison between various descriptions of the screen
analysis of a Loesche Pilot Mill product
0.0
20.0
40.0
60.0
80.0
100.0
0.0 50.0 100.0 150.0 200.0 250.0
Screen Aperture (µm)
% R
etai
ned
Loesche Pilot mill data Gaussian Model Normalised Weibull model
Rosin_Rammler Weibull Model Truncated Rosin_Rammler
©© UUnniivveerrssiittyy ooff PPrreettoorriiaa
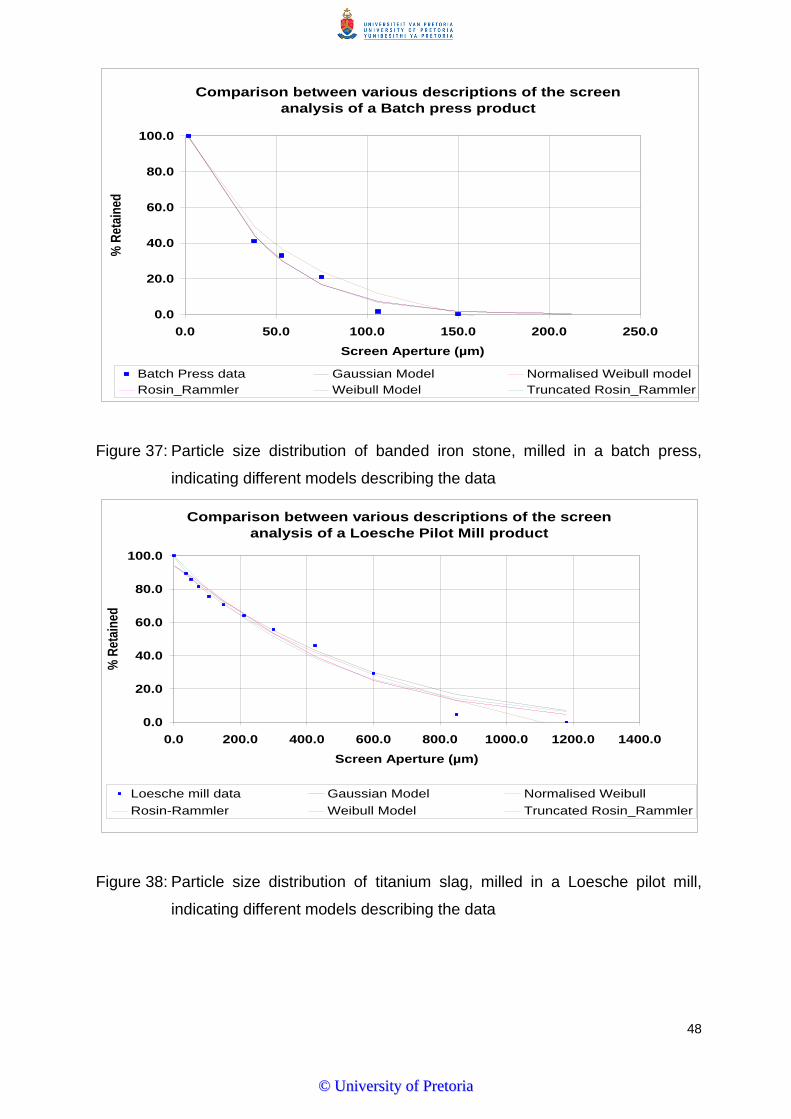
48
Figure 37: Particle size distribution of banded iron stone, milled in a batch press,
indicating different models describing the data
Figure 38: Particle size distribution of titanium slag, milled in a Loesche pilot mill,
indicating different models describing the data
Comparison between various descriptions of the screen
analysis of a Batch press product
0.0
20.0
40.0
60.0
80.0
100.0
0.0 50.0 100.0 150.0 200.0 250.0
Screen Aperture (µm)
% R
etai
ned
Batch Press data Gaussian Model Normalised Weibull model
Rosin_Rammler Weibull Model Truncated Rosin_Rammler
Comparison between various descriptions of the screen
analysis of a Loesche Pilot Mill product
0.0
20.0
40.0
60.0
80.0
100.0
0.0 200.0 400.0 600.0 800.0 1000.0 1200.0 1400.0
Screen Aperture (µm)
% R
etai
ned
Loesche mill data Gaussian Model Normalised Weibull
Rosin-Rammler Weibull Model Truncated Rosin_Rammler
©© UUnniivveerrssiittyy ooff PPrreettoorriiaa

49
Figure 39: Particle size distribution of titanium slag, milled in a batch press, indicating
different models describing the data
Figures 31 (rod mill), 32 (Horomill) and 34 (Loesche mill) indicate excellent fit with the
data for all the models. From table 6, the Gaussian, normalised Weibull, and Rosin-
Rammler models give standard deviations less than 2%, whilst that of the Weibull and
Truncated Weibull model are up to 2.51%. The standard errors for Foskor ore (figure
33) and Rosh Pinah ore (figure 35) in the batch press are, but for the Weibull model,
between 2.41% and 4.15% For the Weibull model it was less than 2%. However, as
indicated in Figure 33, if the Weibull model is extended to higher values, it will result
in negative values on the Y-axis. The rest of the figures indicate larger errors, up to
5.86%. The most important observation from figures 33, 35, 36, 37, 38 and 39, is that
the models fit the data from 100% retained to 20% retained for Foskor, Rosh Pinah
and banded iron stone. This value is about 30% for titanium slag. Another observation
is that the data points that does not fit the models, are the lower numbers.
This gives weight to Hukki’s (1975), observations that, the Rosin-Rammler distribution
does not describe the particle size distribution sufficiently. This also applies for the
other models. In this study it is particularly true for the batch press. To compare
different milling and classification options, the models can be used as shown in
section 2.3.2.2. To determine from the models a specific size fraction, if larger than
30% mass retained or 70% mass passing size, the sigmoid curve type is not
Comparison between various descriptions of the screen
analysis of a batch press product
0.0
20.0
40.0
60.0
80.0
100.0
0.0 200.0 400.0 600.0 800.0 1000.0 1200.0 1400.0
Screen Aperture (µm)
% R
eta
ined
Batch press data Gaussian Model Normalised Weibull
Rosin-Rammler Weibull Model Truncated Rosin_Rammler
©© UUnniivveerrssiittyy ooff PPrreettoorriiaa

50
acceptable. This is an important reason why the P80 mass passing size is not a good
choice to be used in energy calculations. If the need is to use the model to simulate a
mineral processing flow sheet, there will be an error. It would be better not to use a
model as an input into a mass balance, but rather use the actual data.
Table 6: Standard errors of models in describing particle size distributions obtained
from graphs 31 to 39.
Equipment Ore Gaussian Normalised
Weibull
Rosin-Rammler Weibull Truncated
Weibull
Rod mill Foskor 1.31 1.16 1.12 1.99 2.2
Horomill Foskor 1.17 1.6 1.54 2.51 1.6
Batch
press
Foskor 3.33 4.15 3.79 1.18 4.01
Loesche
Pilot mill
Rosh
Pinah
1.24 1.58 1.38 1.27 1.42
Batch
press
Rosh
Pinah
2.78 3.79 2.98 1.67 2.41
Loesche
Pilot mill
Banded
iron
stone
4.13 5.66 4.56 5.07 4.56
Batch
press
Banded
iron
stone
4.55 5.86 4.79 5.41 4.70
Loesche
Pilot mill
Titanium
slag
3.49 4.27 3.94 3.1 4.55
Batch
press
Titanium
slag
4.36 5.37 5.37 3.77 5.57
©© UUnniivveerrssiittyy ooff PPrreettoorriiaa
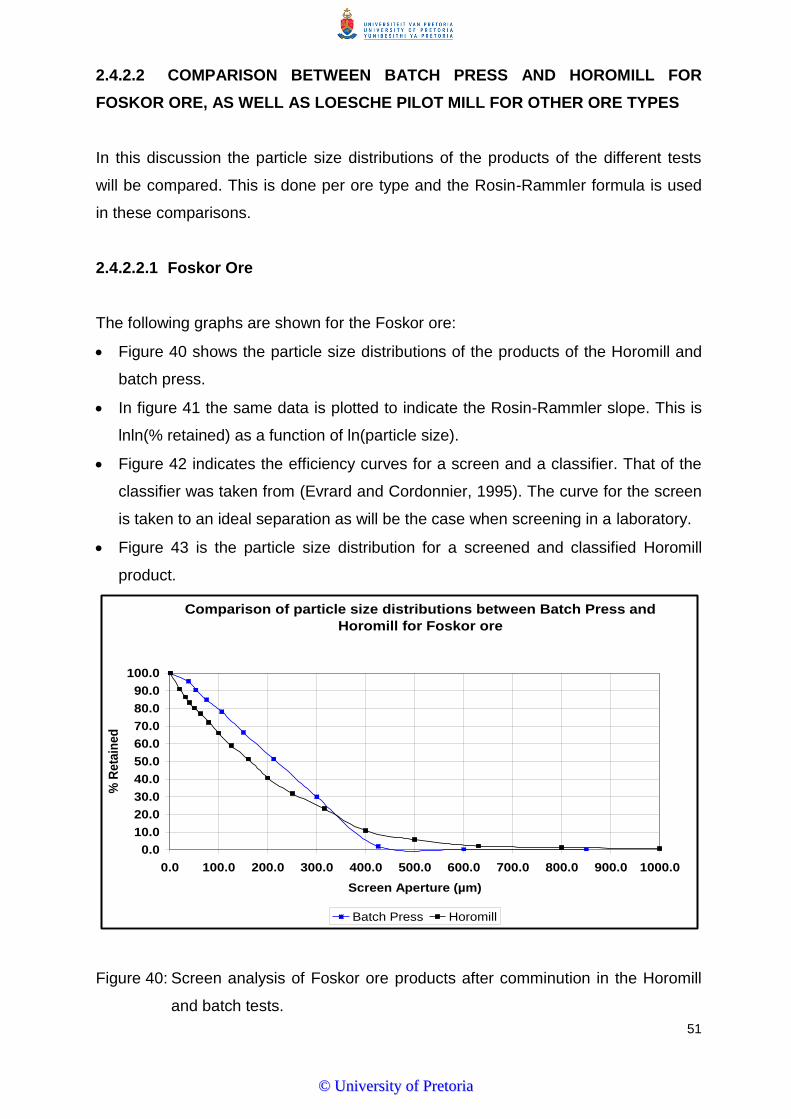
51
2.4.2.2 COMPARISON BETWEEN BATCH PRESS AND HOROMILL FOR
FOSKOR ORE, AS WELL AS LOESCHE PILOT MILL FOR OTHER ORE TYPES
In this discussion the particle size distributions of the products of the different tests
will be compared. This is done per ore type and the Rosin-Rammler formula is used
in these comparisons.
2.4.2.2.1 Foskor Ore
The following graphs are shown for the Foskor ore:
Figure 40 shows the particle size distributions of the products of the Horomill and
batch press.
In figure 41 the same data is plotted to indicate the Rosin-Rammler slope. This is
lnln(% retained) as a function of ln(particle size).
Figure 42 indicates the efficiency curves for a screen and a classifier. That of the
classifier was taken from (Evrard and Cordonnier, 1995). The curve for the screen
is taken to an ideal separation as will be the case when screening in a laboratory.
Figure 43 is the particle size distribution for a screened and classified Horomill
product.
Figure 40: Screen analysis of Foskor ore products after comminution in the Horomill
and batch tests.
Comparison of particle size distributions between Batch Press and
Horomill for Foskor ore
0.0
10.0
20.0
30.0
40.0
50.0
60.0
70.0
80.0
90.0
100.0
0.0 100.0 200.0 300.0 400.0 500.0 600.0 700.0 800.0 900.0 1000.0
Screen Aperture (µm)
% R
eta
ined
Batch Press Horomill
©© UUnniivveerrssiittyy ooff PPrreettoorriiaa

52
Figure 41: Rosin-Rammler plot of screen analysis of Foskor ore product after
comminution in the Horomill and batch press.
Figure 42: Efficiency curves for a classifier and a screen.
Comparison between Batch Press and Horomill
Rosin-Rammler Plot
Batch = 1.36x + 0.01
Horomill = 1.10x + 0.08
-3.0
-2.0
-1.0
0.0
1.0
2.0
-2.0 -1.0 0.0 1.0 2.0
ln(Screen Aperture)(µm)
ln(l
n(1
00
/ %
Re
tain
ed
)
Batch Press Horomill
Efficiency curve for a Classifier and a Screen
0.0
0.1
0.2
0.3
0.4
0.5
0.6
0.7
0.8
0.9
1.0
0.0 100.0 200.0 300.0 400.0 500.0 600.0 700.0 800.0 900.0
Screen Aperture (µm)
% R
eco
very
to
fin
es
Classifier Screen
©© UUnniivveerrssiittyy ooff PPrreettoorriiaa

53
Figure 43: Screen analysis of Foskor ore indicating the difference between a
classified and a screened product.
Discussion on Foskor ore
As shown in figure 40 and 41 there is a difference between the slopes of the particle
size distribution for the Horomill and batch press. The slope according to the Rosin-
Rammler model is 1.36 for the batch press and 1.10 for the Horomill. This difference
could be partially explained in the way the mill or bath press discharge is classified. In
the case of the Horomill, this was done with a classifier whilst the product of the batch
press was screened. In figure 42 the partition curve for a classifier and screen is
shown (Evrard and Cordonnier, 1995). From this it is clear why the screened product
will have a steeper slope than the classified product. If the mill discharge is screened
in stead of classified, it will result in a steeper slope for the screened product as can
be seen in figure 43. However there is still some difference between the screen
analysis of the batch press and that of the Horomill after screening.
Comparison between Batch Press and Horomill indicating the
influence of Screening and Classifying on the size distribution of
the Mill Product.
0.0
10.0
20.0
30.0
40.0
50.0
60.0
70.0
80.0
90.0
100.0
0.0 100.0 200.0 300.0 400.0 500.0 600.0 700.0 800.0 900.0 1000.0
Screen Aperture(µm)
% R
eta
ined
Batch Press Horomill in series with classifier Horomill in series with screen
©© UUnniivveerrssiittyy ooff PPrreettoorriiaa

54
2.4.2.2.2 Rosh Pinah ore
Figure 44: Screen analysis on a Rosin-Rammler plot for Rosh Pinah ore products
after comminution in a Loesche mill.
Figure 45: Screen analysis on a Rosin-Rammler plot for Rosh Pinah ore products
after comminution in a batch press.
Product Sizes for the Loesche Mill plotted using the
Rosin-Rammler model
152um= 0.98x - 0.01
R2 = 0.99
95µm = 1.18x + 0.08
R2 = 0.99
74 µm = 1.73x + 0.09
R2 = 0.99
62µm = 2.09x - 0.07
R2 = 0.99
-2.0
-1.5
-1.0
-0.5
0.0
0.5
1.0
1.5
2.0
2.5
3.0
-1.0 -0.5 0.0 0.5 1.0 1.5
Ln(Screen Aperture)(µm)
lnln
(100/%
Reta
ined
)
P80 = 152um P80 = 95 µm P80 = 74 µm P80 = 62 µm
Product Sizes for the Batch Press plotted using the
Rosin-Rammler model
150um = 1.90x + 0.12
R2 = 0.96
75 um = 2.36x + 0.04
R2 = 0.95
106 µm = 2.27x + 0.09
R2 = 0.97
-2.0
-1.0
0.0
1.0
2.0
3.0
4.0
5.0
-1.0 -0.5 0.0 0.5 1.0 1.5 2.0
Ln(Screen Aperture)(µm)
lnln
(10
0/%
Re
tain
ed
)
P80 = 150 um P80 = 75 um P80 = 106 µm
©© UUnniivveerrssiittyy ooff PPrreettoorriiaa

55
Discussion on Rosh Pinah ore
Figure 44 and 45 represents the size distribution of the products of the Loesche mill
and batch press plotted using the Rosin-Rammler equation
Figure 44 indicates that the Rosin-Rammler slope for Rosh Pinah ore varies
between 0.98 and 2.09 for the Loesche mill product whilst, those of the batch
press in figure 45 are between 1.9 and 2.36. This is a large difference. As the
Loesche mill has an internal classifier, it is not possible to determine what the
particle size of the product would look like if the mill discharge had been screened.
Even then the difference would be still significant. With this ore the batch press
did not represent the Loesche mill.
The values of R2 is in all cases larger than 0.95. This indicates that the Rosin-
Rammler model can be used to describe the particle size distributions.
2.4.2.2.3 TITANIUM SLAG
The figures shown for titanium slag are:
Figure 46 is the Rosin-Rammler plot for titanium slag in the Loesche mill.
Figure 47 is the Rosin-Rammler plot for titanium slag in the batch press.
Comparison of the batch press and Loesche mills for titanium slag indicate some
difference with averages for the Rosin-Rammler slopes of 0.82 for the batch press
and 0.72 for the Loesche mill. In both cases the material were screened. All the R2
values for the Rosin-Rammler slopes are well above 0.95 but it can be seen that at
the top data points it deviates from a straight line. Again referring to Hukki, the Rosin-
Rammler description can be used but the deviations must be taken into account.
©© UUnniivveerrssiittyy ooff PPrreettoorriiaa
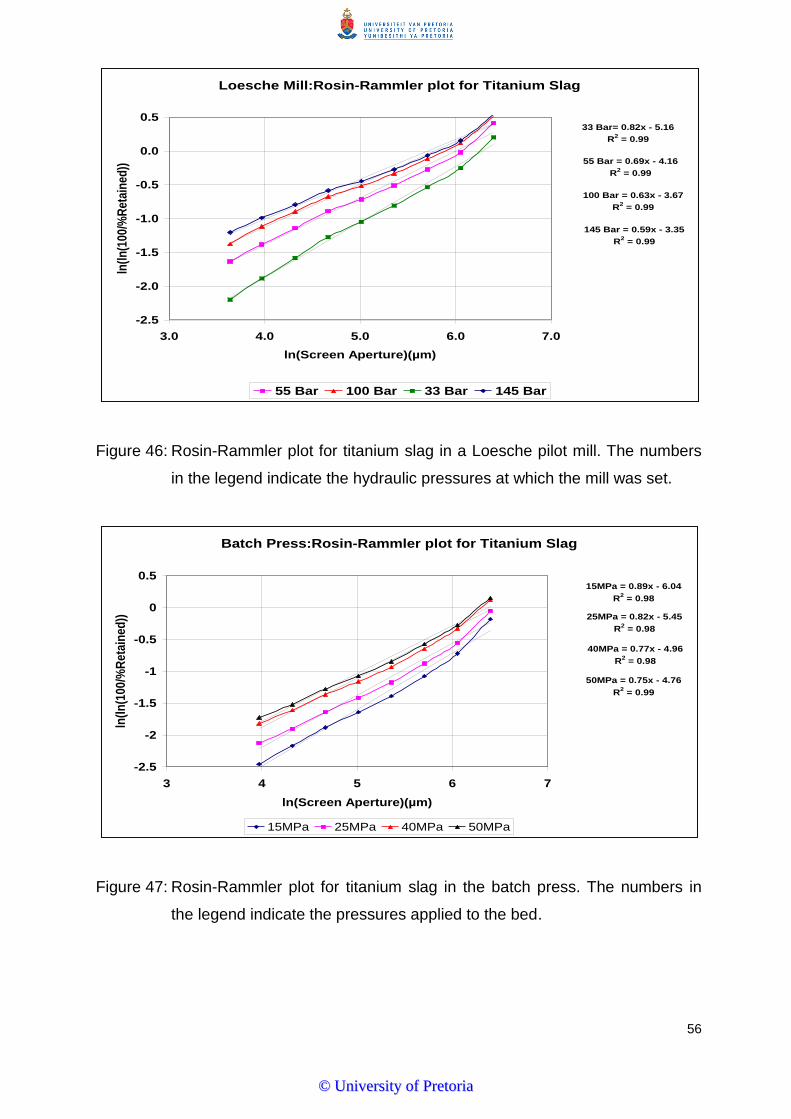
56
Figure 46: Rosin-Rammler plot for titanium slag in a Loesche pilot mill. The numbers
in the legend indicate the hydraulic pressures at which the mill was set.
Figure 47: Rosin-Rammler plot for titanium slag in the batch press. The numbers in
the legend indicate the pressures applied to the bed.
Loesche Mill:Rosin-Rammler plot for Titanium Slag
55 Bar = 0.69x - 4.16
R2 = 0.99
100 Bar = 0.63x - 3.67
R2 = 0.99
33 Bar= 0.82x - 5.16
R2 = 0.99
145 Bar = 0.59x - 3.35
R2 = 0.99
-2.5
-2.0
-1.5
-1.0
-0.5
0.0
0.5
3.0 4.0 5.0 6.0 7.0
ln(Screen Aperture)(µm)
ln(l
n(1
00/%
Ret
ain
ed))
55 Bar 100 Bar 33 Bar 145 Bar
Batch Press:Rosin-Rammler plot for Titanium Slag
15MPa = 0.89x - 6.04
R2 = 0.98
25MPa = 0.82x - 5.45
R2 = 0.98
40MPa = 0.77x - 4.96
R2 = 0.98
50MPa = 0.75x - 4.76
R2 = 0.99
-2.5
-2
-1.5
-1
-0.5
0
0.5
3 4 5 6 7
ln(Screen Aperture)(µm)
ln(l
n(1
00
/%R
eta
ine
d))
15MPa 25MPa 40MPa 50MPa
©© UUnniivveerrssiittyy ooff PPrreettoorriiaa

57
2.4.2.2.4 BANDED IRON STONE
Figure 48 is a comparison between the batch press and the Loesche mill for banded
iron stone.
From this graph the following conclusions can be made:
The Rosin-Rammler slope is 1.86 for the batch press and 1.80 for the Loesche mill
which is not a significant difference.
The graphs for both the Loesche mill and the batch press differ from a straight line
but to the same extent, indicating that with this ore the batch press simulates the
Loesche mill. Using the Rosin-Rammler description will introduce large errors.
Figure 48: Rosin-Rammler Plot of Screen Analysis for Banded iron stone.
2.4.3 CIRCULATING LOAD
In Figure 49 the influence of applied pressure on the circulating load is summarised
and compared with the results achieved with the Horomill on Foskor ore. The
Loesche pilot mill has an internal classifier and therefore the circulating load could not
be compared with the results from a batch press. As discussed previously, it is
Rosin-Rammler Presentation of Screen Analysis of Banded Iron
Stone
Batch press = 1.86x - 0.28
R2 = 0.97
Loesche mill = 1.80x - 0.20
R2 = 0.98
-0.5
0.0
0.5
1.0
1.5
2.0
2.5
3.0
-0.2 0.3 0.8 1.3 1.8
ln(Screen Aperture)(µm)
ln(l
n(1
00
/%R
eta
ine
d))
Loesche Mill Batch Press
©© UUnniivveerrssiittyy ooff PPrreettoorriiaa

58
important that there should be a good correlation between the circulating load ratios
of the Horomill and the batch press
Figure 49: Circulating load ratio as a function of applied pressure for the Loesche and
Horomill respectively for a product top size of 300m.
Inside the Horomill is a unique design of a scraper/spreader installed. By adjusting
the scraper the material can be pressed between 3 and 5 times before being
discarded. In the tests this was assumed to be an average of 3 times. In the batch
press the material was pressed and loosened three times before being taken out and
screened. The process was repeated to simulate a circulating flow until the circulating
load stabilised. This was done with pressures ranging from 20 to 40 MPa. According
to the manufacturer the calculated bed pressures applied during the tests with the
Horomill were of this order. From figure 49, it can be seen that the circulating load
ratios in the batch press are approximately 2, the same value as was achieved with
the Horomill.
0.0
0.5
1.0
1.5
2.0
2.5
0.0 10.0 20.0 30.0 40.0 50.0 60.0
Cir
cu
lati
ng
Lo
ad
Ra
tio
Pressure (MPa)
COMPRESSION TESTS WITH FOSKOR OREInfluence of pressure on circulating load ratio
©© UUnniivveerrssiittyy ooff PPrreettoorriiaa

59
CHAPTER 3 SUMMARY OF RESULTS AND COMPARISONS
3.1 ENERGY RELATIONSHIPS
Table 7: Summary of operating work indices and coefficients in the formula
E = OWi*(100n)(1/Pn-1/Fn)
Ore type Top
Size
Equipment P80 P50
OWi n OWi n
Foskor 30 mm Horomill 9.51 1.05 7.5 2.31
Foskor
Batch Press 5.33 0.24 4.7 0.85
Foskor 5 mm Pilot ball mill 12 1.05
Titanium slag 10 mm Loesche mill 35 0.9 55 0.06
Titanium slag 10 mm Batch press 3.6 0.5 5.6 1.4
Banded iron
stone
5 mm Loesche mill 13.4 0.21 9.9 0.21
Banded iron
stone
3 mm Loesche mill 13.2 0.21 9.3 0.21
Banded iron
stone
5 mm Batch press 9.1 0.20 15.7 0.18
Rosh Pinah ore 10 mm Loesche mill 9.89 1.36 4.42 0.95
Rosh Pinah ore 5 mm Loesche mill 7.18 1.22 3.43 0.95
Rosh Pinah ore 3 mm Loesche mill 6.68 1.1 3.33 0.83
Rosh Pinah ore 10 mm Batch press 3.04 0.68 1.71 0.79
Rosh Pinah ore 5 mm Batch press 3.04 0.65 1.73 0.8
Rosh Pinah ore 3 mm Batch press 2.67 0.77 1.69 0.79
Rosh Pinah ore 10 mm Ball mill 11.1 0.72
©© UUnniivveerrssiittyy ooff PPrreettoorriiaa

60
Table 8: Summary of constants a and n in the formula F50/P50 = a*En+1
Ore type Top
Size
Equipment Constants
a n
Foskor 30 mm Horomill 11.7 0.45
Foskor Batch Press 1.62 0.59
Titanium slag 10 mm Loesche mill 0.73 1.75
Titanium slag 10 mm Batch press 3.4 0.41
Banded iron
stone
5 mm Loesche mill 0.04 3.8
Banded iron
stone
3 mm Loesche mill 0.01 4.8
Rosh Pinah ore 5 mm Loesche mill 1.5 1.14
Rosh Pinah ore 3 mm Loesche mill 4.6 1.04
Rosh Pinah ore 10 mm Batch press 16.8 0.55
Rosh Pinah ore 5 mm Batch press 3.4 1.15
Rosh Pinah ore 3 mm Batch press 8.3 1.27
Comparison with the Bond/Rittinger formula and the suggested prediction of
Kapur et al (1990), and Daniel (2001),
To conclude the discussion on the comparison between Bond/Rittinger and
experimental results, the following is repeated from the discussions on the individual
ore types.
For the Horomill, Loesche mill, batch press and even the two ball mills, the value
of the coefficient n varies from ore type to ore type and for different % mass
passing sizes.
The energy/particle size relationship, E = OWi(1/Pn-1/Fn), seems to be valid. Using
the coefficient n for the specific experiment and calculating OWi, in almost all
cases this calculated value is constant over the range of particle sizes tested.
Whether the 80% or 50% mass passing size is the better choice for defining the
product size, cannot be deducted from this project.
©© UUnniivveerrssiittyy ooff PPrreettoorriiaa

61
The values of the coefficient in the reduction ratio/energy consumption model vary
from between 0.86 and 1.24 for the Loesche mill with Foskor and Rosh Pinah ore.
However, with banded iron stone and titanium slag, it is as high as 5.1. It follows
that the suggestion of Kapur et al (1990), and Daniel (2001), that this should be 1,
is not valid for the Loesche mill.
Comparison between the Loesche mill and the batch press.
The following deductions can be made from the results:
The energy consumption of the batch press is consistently lower than the energy
consumption of the Loesche and Horomill. The operating work indices and the
values of the coefficients in the equation 6 and 7 differ significantly between that
obtained from the batch press and that from the pilot mills.
The operating work indices obtained from the batch press is in all cases lower
than that from the pilot mills. In the case of titanium slag it is a tenth of that
achieved in the pilot Loesche mill.
The values of the coefficient are also, with the exception of the banded iron stone,
lower than that obtained from the pilot mills.
3.2 PARTICLE SIZE DISTRIBUTIONS
The batch press produces a size distribution that deviates from the straight line
relationship as described by the Rosin-Rammler model. However, it is still a valid
method to describe the size distribution of the product of the Horomill and Loesche
mill. The batch press, however, does not simulate the mills well. In the case of the
banded iron stone and the slag, the differences in the Rosin-Rammler slope are
small. The results with Foskor ore shows that by taking the method of classification
into account the differences in the slope for the batch press and the Horomill could be
explained. However, the results obtained with the Rosh Pinah ore can not be
explained.
©© UUnniivveerrssiittyy ooff PPrreettoorriiaa

62
3.3 CONCLUSIONS
The relationship between energy, a work index, the product and feed size as
described by equation 6 and 7, was found to be useful for the comminution
devices and ores investigated.
The values of the coefficient in these equations are not constants as suggested by
Bond and Rittinger, but vary and must be determined for each application.
The relationship between the reduction ratio and energy consumption suggested
by Kapur et al (1990), and Daniel (2001) has limited applicability. The results also
indicates that the coefficient also differs from application to application.
Using the batch press as a simulator can only be done with regard to particle size
distributions. As far as energy descriptions are concerned, the differences
between the batch press and pilot mills are too big. Even for simulating particle
size distributions, unless proven for an application, it is suggested that it only be
used for research purposes, for instance, to prepare material for bench scale tests
such as flotation and magnetic separation.
©© UUnniivveerrssiittyy ooff PPrreettoorriiaa

63
REFERENCES
Austin, L.G., The theory of grinding, Industrial and Engineering Chemistry, Vol. 56,
No. 11, 1964, 18-29.
Bond, F.C., The third theory of comminution, Mining Engineering, May 1952, 484-494.
Cook, P., Report on ball mill work indices of Thabazimbi ore, 2003.
Daniel, M., HPGR Model Verification and Scale-up, Amira International, 3rd Progress
Report, May 2001.
Eicke, G., Grinding plants for special powders, Aufbereitungs-Technik, Vol. 20, No. 2,
1979, 99-103.
Evrard, R. and Cordonnier, A., Comparative study of grindability of pyroxenite from
Phalaborwa: Results of test program conducted in November 1995, FCB.
Fandrich, R.G., Bearman, R.A., Boland, J. and Lim, W., Mineral liberation by particle
bed breakage, Minerals Engineering, Vol. 10, No. 2, 1997, 175-187.
Guy, Elements of Physical Metallurgy, 1960, 330.
Hukki, R.T., The principles of comminution: an analytical summary. Engineering and
Mining Journal, Vol. 5, May 1975, 106-110.
Jankovic, A., Dundar, H. and Mehta, R., Relationships between comminution energy
and product size for a magnetite ore, SAIMM, Vol. 110, March 2010, 141-146.
Kanda, Y., Oyamada, T., Kanedo, K., and Sano, S., The compressive crushing of
quartz in a powder bed: The effect of feed size on grindability, Minerals Engineering,
Vol. 9, No. 4, 1996, 475-480.
Kapur, P.C., Schönert, K., Fuerstenau, D.W., Energy-size relationship for breakage of
single particles in a rigidly mounted roll mill, International Journal of Mineral
Processing, Vol. 29, 1990, 221-233.
Kapur, P.C., Sudhir, G.S. and Fuerstenhau, D.W., Grinding of heterogeneous
mixtures in a high-pressure roll mill. Comminution: Theory and Practice, Society of
Mining, Metallurgy, and Exploration, Inc., 1992, 109-123.
Kellerwessel, H., Extracts from Roller Press Symposium at Humboldt Wedag AG,
Cologne, January 1989.
Kellerwessel, H., Extracts from Inter-particle Crushing Symposium, Johannesburg,
19th June 1990.
Lim, W.I.L. and Weller, K.R., Some benefits of studded surfaces in high pressure
grinding mills, Comminution ’98, Brisbane, Australia, February 1998.
©© UUnniivveerrssiittyy ooff PPrreettoorriiaa

64
Mayerhauser, D., Economical fine size reduction with a high compression roller mill,
Industrial Minerals Processing Supplement, Vol. 4, 1990, 43-47.
Napier-Munn, T.J., Morrell, S., Morrison and R. D., Kojovic, T., Mineral Comminution
Circuits: Their Operation and Optimisation, JKMRC Monograph Series in Mining and
Mineral Processing 2, 1996.
Norgate, T.E., and Weller, K.R., Selection and operation of high pressure grinding
rolls circuit for minimum energy consumption, Minerals Engineering, Vol. 7, No. 10,
1994, 1253-1267.
Schönert, K., A first survey of grinding with high-compression roller mills, International
Journal of Mineral Processing, Vol. 22, 1988, 401-412.
Schönert, K., Advances in comminution fundamentals and impacts on technology,
Aufbereitungs-Technik, Vol. 32, No. 9, 1991, 38-45.
Schwechten, D. and Milburn, G.H., Experiences in dry grinding with high compression
roller mills for end product quality below 20 microns, Minerals Engineering, Vol. 3, No.
1/2, 1990, 23-34.
Van der Linde, G. and Bester, P., Improved apatite recovery from pyroxenite ore
using dry milling, Foskor internal report, 1998.
Van der Meer, F., Roller press grinding of pellet feed, AusIMM Conference on Iron
Ore Resources and Reserves Estimation, Perth, Australia, September 1997.
Viljoen, R.M., Smit, J.T., Du Plessis, I. and Ser, V., The development and application
of in-bed compression breakage principles, Minerals Engineering, Vol. 14, No. 5,
2001, 465-471.
©© UUnniivveerrssiittyy ooff PPrreettoorriiaa

65
APPENDIX 1
A.1 INDUSTRIAL ROLLER MILLS
The industrial equipment available consists of three design types. All of these are
equipped with high-pressure hydraulic systems which apply pressure to a roller and
create a bed pressure of 15 MPa for the milling of coal and up to 100 MPa for the
crushing of hard minerals such as quartz. The three designs are briefly described.
A.1.1 DUAL ROLLER PRESSES
These presses consist of two rollers of which one is a rigidly mounted roller with no
drive train. It rotates freely and is driven by the ore passing through the gap. The
other roller is electrical driven and pressure is applied to the roller by a hydraulic
system through a set of hydraulic cylinders. It is expected that the rollers in this
equipment will have the highest wear rate as the material is crushed only once when
passing through the gap between the rollers. With the other designs the material can
be pressed more than once whilst in the machine. Comparison between a dual roll
crusher and the Horomill at FCB indicated that the pressure, as calculated by the
manufacturers, is 100 MPa for the dual roller crusher and 30 MPa for the Horomill.
The lower pressure required with the Horomill results from the fact that material is
being pressed three times whilst in the mill. The lower applied pressure results in less
wear of the metal surfaces. The action of such a mill on the ore and the pressure
exerted on the bed of ore particles are shown schematically in figure 50.
©© UUnniivveerrssiittyy ooff PPrreettoorriiaa

66
Figure 50: Diagram of a dual roller press indicating the size reduction of the ore and
the pressure generated in the ore bed.
A.1.2 VERTICAL ROLLER MILLS
Loesche manufactures the best-known mill in this design type. Although the concept
of inter-particle crushing is relatively new, these mills have existed for the better part
of the last century. Their utilization was for the fine grinding of soft material, such as
coal, or where the material needs to be milled to fineness such as 20m. Ball mills
are not efficient enough for milling to these fine sizes.
These mills consist of a horizontal rotating table and two or more free rotating rollers
as shown in figures 51 and 52. Hydraulic pistons press the rollers onto the table. The
small mills are equipped with two rollers, but larger mills may have four rollers.
Because of the chance that the material can be pressed up to four times whilst on the
table, these mills operate with the lowest pressures of all the designs and therefore
the wear on the rollers are the least. At Foskor steel consumption of typically 18
grams of steel per ton of ore is achieved. It is expected that with only two rollers this
figure could rise to 30 grams of steel per ton of ore.
©© UUnniivveerrssiittyy ooff PPrreettoorriiaa

67
The mill is equipped with an internal classifier that has the advantage of less ancillary
equipment. The circulating load is transferred back onto the table as the classifier is
situated right on top of the table. It is not advisable to use this arrangement where
multiple classifications are necessary. However, the mill can be designed to be an
overflow mill. The material is discharged over the edges of the table and dumped onto
conveyors for classification. The bigger rollers are typically used for coarse material
and operate at lower pressures while the smaller rollers will require higher pressures
but comminution will be finer.
Figure 51: Schematic Representation of a Loesche Mill, Loesche GMPB [1994].
Internal classifier
Circulating Feed
Fresh Feed
Primary Roller
Secondary Roller
Horizontal Table
Drive Arrangement
Air Flow to Fan
©© UUnniivveerrssiittyy ooff PPrreettoorriiaa

68
Figure 52: Views of the AARL Pilot Mill.
©© UUnniivveerrssiittyy ooff PPrreettoorriiaa

69
A.1.3 HOROMILL
The Horomill was developed by FCB in France to compete with the dual roller
crushers in the cement industry. This mill consists of a pinion driven shell with a roller
inside the shell as indicated in figure 53. This roller is free rotating and pressure is
applied to the roller by hydraulic cylinders. Inside the shell is also a set of chutes that
can be adjusted to change the residence time in the mill. The material can be pressed
between 3 and 5 times before leaving the mill. These mills operate at moderate bed
pressures of 30 to 50 MPa. This is lower than that of the dual roller that operates at
50 to 100 MPa and higher than that of the Loesche mill that operates at pressures as
low as 15 MPa.
©© UUnniivveerrssiittyy ooff PPrreettoorriiaa

70
Figure 53: Schematic representation of a Horomill.
©© UUnniivveerrssiittyy ooff PPrreettoorriiaa

71
APPENDIX 2
DETAIL DATA FOR THE TESTS WITH FOSKOR ORE
Table A2.1: Summary of detail of the tests performed with the batch press
.
BATCH PRESS: SUMMARY OF DETAILS OF TESTS
Test Number 5030 1030 15030 40030 5040 1040 1540 5060 1060 1560 15030 30030
Force applied in the
press (kN) 50 100 150 400 50 100 150 50 100 150 150 300
Pressure applied in
the
press (MPa) 6.36 12.73 19.09 50.91 6.36 12.73 19.09 6.36 12.73 19.09 19.09 38.18
Circulating load 15.0 9.0 6.2 3.3 11.9 5.1 3.8 6.6 2.8 2.3 2.2 1.7
Feed size F80(m) 2000 2000 2000 6000 2000 2000 2000 2000 2000 2000 6000 6000
Product size P80(m) 280 280 280 240 390 390 345 470 450 450 260 220
Power consumption
kWh/t 1.07 1.35 1.98 2.44 1.15 1.45 1.66 1.25 1.90 1.25 1.96 3.00
Reduction ratio
F50/P50 7.1 7.1 7.1 25.0 5.1 5.1 5.3 4.3 4.4 4.4 23.1 27.3
Feed size F50(m) 750 750 750 900 750 750 750 750 750 750 750 750
Product size P50(m) 140 140 140 165 215 215 190 165 155 160 155 150
©© UUnniivveerrssiittyy ooff PPrreettoorriiaa

72
Table A2.2: Summary of detail of the tests performed with the Horomill.
SUMMARY OF RESULTS OF TESTS WITH HOROMILL
HOROMILL
Test Number E49A E49B E49C E49E
Feed size F80(m) 15300 15300 15300 15300
Product size P80(m) 194 201 294 333
Power consumption kWh/t 5.09 4.26 3.57 2.57
Xf/Xp 79 76 52 46
Feed size F50(m) 3000 3000 3000 3000
Product size P50(m) 120 125 140 160
©© UUnniivveerrssiittyy ooff PPrreettoorriiaa
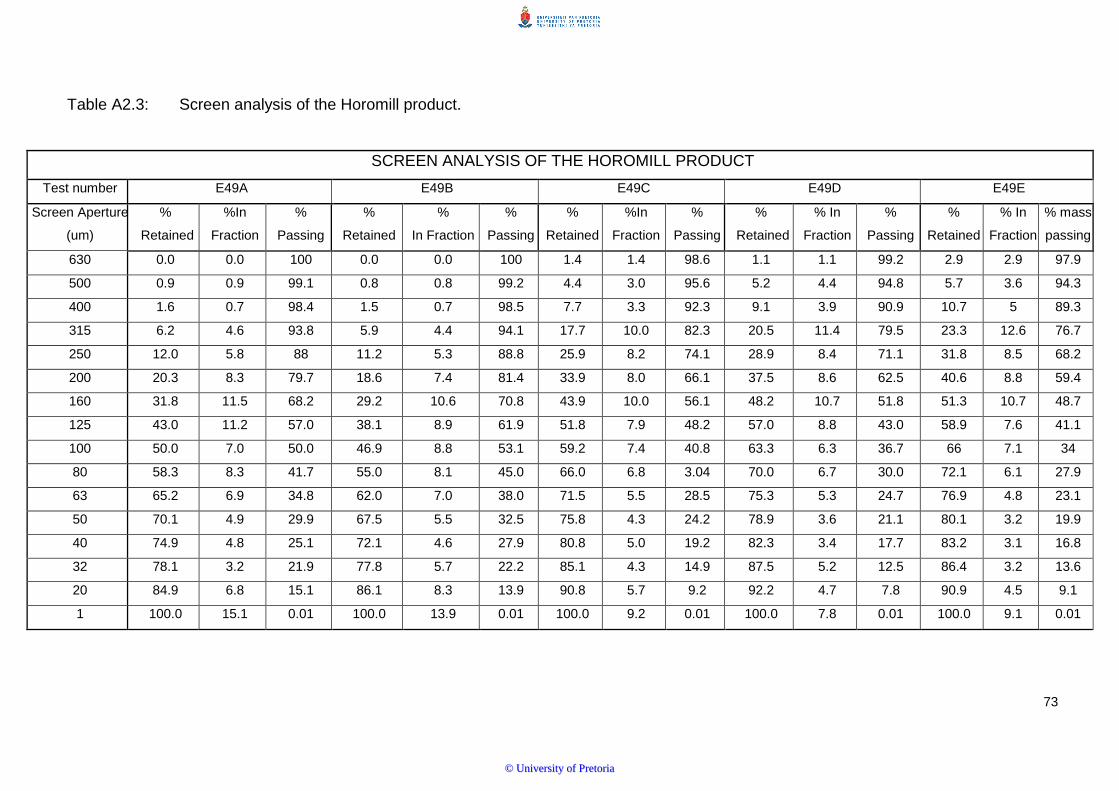
73
Table A2.3: Screen analysis of the Horomill product.
SCREEN ANALYSIS OF THE HOROMILL PRODUCT
Test number E49A E49B E49C E49D E49E
Screen Aperture
(um)
%
Retained
%In
Fraction
%
Passing
%
Retained
%
In Fraction
%
Passing
%
Retained
%In
Fraction
%
Passing
%
Retained
% In
Fraction
%
Passing
%
Retained
% In
Fraction
% mass
passing
630 0.0 0.0 100 0.0 0.0 100 1.4 1.4 98.6 1.1 1.1 99.2 2.9 2.9 97.9
500 0.9 0.9 99.1 0.8 0.8 99.2 4.4 3.0 95.6 5.2 4.4 94.8 5.7 3.6 94.3
400 1.6 0.7 98.4 1.5 0.7 98.5 7.7 3.3 92.3 9.1 3.9 90.9 10.7 5 89.3
315 6.2 4.6 93.8 5.9 4.4 94.1 17.7 10.0 82.3 20.5 11.4 79.5 23.3 12.6 76.7
250 12.0 5.8 88 11.2 5.3 88.8 25.9 8.2 74.1 28.9 8.4 71.1 31.8 8.5 68.2
200 20.3 8.3 79.7 18.6 7.4 81.4 33.9 8.0 66.1 37.5 8.6 62.5 40.6 8.8 59.4
160 31.8 11.5 68.2 29.2 10.6 70.8 43.9 10.0 56.1 48.2 10.7 51.8 51.3 10.7 48.7
125 43.0 11.2 57.0 38.1 8.9 61.9 51.8 7.9 48.2 57.0 8.8 43.0 58.9 7.6 41.1
100 50.0 7.0 50.0 46.9 8.8 53.1 59.2 7.4 40.8 63.3 6.3 36.7 66 7.1 34
80 58.3 8.3 41.7 55.0 8.1 45.0 66.0 6.8 3.04 70.0 6.7 30.0 72.1 6.1 27.9
63 65.2 6.9 34.8 62.0 7.0 38.0 71.5 5.5 28.5 75.3 5.3 24.7 76.9 4.8 23.1
50 70.1 4.9 29.9 67.5 5.5 32.5 75.8 4.3 24.2 78.9 3.6 21.1 80.1 3.2 19.9
40 74.9 4.8 25.1 72.1 4.6 27.9 80.8 5.0 19.2 82.3 3.4 17.7 83.2 3.1 16.8
32 78.1 3.2 21.9 77.8 5.7 22.2 85.1 4.3 14.9 87.5 5.2 12.5 86.4 3.2 13.6
20 84.9 6.8 15.1 86.1 8.3 13.9 90.8 5.7 9.2 92.2 4.7 7.8 90.9 4.5 9.1
1 100.0 15.1 0.01 100.0 13.9 0.01 100.0 9.2 0.01 100.0 7.8 0.01 100.0 9.1 0.01
©© UUnniivveerrssiittyy ooff PPrreettoorriiaa
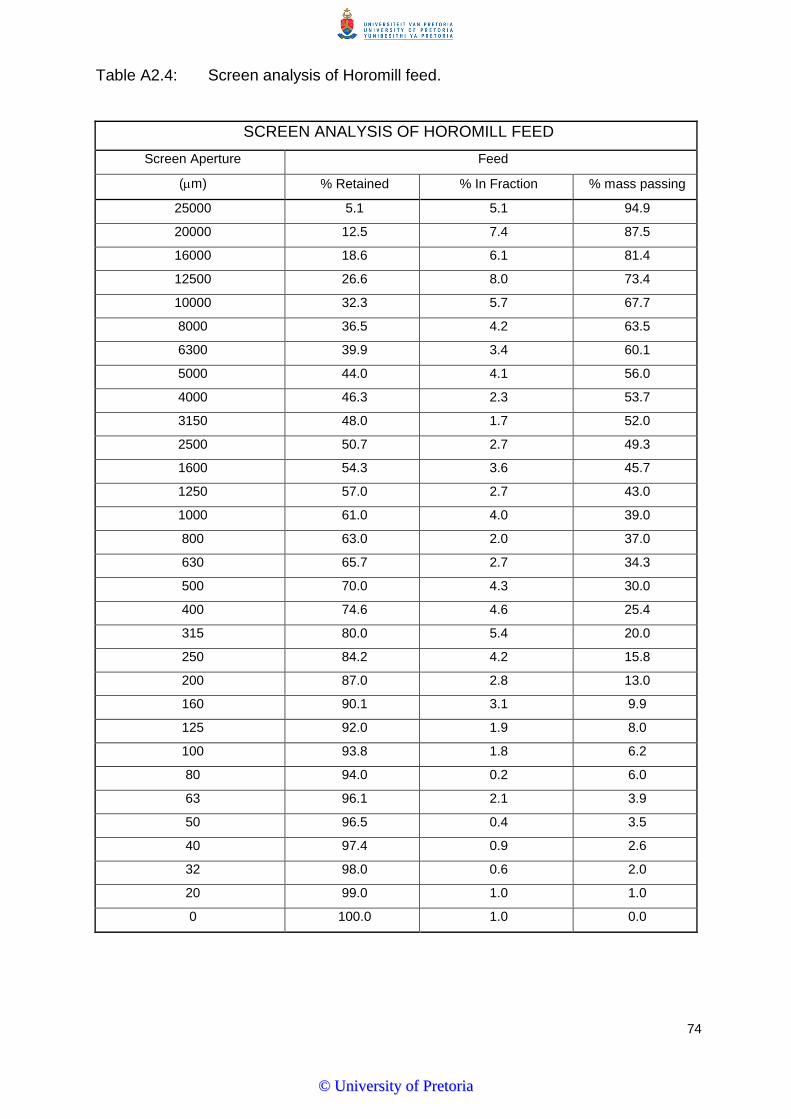
74
Table A2.4: Screen analysis of Horomill feed.
SCREEN ANALYSIS OF HOROMILL FEED
Screen Aperture Feed
(m) % Retained % In Fraction % mass passing
25000 5.1 5.1 94.9
20000 12.5 7.4 87.5
16000 18.6 6.1 81.4
12500 26.6 8.0 73.4
10000 32.3 5.7 67.7
8000 36.5 4.2 63.5
6300 39.9 3.4 60.1
5000 44.0 4.1 56.0
4000 46.3 2.3 53.7
3150 48.0 1.7 52.0
2500 50.7 2.7 49.3
1600 54.3 3.6 45.7
1250 57.0 2.7 43.0
1000 61.0 4.0 39.0
800 63.0 2.0 37.0
630 65.7 2.7 34.3
500 70.0 4.3 30.0
400 74.6 4.6 25.4
315 80.0 5.4 20.0
250 84.2 4.2 15.8
200 87.0 2.8 13.0
160 90.1 3.1 9.9
125 92.0 1.9 8.0
100 93.8 1.8 6.2
80 94.0 0.2 6.0
63 96.1 2.1 3.9
50 96.5 0.4 3.5
40 97.4 0.9 2.6
32 98.0 0.6 2.0
20 99.0 1.0 1.0
0 100.0 1.0 0.0
©© UUnniivveerrssiittyy ooff PPrreettoorriiaa

75
Table A2.5: Screen analysis of the batch press product.
BATCH PRESS: SCREEN ANALYSIS OF FINE FRACTION
Test number 1540 1040 5040 1560 1060 5060 40300 15300 30300
Screen
Aperture
% In
Fraction
%
Passing
% In
Fraction
%
Passing
% In
Fraction
%
Passing
% In
Fraction
%
Passing
% In
Fraction
%
Passing
% In
Fraction
%
Passing
% In
Fraction
%
Passing
% In
Fraction
%
Passing
% In
Fraction
%
Passing
850 0.00 100.00 0.00 100 0.00 100 0.00 100.00 0.00 100.00 0.00 100.00
600 0.00 100.00 0.00 100 0.00 100.00 1.40 98.60 1.40 98.60 1.89 98.11
425 0.20 99.80 2.81 97.19 1.92 98.08 22.30 76.30 21.58 77.02 24.18 73.93
300 23.14 76.66 27.73 69.46 28.01 70.07 18.25 58.05 18.51 58.51 17.18 56.74 6.57 93.43 2.35 97.65 9.51 90.49
212 21.55 55.11 21.31 48.15 21.38 48.68 15.89 42.16 16.63 41.87 17.40 39.34 25.70 67.73 26.62 71.03 10.49 80.00
150 15.47 39.63 14.09 34.07 15.05 33.63 11.74 30.42 12.16 29.71 12.33 27.02 24.49 43.24 23.91 47.12 19.14 60.86
106 12.71 26.92 11.77 22.29 11.71 21.93 9.62 20.80 9.86 19.86 9.59 17.43 19.03 24.20 15.76 31.37 15.71 45.15
75 7.45 19.47 6.06 16.23 6.82 15.11 6.01 14.79 5.93 13.93 5.73 11.70 4.19 20.01 11.33 20.03 16.52 28.63
53 6.56 12.91 6.16 10.08 5.54 9.56 4.91 9.88 5.06 8.87 4.50 7.20 14.25 5.76 16.85 3.18 23.00 5.63
38 6.41 6.50 7.43 2.65 4.97 4.59 4.62 5.26 4.79 4.07 3.94 3.26 4.69 1.07 2.75 0.44 4.70 0.93
1 6.50 2.65 4.59 5.26 0.00 4.07 0.00 3.26 0.00 1.07 0.44 0.93 0.00
©© UUnniivveerrssiittyy ooff PPrreettoorriiaa

76
APPENDIX 3
DETAIL DATA FOR THE TESTS WITH TITANIUM SLAG
Table A3.1: Summary of pilot plant milling of titanium slag.
Test nr FEED
RATE
(kg/hr)
CIRCULATING
LOAD
(kg/hr)
HYDRAULIC
PRESSURE
(MPa)
TABLE
POWER
(kWh/ton)
NO LOAD
POWER
(kWh)
POWER MEASURED USING
TORQUE R(kWh/ton)
NETT TABLE POWER
(kWh/ton)
(table power less no load power)
P50
(m)
1 306 363 3.0 4.6 0.75 0.7 2.1 680
2 294 203 5.5 5.4 0.75 1.6 2.9 620
3 300 240 8.0 5.3 0.75 2.5 2.8 590
4 318 257 10.0 5.7 0.75 3.3 3.3 580
5 308 202 14.5 5.8 0.75 3.7 3.4 580
©© UUnniivveerrssiittyy ooff PPrreettoorriiaa
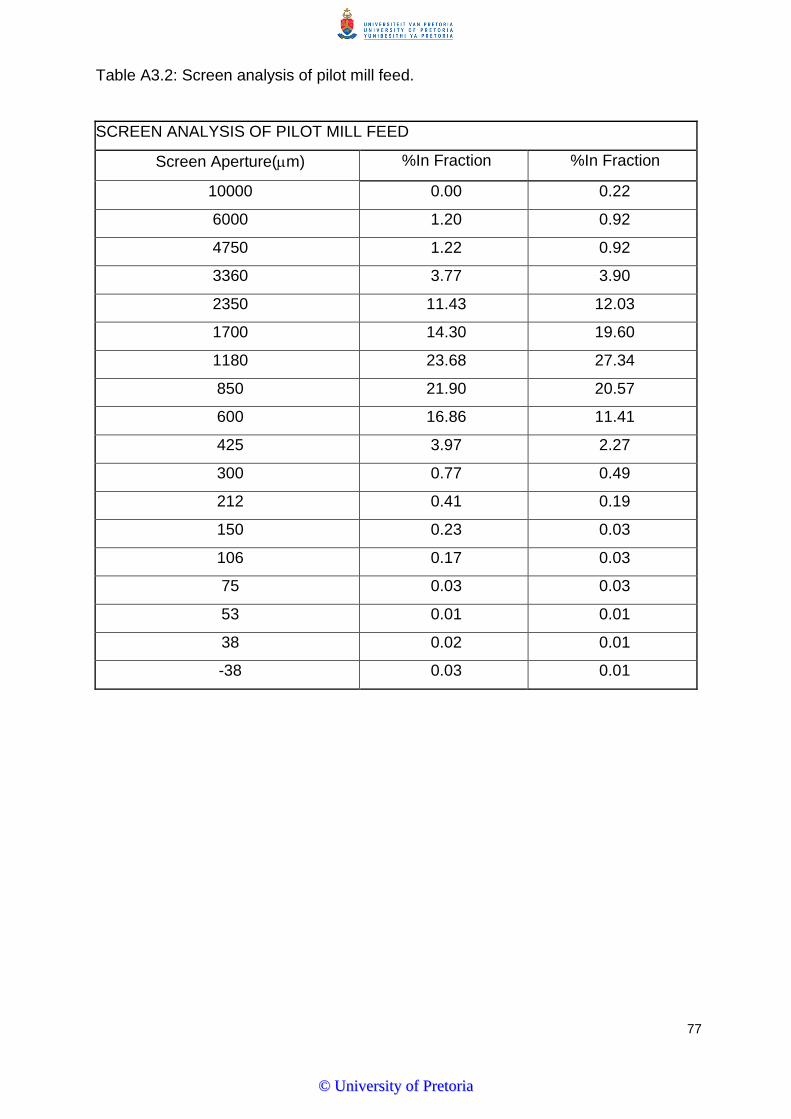
77
Table A3.2: Screen analysis of pilot mill feed.
SCREEN ANALYSIS OF PILOT MILL FEED
Screen Aperture(m) %In Fraction %In Fraction
10000 0.00 0.22
6000 1.20 0.92
4750 1.22 0.92
3360 3.77 3.90
2350 11.43 12.03
1700 14.30 19.60
1180 23.68 27.34
850 21.90 20.57
600 16.86 11.41
425 3.97 2.27
300 0.77 0.49
212 0.41 0.19
150 0.23 0.03
106 0.17 0.03
75 0.03 0.03
53 0.01 0.01
38 0.02 0.01
-38 0.03 0.01
©© UUnniivveerrssiittyy ooff PPrreettoorriiaa

78
Table A3.3: Screen analysis of batch press feed.
SCREEN ANALYSIS OF BATCH PRESS FEED
Screen Aperture(µm) % In Fraction % mass passing
6700 4.60 95.40
4750 2.32 93.08
3350 4.64 88.44
2360 12.67 75.77
1700 21.06 54.71
1180 22.18 32.53
850 17.45 15.08
600 11.11 3.97
425 2.32 1.65
300 0.62 1.03
212 0.31 0.71
150 0.18 0.54
106 0.13 0.40
75 0.13 0.27
53 0.13 0.13
1 0.13 0.00
©© UUnniivveerrssiittyy ooff PPrreettoorriiaa

79
Table A3.4: Screen analysis of batch press products.
SCREEN ANALYSIS OF BATCH PRESS PRODUCTS
15MPa 25MPa 40MPa 50MPa
Screen Aperture(µm) % In Fraction % mass passing % In Fraction % mass passing % In Fraction % mass passing % In Fraction % mass passing
850 17.14 82.86 16.85 83.15 12.83 87.17 12.48 87.52
600 26.29 56.57 21.91 61.24 19.51 67.66 18.80 68.72
425 18.08 38.50 17.60 43.63 16.34 51.32 15.47 53.24
300 9.62 28.87 9.74 33.90 10.54 40.77 10.15 43.09
212 6.81 22.07 7.30 26.59 8.26 32.51 8.32 34.78
150 4.46 17.61 5.06 21.54 5.62 26.89 5.82 28.95
106 3.52 14.08 3.93 17.60 4.39 22.50 4.66 24.29
75 3.29 10.80 3.75 13.86 4.39 18.10 4.66 19.63
53 2.58 8.22 2.62 11.24 3.16 14.94 3.33 16.31
1 8.22 0.00 11.24 0.00 14.94 0.00 16.31 0.00
©© UUnniivveerrssiittyy ooff PPrreettoorriiaa
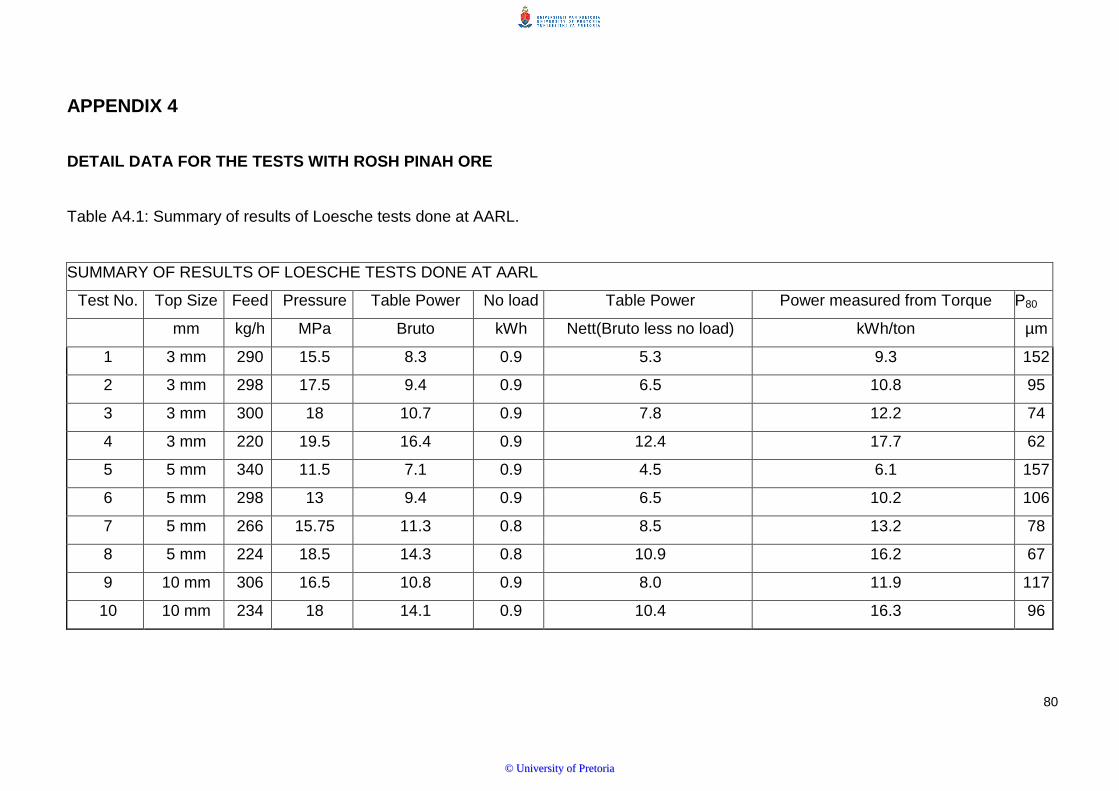
80
APPENDIX 4
DETAIL DATA FOR THE TESTS WITH ROSH PINAH ORE
Table A4.1: Summary of results of Loesche tests done at AARL.
SUMMARY OF RESULTS OF LOESCHE TESTS DONE AT AARL
Test No. Top Size Feed Pressure Table Power No load Table Power Power measured from Torque P80
mm kg/h MPa Bruto kWh Nett(Bruto less no load) kWh/ton µm
1 3 mm 290 15.5 8.3 0.9 5.3 9.3 152
2 3 mm 298 17.5 9.4 0.9 6.5 10.8 95
3 3 mm 300 18 10.7 0.9 7.8 12.2 74
4 3 mm 220 19.5 16.4 0.9 12.4 17.7 62
5 5 mm 340 11.5 7.1 0.9 4.5 6.1 157
6 5 mm 298 13 9.4 0.9 6.5 10.2 106
7 5 mm 266 15.75 11.3 0.8 8.5 13.2 78
8 5 mm 224 18.5 14.3 0.8 10.9 16.2 67
9 10 mm 306 16.5 10.8 0.9 8.0 11.9 117
10 10 mm 234 18 14.1 0.9 10.4 16.3 96
©© UUnniivveerrssiittyy ooff PPrreettoorriiaa

80
Table A4.2: Summary of information needed to calculate the operating indices of the Loesche mill
INFORMATION NEEDED TO CALCULATE THE OPERATING WORK INDICES FOR LOESCHE MILL
Test No. Top size Power consumption F80 P80 F50 P50 F50/P50
mm kWh/t m m m m
1 3 4.00 1400 152 530 65 8.15
2 3 6.50 1400 95 530 40 13.25
3 3 7.79 1400 74 530 30 17.67
4 3 12.43 1400 62 530 20 26.50
5 5 4.53 3000 157 1600 65 24.62
6 5 6.51 3000 106 1600 53 30.19
7 5 8.46 3000 78 1600 38 42.11
8 5 15.00 3000 67 1600 20 80.00
9 10 7.97 5800 117 3350 50 67.00
10 10 10.43 5800 96 3350 42 79.76
11 16 2.40 13800 495 11400 210 54.29
12 16 5.34 13800 230 11400 115 99.13
13 16 11.34 13800 106 11400 56 203.57
14 16 24.68 13800 66 11400 35 325.71
15 16 32.93 13800 44 11400 26 438.46
©© UUnniivveerrssiittyy ooff PPrreettoorriiaa

81
Table A4.3: Summary of work index calculations of the Batch press
WORK INDEX CALCULATIONS OF BATCH PRESS
Test No. Top size Power consumption F80 P80 F50 P50 F50/P50
mm kWh/ton µm µm µm µm
Batch AARL 2 3 3.24 1400 65 530 35 15.14
Batch AARL 3 3 4.05 1400 53 530 30 17.67
Batch AARL 4 5 3 3000 95 1600 50 32.00
Batch AARL 5 5 3.84 3000 65 1600 35 45.71
Batch AARL 6 5 4.17 3000 53 1600 30 53.33
Batch AARL 7 10 3 5800 95 3350 50 67.00
Batch AARL 8 10 3.68 5800 65 3350 35 95.71
Batch AARL 9 10 4.68 5800 53 3350 30 111.67
Batch RP 1 16 3 13800 106 11400 65 175.38
Batch RP 2 16 2.55 13000 95 10250 65 157.69
Batch RP 3 16 3.05 2500 95 850 61 13.93
Batch RP 4 16 2.6 2500 105 850 65 13.08
Batch RP 5 16 3.35 2500 95 850 61 13.93
Batch RP 6 16 3.02 2500 90 850 61 13.93
©© UUnniivveerrssiittyy ooff PPrreettoorriiaa
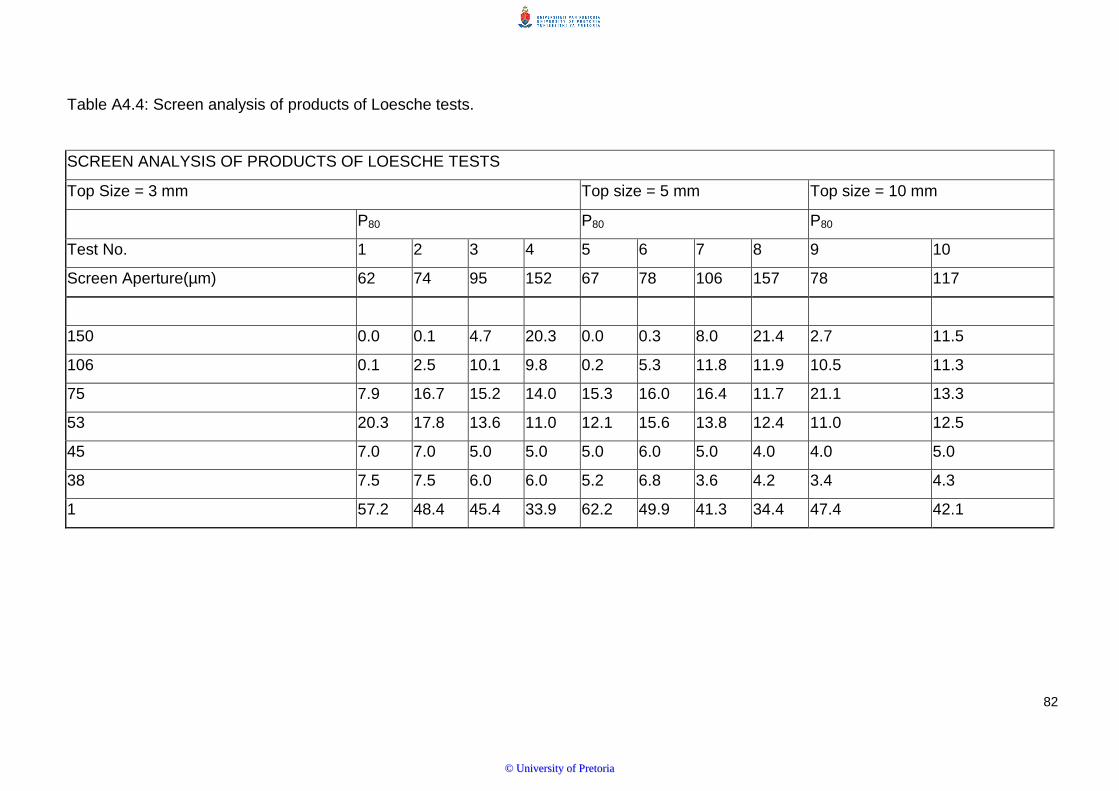
82
Table A4.4: Screen analysis of products of Loesche tests.
SCREEN ANALYSIS OF PRODUCTS OF LOESCHE TESTS
Top Size = 3 mm Top size = 5 mm Top size = 10 mm
P80 P80 P80
Test No. 1 2 3 4 5 6 7 8 9 10
Screen Aperture(µm) 62 74 95 152 67 78 106 157 78 117
150 0.0 0.1 4.7 20.3 0.0 0.3 8.0 21.4 2.7 11.5
106 0.1 2.5 10.1 9.8 0.2 5.3 11.8 11.9 10.5 11.3
75 7.9 16.7 15.2 14.0 15.3 16.0 16.4 11.7 21.1 13.3
53 20.3 17.8 13.6 11.0 12.1 15.6 13.8 12.4 11.0 12.5
45 7.0 7.0 5.0 5.0 5.0 6.0 5.0 4.0 4.0 5.0
38 7.5 7.5 6.0 6.0 5.2 6.8 3.6 4.2 3.4 4.3
1 57.2 48.4 45.4 33.9 62.2 49.9 41.3 34.4 47.4 42.1
©© UUnniivveerrssiittyy ooff PPrreettoorriiaa

83
Table A4.5: Screen analysis of products of batch tests.
SCREEN ANALYSIS OF PRODUCTS OF BATCH TESTS
Top Size = 3 mm Top Size = 5 mm Top Size = 10 mm
P80 P80 P80
Test No. 1 2 3 4 5 6 7 8 9 10
Screen Aperture(µm) 110 81 60 110 97 81 60 110 81 60
150 0.8 0.0 0.0 0.2 0.3 0.0 0.0 1.0 0.0 0.0
106 22.2 1.4 0.7 21.0 13.7 2.1 0.8 20.7 2.1 0.5
75 18.6 24.3 1.4 18.4 19.2 24.3 1.0 18.0 24.1 0.5
53 17.1 21.0 29.4 16.6 17.0 20.9 26.5 16.2 21.2 28.1
45 9.2 12.5 16.5 9.4 8.4 13.2 15.1 11.5 13.0 17.9
38 6.1 8.7 10.3 7.9 7.0 7.2 10.9 5.0 7.6 10.4
1 25.9 32.3 41.7 26.5 34.4 32.4 45.6 27.6 32.1 42.6
©© UUnniivveerrssiittyy ooff PPrreettoorriiaa