evaluation of the effects of the performance-based bonus
TRANSCRIPT

DISCUSSION PAPER SERIES NO. 2020-34
DECEMBER 2020
Evaluation of the Effects of the Performance-Based Bonus Incentive Scheme
Jose Ramon G. Albert, Ronald U. Mendoza, Janet S. Cuenca, Jana Flor V. Vizmanos, and Mika S. Muñoz
The PIDS Discussion Paper Series constitutes studies that are preliminary and subject to further revisions. They are being circulated in a limited number of copies only for purposes of soliciting comments and suggestions for further refinements. The studies under the Series are unedited and unreviewed. The views and opinions expressed are those of the author(s) and do not necessarily reflect those of the Institute. Not for quotation without permission from the author(s) and the Institute.
CONTACT US:RESEARCH INFORMATION DEPARTMENTPhilippine Institute for Development Studies
18th Floor, Three Cyberpod Centris - North Tower EDSA corner Quezon Avenue, Quezon City, Philippines
[email protected](+632) 8877-4000 https://www.pids.gov.ph

Evaluation of the Effects of the
Performance-Based Bonus Incentive Scheme
Jose Ramon G. Albert Ronald U. Mendoza
Janet S. Cuenca Jana Flor V. Vizmanos
Mika S. Muñoz
PHILIPPINE INSTITUTE FOR DEVELOPMENT STUDIES
December 2020

Abstract
In 2012, the government established a Performance-Based Bonus (PBB) scheme to reward
performance, align individual personnel and team-level efforts with agency-wide targets, and
improve public service delivery in the Executive Department. The Department of Budget and
Management, together with other oversight agencies and the Development Academy of the
Philippines, manage the implementation of the PBB using the framework of the Results-Based
Performance Management System. They deem it critical to study the effect of the PBB on
government efforts to boost productivity and push reforms, as well as government employees’
individual and team-level motivations and productivity, especially given the budgetary
implications of the incentive scheme. Prior to this study, a process evaluation of the PBB was
conducted to clarify whether and to what extent the PBB worked as planned. This follow-up
study examines the possible impact of the PBB by employing mixed methods research drawing
on primary and secondary data, undertaking not only a perception-based survey on effects of
the PBB on over 1,200 respondents, but also seven focus group discussions with PBB focal
points and members of the performance management teams of selected agencies, as well as
representatives of oversight agencies. The findings suggest while the PBB has had some design
issues and implementation challenges (e.g. changes in eligibility requirements across the years,
gaming and dysfunctional behavior), the PBB is generally welcomed across the bureaucracy.
Further, there is evidence that the PBB has contributed to boosting individual, team-level and
agency-wide improvements in motivation and productivity. Results of the study suggest that
PBB could be further re-designed to sharpen its effects on public sector reform.
Keywords: performance-based bonus, public sector performance, productivity, motivation
Results-Based Performance Management

Table of Contents
1. Introduction .............................................................................................. 7
2. Review of Related Literature ................................................................. 11
3. Study Design, Methods and Limitations .............................................. 15
3.1. Plans, Objectives and Preparations for 2019 PIDS Survey on Effects of Performance-based Bonus (PSEPBB) .................................................... 17
3.2. Challenges in Survey Operations amid COVID-19 ................................... 19
3.3. Data Analysis Methods, Tools and Limitations ......................................... 21
4. Empirical Findings ................................................................................. 23
4.1. PSEPBB ................................................................................................... 23
4.2. Focus Group Discussions ........................................................................ 45
4.3. Administrative Data .................................................................................. 53
5. Summary, Policy Implications and Ways Forward .............................. 55
6. References .............................................................................................. 58
List of Tables Table 1. Performance and Budget Reforms for Increased Accountability ............................. 8
Table 2. Number of Targeted Survey Respondents (and Total Targeted Government Entities) by Cluster Type and by Eligibility Status of Agency ................................ 18
Table 3. Distribution of Respondents by Cluster Type and Eligibility Status (in FY 2016/17) of Agency ......................................................................... 23
Table 4. Selected Statistics Profiling Respondents by Cluster Type and Eligibility Status (in FY 2016/17) of Agency ......................................................................... 24
Table 5. Proportion (in %) of respondents who aware of various objectives of the PBB, by position status of respondent and by eligibility status of agency in FY 2016/17. ......................................................................................... 26
Table 6. Frequency of agency performance review, by position status of respondent. ...... 28
Table 7. Proportion (in %) of respondents who report perceptions on their ratings, by performance ratings group .................................................................. 29

Table 8. Proportion (in %) of managers who report perceptions on ratings of their delivery units, by performance ratings group ....................................................... 30
Table 9. Proportion (in %) of respondents who were ineligible to receive PPB at least once, by cluster type ................................................................................... 31
Table 10. Reasons for not availing PBB according to respondents who experienced ineligibility in receiving PBB at least once, by cluster type of agency ..................................................................................................... 32
Table 11. Common complaints of employees regarding their PBB, according to managers, by cluster of agency. ...................................................................... 33
Table 12. Proportion (in %) of respondents by extent of agreement on statements on the PBB Implementation, and by cluster type of agency. ................................ 34
Table 13. Proportion of Respondents (in %) who Strongly Agree about Some Statements on the PBB Implementation, among Ineligible and Eligible Agencies and across Cluster Type of Agencies ...................................... 36
Table 14. Proportion of Respondents (in %) who Strongly Agree about Some Statements on the PBB Implementation, by Leadership Position of Personnel and Expected Knowledge of PBB ....................................................... 37
Table 15. Proportion of Respondents (in %) who think their agencies will continue to comply with PBB requirements in the long run even without an incentive, among rank-and-file employees, managers, those from Ineligible And Eligible Agencies and across Cluster Type of Agencies .................................................................................... 38
Table 16. Results of Counterfactual Analysis on Effects of PBB on Individual Performance ........................................................................................................ 40
Table 17. Proportion of Respondents (in %) who Strongly Agree about Some Statements on the Effects of PBB on Individual Performance, by Cluster Type of Agencies, Leadership Position of Personnel, and Expected Knowledge of PBB .............................................................................................. 41
Table 18. Results of Counterfactual Analysis on Effects of PBB on Agency-Wide Performance .................................................................................. 44
Table 19. Proportion of Respondents (in %) who Strongly Agree about Some Statements on the Effects of PBB on Agency Performance, by Cluster Type of Agencies, Leadership Position of Personnel, and Expected Knowledge of PBB ............................................................................... 44
Table 20. Distribution of FGD Participants by Cluster Type ................................................. 45 List of Figures Figure 1. Results-Based Performance Management ........................................................... 7
Figure 2. Theory of Change .............................................................................................. 16

Figure 3. Proportion (%) of respondents by reasons why they choose to and continue to work in their current jobs, by eligibility status of agency. ................... 25
Figure 4. Proportion (%) of respondents who are aware of various bonuses ..................... 26
Figure 5. Proportion (in %) of respondents who identified their sources of information on PBB ............................................................................................ 27
Figure 6. Persons/units identified by respondents as being responsible for (a) determining individual performance targets; and, (b) monitoring and evaluation of these targets .................................................... 28
Figure 7. Persons/units identified by managers as being responsible for (a) determining performance targets of delivery units; and, (b) monitoring and evaluation of these targets. ................................................... 29
Figure 8. Proportion (in %) of respondents who report extent of supervisor’s help for poor and unsatisfactory performers, by eligibility status of agency in FY 2016/17 ........................................................................................ 30
Figure 9. Proportion (in %) of respondents who report specific interventions for poor and unsatisfactory performers, by eligibility status of agency in FY 2016/17 ........................................................................................ 31
Figure 10. Common complaints of employees from eligible and ineligible agencies regarding their PBB, according to managers. ...................................... 32
Figure 11. Changes in PBB Requirements Identified by Rank-and-File and Managers ....... 38
Figure 12. Proportion of respondents (in %), by eligibility of agency, who strongly agree with various statements on the effect of the PBB on their individual performances. ..................................................................................... 39
Figure 13. Proportion of respondents (in %), by eligibility of agency, who strongly agree with various statements on the effect of the PBB on their agency performances. ................................................................................ 43
Figure 14. Common “Top of mind” words associated with PBB among FGD participants .... 46
Figure 15. Recurring words about the PBB for participants from the education sector ........ 47
Figure 16. Recurring words about the PBB for participants outside the education sector .... 47
Figure 17. Recurring words about the PBB for participants from the oversight and validating agencies ....................................................................... 48
Figure 18. Government Participation Rate on the PBB (FY 2012-2017) .............................. 54
Figure 19. Agency Compliance to Good Governance Conditions (FY 2011-2017) .............. 55

List of Annexes Annex 1. PSEPBB Form 1: Questionnaire for Rank-and-File ............................................ 63
Annex 2. PSEPBB Form 2: Questionnaire for Managers ................................................... 68
Annex 3. FGD Instrument : Questionnaire for PBB Focal Person/ Performance Management Team (PMT) ................................................................................. 69
Annex 4. FGD Instrument for Validating Agencies ............................................................ 76

Evaluation of the effects of the Performance-Based Bonus incentive scheme
Jose Ramon G. Albert, Ronald U. Mendoza, Janet S. Cuenca,
Jana Flor V. Vizmanos and Mika S. Muñoz1
1. Introduction
Across countries, improving public sector performance has been a development concern given
the critical role of government not only in providing public goods, but also in setting the overall
socio-economic climate. The effectiveness of public services essentially depends on the
performance of the people who deliver them. Thus, performance management in the public
sector is critical (World Bank 2014a). Civil servants need to be accountable to the people at
all times and they serve the people with utmost responsibility, integrity, loyalty, and efficiency.
(See Section 32, Chapter 9 of Executive Order (EO) No. 292, s. 1987).
To support its public sector reform agenda, the government established the Results-Based
Performance Management System (RBPMS) in 2011, with the issuance of Administrative
Order (AO) No. 25, s., 2011. The RBPMS incorporates a common set of performance
scorecards and establishes an accurate, accessible, and up-to-date government-wide, sectoral,
and organizational performance information system (Figure 1). The RBPMS was meant to
heighten accountability with a set of comprehensive performance indicators across government
institutions linking organizational and individual performance to five key results areas (KRAs)
of the government’s social contract, the results matrix of the Philippine Development Plan
(PDP), and the Organizational Performance Indicators Framework (OPIF).
Figure 1. Results-Based Performance Management
Source: AO 25 Secretariat (2019).
AO 25 s., 2011 also established an inter-agency task force (IATF) on the harmonization of
national government performance monitoring, information and reporting systems. It
emphasized that performance monitoring, evaluation, information and reporting are important
1 The authors are senior research fellow, co-principal investigator (and Dean of the Ateneo School of Government), research fellow, research specialist, and research assistant, respectively, at the Philippine Institute for Development Studies (PIDS). The valuable research assistance of Sherryl Yee, also of PIDS, is gratefully acknowledged. The views expressed in this discussion paper are the authors’ own.

elements of an effective and efficient performance management system. It deemed as critical
the initiative “to rationalize, harmonize, streamline, simplify, integrate, and unify the efforts of
government agencies mandated to exercise broad oversight of government agencies’
performance relative to the National Leadership’s Agenda, the Philippine Development Plan,
agency mandates, commitments, and targets” (AO 25 Secretariat 2019, p.2).
Over the years, the government adopted a number of performance and budget reforms to
heighten accountability for results (Table 1). More specifically, these reforms were meant to
address a number of performance management challenges in the public sector such as
misalignment of goals; the weak link between plans and budget allocation; lack of well-
established performance indicators; “soft” performance targets; lack of focus on results; weak
monitoring; and diffused performance management systems, among others. These issues
necessitated a change in performance culture and mindset (AO 25 Secretariat 2019).
Table 1.Performance and Budget Reforms for Increased Accountability Year Reforms
2018 Budget Modernization Bill
2016 Performance-based Compensation
2015 Program Expenditure Classification
Strategic Performance Management System
2014 Performance-Informed Budget
Performance Negotiation Agreements (since 2013)
2013 Performance Contracts of Secretaries
2012 Performance-based Incentives System
2011 Results-based Performance Management System
Results Matrix (Philippine Development Plan)
2009 OPIF Book of Outputs
Mid-2000s Performance Management System – Office
Performance Evaluation System (PMS-OPES)
2000 Organizational Performance Indicators Framework (OPIF)
Source: AO 25 Secretariat (2019).
EO No. 80, s. 2012 (i.e., Directing the Adoption of a Performance-Based Incentive System for
Government Employees) established a Performance-Based Incentive (PBI) system for
employees in the executive Department within the RBMPS Framework. Developed to support
the government’s reform agenda, the PBI system harmonized and rationalized the incentives
and bonuses granted in government agencies. As specified in EO No. 20, s. of 2012, the PBI
system was meant to “motivate higher performance and greater accountability in the public
sector and ensure the accomplishment of commitments and targets” under the five (5) Key
Result Areas (KRAs) of the government’s social contract on inclusive growth, poverty
reduction, and transparent and accountable government (cf. EO No. 43, s. 2011).
The PBI system is composed of two incentives: first, a productivity enhancement incentive
(PEI), and second, a performance-based bonus (PBB). The first incentive is an across-the-board
bonus, while the second is a top-up incentive associated with organization-wide compliance of
several requirements (e.g., citizens charter, transparency seal, ISO certification), team-level
and individual performance conditions. Compliance with these multi-level requirements has,
de facto, become part of the roll-out objectives of the PBB. The PBI system, especially the
PBB, is thus meant to motivate higher performance and greater accountability in the public

sector and ensure the accomplishment of set commitments and targets. In this sense, the PBI
system, in particular, the PBB, can improve service delivery by linking monetary incentives to
the bureau or delivery unit’s performance, recognizing and rewarding exemplary performance
in government service, aligning individual personnel and team-level efforts with agency-wide
targets, and improving public service delivery. Such an approach emphasizes the vertical
coherence necessary across agency, team and individual efforts to ramp up performance and
productivity.
Assuming conditions at the agency-level are met, the PBB incentives for government
employees are based on their team-level and individual-level performance evaluations. This
actual incentive given to employees has varied from fixed nominal amounts of PhP5,000 to
PhP35,000 in 2012-2015 to a percentage of the salary of the employees in more recent years
with an employee receiving either 50%, 57.5% or 65% of his/her base pay depending on the
ranking of his/her delivery unit. In the period 2012-2018, appropriations for the PBB have
averaged 13 billion PHP per year for a total 92.2 billion PHP (Albert et al., 2019).
Since the start of the PBB, the Department of Budget and Management (DBM), which chairs
the AO25 IATF, has released various guidelines on criteria and conditions for the annual grant
of the PBB related to physical targets, good governance conditions, and performance
management. The protocols include conditionalities for access at both the agency level as well
as the team and individual levels, effectively adding more policy outcomes incentivized by the
PBB. This can be interpreted as vertical coherence in incentivizing and promoting reforms and
actions in support of higher productivity and stronger performance. This builds on the evidence
in the management literature that the conditions for individual and team performance are linked
to broader organizational systems of governance; and that team and individual level incentives
need to be balanced against each other particularly for work where collective action and
teamwork are necessary for optimal performance results (Burgess et al. 2017; Ladley et al.
2015; Bayo-Moriones et al. 2015; Garbers and Konradt 2013; Gibbons 1998).
To qualify for the PBB, government agencies should attain the good governance conditions as
well their performance targets and commitments. The AO 25 IATF evaluates the eligibility of
an agency (and its employees) to receive the PBB. Validating agencies, i.e., members of the
IATF Technical Working Groups (TWGs), assist the Task Force in validating the documentary
requirements submitted by agencies to quality for the PBB. The heads of the agencies are
responsible for implementing the PBI system in their respective agencies, while the heads of
service delivery units and bureaus within the agencies are expected to cascade the performance
targets of the agency to their respective units and to individual employees. The guiding
principles for the entire PBI system are: (a) simple, credible and easy to implement system; (b)
flexible and transparent mechanism for all agencies; (c) gradual transformation of other
incentive schemes into performance-based; and (d) refinement and continuous improvement.
While many agencies take steps to comply with the conditions and documentary requirements
in order for their staff to qualify for the PBB, a number of government agencies/units still have
been considered ineligible for the PBB incentive.
Beginning in FY 2017, the RBPMS started the Tightening Phase by developing enhancements,
“rethinking” the PBB, and conducting examinations on new requirements, criteria, and
simplification of validation processes. FY 2018 marked a new phase for the RBPMS with the
incorporation of Streamlining and Process Improvements and Citizen/Client Satisfaction
requirements for the grant of the PBB. This is in line especially with the recently signed R.A.
No. 11302 s. 2018 or the Act Promoting Ease of Doing Business and Efficient Delivery of

Government Services. For the FY 2019 cycle, the RBPMS will continue to implement the PBB
by focusing on citizen-centric public service delivery, making the Filipino people and their
needs at the forefront of government priorities.
Since 2012, when the PBB was established (partly to augment government salaries while
government was still preparing to increase public sector wages in phases), only a few studies
(viz., World Bank 2014b; Torneo et al. 2017; World Bank, 2020) have assessed the
performance incentive scheme. With the last phase of the salary increases implemented in
2019, it is important to conduct a comprehensive evaluation of the PBB scheme and determine
whether the incentive scheme is worth continuing given its budgetary implications, and in the
wake of other reforms such as the salary increases applied to various parts of the public sector.
According to data from the Civil Service Commission (CSC 2020), the size of the entire
Executive Department, as of August 31, 2020, is 1,194,677 career and non-career positions
across national government agencies (NGAs), government-owned and controlled corporations
(GOCCs), as well as state universities and colleges (SUCs). Thus, the budgetary outlay for the
PBB scheme is quite huge. In the period 2012-2018, appropriations for the PBB have averaged
13 billion PhP per year for a total 92.2 billion PhP (Albert et al. 2019). However, such an outlay
is far smaller (and has been rationalized) compared to the period prior to the PBB when
government agencies, especially GOCCs, were giving all kinds of incentives to their workers
without a standardized framework.
Recognizing that financial incentives meant to improve productivity should be effective in
doing so and that a performance incentive scheme, like the PBB, should be designed in a way
that it achieves significant productivity impact, the DBM requested the Philippine Institute for
Development Studies (PIDS) to undertake an evaluation of the PBB incentive scheme. Albert
et al. (2019) undertook a process evaluation study of the PBB, which essentially looked into
whether or not the PBB has been executed across the years, as per design and plans. This study,
a follow-up on the process evaluation of the PBB conducted by Albert et al. (2019), answers
the central question: “What are the effects of the PBB on the performance and productivity in
the public sector?” It employs mixed methods research, involving the conduct of (i) a survey
of 1,259 employees across the Executive Department, and (ii) seven focus group discussions
(FGDs); examining new primary data from these data collection activities; as well as
scrutinizing available secondary data. Participants to the FGDs include PBB focals and
members of the performance management team of select government agencies; representative
of the AO 25 IATF and secretariat, and representatives of validating agencies.
The study is organized as follows. Section II reviews the literature on behavioral economics,
public sector performance and productivity, and performance incentives in the public sector,
especially as the PBB attempts to reward performance at an individual-, team- and agency-
level. Section III discusses the study design, methods, and limitations. This section also briefly
discusses the theory of change. Section IV discusses the empirical findings from the
perception-based survey of 1,259 government employees, as well as focus group discussions
conducted for this study, and other secondary data. Section V ends with a summary, as well
as conclusions and recommendations.

2. Review of Related Literature As pointed out in the earlier section and in Albert et al. (2019), the PBB incentives are meant
to reward good performance of workers in the Executive Department. Assuming this
performance is linked to team-level and agency-level targets, the PBB can also improve
performance of public sector organizations in the Executive branch of government.
Implementing the PBB follows the framework of a performance management system and is
premised on the theories of motivation (Maslow 1943; Vroom 1964; Kohn 1993; Montana and
Charnov 2008). Another assumption behind the PBB is that managers can differentiate the
performance of individual employees.
However, according to the twelfth of the fourteen points espoused by total quality management
guru Edward Deming (2000), performance appraisals should not be performed at the individual
level, as such ratings can be a barrier to the pride of workmanship. On the other hand, Mitchell
(1982, p.82) pointed out that it will be easier to assess the effects of motivational interventions
or strategies if the performance appraisal system is closely linked with the definition of
motivation (i.e., “the degree to which an individual wants and chooses to engage in certain
specified behaviors”). In this sense, the performance appraisal system should be closer to
measuring individual behavior and performance. Determining the effects of a motivational
system (such as the PBB scheme) necessitates a good performance appraisal instrument, which
is also useful in many personnel functions such as selection and promotion, among others.
Mitchell (1982, p.82) also emphasized that “changes in performance must be detectable and
demonstrable.”
Albert et al. (2019) reviewed the literature related to performance-based incentives in the
public sector with focus on two broad strands such as (a) studies that develop various measures
of performance in the public sector, and (b) studies that examine the links between these
measures and the performance-based incentives geared to better achieve them. In the current
study, the review of literature focuses on the issues and challenges surrounding performance
measurement and also, on the effects of incentives on performance.
a. Measuring Performance in the Public Sector
The use of incentives, both monetary and non-monetary rewards, has long been practiced in
many private organizations (Lewin 2003; Burgess and Ratto 2003; Mogultay nd.), and these
were later adopted in the public sector. In particular, pay for performance (PFP) started in the
private sector and was introduced decades ago in the public sector to improve productivity,
thus producing better results given limited government funds. PFP is grounded on the
assumption that goals are clearly defined and that rewards for achieving these goals will help
motivate employees and also, enhance accountability. Nevertheless, the precise impact of the
incentives may depend on the nature of the job, the career path, and other key drivers of
employment decisions. In addition, the translation of PFP from the private sector to the public
sector posed a challenge. It was not straightforward (Montoya and Graham 2007).
Festre and Garrouste (2008, p.3) pointed out that performance measurement within the public
sector is more complicated compared to the private sector due to the following reasons:
1) There is not always a perfectly identified output in the public sector as it is the case in the
private sector. The quality of the output is an important element to take into account. Although
the problem applies more generally to public goods and services sectors, regardless of them
belonging to the public or the private sector, the focus is on the public sector.

2) The same output can be due to different agencies (or services or departments); it can be
produced by different sets of inputs.
3) The same agency can produce different outputs; it can participate to the production of
different sets of outputs.
4) The outputs can be complementary or substitute.
5) The agencies may produce positive as well as negative externalities.
6) The output is not sold on the market or if it is the case not at its market price.
7) Statisticians have to get the information they need knowing the above difficulties. For
example if different ministries together produce one output, one needs to obtain the relevant
information from all of them.
In the same vein, The Work Foundation (2014) argued that the nature of public sector’s
activities and goals makes it difficult to use performance measurement as a basis for pay. In
particular, public service “good” is complex. The public sector produces a multitude of
outcomes, some of which are not easy to measure, and may only be visible in the long-term.
This raises concern about the feasibility of accurate and meaningful performance measures
under a PRP scheme. Also, the public sector has multiple principals (i.e., various potential
owners and stakeholders) and as such, it should be able to reconcile the different outcomes
from the various stakeholders and interests. Public services are produced and delivered through
collaborative efforts and thus, it will be challenging to determine individual performance and
outcomes. Grant of individual incentives could discourage team work. In addition, PRP may
result in misallocation of effort, i.e., the tendency of employees to focus on easy-to-measure
outcomes at the expense of others (e.g., teaching to the test in the case of education). Gaming
is another issue wherein workers attempt to game the system due to the high stakes associated
with the performance indicators.
Formal performance measures used in both public- and private- sector incentive systems are
based on explicit and objectively defined criteria and metrics. The design of private- and public
sector- performance measurement systems is grounded on the assumption that “employees
perform better when their compensation is more tightly linked to their effort or outputs, and
organizational performance will improve with employee incentives more closely aligned with
organizational goals”. In addition, the conditions and assumptions on which performance
measurement and incentive system model works are stringent and are rarely practiced in the
public sector. These conditions and assumptions include the following: (i) organizational goals and production tasks are known, (ii) employee efforts and performance are verifiable, (iii) performance information is effectively communicated, and (iv) and there are a relatively small
number of variables for managers to control. Moreover, the complex and nonmanual work,
multiple principals and group interactions, political and environmental influences and
interdependencies, and non-standardized outputs challenge and increase the costs associated
with the precise measurement of performance and construction of performance benchmarks
(Heinrich and Marschke 2010, p.184).
These real-world circumstances make the output measures inexact approximate of government
performance. This raises question on the appropriateness of relying heavily on incentives
linked to these output measures. Nevertheless, incentives linked with inexact and incompletely
measures are still widely adopted in performance management systems due to the huge costs
associated with the development of more sophisticated measures and systems of incentives.
Public sector reforms meant to improve government performance and achievement of program
outcomes reflected such simplistic approach to motivating and measuring performance (Dixit
2002).

Montoya and Graham (2007, p.13) agreed that performance measurement may be more
difficult in the public sector. Also, the authors argued that the use of incentives in the public
sector does not necessarily work just like in the private sector wherein the feasibility of firing
poor performers reinforces the incentive scheme. As the authors put it, “public servants do not
typically have “at will” contracts. This makes the firing of poorly performing employees more
difficult than in the private sector.” The authors pointed out the need for research to determine
whether the tightness of public employee firing regulations and the strength of public-sector
unions protect poor performance.
On the other hand, Burgess et al. (2012) identified poor measurement of output as one of the
reasons to expect such schemes not to work. Talbot (2007) shed light on factors affecting
measurement of public sector performance or outputs. The first one concerns the
incompleteness of performance information. He argued that performance information often
provides incomplete picture of public activities which are diverse and complex. Some degree
of distortion and exclusion in measurement can be expected. In particular, what is not measured
is important to one stakeholder or another and so, performance measurement can conceal
certain aspects of performance. On the contrary, there is also a tendency for performance
measurement systems to become more complex, i.e., to ensure completeness, thus resulting in
informational overload that renders the system unworkable and costly. The costs (e.g., staff
time) of generating performance information, particularly in complex areas, can be excessive.
Moreover, performance measurement involves putting quantitative values onto various aspects
of public services which are actually difficult to quantify. Much focus is given to quantity over
quality which has distorting and demoralizing effects, particularly in human services where
aspects of good performance cannot be easily measured. Performance measure is also prone to
manipulation and deception to present the best picture. Distorted behaviors and unintended
consequences follow. Furthermore, Talbot (2007) noted that the effectiveness of performance
measurement deteriorates over time which undermines the possibility of long-term stability in
performance measurement. He also mentioned Charles Lindblom’s argument that public
systems are dominated by politics which undermines attempts to promote rationality.
Andrews (2014) pointed out that performance incentives in the public sector sometimes distorts
the priorities of organizations in service delivery and inhibits genuine innovation, which in turn
is disadvantageous to service users. On the other hand, The Work Foundation (2014) noted that
PRP model neglects other factors that equally motivate employees such as peer effects,
perceptions of fairness, and intrinsic motivations (e.g., belief in the intrinsic value of the service
they perform). The said study cautioned about the risk that performance pay can crowd out
intrinsic motivation, which contradicts the intentions of the PRP schemes. The said concern is
also raised in other literature (e.g., Gneezy, Meier, and Rey-Biel 2011; Underhill 2016). More
specifically, crowding out of public sector motivation by the use of extrinsic incentives is
identified in Burgess et al. (2012) as another reason to expect PRP schemes not to work.
In sum, performance standards and measures and their application are important to both the
agency and employee. Thus, it is critical that (1) performance goals and measures are relevant,
reasonable, and usable; (2) employees understand and participate in the performance evaluation
process; and (3) performance is evaluated fairly and rigorously (U.S. Merit Systems Protection
Board 2006, p.xii). According to The Work Foundation (2014, p.11), the following key
challenges should be addressed if PRP schemes are to be implemented in the public sector:

1. Unintended behavioral consequences as a result of PRP incentives, such as:
• gaming behavior
• crowding out effects
• an absence of behavioral change
• misallocation of effort and
• detrimental consequences to teamwork and cooperation.
2. Difficulties in the measurement of outputs in public sector PRP, including
• negative effects of particular performance measures (e.g. absolute/relative,
linear/ threshold) and
• managerial subjectivity in assessment; and
3. A lack of fit between incentivized outputs and desired social outcomes, including:
• Poor long-term outcomes; and
• Poor cost-effectiveness
b. Impact of Incentives on Performance
Due to the complex nature of incentives schemes, there are few rigorous impact evaluations
based on experimental methods such as randomized controlled trials. Impact evaluations in
Indonesia for healthcare services (Olken et al. 2014) and in Pakistan for tax collection (Khan
et al. 2016) revealed that incentives can produce improvements in very specific target outcomes
(e.g., child and maternal health indicators and tax collection targets). Also, non-financial
incentives (like flexibility in assignment choice) can also be effective (Khan et al. 2016).
There are more mixed-method studies, drawing on qualitative analyses, surveys, and
interviews. Studies of healthcare in Rwanda (Rusa et al. 2009) and public services in Nigeria
(c) show that incentives can improve results orientation among government bureaucrats, yet
these can also trigger dysfunctional responses to game the incentives.
In as far as the PBB is concerned, there have only been a few studies that looked into the
incentive scheme. In 2014, the World Bank conducted a study on Pay and Performance in the
Philippine Civil Service. Making use of a perception survey of 4,500 officials from across eight
government departments, the study suggested that the PBB yielded a positive impact on
government performance (World Bank 2014a). Support for the PBB was found to be strong in
the bureaucracy with 70 percent of respondents agreed PBB helps improve performance. The
study also found evidence about improvements in management practices: greater teamwork,
better target setting and monitoring, and fostering trust within units. Recently, the World Bank
(2020) has come up with a study on Improving Talent Management in the Philippines Civil
Service. Findings from the Philippines Civil Servants Survey 2019 suggested that while the
PBB is not fully effective, but it has improved. About three in five respondents (57 %) report
that the performance evaluation scheme identifies ‘bad’ performers (compared to 39% in 2013
survey), while 67 percent feel the PBB process is transparent (compared to 38% in 2013).
Another set of interesting studies by Torneo et al (2017), supported by AUSAID, looked at the
entire PBIS. The study also made use of mixed methods research, document analysis,
interviews and surveys focused on the CHED, the Department of Interior and Local
Government (DILG) and the Department of Education (DepED). Results of this study
suggested that the PBIS improved on the previous incentive system notably in terms of
framework, comprehensiveness, details required, and financial rewards. Further, it noted high

compliance with PBIS. However, it also found evidence of transparency and fairness issues,
and allegations of staff “gaming” the system to get higher PBB, which was also reported in
Albert et al. (2019).
Although pay-based incentives can improve public sector performance, the extent of
improvements vary (World Bank 2014b). A review of a number of studies on performance-
related pay (PRP) indicates that about three-fifths (93) of 153 studies yielded a positive effect
of PRP. In contrast, several of the studies examined identified issues pertaining to unintended
consequences, particularly “gaming” of the financial incentives.
World Bank (2014b) argued that the move of some East Asian countries to mandate forced
rankings could demoralize staff. Also, the effectiveness of such policy varies considerably
depending on whether the performance appraisal system is viewed positively by staff. More
specifically, in the case of the Philippines, a survey of government staff revealed varrying
views on the effects of the incentive, depending on factors that include (i) performance ranking
of the respondent, (ii) effectiveness of the individual performance appraisal process, (iii)
transparency of individual performance ratings, and (iv) impact of the incentive on staff morale.
In addition, respondents of the World Bank (2014b) suggested that the incentive scheme
motivated management within their organizations to pay more attention on the following
aspects and processes: (i) target-setting of the organization, (ii) monitoring whether these
targets have been attained, and (iii) working with staff pertaining to this process, as well as
harnessing better teamwork and collaboration. Although staff complained about the credibility
of the performance appraisal system, the staff were positive about the incentive bonus. In the
final analysis, the report concluded that “there is as yet no discernible effect of this improved
management on individual productivity and organizational citizenship” (World Bank 2014b,
p. 48).
3. Study Design, Methods and Limitations
Public sector performance is ideally assessed through improvements in (development)
outcomes (such as the reduction of poverty and hunger, improvements in the health and quality
of learning of Filipinos, sustainable production and consumption, etc.). However, the “results
chain” between a policy intervention such as the PBB and the improvement in the development
outcomes is a long one with many intervening factors. In the same vein, the “theory of change”
that outlines causal linkages between the PBB and public sector delivery is rather complex with
several intervening factors, many of which are actually beyond the control of the government,
including individual behavioral motivations, governance and organizational issues.
Quantifying whether the PBB resulted in improvements in public goods is also contentious
given methodological issues in attributing any improvements in these to the PBB.
It is clear from the design of the PBIS that it has several policy objectives, including
incentivizing agency-level reforms (in order to comply with the conditions for access); and also
incentivizing team-level and individual-level effort and performance (Figure 2). Based on
Memorandum Circular No. 2012-1, the grant of PBB aims to recognize and reward exemplary
performance in the public sector; rationalize distribution of incentives across performance
categories of groups and individuals; nurture team spirit toward the effective execution of
operational plans by linking personnel incentives to delivery unit’s performance; and
strengthen performance monitoring and appraisal systems based on existing systems.

Figure 2. Theory of Change
Source: Authors’ representation.
Incentives system reform could be used to trigger changes in policies and behavior at the
individual, team- and agency- level. The underlying assumption here is that when agency-level,
team-level and individual-level changes cohere and reinforce each other towards agency
objectives, then public sector services, and ultimately development outcomes, can be enhanced.
This can be interpreted as a form of vertical coherence in agency, team and individual reforms
and actions towards enhanced productivity. This theory of change, or results chain, is based on
a framework that performance is a function of motivation, ability, aptitude level, skill level,
understanding of the task, choice to expend effort, choice of degree of effort, and choice to
persist, facilitating and inhibiting conditions beyond the control of the individual, etc., and that
job performance (i.e., an important organizational factor that management aims to influence),
is improved through a motivational scheme, with motivation, being a primary cause of behavior
(whether intrinsic or extrinsic) (Mitchell 1982). Establishing identification is expected to be
challenging, given the multiplicity of policy interventions involved (and at different levels),
and the high likelihood that those most ready to comply with the PBIS are also some of the
stronger performing government agencies and public sector workers.
Nevertheless, this study attempts to provide information about some of the possible effects
produced by the PBB incentive scheme. Evaluations generally help in determining what works
well and what could be improved in a program/policy. This could help guide policymakers in
whether adjustments can be made in policies on performance-based incentives, based on
information gathered from across the bureaucracy, pertaining to implementation deficits.
Nevertheless, it is important to mention here that this study is not meant to be a rigorous impact
evaluation, given the complex nature of the PBB reform. It involves multiple levers for
incentivizing agencies, teams/units, and individuals to improve on performance either directly
or indirectly. The timing of the elements of the PBB also makes it difficult to focus on any one
policy for isolated study and assessment. This study, in fact, highlights how multiple incentives
constituted the PBB, and these were not rolled out uniformly and may have created myriad
incentive effects on performance.
Randomized controlled trials (RCTs), the gold standard in impact evaluation, are not possible
in this setting because of the very nature and complex design and implementation of the PBB.

Other techniques such as regression discontinuity (RD) would be less applicable due to data-
availability constraints, combined with the frequent changes in the key conditions for accessing
the PBB. And as noted, in the literature, mixed methods are favored in trying to assess
performance-based incentive schemes.
To overcome this complexity in conducting a comprehensive assessment of the PBB, the
approach taken in this study to measure effects of the PBB is to (i) make use of data collected
from a perception-based survey on the motivation and performance of government employees
across the Executive Department, (ii) examine quality data from focus group discussions
(FGDs), and (iii) analyze secondary data on institutional outputs. Altogether, these data sources
provide an initial assessment of the possible effects of PBB while recognizing that one could
not isolate the impact of the myriad of incentives that together made up this reform.
Thus, instead of rigorous impact evaluation approaches like RCT, or RD, the study involves
the conduct and analysis of a perceptions-based survey to gather data on performance effects,
complemented by qualitative methods such as FGDs. These methods cohere with the PBB as
they give a more holistic picture of the many moving parts of the reform. In light of the
limitations on the identification strategy, all the analyses will be carefully framed in terms of
possible joint effects of different factors underlying performance.
3.1. Plans, Objectives and Preparations for 2019 PIDS Survey on Effects of
Performance-based Bonus (PSEPBB)
In conducting sample surveys, there is a preference to use probability methods for selecting
respondents so that they can represent the targeted population, if the objective is to use the
sample data, especially when weighted according to the survey design, to infer results to the
entire population. The 2019 PIDS Survey on Effects of Performance-based Bonus (PSEPBB)
has been designed to be a face-to-face (FTF) interview of a desired sample size of 2,000
government employees from government entities across the Executive Department. To account
for survey non-response (in particular, assuming a non-response rate of ten percent),
preparations were made to adjust the targeted sample size upward to 2,200. As per survey
plans, the respondents for the PSEPBB were to be chosen through a two-stage stratified random
sampling scheme. The primary sampling units (PSUs) are the government entities, while the
secondary sampling units are employees holding a permanent position within the chosen
government entities.
PSUs were stratified according to (a) cluster type, (b) size of the government entities, (c)
location, and (d) eligibility for PBB in FY 2016-2017 using information provided by DBM and
the AO 25 Secretariat. Following Albert (2019), the cluster types of government entities
studied for the evaluation include: (i) national government agencies (NGAs), constitutional
commissions, and government- owned-and-controlled corporations (GOCCs), (ii) the
Commission on Higher Education (CHED), and SUCs, and (iii) the DepED, and public
(elementary and high) schools. Location was taken into account to minimize data collection
costs while ensuring representativeness. Most NGAs were located in the National Capital
Region (NCR) but some field/satellite offices of NGAs and GOCCs were also selected for the
study as per recommendation of the AO 25 Secretariat, aside from SUCs and schools and
offices from Balance Luzon, Visayas, and Mindanao. To attempt a counterfactual analysis in
the study, stratification of PSUs also involved whether or not government entities were eligible
for the PBB for FY 2016-2017. The choice of the FY for the eligibility period was driven by
data issues (i.e., difficulty getting “recent” data needed), and also because this was the period

when some tightening of PBB eligibility requirements resulted (Albert et al. 2019). The
distribution of targeted respondents (and government entities) across the strata is given in
Table 2.
Table 2. Number of Targeted Survey Respondents (and Total Targeted Government Entities) by Cluster Type and by Eligibility Status of Agency Cluster Type of Government Entity (and location) Eligibility*
Eligible Ineligible
(i) CHED and SUCs 310 (6) 310 (6)
(ii) NGAs and constitutional commissions (central office) 660 (13) 250 (5)
(iii) NGAs and constitutional commissions (field offices) 90 (9) 30 (3)
(iv) GOCCs (central office) 80 (2) 280 (5)
(v) GOCCs (field offices) 10 (1) 20 (2)
(vi) and public schools 120 (6) 40 (2)
TOTAL 1270 (37) 930(23) Note: * = PBB eligibility status of agency for FY 2016-2017. Source: Authors’ tabulation.
Survey respondents were also be randomly selected proportional to size from two groups, viz.,
(a) rank-and-file positions (SG 23 and below) ; (b) managerial positions (SG 24 and above).
The survey consisted of two forms, for each of these two groups of positions. Two separate
forms were used given that managers may have extra knowledge about the effects of the PBB
at the team- and organization-level. Preferably, one (1) PBB focal person and one (1) to two
(2) members of the Performance Management Team (PMT) are also selected as participants
for the survey.
The PSEPBB instruments, found in Annexes 1-2, comprise sections on
• basic information on the respondent;
• knowledge about the PBB;
• implementation of the PBB;
• effect of PBB on individual’s performance and productivity; and
• effect of PBB on Department/Agency’s performance and productivity
Further, the PSEPBB questionnaire was not limited merely to the PBB, but also had a section
(of questions) on human resource development and workforce readiness. This discussion paper,
however, focuses only on the results pertaining to the effects of the PBB and the respondent
profile (see next section).
Aside from the design of the survey and the instruments, survey preparations involved
procuring outsourced services in data collection, pilot testing of instruments securing the
clearance2 from the Philippine Statistics Authority on the conduct of the PSEPBB, as well as
2 As per Republic Act No. 10624, also known as the “Philippine Statistical Act of 2013”, the Philippine
Statistics Authority (PSA) has in place the Statistical Survey Review and Clearance System (SSRCS), which
provides assistance and support to the statistical work of government agencies, including the local government
units (LGUs) and government-owned and controlled corporations (GOCCs).The SSRCS is a mechanism
implemented by the Philippine Statistical System (PSS) through the PSA; this system involves a process of
evaluating the design and instruments of statistical surveys or censuses sponsored and/or to be conducted by
government agencies, including LGUs and GOCCs. The SSRCS aims to ensure conformity with standard
definitions, concepts and classifications, and thus, the reliability, comparability and accuracy of official statistics
generated out of these surveys and/or censuses. The specific objectives of the SSRCS are to: ensure sound

coordinating with the targeted government entities to be surveyed. Further, the PIDS research
team also designed a focus group discussion instrument, see Annexes 3-4, consistent with
information expected to be generated from the PSEPBB.
To ensure the validity of the information of targeted respondents, the PIDS study team sent out
endorsement letters to the sampled government agencies with the intention to gather support
on the conduct of the PSEPBB and for their office to assign a focal person for the activity
(preferably personnel for the human resource unit) to assist the data partner, The All-Asian
Centre for Enterprise Development (ASCEND), in the selection of respondents within their
agency.
3.2. Challenges in Survey Operations amid COVID-19
Data collection for the PSEPBB was to be started last March 2020, but with the onset of the
novel coronavirus (COVID-19) pandemic and the enforcement of the Enhanced Community
Quarantine (ECQ) in various parts of the country to manage the spread of COVID-19, the PIDS
research team and ASCEND had to forego with data collection plans for FTF interviews, field
work spot checks, and FTF focus group discussions. Instead, the PIDS research team asked
ASCEND to make use of mobile phone interviewing, or video interviewing through a cloud-
based video chatting platform, such as zoom.
The original plans for FTF interviews for the PSEPBB were meant to generate quality data for
the study, as FTF interviews can build rapport and motivate respondents to answer
conscientiously and disclose sensitive information (Schober 2018). Furthermore, PSEPBB
field enumerators can view the respondent’s nonverbal demeanor and circumstances in a FTF
interview, and as a result of the social interaction through FTF interview, communicate a
message of a human touch to the respondent (in comparison to non-FTF interview modes). But
the advent of the pandemic and the ECQ measures forced a rethinking of the survey plans, and
with this adjustment, ASCEND had to recalibrate the survey operations manual, and retrain its
personnel. Furthermore, the entire survey research timetables for the study had to be re-
adjusted.
The PIDS study team also had to adjust its plans for spot checks of the survey interviews, by
participating in the cloud-based video chatting platform rather than through FTF fieldwork as
original planned. The study team also adjusted plans to conduct selected focus group
discussions using the FGD instruments (see Annexes 3-4) by making use of Webex, the
videochat internet platform used by PIDS.
Before scheduling interviews, ASCEND conducted activities to explain data privacy to the
targeted respondents. Since the topic, i.e., the PBB, should be of particular interest to the
respondents, the PIDS research team initially thought that non-responses would not be too high,
but the team recognized that there would be added complications, e.g., securing the contact
details of the targeted respondents (and correct details at that), difficulties with technology
design for data collection; minimize the burden placed upon respondents; effect economy in statistical data
collection efforts; eliminate unnecessary duplication of statistical data collected; and achieve better coordination
of government statistical activities (https://psa.gov.ph/content/faq-statistical-survey-review-and-clearance-
system; Albert and Vizmanos 2019) .

access (i.e., phone/internet signal problems), and issues about comfort of respondents being
recorded on video.
ASCEND encountered problems not only in contracting the targeted respondents, but in
contacting several of the targeted institutions due to the lack of accurate or working contact
information. Although emails had been sent to all targeted institutions (with follow ups also
through email and social media accounts of these institutions), institutions did not always
respond, and even when they did, the contact details of respondents were not always accurate.
Extra contacts with institutions were very difficult to undertake, likely because of limited
human resources in government institutions handling communications, the lack of
prioritization for the survey (given the likely survey fatigue especially amid the pandemic), and
other concomitant communication issues. In the event of ineligibility, a refusal, or
unavailability of the respondent during data collection, the ASCEND enumerators were to
coordinate with the focal person of the agency for the replacement of respondent, but this was
not always an easy task to perform.
The protocol to make use of a focal person in the agency was, however, helpful to improve the
intra-institution response rates. At this point, the only notable problem encountered with
interviews from areas outside the central offices of the targeted government entities was a bit
of confusion as to which field office the respondents were coming from. ASCEND was
immediately able to resolve this after consultation with the PIDS and coordination with the
focal person from the concerned satellite/field office.
In contrast to the interview protocols of several government entities, some other entities did
not centralize the scheduling of interviews which meant that ASCEND’s enumerators were left
to establish contact with the designated respondents and schedule them for their interviews.
This resulted in very few confirmations, and this was promptly communicated to the
institution’s focal person was promptly notified of. Through the intervention of the focal,
ASCEND eventually managed to reach most of the respondents and enjoin them to participate
in the PSEPBB. Although the interviews had begun in earnest, the participation of government
entities had stagnated in time, perhaps because of adjustments undertaken by the government
entities to the “new normal”, and likely fatigue from many surveys currently being undertaken
amid the pandemic. Nonresponses from some institutions led to the replacement of these
institutions, though this was only undertaken as a last resort, and in cognizance of ASCEND’s
due diligence in attempting to secure survey participation.
By September, given the low survey response rates, ASCEND requested the PIDS to allow the
use of another mode of data collection: a self-administered online survey to further facilitate
and expedite data collection. The PIDS research team agreed with this suggestion. In addition
to the challenges in implementation of the survey amid the pandemic, ASCEND also had some
concerns about the questionnaire, e.g., responses not being among the choices; managers' /
supervisors' salary grades being below 24 for some government entities; respondent not able
to remember; definition of some terms (PBB focal person, advisory board). These were
addressed in consultation with the PIDS research team.

3.3. Data Analysis Methods, Tools and Limitations
The study involved a desk review of various DBM and AO25 Secretariat documents/reports,
coupled with an examination of the literature on measurement of public sector performance,
on evaluation of performance incentives in the public sector, especially studies on the PBB
(World Bank 2014; Torneo et al. 2017; Albert et al., 2019; World Bank 2020), and other
relevant literature in behavioral economics that shed light on the role of motivation as a trigger
for performance at the individual level, which, in turn, together with group dynamics and other
factors can influence performance at the team and agency levels. The literature review and a
conceptual framework was discussed in the second section of this report.
Descriptive data analysis of the results of the 2019 PSEPBB was also conducted for this study.
Empirical findings are discussed in the next section. Tabulations and visualizations of survey
variables from the various sections of the survey were performed, showing aggregate results of
survey variables pertaining to respondents from eligible agencies, contrasted with those from
ineligible ones, with the difference in aggregates being a preliminary counterfactual analysis.
A more rigorous quasi-experimental comparison was also made between those from eligible
agencies and non-eligible ones, using propensity score matching (PSM). With PSM, an
artificial control group is generated by matching each respondent from the eligible agencies
with a respondent from a non-eligible agency of similar characteristics. In particular, PSM
computes the probability that a respondent will be given the PBB based on observed
characteristics. Then, PSM matches PBB-eligible respondents to non-eligible respondents
based on the propensity score. The entire PSM methodology relies on the assumption that,
conditional on some observable characteristics, non-eligible respondents can be compared to
PBB-eligible respondents, as if the PBB has been fully randomized. In other words, PSM tries
to mimic the RCT impact evaluation design to overcome issues of selection bias that plague
non- experimental impact evaluation methods. Note that ultimately, PSM estimation results
can only be as good as the characteristics of the respondents used for matching.
Sample surveys, particularly the 2019 PSEPBB which is based largely on perceptions, have
their sets of limitations given that measurements are subject to errors, both sampling and non-
sampling errors. The 2019 PSEPBB was designed to be a perception-based survey of
government bureaucrats with the respondents chosen through probability methods. However,
amid the pandemic, the survey design had to be adjusted given the restrictions in physical
movements of people. Such adjustments, however, do not guarantee that the resulting data can
be weighted appropriately to allow the respondents to represent the entire sampling frame,
especially given (a) the level of cooperation for the study likely resulting from the burden of
survey participation amid the many demands to government services and the work-from-home
arrangements by government agencies. and (b) the varying modes of data collection employed
(i.e., phone interviews, video interviews, and online survey) that could have affected the quality
of data collected. In consequence, all the data analysis conducted are unweighted. Further, even
if the weights could be properly used, because of the sheer size of public school teachers in the
bureaucracy, a weighted analysis would always skew the aggregate results toward how the
DepED cluster would respond. To show the extent of differences in views across
subpopulations of the bureaucracy, we thus occasionally carry out some data disaggregation
by cluster type.
Survey errors could also arise from respondents’ misunderstanding of questions. For instance,
a few survey respondents who reported to have gotten outstanding ratings in the most recent
PBB were also of the view that they should have obtained better ratings. Other errors can arise

from memory recall biases. For instance, when asked whether or not they did not receive the
PBB at least once, some respondents responded negatively even though they are from agencies
that were ineligible in FY 2016/17. This has likely resulted from some confusion given that
PBB incentives are received by agencies, not on specific dates (unlike the thirteenth or
fourteenth month pays), but after the validating agencies, the Secretariat and the DBM are able
to validate the agency eligibility based on submitted documents.
Filipinos appear to provide positive outlooks perhaps partly arising from Hawthorne effects,
the latter of which results when a person participating in a study acts. behaves or responds
differently than s/he normally would because s/he is aware her/his behavior is being observed
(McCambridge et al., 2014). Since several questions in the survey are perception-based, we
examine only the proportion of respondents who strongly agree with certain statements in the
survey pertaining to the individual and institutional effects of the PBB (to control for such
Hawthorne effects).
For the FGDs, the instruments were made to cover a wide array of topics, with an order of the
general topics into a logical sequence. Questions were designed to be open rather than closed,
neutral, short and to the point. As the FGD progressed, the moderators, who are members of
the PIDS research team, asked questions, listened carefully to the responses and probed for
more information. FGD participants were assured about anonymity and confidentiality of
information, as were the survey respondents.
A full transcription of interviews were made, with the FGD transcriptions subjected to
qualitative data analysis, particularly content analysis with the use of the Nvivo software.
Using content analysis, we quantified and analyzed the presence, meanings and relationships
of such certain words, themes, or concepts mentioned during the FGDs. This involved coding
the responses for each of the FGD questions. For each question asked during the FGDs, the
main ideas that occur in the responses given were noted and reviewed several times. Critical
thinking was performed about the recurring main ideas to identify major themes, with contrasts
made between the representatives of selected agencies and those who represented the AO25
IATF (including the Secretariat and the validating agencies in the IATF TWGs). Quotations
were sometimes identified to illustrate each theme. Statistical analysis of these main ideas and
major themes was performed, and illustrated by way of frequency tables and visualizations,
including word clouds.
In FGDs, there is always a possibility that some participants dominated the discussions, and
thus the summary of results would only be based on information provided by these participants.
Thus, the moderators tried to listen as attentively as possible and to ensure having as many
people give their views during the FGDs.
Since the FGDs involved qualitative data analysis, which is a very personal process with few
rigid rules and procedures, the findings can be read differently depending on the standpoints.
However, since content analysis with Nvivo was used, the analysis had been much more
mechanical and similar to some extent with the survey data analysis, focusing on frequencies
of responses.

4. Empirical Findings
4.1. PSEPBB
The 2019 PSEPBB covered many topics that could influence performance and motivation,
including their educational attainment, years of stay, and career incentives; it also covered some
human resource development and workforce readiness information, although this material is
not examined here. Survey results reported in this discussion paper typically are disaggregated
by eligibility status of the agency in FY 2016/17 to perform a mere semblance of a
counterfactual analysis given the PBB design (e.g., yearly changes in requirements) that make
it practically impossible to conduct a rigorous impact evaluation study. While there was a
survey question that are asked whether (or not) the respondent was ineligible to receive PBB
at least once, and we would have wanted to use this for the counterfactual analysis,
unfortunately, there is evidence of some memory recall bias: two fifths (38%( of respondents
from agencies ineligible for the PBB in 2016/17 reported that they have never been ineligible
to receive the PBB. Likely this is exacerbated by the fact that PBB incentives are not released
on a fixed schedule (unlike 13th and 14th month bonuses).
4.1.1. Profile of Survey Respondents As of November 6, 2020, a total of 1,259 employees in the Executive Department (from 46
government entities, 30 of which were PBB-eligible in FY 2016/17) participated in the 2019
PSEPBB (Table 3).
Table 3. Distribution of Respondents by Cluster Type and Eligibility Status (in FY 2016/17) of Agency Cluster Type Eligibility Status
Ineligible Eligible Total
NGAs 180
(25.40)
528
(74.60)
708
(100.00)
SUCs 148
(47.10)
166
(52.90)
314
(100.00) 19
(16.50)
96
(83.50)
115
(100.00)
GOCCs 41
(33.60)
81
(66.40)
122
(100.00)
Total 388
(30.80)
871
(69.20)
1259
(100.00)
Note: Row percentages in parentheses. Source: 2019 PSEPBB, PIDS.
About 70 percent are from agencies that were PBB-eligible in FY 2016/17. Average age was
45 years. Two in three (65.6%) respondents are female (among managers, three in five are
female). Three fifths (63.3%) are unmarried. Respondents served, on average, 10 years, in their
current position. The bureaucracy is very well educated: three percent of the PSEPBB
respondents did not complete any college, while around sixty percent have taken at least some
masteral units (with an even much larger proportion in SUCs). Table 4 provides a profile of
the PSEPBB respondents.

Table 4. Selected Statistics Profiling Respondents by Cluster Type and Eligibility Status (in FY 2016/17) of Agency Statistics Cluster
Type
Eligibility Status
Ineligible Eligible Total
Proportion (in %) of female respondents NGAs 61.1 70.1 67.8
Average age of respondent 48.3 44.0 45.1
Average number of years in current position 11.3 9.7 10.1
Proportion (in %) of unmarried respondents 63.3 58.3 59.6
Proportion (in %) of respondents who did not
finish college 8.9 3.0 4.5
Proportion (in %) of respondents who have at
least some masteral units 40.0 57.2 52.8
Proportion (in %) of female respondents SUCs 68.2 53.6 60.5
Average age of respondent 44.5 46.5 45.5
Average number of years in current position 10.3 9.4 9.9
Proportion (in %) of unmarried respondents 69.6 71.1 70.4
Proportion (in %) of respondents who did not
finish college 0.7 0.6 0.6
Proportion (in %) of respondents who have at
least some masteral units 89.9 82.5 86.0
Proportion (in %) of female respondents
63.2 84.4 80.9
Average age of respondent 45.3 43.1 43.5
Average number of years in current position 6.7 13.9 12.9
Proportion (in %) of unmarried respondents 73.7 65.6 67.0
Proportion (in %) of respondents who did not
finish college 0.0 0.0 0.0
Proportion (in %) of respondents who have at
least some masteral units 68.4 62.5 63.5
Proportion (in %) of female respondents GOCCs 48.8 53.1 51.6
Average age of respondent 46.0 38.7 41.2
Average number of years in current position 9.1 4.9 6.0
Proportion (in %) of unmarried respondents 68.3 60.5 63.1
Proportion (in %) of respondents who did not
finish college 0.0 3.7 2.5
Proportion (in %) of respondents who have at
least some masteral units 53.7 58.0 56.6
Proportion (in %) of female respondents Total 62.6 66.9 65.6
Average age of respondent 46.4 43.9 44.7
Average number of years in current position 10.5 9.7 9.9
Proportion (in %) of unmarried respondents 66.8 61.8 63.3
Proportion (in %) of respondents who did
not finish college 4.4 2.3 2.9
Proportion (in %) of respondents who have
at least some masteral units 61.9 62.7 62.4 Source: 2019 PSEPBB, PIDS.

Among the nine reasons identified in the survey why respondents choose to and continue to
work in their current jobs, job security is the most prevalent reason, with around 90 percent or
more of respondents in both eligible and ineligible agencies citing this reason (Figure 3). Three
out of four respondents also suggest that good salary. benefits, personal satisfaction are the
reasons why they choose to and continue to work in their current jobs, while about two thirds
cite advancement potential and a mission. On the other hand, about half report that flexible
hours and reasonable workload are the reasons why they stay in their current jobs, while less
half cite social status.
Figure 3. Proportion (%) of respondents by reasons why they choose to and continue to work in their current jobs, by eligibility status of agency.
Source: 2019 PSEPBB, PIDS.
4.1.2. Knowledge about PBB All PSEPBB respondents are aware of at least one bonus that they received, as of 2019. After
the PBB, which has awareness among all survey respondents3, the 13th month-pay and the 14th
month pay had the highest awareness at 90.1% and 80.1%, respectively, while less than half
3 While only 90.9 percent of respondents reported about the PBB in the “unaided” question on the awareness of
respondents of various bonuses, further probing with other survey questions revealed that all respondents
actually were aware of the PBB. It is thus possible that the awareness ratings for other bonuses may be much
higher as well. Even without accounting for the probing done in other questions, the PBB still had the highest
awareness ratings among the seven bonuses identified in the survey.

were aware of the cash gift, the collective negotiation agreement (CNA) bonus, and the clothing
allowance. (Figure 4).
Figure 4. Proportion (%) of respondents who are aware of various bonuses
Source: 2019 PSEPBB, PIDS.
Overall, about two-thirds of respondents are aware of individual-level objectives of the PBB
(e.g., to reward good performance and to motivate higher performance and productivity); but
less than half are aware of objectives at the team- and agency-levels (such as ensuring
accomplishment of targets, improving public service delivery and accountability, as well as
strengthening teamwork). Differences in awareness of all PBB objectives are much more
evident between rank-and-file employees and managers, with the latter being more aware of
PBB objectives, than between employees from eligible and ineligible agencies in FY 2016/17
(Table 5).
Table 5. Proportion (in %) of respondents who aware of various objectives of the PBB, by position status of respondent and by eligibility status of agency in FY 2016/17. Objectives of the
PBB
Leadership Position Status of Personnel
Rank-and-file Managers All staff Ineligible Eligible All
agencies
Ineligible Eligible All
agencies
Ineligible Eligible All
agencies
Reward good
performers
65.0 61.4 62.5 70.8 72.0 71.7 66.0 63.5 64.3
Motivate higher
performance and
productivity
65.9 67.1 66.7 70.8 72.6 72.1 66.8 68.2 67.8
Increase
accountability in the
public sector
18.0 15.2 16.1 18.5 28.6 25.8 18.0 17.9 18.0

Objectives of the
PBB
Leadership Position Status of Personnel
Rank-and-file Managers All staff Ineligible Eligible All
agencies
Ineligible Eligible All
agencies
Ineligible Eligible All
agencies
Ensure
accomplishment of
commitments and
targets
42.1 37.8 39.2 49.2 53.1 52.1 43.3 40.9 41.6
Strengthen teamwork
within the agency
24.5 21.3 22.3 24.6 36.6 33.3 24.5 24.3 24.4
Enhance public
service delivery to the
citizen
29.1 21.0 23.6 33.8 38.3 37.1 29.9 24.5 26.1
Do not know 2.5 1.3 1.7 1.5 0.0 0.4 2.3 1.0 1.4
Source: 2019 PSEPBB, PIDS.
Most (about three fifth) learn about the PBB through written office policies (e.g.
Memorandum). Aa bigger share of managers identify nearly all sources of information on PBB,
except for informal conversations with colleagues, which is identified by about a third of rank-
and-file staff, compared to a fifth for managers (Figure 5).
Figure 5. Proportion (in %) of respondents who identified their sources of information on PBB
Source: 2019 PSEPBB, PIDS.

Practically all (98%) PSEPBB respondents are aware of agency performance reviews; two
thirds of them report that this is undertaken every semester; a tenth say annually, another tenth
don’t know (Table 6).
Table 6. Frequency of agency performance review, by position status of respondent. Reported frequency of
conduct of agency
performance reviews
Eligibility Status of Agency Ineligible Eligible Total
None 0.5 0.1 0.2
Once 15.1 13.0 13.6
Twice (every 6 months) 57.1 67.1 64.0
Monthly 0.8 1.7 1.4
As the need arises 2.9 2.4 2.5
Do not know 12.2 8.7 9.8
Others 11.4 7.1 8.4
Total 100.0 100.0 100.0 Source: 2019 PSEPBB, PIDS.
Nearly all (97.8%) rank-and-file respondents report that they have individual performance
targets. More than two thirds (68.4%) of the rank-and-file respondents, whether from eligible
or ineligible agencies, suggest that the targets are determined by their immediate superiors,
meanwhile more than half (52.7%) of respondents suggest that they are responsible for these
targets and less than one percent (0.6%) cannot identify the responsible party (Figure 6a).
Further, three in four (74.4%) rank-and-file respondents report that the their immediate
superiors are responding for monitoring and evaluation (M&E) of their individual performance
targets, while a fifth (52.7%) of respondents suggest that they are responsible for M&E, while
a negligible proportion (0.3%) do not know (Figure 6b).
Figure 6. Persons/units identified by respondents as being responsible for (a) determining individual performance targets; and, (b) monitoring and evaluation of these targets
(a) (b)
Source: 2019 PSEPBB, PIDS.
As regards performance targets of delivery units, practically all (99.2%) managers reported
about this. Half (50.2%) of the responding managers suggested that they are responsible for
targets of their delivery units, while less than half (44.8%), and about a third (36.9%) identified
their immediate supervisors, and the human resources unit, respectively. A mere tenth (12.0%)
of managers identified the performance management team to be responsible for targets of their

delivery units, and nearly no manager was unable to report that they did not know who is
responsible for their delivery units’ targets. (Figure 7a). Two in five managers (40.2%)
suggested that they conduct M&E of their delivery units’ performance targets. Half (44.8%) of
the managers who responded in the survey also suggested that their immediate superiors
monitor and evaluate the performance targets of their delivery units; half of the responding
managers also identified the human resource unit for M&E of targets (Figure 7b).
Figure 7. Persons/units identified by managers as being responsible for (a) determining performance targets of delivery units; and, (b) monitoring and evaluation of these targets.
(a) (b)
Source: 2019 PSEPBB, PIDS.
While 90% agree of PSEPBB respondents reported that they deserve their PBB ratings, but the
agreement with ratings actually depended on the level of ratings they obtained. As their ratings
went from satisfactory to outstanding, the share of respondents in agreement had risen;
meanwhile, among those who received below satisfactory ratings, all reported that they deserve
better (Table 7).
Table 7. Proportion (in %) of respondents who report perceptions on their ratings, by performance ratings group Perception on
whether the rating
is deserved
Individual performance rating
Do not
know
Unsatisfactory Satisfactory Very
Satisfactory
Outstanding Total
Do not know 83.3 0.0 4.6 0.5 0.5 3.1
Yes 8.3 0.0 62.1 94.4 98.5 90.9
No, I deserve a
better rating 8.3 100.0 33.3 4.9 0.5 5.9
No, I deserve a
lower rating 0.0 0.0 0.0 0.1 0.5 0.2 Total 100.0 100.0 100.0 100.0 100.0 100.0
Source: 2019 PSEPBB, PIDS.
Perceptions of managers regarding whether the ratings of delivery unit ratings were deserved
likewise depended on their rankings of their delivery units. All managers from best performers
reported that they deserve their ratings, compared to 87.4% among better performers.

Meanwhile managers from good performers and below satisfactory units were divided on
whether they agree or deserve better (Table 8).
Table 8. Proportion (in %) of managers who report perceptions on ratings of their delivery units, by performance ratings group Perception on
whether the rating
of delivery unit is
deserved
Delivery unit performance rating
Do not
know
Unsatisfactory Satisfactory Very
Satisfactory
Outstanding Total
Do not know 80.0 0.0 3.3 0.0 0.0 9.2
Yes 16.0 50.0 44.3 87.4 100.0 71.3
No, I deserve a
better rating 4.0 50.0 50.8 11.7 0.0 18.8
No, I deserve a
lower rating 0.0 0.0 1.6 1.0 0.0 0.8 Total 100.0 100.0 100.0 100.0 100.0 100.0
Source: 2019 PSEPBB, PIDS.
As much as three-fifths (59.4%) of respondents report that the supervisor, to a great or very
great extent, provide help for poor and unsatisfactory performers, in both eligible or ineligible
agencies, but a tenth (8.8%) report no assistance by supervisors (Figure 8). The form of
interventions are largely capacity building activities, including coaching (67.4%), and
training (33.8%), with a fifth (18.8%) of respondents also reporting about readjustment of
individual performance targets (Figure 9).
Figure 8. Proportion (in %) of respondents who report extent of supervisor’s help for poor and unsatisfactory performers, by eligibility status of agency in FY 2016/17
Source: 2019 PSEPBB, PIDS.

Figure 9. Proportion (in %) of respondents who report specific interventions for poor and unsatisfactory performers, by eligibility status of agency in FY 2016/17
Source: 2019 PSEPBB, PIDS.
According to the PSEPBB respondents, a third (35.0%) of them did not avail of the PBB at
least once (Table 9). The proportions varied across cluster type, with only a fifth (20.0%) of
respondents from DepED being PBB-ineligible at least once, while among SUCs, the
corresponding proportion is more than half (53.8%).
Table 9. Proportion (in %) of respondents who were ineligible to receive PPB at least once, by cluster type Cluster Type Respondent was ineligible to receive PBB at least once
No Yes Do not know Total
NGAs 67.2 30.1 2.7 100.0
SUCs 45.2 53.8 1.0 100.0
DepED 79.1 20.0 0.9 100.0
GOCCs 66.4 29.5 4.1 100.0
Total 62.8 35.0 2.2 100.0
Source: 2019 PSEPBB, PIDS.
Among those who did not receive PBB at least once, the most common reason for ineligibility
reported by the respondent is that their respective agencies (as a whole) did not meet the
requirements to qualify for the PBB e.g., BUR, ISO 9001 Quality Management System (ISO-
QMS) certification, Freedom of Information (FOI), Commission on Audit (COA) reports
(Table 10). Meanwhile, it can also be noticed that about a quarter of survey participants from

SUCs also answered isolation of their delivery units as the reason for not availing the PBB.
That is, they did not meet the target set for their specific group to qualify for the PBB. This
was also mentioned by PBB focal persons in SUCs during the FGD conducted by the PIDS
study team. Usually, these targets pertain to enrollment rates, completion rates and board
passing rates.
Table 10. Reasons for not availing PBB according to respondents who experienced ineligibility in receiving PBB at least once, by cluster type of agency Cluster
Type
Reasons
I had been
working for
less than 3
months from
the
reference
fiscal year
Our agency did
not meet
requirements to
qualify for the
PBB
Our delivery
unit was
isolated for not
meeting
targets /
requirements to
qualify for
PBB
My individual
performance
rating did not
qualify for the
PBB
Others
NGAs 3.8 80.8 13.1 2.3 15.0
SUCs 7.1 79.9 23.7 1.8 10.7 8.7 56.5 8.7 0.0 39.1
GOCCs 0.0 66.7 2.8 2.8 41.7
Total 5.0 78.0 16.1 2.0 16.8 Source: 2019 PSEPBB, PIDS.
A bigger proportion of managers from ineligible agencies report about complaints than their
eligible counterparts (Figure 10).
Figure 10. Common complaints of employees from eligible and ineligible agencies regarding their PBB, according to managers.
Source: 2019 PSEPBB, PIDS.

More than half of complaints from ineligible agencies are about “Indicators not being able to
measure employee’s competence” or “Focus on quantity over quality of outputs”; a third
complain about “Favoritism; unfair and biased ratings” or “System being gamed” or the “Lack
of information dissemination and guidelines of the goals or targets”. A bigger share (21%)
managers from eligible agencies also reported “no complaints” about than those from ineligible
agencies (14%).
According to managers from DepED, SUCs and NGAs, the top two ranking complaints among
employees about the PBB are about “Indicators not being able to measure employee’s
competence” or “Focus on quantity over quality of outputs”, but the proportions of reports are
much higher among DepED at around three-fifths, compared to about half among SUCs and
two-fifths among NGAs (Table 11). Meanwhile, among managers from GOCCs, about a third
report that the common complaints on the PBB are on “Indicators do not measure employee’s
competence”; “Favoritism; unfair and biased rating”; and “System can be gamed and can be
unfair”.
Table 11. Common complaints of employees regarding their PBB, according to managers, by cluster of agency. Complaints about PBB Cluster type
NGAs SUCs DepED GOCCs
Total
Indicators do not measure employee’s
competence
43.2 47.3 62.5 34.6
44.2
Focus on quantity over quality of
outputs
42.4 52.7 62.5 26.9
44.6
Favoritism; unfair and biased ratings 31.8 24.3 12.5 30.8
28.8
No consultation 10.6 23.0 12.5 7.7
14.2
Lack of information dissemination and
guidelines of the goals or targets
13.6 36.5 12.5 15.4
20.8
System can be gamed and can be
unfair
28.8 24.3 25.0 30.8
27.5
No complaints 23.5 13.5 12.5 15.4
19.2
Others 22.0 21.6 37.5 30.8
23.3
Source: 2019 PSEPBB, PIDS.
4.1.3. PBB Implementation
About four-fifths (79%) (either strongly or somewhat) agree that the PBB measures actual
performance and productivity of individual, and a similar proportion (84%) are in agreement
that the PBB measures the actual performance and the productivity of the bureau/delivery unit.
Many find the PBB requirements fair (67%) and the basis of qualification objective (75%), but
most (85%) also suggest that the PBB needs further refinement. In nine out of ten statements
on the PBB implementation, respondents from GOCCs provided the lowest agreement rate.
The only exception is on the issue of the need for further refinement where the agreement rates
were constant across the cluster types. The share of respondents from GOCCs and from DepED
who agreed that the payouts are released on time is practically the same at about thirty percent
(Table 12).

Table 12. Proportion (in %) of respondents by extent of agreement on statements on the PBB Implementation, and by cluster type of agency.
Statement Cluster Type
Level of Agreement Strongly
Agree Somewhat
Agree Neither
agree nor disagree
Somewhat Disagree
Strongly Disagree
Total
The PBB measures the actual performance and the productivity of the individual.
NGAs 37.6 42.4 11.2 6.5 2.4 100.0
SUCs 37.6 43.3 10.2 7.0 1.9 100.0 48.7 33.9 9.6 5.2 2.6 100.0
GOCCs 22.1 45.9 14.8 13.9 3.3 100.0
Total 37.1 42.2 11.1 7.2 2.4 100.0
The PBB measures the actual performance and the productivity of the bureau/delivery unit.
NGAs 44.1 40.0 9.2 5.7 1.0 100.0
SUCs 43.0 42.4 7.3 6.1 1.3 100.0 44.4 38.3 12.2 3.5 1.7 100.0
GOCCs 27.9 49.2 13.9 7.4 1.6 100.0
Total 42.3 41.3 9.5 5.7 1.2 100.0
The PBB requirements are fair and applicable to all government institutions.
NGAs 30.6 36.1 19.7 10.1 3.5 100.0
SUCs 32.2 37.3 19.1 8.3 3.2 100.0 38.3 35.7 13.9 7.8 4.4 100.0
GOCCs 18.9 36.1 23.8 14.8 6.6 100.0
Total 30.6 36.4 19.4 9.9 3.8 100.0
The PBB payouts are released on time.
NGAs 11.7 27.0 23.9 22.9 14.6 100.0
SUCs 19.2 28.4 26.2 17.3 9.0 100.0 6.1 25.2 18.3 25.2 25.2 100.0
GOCCs 8.2 22.1 18.0 26.2 25.4 100.0
Total 12.7 26.7 23.4 22.0 15.2 100.0
The basis of qualification for the PBB is objective.
NGAs 30.4 43.8 15.5 7.7 2.7 100.0
SUCs 34.1 44.0 13.1 6.7 2.2 100.0 30.4 47.0 16.5 2.6 3.5 100.0
GOCCs 14.8 54.1 19.7 9.8 1.6 100.0
Total 29.8 45.1 15.4 7.2 2.6 100.0
The PBB needs further refinement.
NGAs 41.4 42.5 12.0 2.4 1.7 100.0
SUCs 48.7 36.0 10.5 2.9 1.9 100.0 45.2 42.6 8.7 2.6 0.9 100.0
GOCCs 50.0 36.1 9.0 1.6 3.3 100.0
Total 44.4 40.3 11.0 2.5 1.8 100.0
The PBB has improved our institution’s compliance with government regulations (e.g. good governance conditions,
NGAs 44.3 41.1 10.8 2.8 1.0 100.0
SUCs 51.0 37.6 6.7 4.1 0.6 100.0 41.7 44.4 8.7 3.5 1.7 100.0
GOCCs 32.8 45.9 14.8 4.9 1.6 100.0
Total 44.6 41.0 9.9 3.4 1.0 100.0

Statement Cluster Type
Level of Agreement Strongly
Agree Somewhat
Agree Neither
agree nor disagree
Somewhat Disagree
Strongly Disagree
Total
use of budget, and delivery of targets).
Changes in the requirements of the PBB are properly communicated and disseminated.
NGAs 30.5 39.8 20.8 6.9 2.0 100.0
SUCs 37.9 41.4 14.0 5.7 1.0 100.0 36.5 40.9 13.0 8.7 0.9 100.0
GOCCs 23.8 42.6 13.1 17.2 3.3 100.0
Total 32.2 40.6 17.7 7.8 1.8 100.0
The PBB incentivizes good performance.
NGAs 38.6 43.4 10.6 5.4 2.1 100.0
SUCs 38.2 42.0 12.4 4.8 2.6 100.0 43.5 43.5 7.0 3.5 2.6 100.0
GOCCs 30.3 37.7 19.7 9.8 2.5 100.0
Total 38.1 42.5 11.6 5.5 2.3 100.0
Complying with good governance conditions increased our efficiency in service delivery.
NGAs 53.3 37.8 6.8 1.6 0.6 100.0
SUCs 60.2 31.9 4.8 2.6 0.6 100.0 50.4 43.5 3.5 1.7 0.9 100.0
GOCCs 44.3 39.3 10.7 4.9 0.8 100.0
Total 53.9 37.0 6.4 2.2 0.6 100.0
Source: 2019 PSEPBB, PIDS.
About half of respondents coming from all clusters strongly agreed that complying with good
governance conditions (as part of PBB requirements) increased their agency’s efficiency in
terms of service delivery (Table 13). While at least 30% of respondents in NGAs, SUCs, and
strongly agree that PBB measures actual individual and delivery unit performance and that
PBB requirements are fair and applicable to all agencies, meanwhile a smaller proportion of
GOCC respondents agree with these statements. It was also very noticeable that less than 20%
of all clusters only “strongly agree” that PBB payouts are released on time. Managers and rank-and-file only have slight differences in viewing PBB implementation
processes (Table 14). Fewer managers, compared to rank and file employees strongly agree
that “the PBB measures the actual performance and the productivity of the bureau/delivery
unit” and that “the PBB requirements are fair and applicable to all government institutions.”
We also tried to break down the data into the subpopulation of respondents consisting of PBB
focal persons and performance management team (PMT) members of participating agencies in
the PBB, in combination with the respondents from validating agencies (who may be viewed
as being more knowledgeable about the PBB), versus the rest of the respondents. The former
group, which is expected to know more about the PBB, constitutes roughly a quarter of the
respondents in the survey. PBB focal persons attend orientations of PBB guidelines conducted
by the AO25 secretariat which they in turn disseminate in their respective agencies for
implementation. On the other hand, the PMT monitors compliance of requirements by serving
as quality control and ensuring the completeness of submissions to ensure the PBB eligibility
of their agencies. Surprisingly, no huge differences could be found in this subpopulation
regarding the strong agreement rates on statements about the PBB implementation (Table 14).

Table 13. Proportion of Respondents (in %) who Strongly Agree about Some Statements on the PBB Implementation, among Ineligible and Eligible Agencies and across Cluster Type of Agencies Statement on the PBB Implementation Ineligible Eligible
NGAs SUCs DepED GOCCs
Total
The PBB measures the actual performance and the productivity of
the individual.
32.0 39.4
37.6 37.6 48.7 22.1
37.1
The PBB measures the actual performance and the productivity of
the bureau/delivery unit.
38.1 44.1
44.1 43.0 44.3 27.9
42.3
The PBB requirements are fair and applicable to all government
institutions.
25.3 32.8
30.5 32.2 38.3 18.9
30.5
The PBB payouts are released on time. 15.7 11.3
11.6 19.1 6.1 8.2
12.6
The basis of qualification for the PBB is objective. 27.3 30.8
30.2 34.1 30.4 14.8
29.7
The PBB needs further refinement. 47.4 43.1
41.4 48.7 45.2 50.0
44.4
The PBB has improved our institution’s compliance with
government regulations (e.g. good governance conditions, use of
budget, and delivery of targets).
39.2 47.0
44.2 51.0 41.7 32.8
44.6
Changes in the requirements of the PBB are properly communicated
and disseminated.
27.3 34.3
30.4 37.9 36.5 23.8
32.2
The PBB incentivizes good performance. 34.3 39.8
38.6 38.2 43.5 30.3
38.1
Complying with good governance conditions increased our
efficiency in service delivery.
48.2 56.4
53.2 60.2 50.4 44.3
53.9
Source: 2019 PSEPBB, PIDS.
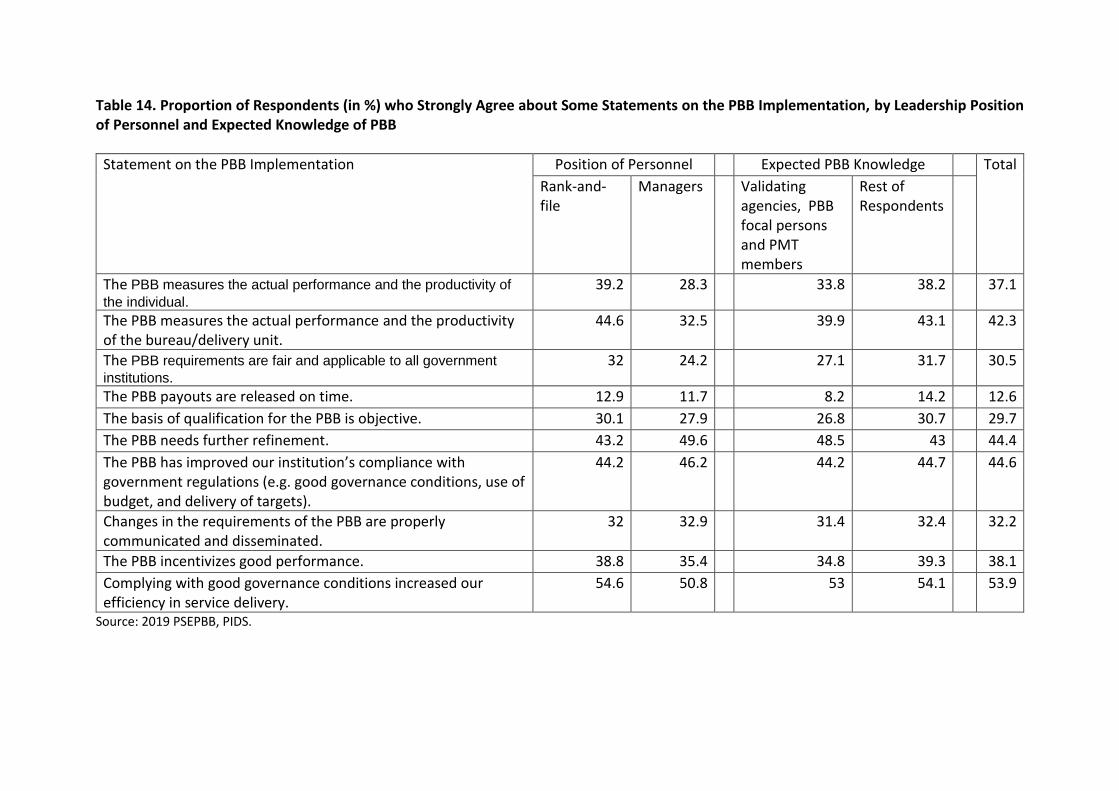
Table 14. Proportion of Respondents (in %) who Strongly Agree about Some Statements on the PBB Implementation, by Leadership Position of Personnel and Expected Knowledge of PBB
Statement on the PBB Implementation Position of Personnel Expected PBB Knowledge Total
Rank-and-file
Managers
Validating agencies, PBB focal persons and PMT members
Rest of Respondents
The PBB measures the actual performance and the productivity of
the individual. 39.2 28.3
33.8 38.2
37.1
The PBB measures the actual performance and the productivity of the bureau/delivery unit.
44.6 32.5
39.9 43.1
42.3
The PBB requirements are fair and applicable to all government
institutions. 32 24.2
27.1 31.7
30.5
The PBB payouts are released on time. 12.9 11.7
8.2 14.2
12.6
The basis of qualification for the PBB is objective. 30.1 27.9
26.8 30.7
29.7
The PBB needs further refinement. 43.2 49.6
48.5 43
44.4
The PBB has improved our institution’s compliance with government regulations (e.g. good governance conditions, use of budget, and delivery of targets).
44.2 46.2
44.2 44.7
44.6
Changes in the requirements of the PBB are properly communicated and disseminated.
32 32.9
31.4 32.4
32.2
The PBB incentivizes good performance. 38.8 35.4
34.8 39.3
38.1
Complying with good governance conditions increased our efficiency in service delivery.
54.6 50.8
53 54.1
53.9
Source: 2019 PSEPBB, PIDS.

More than half (54%) of respondents reported that they are aware of any changes in the
requirements of the PBB since its implementation in 2012. When probed further, less than 10
percent of rank-and-file respondents had actually identified these changes. compared to much
larger proportions among managers (Figure 11). About a fourth of managers identified
changes in PBB requirements, such as ISO-QMS, Streamlining and Process Improvements,
Citizen/Client Satisfaction, while a fifth identified FOI, and Early Procurement.
Figure 11. Changes in PBB Requirements Identified by Rank-and-File and Managers
Source: 2019 PSEPBB, PIDS.
A considerable share ( about 90 %) of respondents across various sub-groups (i.e., rank-and-
file versus managers, those from eligible agencies versus ineligible ones, and across cluster
types) expressed the view that their agencies will continue to comply with the PBB
requirements in the long run even without an incentive (Table 15). The proportions, however,
of those who are positive about sustained compliance of the PBB requirements, even without
incentives, seem highest though among respondents from SUCs (at 94.9%) compared to those
from NGAs who had the least share (86.2%).
Table 15. Proportion of Respondents (in %) who think their agencies will continue to comply with PBB requirements in the long run even without an incentive, among rank-and-file employees, managers, those from Ineligible And Eligible Agencies and across Cluster Type of Agencies Group Continued compliance of agency even without incentive
No Yes Not Sure Total
Rank-and-file 4.6 89.6 5.8 100.0
Managers 7.1 87.1 5.8 100.0
Ineligible 3.1 91.2 5.7 100.0
Eligible 6.0 88.2 5.9 100.0

Group Continued compliance of agency even without incentive
No Yes Not Sure Total
NGAs 5.1 86.2 8.8 100.0
SUCs 3.2 94.9 1.9 100.0 6.1 93.0 0.9 100.0
GOCCs 9.1 87.6 3.3 100.0
Total 5.1 89.1 5.8 100.0 Source: 2019 PSEPBB, PIDS.
4.1.4. PBB Effects on Individual Performance The PSEPBB respondents were also asked to identify their level of agreement on twelve
statements on the effect of the PBB on their individual performances. Figure 12 shows that
about 60 percent of respondents, whether from eligible or ineligible agencies, strongly agree
that they have become more conscious of accountability requirements. Further, compared to
around 40 percent of respondents from ineligible agencies, about half of those from eligible
agencies strongly agree that
• they are more conscious of their work;
• their individual performance targets are fair, objective, and measured with up-to-date
data; and,
• they have been able to submit quality outputs and deliverables within deadlines.
Also, nearly 40 percent of respondents from eligible agencies, compared to about 30 percent
from ineligible ones, strongly agree that
• their performance rating has improved over the years;
• their supervisors have become stricter in checking their outputs;
• they are more motivated to go to work; and,
• they can accomplish more tasks now.
Meanwhile only 10% strongly agree that they will not be performing as well as they have now
without any sort of reward system.
Figure 12. Proportion of respondents (in %), by eligibility of agency, who strongly agree with various statements on the effect of the PBB on their individual performances.
(a) (b)
Source: 2019 PSEPBB, PIDS.
To perform a counterfactual analysis between respondents from eligible agencies and their
counterparts from ineligible agencies , we looked into a composite indicator of the individual

effects on the PBB, specifically the proportion of respondents who strongly agreed with at least
one of those 12 statements in the two previous slides. We noted that 6.2 percentage point
difference in favor of those from eligible agencies, but when we made use of a PSM model that
controlled for age, educational attainment and employee status (i.e. managers versus rank-and-
file) we estimated this difference to be even larger, i.e. nearly 10 percentage points (Table 16).
Both estimates from a standard survey data analysis and the PSM model suggest that the
difference is statistically significant.
Table 16. Results of Counterfactual Analysis on Effects of PBB on Individual Performance
Group Strongly Agree in at least one of 12 statements in Section D on Effect of
PBB on Individual Performance No Yes Total
Ineligible 29.9 70.1 100.0
Eligible 23.7 76.4 100.0
Total 25.6 74.4 100.0
Difference between Eligible and Ineligible Groups
6.2
Estimated Standard Error 2.7
Estimated Difference from Propensity Score Matching
9.9
Estimated Standard Error 4.6
Note: Authors’ calculations on microdata of 2019 PSEPBB, PIDS.
Table 17 lists a disaggregation of the proportion of PSEPBB respondents who strongly agree
about various statements on individual performance across various relevant subpopulations
other than eligibility of the agency in FY 2016/17. These subgroupings are (i) cluster type of
agency, (ii) managers versus rank-and-file, and (iii) subpopulation of respondents according to
expected knowledge on the PBB with the first group consisting of PBB focal persons and
performance management team (PMT) members of participating agencies in the PBB, in
combination with the respondents from validating agencies (who may be viewed as being more
knowledgeable about the PBB), and the second group being the rest of the respondents. Results
suggest that participants from DepED, tend to strongly agree more about the statements than
the average survey participants in nearly all statements. The exception is in the statement “I
have become more conscious of accountability requirements”, where the proportions are no
different. Rank-and-file personnel also tend to strongly agree more than managers in most
statements, although across statements the difference in rates is not substantial. For nearly all
statements, the proportion of respondents from the more PBB-knowledgeable group of
respondents is no different from the rest of the respondents. The exception is the statement “My
individual performance targets are fair, objective, and measured with up-to-date data” where
the more PBB-knowledgeable group has a smaller strong rate of agreement compared with the
rest of the respondents.

Table 17. Proportion of Respondents (in %) who Strongly Agree about Some Statements on the Effects of PBB on Individual Performance, by Cluster Type of Agencies, Leadership Position of Personnel, and Expected Knowledge of PBB Statements on Effects of
PBB on Individual
Performance
Cluster type of Agency
Position of Personnel
Expected PBB Knowledge
Total
NGAs SUCs DepED GOCCs
Rank-
and-file
Managers
Validating
agencies, PBB
focal persons and
PMT members
Rest of
Respondents
I have been able to submit
quality outputs and
deliverables within the
deadline
42.1 47.5 57.4 41.0
49.2 25.8
41.2 46.0
44.7
I am more motivated to go
to work
36.3 41.7 54.8 25.4
41.5 24.6
33.8 39.8
38.3
Inaccurate, delayed and
redundant reports have
been minimized
31.2 34.4 38.3 23
34 22.9
29.3 32.8
31.9
My performance rating has
improved over the years
37.3 45.5 53.9 36.9
42.4 34.2
36.9 42.2
40.8
I am more conscious of
my work
43.1 54.5 55.7 36.9
49.1 35.4
42.1 48.0
46.5
I can accomplish more
tasks now
35.6 42.4 51.3 26.2
40.3 27.1
35.4 38.7
37.8
My supervisor has become
stricter in checking my
outputs
36.6 41.1 47.0 32.0
37.0 43.3
39.3 37.8
38.2
My individual
performance targets are
fair, objective, and
measured with up-to-date
data
40.3 49.7 60.0 42.6
47.3 33.3
37.5 47.2
44.6
I have become more
conscious of
55.9 72.0 60.9 52.5
60.0 60.4
58.2 60.7
60.0
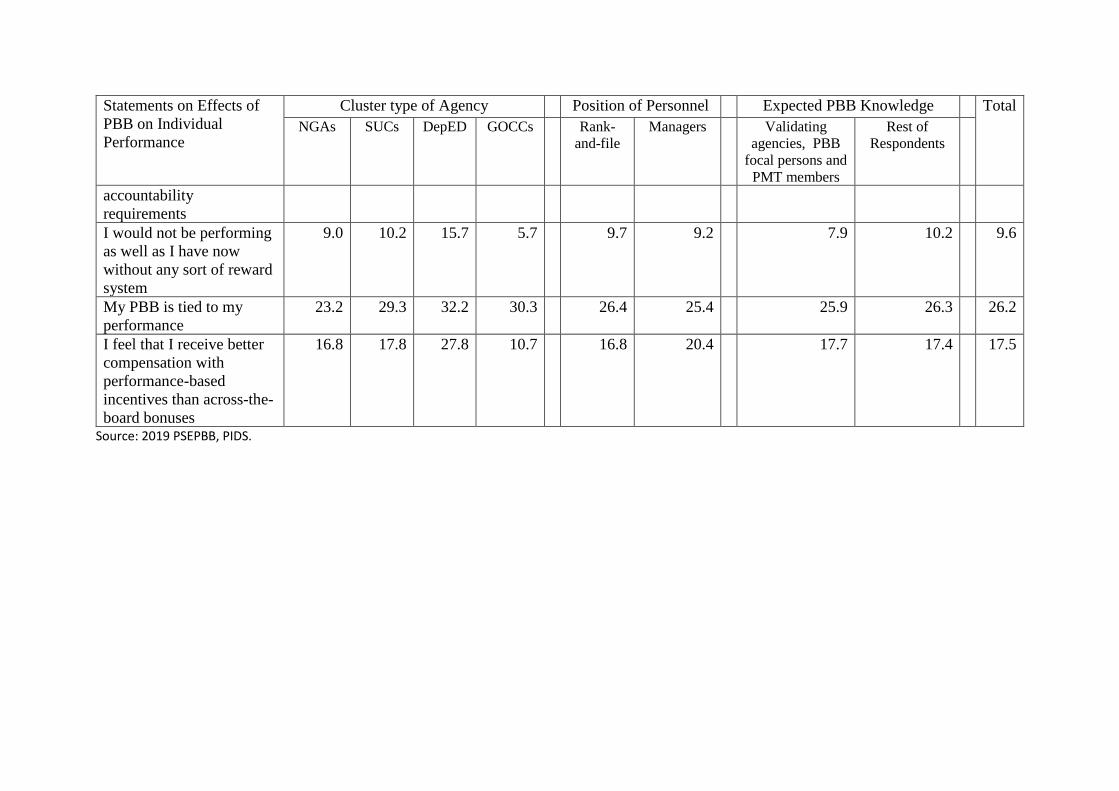
Statements on Effects of
PBB on Individual
Performance
Cluster type of Agency
Position of Personnel
Expected PBB Knowledge
Total
NGAs SUCs DepED GOCCs
Rank-
and-file
Managers
Validating
agencies, PBB
focal persons and
PMT members
Rest of
Respondents
accountability
requirements
I would not be performing
as well as I have now
without any sort of reward
system
9.0 10.2 15.7 5.7
9.7 9.2
7.9 10.2
9.6
My PBB is tied to my
performance
23.2 29.3 32.2 30.3
26.4 25.4
25.9 26.3
26.2
I feel that I receive better
compensation with
performance-based
incentives than across-the-
board bonuses
16.8 17.8 27.8 10.7
16.8 20.4
17.7 17.4
17.5
Source: 2019 PSEPBB, PIDS.

Page 43
4.1.5. PBB Effects on Agency Performance Through Section E of the questionnaire (Annex 1 and Annex 2), the PSEPBB respondents
were asked to specify their perceptions on to what extent they agreed with ten statements that
describe the effect of PBB on the performance and productivity of their agency or department.
Survey respondents from agencies that were eligible to avail of the PBB in FY 2016/17 tended
to register “strongly agree” much more often than counterparts from ineligible agencies. About
half of sampled respondents from eligible agencies, compared to about 40 percent from
ineligible agencies (Figure 13), strongly agree that
• their respective agencies have since become more focused on results that matter to their
clients;
• the goals of their organization have become clearer and more aligned;
• management is more focused on working with staff to serve the public's interests;
• there have been positive changes in their department/agency;, and
• systems and operations have become more efficient, more effective and better
documented.
Meanwhile, the least strong agreement rate among PSEPBB respondents regarding effects of
the PBB on their agency performance was on the statement that poor performers have been
identified since the government implemented the PBB.
Figure 13. Proportion of respondents (in %), by eligibility of agency, who strongly agree with various statements on the effect of the PBB on their agency performances.
(a) (b)
Source: 2019 PSEPBB, PIDS.
As in the earlier examination of the perceived effects of the PBB on individual performance,
we looked into the proportion of respondents who strongly agreed with at least one of those 10
statements in Section E of the 2019 PSEPBB questionnaire (see Annex 1 and Annex 2). We
noted a regular survey data analysis reveals a 9.0 percentage point difference in favor of those
from eligible agencies. This estimated difference is noted to be statistically significant. When
we made use of the propensity score matching model, however, we estimated this difference
between the respondents from eligible and ineligible agencies to be also statistically significant,
but that the difference between the two groups was by as much as 13 percentage points (Table
18). Thus, we find that survey data reveals that that the perception of respondents is that the
PBB has had effects across both individual and agency-wide performance.

Page 44
Table 18. Results of Counterfactual Analysis on Effects of PBB on Agency-Wide Performance
Group Strongly Agree in at least one of 10 statements in Section E on Effect of
PBB on Agency Performance
No Yes Total
Ineligible 37.6 62.4 100.0
Eligible 28.6 71.4 100.0
Total 31.4 68.6 100.0
Difference between Eligible and Ineligible Groups
9.0
Estimated Standard Error 2.8
Estimated Difference from Propensity Score Matching
13.6
Estimated Standard Error 4.7
Note: Authors’ calculations on microdata of 2019 PSEPBB, PIDS.
Table 19 lists a disaggregation of the proportion of PSEPBB respondents who strongly agree
about various statements on the effect of PBB on agency performance across several relevant
subpopulations. As is expected, there is variance across cluster types of agencies. In particular,
respondents from DepED tend to strongly agree more than counterparts from other clusters,
except for statements on “the goals of my agency have become clearer and more aligned” and
on “the agency has since become more focused on the results that matter to the clients”. In this
case, a slightly higher rate of strong agreement can be obtained from CHED respondents, but
the difference is only small. By leadership position in the agency and by expected knowledge
on the PBB, there is negligible difference in the rates of respondents that strongly agree on
various statements on the effects of PBB on agency performance. While this is somewhat
unexpected, the survey results show that perceptions on the effects of PBB on agency
performance are only conditioned by the context of the cluster of agencies to which the
respondents belong.
Table 19. Proportion of Respondents (in %) who Strongly Agree about Some Statements on the Effects of PBB on Agency Performance, by Cluster Type of Agencies, Leadership Position of Personnel, and Expected Knowledge of PBB Statements on Effect of PBB on Agency Performance Cluster type of Agency
NGAs SUCs
Service delivery in our agency has improved. 40.5 47.8
Teamwork has improved. 38.4 47.1
Trust has been fostered within the agency. 33.8 39.8
The goals of my agency have become clearer and more aligned. 45.1 56.1
The agency has since become more focused on the results that matter to the clients. 46.9 55.1
Management is more focused on working with the staff to serve the public's interests. 45.3 53.5
Systems and operations have become more efficient, more effective, and better
documented.
41.9 47.5
There have been positive changes in our department/agency. 41.5 50.3

Page 45
High performers have been recognized. 39.5 48.4
Poor performers have been identified. 26.3 37.6
Source: 2019 PSEPBB, PIDS.
4.2. Focus Group Discussions
In addition to the survey of government employees undertaken for this study, a total of seven
focus group discussions (FGD) were conducted last middle of September 2020. This enabled
the study team to get the standpoint and perspectives of the PBB Focal Persons and members
of the Performance Management Team (PMT), as well as those of the AO25 IATF, AO25
Secretariat, and the validating agencies. A full transcription of interviews was made, with the
FGD transcriptions subjected to qualitative data analysis using the Nvivo software. Using
content analysis, the presence, meanings and relationships of certain words, themes, or
concepts mentioned during the FGDs were quantified and analyzed. Contrasts were made
between the representatives of selected agencies and those who represented the AO25 IATF
(including the Secretariat and the validating agencies in the IATF TWGs. Statistical analysis
of the main ideas and major themes was performed, and illustrated by way of frequency tables
and visualizations, including word clouds.
4.2.1. Profile of FGD Respondents A total of 41 employees and officials in the Executive Department from 21 government entities
participated in the FGD (Table 20).
Table 20. Distribution of FGD Participants by Cluster Type Cluster Type Number of Agencies Number of
Participants Eligible Ineligible
NGAs 1 2 6
GOCCs 2 1 10
SUCs 1 1 3
1 2 4
AO25 IATF 4 0 7
AO25 Secretariat 1 0 2
Validating Agencies 5 0 9
Total 15 6 41 Source: 2020 FGDs on PBB, PIDS.
More than half (56 %) of the FDG participants are PBB focal persons and members of the PMT
of the agencies. About 71 percent of these representatives of agencies interviewed were from
PBB-eligible ones in FY 2016/17.
Two thirds (63.4%) of the FGD participants are female ; more than half (56%) of those
interviewed are in the age range 35 to 50 years old. Most of the FGD participants also have
managerial-level positions (63.4%).
4.2.1. Understanding the PBB
The transcriptions of the interviews were analyzed with the Nvivo software to generate a word
cloud representing the “top of mind” words when FGD participants hear the term PBB (Figure

Page 46
14). In particular, we see that PBB is most associated with the employees’ performance,
achievement of targets, and receiving of incentives. FGD participants recognize that the PBB
is much more than just a financial incentive because the PBB has conditions for availing it.
Even when word clouds are generated from interviews with representatives across agencies
from the education sector (Figure 15), outside the education sector (Figure 16), and the
oversight and validating agencies (Figure 17), the same top-of-mind words about performance
and targets are generally most frequently observed.
Figure 14. Common “Top of mind” words associated with PBB among FGD participants
Source: 2020 FGDs on the PBB, PIDS.

Page 47
Figure 15. Recurring words about the PBB for participants from the education sector
Source: 2020 FGDs on the PBB, PIDS.
Figure 16. Recurring words about the PBB for participants outside the education sector
Source: 2020 FGDs on the PBB, PIDS.

Page 48
Figure 17. Recurring words about the PBB for participants from the oversight and validating agencies
Source: 2020 FGDs on the PBB, PIDS.
Aside from the usual concepts found in other word clouds, some other words associated with
the PBB from representatives of the education sector (Figure 15) pertain to their physical
accomplishments such as research and extension, accreditation, and ratings. Other words are
about the delivery units within their institutions like central office, region, division, and
schools.
On the other hand, outside of the education sector (Figure 16), words thought of with regard
to the PBB are in relation to processes (coordination, procurement, budgets, review, monitor),
units (board, committee, organization, department, individuals), personnel within the
government (GCG, managers, employees) as well as the mandate and functions of an agency.
Interviews with representatives of the AO25 IATF (Figure 17) mostly shows the functions,
processes, and requirements for the PBB including accomplishments, criteria, guidelines,
conditions, ratings, ranking, assessment, evaluation, validation, targets, procurement,
streamlining processes, delivery of service, and ISO.
4.2.2. Agreements about the PBB
Responses to each of the questions raised during FGDs were coded automatically with Nvivo,
aside from performing extra coding to associate some themes with related themes. The main

Page 49
ideas that occur in the responses given were noted and reviewed several times to be able
identify major themes from the data collected.
In general, the representatives of the agencies and the regulating bodies agree that the PBB
remains relevant at present because it can still be used to trigger continued improvements in
government services. According to the FGD participants, the PBB has recognized and
incentivized high performers within an agency and serves as a motivation to the employees to
work better. Respondents from both groups also agree that the PBB has increased the agencies’
compliance to statutory requirements. The PBB has supported the implementation of existing
laws and has become the mechanism for public sector agencies to be mindful of all reporting
requirements to improve their services. For instance, employees are more conscious about
submitting their Statement of Assets, Liabilities and Net Worth (SALNs) on time, otherwise
they could get disqualified on receiving their PBB. Participants also believed that the PBB has
improved their performance management systems in terms of monitoring and evaluation of
performance targets with indicators. The PBB has provided objectively verifiable indicators of
performance and productivity that could be used by the heads of the agencies in improving
their institutions. The representatives of agencies also added that there is a clearer delineation
of responsibilities now because of the PBB.
Nevertheless, both also agreed that there are certain areas for improvement especially in terms
of the design and implementation processes of the PBB. The release of the guidelines on the
PBB can be done earlier to provide agencies time to disseminate information to each of their
employees and comply with the newly-added requirements for that particular year. The late
release of guidelines gave agencies little time to prepare the requirements and did not allow
them to focus more on certain areas relevant to the PBB. For example, the criteria on the client
satisfaction survey was only implemented for a few months, and these surveys are clearly not
standardized across agencies. This would not capture the transactions done by the agencies in
the recent months because of the delayed release of the PBB guidelines.
The respondents agree that the voluminous requirements in the recent years of implementing
the PBB are report-intensive and has become a burden to the agencies and their employees.
Simplifying and streamlining the current set of PBB conditions would help agencies in
accomplishing their tasks and requirements.
4.2.2. Standpoint of the Agencies and the AO25 IATF, Secretariat, and Validating Institutions
While there is a lot of commonality in discussions, FGD results also show some variance in
the ways to view the processes behind the PBB, and ways forward.
a) Incentives
As regards the PBB incentives, the representatives of agencies argue that the current
payout formula that ties the incentive to a percentage of the employee’s base pay means
lower incentives for employees with lower salary grades. This is viewed as being unfair
considering that those with lower salary grades often do the “dirty work.” One
respondent noted that at the initial roll out of the PBB, since the same amount of
incentives were given, this boosted the morale of lower salary grade employees because

Page 50
they feel appreciated. Few also preferred the across-the-board incentive to than the
PBB. One respondent also suggested that a non-monetary incentive like a plaque of
recognition can push the agencies and employees to also perform better. For the
oversight agencies, however, the use of a percentage of the pay of employees was a
suggestion from the World Bank (2014) study that pointed out that the managerial
positions have relatively lower salaries than their counterparts in the private sector.
This study also recommended that when benchmarked to international experience, the
PBB should be increased to at least one month’s total pay (basic pay plus standard
allowances) on average for higher performance categories. The validating agencies
understand that employees have different functions. For instance, if a driver gets a best
performer ranking, you can’t compare his work to a Division Chief which holds all
these responsibilities and accountabilities. According to the regulatory bodies, the main
responsibility for performance of the delivery unit rests largely on managers. This is
confirmed by the 2019 PSEPBB data that suggests most survey respondents from the
rank-and-file identify their managers, particularly their immediate supervisors, as the
ones responsible for setting and monitoring their individual performance targets
(Figure 6). Survey respondents who have managerial responsibilities also confirm this
accountability on performance delivery.
b) Agency Eligibility
With regard to eligibility for availing the PBB, representatives of several agencies
pointed out that becoming PBB-eligible depends on the performances of all delivery
units. This is especially difficult for big agencies to comply with, when some units are
either delayed in submitting requirements or do not perform at all. Strong units in an
agency can be penalized because of the weakest links in an organization. However, the
regulating agencies clarified that in the beginning, the design of the PBB pertained to
seeing agencies as part of a family. The department secretary would qualify along with
its attached agencies, bureaus, and GOCCs so that all agencies in a Department must
perform toward attaining the goals and targets of the Department/sector. The validating
institutions added that prior to the PBB, attached agencies did not care about the
directions of the Department, especially the GOCCs which were operating
autonomously before (and giving incentives independent of other agencies). Hence,
PBB became a lever for building agency-wide cohesion towards goals attached to the
PBB. However, there were difficulties in this system especially when the head of the
agency was not able to (or would not give) attention to pushing compliance with the
requirements of the PBB, as this would mean that all sub-units would not qualify. The
oversight agencies decided then to separate the attached agencies from the mother
Departments starting 2015. Thus, agencies are now considered as a delivery unit instead
of part of an entire family. But with this setup, the Office of the Secretary of a
Department cannot be separated from the regional offices because the latter are organic
to the department. The regional offices cannot operate by themselves and say that they
could achieve their targets, not minding whether the Department would reach its overall
target as this is not the kind of culture the government wants to instill. Employees need
to be conscious that their work contributes to the overall goal of the agency/department.

Page 51
The oversight agencies acknowledge that it may be a challenge for big agencies to
comply with all the PBB requirements, but they mentioned that they have a lot of
officials anyway to spread the accountability of deliverables. Being part of a big agency
means more employees. Further, some remedial measures have regularly been
undertaken, including treating deadlines as soft deadlines for big agencies.
c) Agency disqualification on a minor requirement
Still on availing the PBB, the representatives of the agencies also lamented that their
performances are not appreciated simply because of a lapse in one of the good
governance conditions (GGCs) that automatically disqualify them from availing the
PBB incentive. Some interviewees find this unfair because their disqualification signify
that their performances for the whole year do not matter. They also argued that most of
their work and outputs are not being captured by the PBB. The regulating body replied
that while the GGCs are not connected to an agency’s physical accomplishments, these
are basic requirements in ensuring operational internal protocols. The requirements on
the GGCs are qualifiers, meaning if the agencies are not observing these minimum
requirements set by the oversight agencies, they are not eligible for the evaluation.
Several considerations were also made by the oversight agencies as long as the
justifications of the agencies for not meeting the requirement is beyond the control of
the agency.
d) Isolation of non-teaching personnel in DepED in receiving the PBB
While all public school teachers never fail to receive their PBB incentives, there are
non-teaching personnel from the division, regional, and central offices of DepED who
have not received their PBB incentives for two years, According to some FGD
participants, these non-teaching personnel prepare the reports of the schools and are
therefore just as deserving to receive the incentives as the teachers. According to one
interviewee, the DepED was disqualified from the PBB because of deficiencies in the
financial and audit findings, but the Central Office submitted a reconsideration letter
for the teachers. The evaluation of the validating agencies considered the teachers but
rejected the appeals of the non-teaching personnel. The respondent noted that perhaps
the reason behind this is because the teachers have a lot louder voice than them since
they are the biggest part of the bureaucracy. According to the validating agencies,
however, the DepED was given some accommodation to prepare their own internal
guidelines for the PBB because the Department has the biggest share of the
bureaucracy. The DepED adjusted their system of ratings and rankings and have set
criteria on how schools should be ranked since they have small, medium, and large
schools and the performance of the schools are different across size. In addition, the
DepED had a deficiency on the GGC requirement, which is a responsibility of the
offices and not of the teachers. The DepED made an appeal to provide PBB to the
teachers and the IATF agreed because it was a reasonable explanation. The oversight
institutions pointed out that some leeway was given to the division and regional offices
to also comply with the GGC requirements.
e) “Kilometric” requirements and stricter validation

Page 52
Representatives of agencies also pointed out that the “kilometric” requirements of the
PBB can be challenging to comply with. This is in addition to the facts that the release
of the PBB guidelines is close to the implementation period and that every year, there
are changes in the rules and guidelines of the PBB. Oftentimes, due to lack of human
resources in agencies, complying with the PBB requirements is an add-on task for
employees. Agencies did not put up a separate unit for the purpose of the PBB and
made use of its existing organizational structures to ensure compliance with the scheme.
Instead of easing or streamlining their work, the PBB has actually added more burdens
on processes. Some FDG participants mentioned that they sometimes have to leave
their regular tasks to attend to the reportorial requirements of the PBB. Moreover, one
FGD participant pointed out that the requirements were far easier to comply with in the
initial rollout of the PBB. Reportedly, starting in 2017, there is no more re-negotiation
of the targets. This was confirmed by the FGD participants representing the AO25 IATF
because they introduced the one-time validation for the agencies then. In the beginning
of the PBB, the validating agencies had been lenient on qualifying agencies. If an
agency has a deficiency, the agency only has to explain and commit on fulfilling the
deficiency, and they would consider approving compliance. But since the PBB has been
implemented for several years already, the rules have been tightened starting 2017. The
purpose of the one-time validation is for the agencies to avoid submitting “sample”
documents. The oversight institutions assert that the agencies do not actually
institutionalize their systems as they are rectifying issues several times. This resulted in
having more agencies disqualified and ineligible for incentives starting 2017. The
validating agencies have also observed that those agencies who failed to comply on the
GGC in the beginning were the same agencies who learned and have become prepared
now in every cycle. On the other hand, those agencies who were just lucky to pass the
evaluation before are the ones having a hard time now. The validating agencies further
explained that they also provide general orientation activities to help agencies
understand the PBB requirements, but the information provided in these orientation
activities is sometimes not disseminated to everyone.
f) Procurement and budget utilization requirements
Both the agencies and oversight institutions agree that the procurement requirements
are the most common reason for disqualification of agencies. Several agencies pointed
out that they do not have a separate office for procurement processes, which may be
difficult for agencies with quick response functions. Agencies also reported that
complying with 100% budget utilization rates (BURs) is tough to achieve because bids
are often lower than the contract price. Other issues regarding the BURs include delays
in the bidding process (which are beyond their control) as well as the inaccessibility of
the PhilGEPS website due to high volume of traffic from BAC users. The participants
from oversight and validating agencies replied that these issues stem from an internal
problem of the agency such as in cascading of information or change of leadership in
the Bids and Awards Committee (BAC) of an agency. They further reiterated that these
are existing rules of oversight agencies. They also added that the savings generated
from the bidding process is an accepted justification, along with other justifications that
are beyond the control of the agencies. While the validating institutions have allowed
agencies to submit their reports at their respective DBM regional offices or directly to
PhilGEPS due to website issues, they still think that submission to the PhilGEPS

Page 53
website would be manageable if agencies effectively planned on complying with this
requirement throughout the year knowing the shortcomings of the system’s website.
And with respect to the procurement process, agencies were also saying that this is a
long process. The representatives of oversight and validating agencies think that many
offices do not do an early procurement where agencies can carry out procurement once
the National Expenditure Program (NEP) is submitted to Congress, but short of award.
Aside from the fact that sometimes agencies allot budgets for procurement without first
having a Terms of Reference (TOR). That is, agencies only prepare the TORs when the
GAA is approved. This would really take a long time, even almost at the end of the year
plus the delays when the BAC proclaims a failed bidding. The validating agencies
therefore instituted additional guidelines to maximize the available funds of agencies.
The oversight and validating institutions argued that they are actually considerate in the
assessment of the agencies who provide justifications on their non-compliance to the
BUR requirement. Nonetheless, they still look at the overall picture. There are agencies
who declare that they have over 90 percent or sometimes more than 100 percent
physical accomplishments but actually low BURs. That means these agencies requested
more than their needed budgets. The validating agencies think that there are two
reasons: either the agencies overbudgeted or the agencies purposely lowered their
targets. From the evaluation of documents, the oversight and validating agencies
observed that some agencies tend to ask for a huge budget but are not really utilizing it.
This does not match their physical accomplishments. The agency itself is being
penalized so they sometimes initiate to adjust its budget.
4.3. Administrative Data
Despite the many issues and challenges on the PBB’s design and implementation identified in
the PSEPBB and in the FGDs that were also mentioned in Albert et al., (2019), the PBB has
been generally effective in meeting its design objectives over the years. The PBB has provided
a mechanism for government agencies to track their performance in achieving their agency-
wide commitments, as well as performance targets of their personnel and teams within their
agencies. From 96 percent in 2012, the PBB participation rates from 2014-2017 have been
close to 100 percent (Figure 18), so that only a very small group of government agencies are
at risk of being “left behind”.

Page 54
Figure 18. Government Participation Rate on the PBB (FY 2012-2017)
Note: Starting FY 2015, attached agencies are assessed as unique entities, i.e. performance delivery units. Source: AO 25 Secretariat (2019).
PBB participation in this period include almost all national agencies with the exclusion of the
Commission of Elections and the Congress (Senate and House of Representatives). Note that
starting 2015, the number of agencies increased considerably since attached agencies of
Departments have been reclassified as separate performance delivery units (to their mother
Departments). This provided more agencies with greater agility to comply with the conditions
and access the PBB.
In general, government agencies have had high compliance rates on basic statutory legal
requirements and GGCs. While we see increases in compliance with many requirements from
FY 2012 to FY 2016, nevertheless, with the stricter validation process adopted in FY 2017, we
observe a decrease in the percentage of agencies who have met and complied with the
requirements (Figure 19). Nonetheless, the historical data on compliance rates have been at a
high rate of around 80 percent or more for most criteria. One particular requirement which has
a relatively low compliance in 2017 is the ISO-QMS Certification (55%). During the process
evaluation (Albert et al. 2019), it was noted that the requirement for ISO-QMS certification
was a contributing factor behind the ineligibility of some agencies and SUCs from the PBB
grant starting 2015. Amidst rising ineligibility rates in the period 2015 to 2017, we still find
the share of agencies among the ineligibles that were not ISO-compliant increasing from
around 20 percent in 2015 to about 80 percent in 2016 and 2017.

Page 55
Figure 19. Agency Compliance to Good Governance Conditions (FY 2011-2017)
Source: AO 25 Secretariat (2019).
5. Summary, Policy Implications, and Ways Forward
The empirical findings in this study suggested that the PBB has contributed to improving public
sector performance at the individual, team and agency/department level. However, survey
respondents and FGD participants alike identify design and implementation issues in the PBB,
including (a) the changes in requirements across the years and the varying periods when PBB
guidelines are released to agencies that have made compliance challenging, and (b) the
relatively low level of awareness of the institutional objectives of the incentive scheme (as well
as of the linkage of the PBB with the RBPMS). Further, agency representatives in the FGDs
expressed psychic pains about the shift in pay from a fixed amount to a percentage of the base
pay of the employee, which they point out is not fair to those at the lower ranks. At the very
least, this suggests a need for improving how the PBB processes are communicated to the
agencies. Finally, although few identified organizational objectives of the PBB, many suggest
that are aware of performance targeting, M&E of targets, and also suggest that managers take
the lead in interventions in the agency to help those in need of improvements, but a tenth of
survey respondents also report that supervisors do not provide assistance to poor performers.
This is of concern as this suggests either capacity gaps issues among managers regarding
performance delivery, or the lack of attention to helping those who have been identified as
being poor performers in an agency.
This study revealed evidence of positive outcomes from the PBB reform. These include
increasing compliance among agencies as regards the conditions for PBB access. For instance,
in terms of the transparency seal requirements, compliance by government agencies increased
from less than 90 percent prior to 2014 to as much as 98 percent from 2014 to 2016 (though
rates decreased in 2017 given the tightening phase). PhilGEPS posting was also less than 90
percent prior to 2014 (with only 32 percent awards posted against total notices in 2011 prior to
the PBB rollout), with the postings at over 90 percent from 2014 to 2016 (but again dropping
to 78 percent in 2017 with the tightening phase).

Page 56
There is also a widely shared perception among survey respondents (particularly among staff
of compliant agencies) that PBB works in terms of strengthening staff members’ motivation to
achieve strong results and enhance public services. While not based on actual outcome
indicators, such a shared perception, nevertheless signals the strong legitimacy and uptake for
this particular incentive reform.
Nevertheless, there are also issues in the roll out of this reform. There is evidence of
dysfunctional behavior, including allegations that some staff are gaming the incentives. Some
agencies appear to lag behind in complying with the PBB access requirements. During the
process evaluation (Albert et al. 2019), it was noted that the requirement for ISO-QMS
certification was a contributing factor as to why many agencies and SUCs were ineligible to
receive the PBB grant starting 2015: amid rising ineligibility rates in the period 2015 to 2017,
the share of agencies among the ineligibles that were not ISO-compliant were increasing from
around 20 percent in 2015 to nearly 80 percent in 2016 and 2017.
It is reasonable for the government to continue the implementation of the PBB incentive
scheme, but it is also extremely important to develop ways to improve on it. Given the PBB
implementation is on its 9th year, it may be an opportune time to start planning for a grand
revision in design and implementation of the PBB by 2022 (when a new administration is in
place). International evidence and good practice suggests that output and performance based
incentives are much preferred over across-the-board increases, not just from a performance
viewpoint, but also in terms of budget sustainability. Possible improvements in the PBB could
touch on the following aspects, building on a framework that seeks to improve on the over-all
incentives framework:
• Implement a moratorium on changes in the agency-level conditions, so agencies will
have an opportunity to comply with existing conditions (and especially in light of the
seeming increased workloads under the COVID-19 pandemic and the new normal).
• Create agency-level redress mechanisms for complaints, such as alleged issues of
unfairness and “gaming” of the incentives.
• Provide support mechanisms for lagging agencies on access conditions (e.g., leadership
and strategy reviews, technical assistance on change management).
• Take the opportunity under the pandemic to enhance non-financial incentives.
Flexibility on assignment location; work from home options, etc., could also be
powerful incentives. This time, consider a rigorous impact evaluation framework for
the non-financial incentives.
• Consider experimentation on a small scale regarding the provision of incentives to
agencies based on the contribution to sectoral targets, such as the PDP and/or the
Sustainable Development Goals (Reyes et al. 2019).
It is critical that PBB be understood within a broader reform context across these agencies.
Staff in agencies that are “overwhelmed” with requirements may actually be discouraged rather
than incentivized—so it is critical that reform roadmaps in each agency be synced with the use
of PBB. These roadmaps should include plans to streamline data collection for performance,
and enhance e-government among other options to lessen the reporting burden for staff
members. It is critical to start shifting toward digitalized rather than paper documentation
submissions, and to simplify the PBB requirements, so that reform gains are more firmly
established (and to help prevent regression in accomplishments). In addition, technical
assistance and support for change management efforts to strengthen the compliance with some
of the conditions for access to PBB could be useful, particularly for the lagging agencies. This

Page 57
should help address the concern that some agencies are getting left further behind, not because
of lack of staff members’ efforts, but because of the need for reform support.

Page 58
6. References
Administrative Order (AO) No. 25. 2011. Creating an Inter-Agency Task Force on the
Harmonization of National Government Performance Monitoring, Information and
Reporting Systems. https://www.officialgazette.gov.ph/2011/12/21/administrative-
order-no-25-s-2011/ (Accessed March 30, 2020).
Albert, J. R. G., R. U. Mendoza, J. S. Cuenca, G. A. Opiniano, J. Decena-Monje, M. A. Pastor,
and M. S. Muñoz. 2019. Process Evaluation of the Performance-Based Bonus (PBB)
Scheme. PIDS Discussion Paper No. 2019-18. Philippine Institute for Development
Studies (PIDS), Quezon City. Process Evaluation of the Performance-Based Bonus
(PBB) Scheme. https://pidswebs.pids.gov.ph/CDN/PUBLICATIONS/pidsdps1915.pdf
(Accessed March 30, 2020).
Andrews, R. 2014. Performance Management and Public Service Improvement. PPIW Report
No. 3. Public Policy Institute for Wales.
AO 25 Secretariat. 2019. AO25 Briefing with PIDS. Powerpoint Presentation.
Bayo-Moriones, A., J. E. Galdon-Sanchez, S. Martinez-deMorentin. 2015.) : Performance
Measurement and Incentive Intensity. IZA Discussion Papers, No. 9243, Institute for the
Study of Labor (IZA), Bonn, Germany.
https://www.econstor.eu/bitstream/10419/114109/1/dp9243.pdf (Accessed November
30, 2020).
Burgess, S., C. Propper, M. Ratto, E. Tominey. 2017. Incentives in the Public Sector: Evidence
from a Government Agency. The Economic Journal, Volume 127, Issue 605, October
2017, Pages F117–F141, https://doi.org/10.1111/ecoj.12422 (Accessed November 30,
2020).
Burgess, S. and M. Ratto. 2003. The Role of Incentives in the Public Sector: Issues and
Evidence. CMPO Working Paper Series No. 03/071. Bristol: Centre for Market and
Public Organisation. University of Bristol. https://academic.oup.com/oxrep/article-
abstract/19/2/285/465426?redirectedFrom=fulltext (Accessed November 29, 2020).
Burgess, S., C. Propper, M. Ratto, E. Tominey, and S. von Hinke Kessler Scholder. 2012. On
the Use of High-Powered Incentives in the Public Sector. VoxEU.
https://voxeu.org/article/use-high-powered-incentives-public-sector (Accessed
November 29, 2020).
Deming, W. E. 2000. Out of the Crisis. MIT Press Books, The MIT Press, edition 1, volume 1,
number 0262541157, September.
Dixit, A. K. 2002. Incentives and Organizations in the Public Sector: An Interpretative Review.
The Journal of Human Resources, 37(4): 696-727.
https://www.jstor.org/stable/3069614?seq=1 (Accessed November 29, 2020).
Executive Order No. 292, s. 1987. Instituting the “Administrative Code of 1987”.
https://www.officialgazette.gov.ph/1987/07/25/executive-order-no-292-s-1987/
(Accessed November 15, 2020).

Page 59
Executive Order No. 80. 2012. Directing the Adoption of a Performance-Based Incentive
System for Government Employees.
https://www.officialgazette.gov.ph/2012/07/20/executive-order-no-80-s-2012/
(Accessed March 30, 2020).
Executive Order No. 43. 2011. Pursuing Our Social Contract with the Filipino People Through
the Reorganization of the Cabinet Clusters.
https://www.officialgazette.gov.ph/2011/05/13/executive-order-no-43-s-2011/
(Accessed March 30, 2020).
Festre, A. and P. Garrouste. 2008. Motivation, Incentives, and Performance in the Public
Sector. Paris: Centre d'économie de la Sorbonne (CES).
https://citeseerx.ist.psu.edu/viewdoc/download?doi=10.1.1.319.6661&rep=rep1&type=
pdf (Accessed November 29, 2020).
Garbers, Y. and U. Konradt 2013. The effect of financial incentives on performance: A
quantitative review of individual and team‐based financial incentives. Journal of
Occupational and Organizational Psychology. First published: 05 October 2013
https://doi.org/10.1111/joop.12039 (Accessed November 30, 2020).
Gibbons, R. 1998. Incentives in Organizations. Journal of Economic Perspectives, 12 (4): 115-
132. DOI: 10.1257/jep.12.4.115
https://www.aeaweb.org/articles?id=10.1257/jep.12.4.115 (Accessed November 30,
2020).
Gneezy, U., S. Meier, and P. Rey-Biel. 2011. When and Why Incentives (Don’t) Work to
Modify Behavior. Journal of Economic Perspectives, 25(4): 191-210.
https://www.aeaweb.org/articles?id=10.1257/jep.25.4.191 (Accessed November 29,
2020).
Heinrich, C. and G. Marschke. 2010. Incentives and Their Dynamics in Public Sector
Performance Management Systems. Journal of Policy Analysis and Management 29(1),
183–208. https://onlinelibrary.wiley.com/doi/abs/10.1002/pam.20484 (Accessed
November 29, 2020).
Khan, A., A. Khwaja, and B. Olken. 2016. Tax Farming Redux: Experimental Evidence on
Performance Pay for Tax Collectors. Quarterly Journal of Economics, 131(1): 219-271.
https://academic.oup.com/qje/article-
abstract/131/1/219/2461220?redirectedFrom=fulltext (Accessed November 29, 2020).
Kohn, A. 1993. Why Incentive Plans Cannot Work. Harvard Business Review. September
October. Accessed from the HBR website on April 11, 2019.
https://hbr.org/1993/09/why-incentive-plans-cannot-work (Accessed November 29,
2020).
Ladley, D., I. Wilkinson, and L. Young. 2015. The impact of individual versus group rewards
on work group performance and cooperation: A computational social science approach.
Journal of Business Research, Volume 68, Issue 11, 2015, Pages 2412-2425, ISSN 0148-
2963, https://doi.org/10.1016/j.jbusres.2015.02.020 (Accessed November 30, 2020).

Page 60
Lewin, D. 2003. Incentive Compensation in the Public Sector: Evidence and Potential. Journal
of Labor Research, 24(4): 597-619. https://link.springer.com/article/10.1007/s12122-
003-1016-z (Accessed November 29, 2020).
Maslow, A. H. 1943. A Theory of Human Motivation. Psychological Review, 50(4): 370–96.
McCambridge, J., Witton, J., & Elbourne, D. R. 2014. Systematic review of the Hawthorne
effect: new concepts are needed to study research participation effects. Journal of clinical
epidemiology, 67(3), 267–277. https://doi.org/10.1016/j.jclinepi.2013.08.015 (Accessed
November 29, 2020).
Memorandum Circular No. 2012-02 “Guidelines to Clarify the Good Governance Conditions
for Fiscal Year 2012 in Line with the Grant of the Performance-Based Bonus under
Executive Order (EO) No. 80.
https://www.officialgazette.gov.ph/downloads/2012/10oct/20121016-AO25-MC-
2012-02.pdf (Accessed November 29, 2020).
Mitchell, T. 1982. Motivation: New Directions for Theory, Research, and Practice. The
Academy of Management Review, 80-88. Academy of Management.
Mogultay, U. nd. Making Performance Pay More Successful in Public Sector. Turkiye
Cumhuriyeti Disisleri Bakanligi. http://www.mfa.gov.tr/making-performance-pay-
more-successful-in-public-sector.tr.mfa (Accessed March 30, 2020).
Montana, P. and B. Charnov. 2008. Management – 4th edition. Barron's Educational Series,
Inc. ISBN 978-0-7641-3931-4.
Montoya, S. and J. Graham. 2007. Modernizing the Federal Government: Paying for
Performance. California, United States: RAND Corporation
National Economic and Development Authority (NEDA). Philippine Development Plan (PDP)
2011-2016. https://www.neda.gov.ph/philippine-development-plan-2011-2016/
(Accessed March 30, 2020).
Olken, B., J. Onishi, and S. Wong. 2014. Should Aid Reward Performance? Evidence from a
Field Experiment on Health and Education in Indonesia. American Economic Journal:
Applied Economics, 6(4): 1–34. https://www.aeaweb.org/articles?id=10.1257/app.6.4.1
(Accessed March 30, 2020)
Rasul, I. and D. Rogger. 2016. Management of Bureaucrats and Public Service Delivery:
Evidence from the Nigerian Civil Service. The Economic Journal, 128: 413–446.
https://onlinelibrary.wiley.com/doi/abs/10.1111/ecoj.12418 (Accessed March 30, 2020)
Republic Act No. 10149. An Act to Promote Financial Viability and Fiscal Discipline in
Government-Owned or –Controlled Corporations and to strengthen the role of the State
in its Governance and Management to Make them more responsive to the needs of
public interest and for its purposes, 2010
https://www.officialgazette.gov.ph/2011/06/06/republic-act-no-10149/ (Accessed
March 30, 2020)

Page 61
Reyes, C. M., J. R. G. Albert, A. D. Tabuga, A. A. Arboneda, J. F. V. Vizmanos, and C. C.
Cabaero. 2019. The Philippines’ Voluntary National Review on the Sustainable
Development Goals. PIDS Discussion Paper No. 2019-10. Philippine Institute for
Development Studies (PIDS), Quezon City.
https://pidswebs.pids.gov.ph/CDN/PUBLICATIONS/pidsdps1910.pdf (Accessed
November 30, 2020).
Rusa, L., M. Schneidman, G. Fritsche, and L. Musango. 2009. Rwanda: Performance-Based
Financing in the Public Sector. In Performance Incentives for Global Health: Potentials
and Pitfalls, edited by Rena Eichler, Ruth Levine, and the Performance-Based Incentives
Working Group, 189-214. Baltimore: Brookings Institution Press.
https://www.cgdev.org/sites/default/files/archive/doc/books/PBI/10_CGD_Eichler_Lev
ine-Ch10.pdf (Accessed March 30, 2020)
Schober, M.F. 2018. The future of face-to-face interviewing. Quality Assurance in Education,
Vol. 26 No. 2, pp. 290-302. https://doi.org/10.1108/QAE-06-2017-0033 (Accessed
March 30, 2020)
Talbot, C. 2007. “Performance Management.” In The Oxford Handbook of Public
Management, edited by Ewan Ferlie, Laurence E. Lynn Jr., and Christopher Pollitt.
Oxford University Press.
https://www.oxfordhandbooks.com/view/10.1093/oxfordhb/9780199226443.001.000
1/oxfordhb-9780199226443 (Accessed March 30, 2020)
Torneo, A., G. Jaca, J. M. A. Malbarosa, and J. L. Espiritu. 2017. Preliminary Assessment of
the Performance-Based Incentives System (PBIS) on Selected Agencies: Policy
Recommendations. Australian Aid – Philippines Australia Human Resource and
Organisational Development Facility (PAHRODF).
https://archive.australiaawardsphilippines.org/prgs/final-policy-notes/pbis-policy-
note-final.pdf (Accessed November 15, 2020)
The Work Foundation. 2014. A Review of the Evidence on the Impact, Effectiveness, and
Value for Money of Performance-Related Pay in the Public Sector. United Kingdom:
Office of Manpower Economics.
https://assets.publishing.service.gov.uk/government/uploads/system/uploads/attachme
nt_data/file/381600/PRP_final_report_TWF_Nov_2014.pdf (Accessed November 29,
2020)
Underhill, K. 2016. When Extrinsic Incentives Displace Intrinsic Motivation: Designing Legal
Carrots and Sticks to Confront the Challenge of Motivational Crowding-Out. Yale
Journal on Regulation, 33: 213-279.
https://digitalcommons.law.yale.edu/yjreg/vol33/iss1/5/ (Accessed November 29,
2020)
U.S. Merit Systems Protection Board. 2006. Designing an Effective Pay for Performance
Compensation System.
https://www.mspb.gov/mspbsearch/viewdocs.aspx?docnumber=224104&version=224
323&application=ACROBAT (Accessed November 29, 2020)

Page 62
Vroom, V. 1964. Work and Motivation. New York: Wiley.
World Bank. 2014a. Philippines: Improving Bureaucratic Performance - Assessment of the
Performance-Based Bonus Scheme. WB Report No. AUS3494. Washington DC:
World Bank.
https://openknowledge.worldbank.org/bitstream/handle/10986/21815/AUS34940WP0
P14455800PUBLIC0Box391411B.pdf?sequence=1&isAllowed=y (Accessed March
30, 2020)
World Bank. 2014b. Pay Flexibility and Government Performance: A Multicountry Study.
International Bank for Reconstruction and Development.
https://openknowledge.worldbank.org/bitstream/handle/10986/18959/884860WP0Pay
Fl00Box385241B00PUBLIC0.pdf?sequence=1&isAllowed=y (Accessed March 30,
2020)
World Bank. 2020. Improving Talent Management in the Philippines Civil Service: Findings
from the Philippines Civil Servants Survey 2019. Powerpoint Presentation made before
the Civil Service Commission.

Page 63
Annex 1. PSEPBB Form 1: Questionnaire for Rank-and-File
PIDS Survey on Effects of Performance-based Bonus Page 1
PSEPBB Form 1: Questionnaire for Rank-and-File PSA Approval No. PIDS – 1963 – 01
Expires on 31 December 2020
2019 PIDS SURVEY ON EFFECTS OF
PERFORMANCE-BASED BONUS (PSEPBB)
Dear Sir/Madam: Upon the request of the Department of Budget and Management (DBM), the Philippine Institute for Development Studies (PIDS) is conducting an evaluation of the Performance-Based Bonus (PBB) scheme. The PIDS is the government think-tank functionally attached to the National Economic and Development Authority (NEDA). As part of the study, this survey aims to evaluate the impact of the PBB on overall productivity and performance of individual government employees and of their respective agencies. In the same context, this study tries to assess the effectiveness of the Results-Based Performance Management System (RBPMS) as a tool for determining qualification for performance-based incentives. Among the data to be collected in the survey are some information about the respondents and their knowledge about the PBB scheme and the PBB’s impact on their individual performance and productivity, as well as on that of their respective agencies. The survey has been reviewed by the Philippine Statistics Authority under its Statistical Survey Review and Clearance System. In this regard, we wish to inform you that your department/unit is one of the respondents for this survey. May we request you to provide us with the requested data by accomplishing this questionnaire. Our data partner, The All-Asian Centre for Enterprise Development, Inc. (ASCEND), will be coordinating with your office in order conduct the interviews necessary to accomplish the questionnaire. Your kind cooperation in this undertaking will be very much appreciated. Rest assured that the results of the survey will be treated with the utmost confidentiality as stipulated in Section 26 of Republic Act 10625. Under Section 27 of the same law, the target respondents are obliged to provide the required information. Thank you very much. Very truly yours, DR. CELIA M. REYES President Philippine Institute for Development Studies
CONTACT PERSON Person to be contacted for queries regarding this form: Name Mika S. Muñoz___________________ Address 18F Three Cyberpod Centris - North Tower,
Position Title Research Analyst II EDSA corner Quezon Avenue, Quezon City
Tel. No. (02) 8877-4024 Fax No. (02) 8877-4099 Email Address [email protected]

Page 64

Page 65

Page 66

Page 67

Page 68
Annex 2. PSEPBB Form 2: Questionnaire for Managers
PIDS Survey on Effects of Performance-based Bonus Page 1
PSEPBB Form 2: Questionnaire for Manager PSA Approval No. PIDS – 1963 – 02
Expires on 31 December 2020
2019 PIDS SURVEY ON EFFECTS OF
PERFORMANCE-BASED BONUS (PSEPBB)
Dear Sir/Madam: Upon the request of the Department of Budget and Management (DBM), the Philippine Institute for Development Studies (PIDS) is conducting an evaluation of the Performance-Based Bonus (PBB) scheme. The PIDS is the government think-tank functionally attached to the National Economic and Development Authority (NEDA). As part of the study, this survey aims to evaluate the impact of the PBB on overall productivity and performance of individual government employees and of their respective agencies. In the same context, this study tries to assess the effectiveness of the Results-Based Performance Management System (RBPMS) as a tool for determining the qualification for performance-based incentives. Among the data to be collected in the survey are some information about the respondents and their knowledge about the PBB scheme and the PBB’s impact on their individual performance and productivity, as well as on that of their respective agencies. The survey has been reviewed by the Philippine Statistics Authority under its Statistical Survey Review and Clearance System. In this regard, we wish to inform you that your department/unit is one of the respondents for this survey. May we request you to provide us with the requested data by accomplishing this questionnaire. Our data partner, The All-Asian Centre for Enterprise Development, Inc. (ASCEND), will be coordinating with your office in order conduct the interviews necessary to accomplish the questionnaire. Your kind cooperation in this undertaking will be very much appreciated. Rest assured that the results of the survey will be treated with the utmost confidentiality as stipulated in Section 26 of Republic Act 10625. Under Section 27 of the same law, the target respondents are obliged to provide the required information. Thank you very much. Very truly yours, DR. CELIA M. REYES President Philippine Institute for Development Studies
CONTACT PERSON Person to be contacted for queries regarding this form: Name Mika S. Muñoz___________________ Address 18F Three Cyberpod Centris - North Tower,
Position Title Research Analyst II EDSA corner Quezon Avenue, Quezon City
Tel. No. (02) 8877-4024 Fax No. (02) 8877-4099 Email Address [email protected]_

Page 69
Annex 3. FGD Instrument : Questionnaire for PBB Focal Person/ Performance Management Team (PMT)
Structure and section objectives
Section Time Intent
Introduction 3 minutes ◼ Warm-up and establish moderator rapport
◼ Get to know the respondents better Focal Person 30 minutes ◼ Discuss what respondents know about
objectives of Performance-Based Bonus (PBB)
scheme
◼ Understand the process of cascading
information (e.g. changes in the PBB guidelines
and requirements) to employees
◼ Identify the effects of PBB on performance and
productivity of employees and of entire
organization
◼ Identify top issues that respondents are
concerned about PBB
◼ Identify policies or regulation changes to
address these issues Performance Management
Team
30 minutes ◼ Discuss what respondents know about
objectives of Performance-Based Bonus (PBB)
scheme
◼ Identify how this group monitors and evaluates
the performance of individuals and/or delivery
units
◼ Identify the effects of PBB on performance and
productivity of employees and of entire
organization
◼ Identify top issues that respondents are
concerned about PBB
◼ Identify policies or regulation changes to
address these issues Closing 2 minutes ◼ Wrap up and thank respondent for participating

Page 70
A. Introductions (3 minutes)
1. Moderator introduces himself/herself and thank respondents for joining the group discussion
2. Introduce PIDS, the PBB study (e.g., description and objectives) and the study team; Orient the
respondents on the objective of the FGD/KII. Reminders:
a. There are no right or wrong answers.
b. Everyone is encouraged to share their thoughts and feelings as candidly as possible.
c. Responses are to be treated with utmost confidentiality, but request is being made to record
conversations for ease of documentation.
d. When the moderator asks a question, those who wish to respond should await the
moderator’s cue (i.e., moderator identifies name of person). NOTE: This is necessary for
orderly documentation of the activity.
e. Keep mobile phones off or on silent mode.
3. Ask interviewee to introduce themselves: name, age, work (i.e. position and unit). How long have they
been in their current position, and what is the nature of their position.
4. Gather information on the respondent's length of experience as PBB focal person and/or PMT member
a. Ask how long has he/she known about PBB and its guidelines and criteria
b. Ask how long has he/she been assigned as the PBB focal person and/or PMT member and
how/why he/she was assigned the aforementioned role

Page 71
B. Guide Questions for PBB Focal Person (30 minutes)
Discussion Point 1: Program Logic/Framework
1. What are the objectives of the Performance-Based Bonus (PBB) scheme? When did the
scheme start, what is its legal basis, why was it conceived, and do you think it is still relevant
today?
2. What other government incentives are you aware of? What do incentive schemes, particularly
those in the performance-based incentive system, in the government generally promote? On
what is PBB based? What realities in Philippine government can the PBB implementation
respond to vis a vis the Results-based Performance Management System? What need is the
PBB trying to address and how does it intend to achieve it? In terms of reforming performance
culture, how does PBB differ from other performance-based government incentives? Do you
know of any changes in the criteria and conditions of the PBB since its implementation in
your agency? If so, why do you think those changes were made?
Discussion Point 2: Program Organization/Governance
3. Are the operational procedures enforced by the AO25 IATF for the PBB well-established and
followed? Are there operational procedures for the PBB that were established by your agency?
4. What are the institutional structures that have been set up by your agency for the PBB? Are
the agency support systems for submitting, checking, validating, transmitting carried out
properly? Are resources used effectively and efficiently?
5. Has the administration, staff, and coordination with bureaus/offices in the Central Office (if
any) and with other key players, such as the AO25 IATF and validating agencies (COA,
ARTA, CSC, etc.), been efficient regarding the PBB?
Discussion Point 3: Implementation
6. How long have you been the PBB Focal Person? How many times has your agency changed
its PBB Focal Person? What is your position in the agency and why do you think you were
designated as the PBB Focal Person? What are the roles and responsibilities of the executives
in your agency regarding PBB, if any?
7. Does your agency conduct individual performance review? How often? Who determines the
individual and office performance targets? Who is responsible in monitoring and evaluation
of individual and office performance? Who sets the rating of individuals and delivery units?

Page 72
8. In your experience as the PBB Focal Person, was there a time when your agency did not
participate in the PBB scheme? What fiscal year did this happen and why? Did all or select
employees only qualify for the PBB? Were there delivery units or selected employees from
your agency who failed to qualify for the PBB? Why? What were the requirements that were
not satisfied by other employees?
9. In your opinion, did the grant of PBB improve the productivity and performance of your
agency and employees? Would your agency have reached productivity and performance
targets even without the PBB? (Ask evidence). Do you think agencies/bureaus/delivery units
will continue to comply with these requirements in the long run even without an incentive?
10. How are the PBB guidelines and requirements disseminated to employees? What measures
have you put in place at your agency to cascade the PBB to the rank-and-file? What concrete
evidence can you cite to show that the rank-and-file understood what is expected of them?
11. What are the issues, opportunities and challenges that the agency encountered in complying
with the PBB requirements (since 2012-2018)?
a. What has been your experiences at your agency in participating in the scheme? How
long did it take you to comply with the PBB requirements for each PBB cycle?
b. How did the agency prepare for the PBB requirements?
c. What mechanisms have you put in place to ensure compliance?
d. What are the barriers and enablers to program implementation?
e. Were there costs (e.g., financial costs and staff-time) incurred by the agency to comply
with the PBB requirements (for instance for setting up and maintaining the Quality
Management System)? How much are the costs?
f. So far, how successful has your agency been in carrying out the terms of the PBB?
Can you provide three major benefits of the PBB to the agency?
12. Do you think regular feedback can be sourced and used from agency stakeholders regarding
PBB processes?
13. What are the best practices of offices that you have heard of or read about regarding the PBB?
Are there any areas for improvement?
14. What challenge/s have you encountered related to the implementation of the PBB? What have
you done to respond to these challenges?
• What issues and concerns do you have now on PBB?
• Have workloads increased with the implementation of the PBB scheme?
• What policies or regulation changes do you think will help address them?
15. What mechanisms have you put in place to ensure compliance?

Page 73
16. What complaint mechanisms have been set up by your agency to respond to concerns and
issues? What are the most common problems have you encountered regarding the PBB and
how have you responded?
Sub-Discussion Point: Ways Forward
17. In your opinion, has the PBB met its overall objectives? What do you consider as the major
strengths in the design and implementation of the PBB scheme? How about the major
weaknesses?
18. Do you have any suggestions on how to improve the design and implementation of the PBB
(whether at your agency or government wide)?
C. Guide Questions for Members of the Performance Management
Team (PMT) (30 minutes)
Discussion Point 1: Program Logic/Framework
1. What are the objectives of the Performance-Based Bonus (PBB) scheme? When did the
scheme start, what is its legal basis, why was it conceived, and do you think it is still relevant
today?
2. What other government incentives are you aware of? What do incentive schemes, particularly
those in the performance-based incentive system, in the government generally promote? On
what is PBB based? What realities in Philippine government can the PBB implementation
respond to vis-a-vis the Results-based Performance Management System? What need is the
PBB trying to address and how does it intend to achieve it? Are there government objectives
that the PBB hopes to achieve that were not being addressed by previous incentive plans?
3. Do you know of any changes in the criteria and conditions of the PBB since its
implementation in your agency? If so, why do you think those changes were made?
Discussion Point 2: Program Organization/Governance
4. Are the operational procedures enforced by the AO25 IATF for the PBB well-established and
followed? Are there operational procedures for the PBB that were established by your agency?
5. What are the institutional structures that have been set up by your agency for the PBB? Are
the agency support systems for submitting, checking, validating, transmitting carried out
properly? Are resources used effectively and efficiently?

Page 74
6. Has the administration, staff, and coordination with bureaus/offices in the Central Office (if
any) and with other key players, such as the AO25 IATF and validating agencies (COA,
ARTA, CSC, etc.), been efficient regarding the PBB?
Discussion Point 3: Implementation
7. What is your role as a member of the PMT? Who constitutes the PMT? What are your
responsibilities and how do you ensure to perform your duties?
8. Does your agency conduct individual performance review? How often? Who determines the
individual and office performance targets? Who is responsible in monitoring and evaluation
of individual and office performance? Who sets the rating of individuals and delivery units?
9. As a member of the PMT, how do you set the targets, performance measures, and success
indicators for the employees and the whole of agency? How do you distribute the workload
of offices and/or delivery units?
10. In what years did your agency participate in the implementation of the PBB scheme? Did all
or select employees only qualify for the PBB? (If select employees only: Why? What were
the requirements that were not satisfied by other employees?) How does your agency act on
improving performance of unsatisfactory and poor performers/delivery units?
11. In your opinion, did the grant of PBB improve the productivity and performance of your
agency and employees? Would your agency have reached productivity and performance
targets even without the PBB? (Ask evidence). Do you think agencies/bureaus/delivery units
will continue to comply with these requirements in the long run even without an incentive?
12. What are the issues, opportunities and challenges that the agency encountered in complying
with the PBB requirements (since 2012-2018)? How are the PBB guidelines and requirements
disseminated to employees? What measures have you put in place at your agency to cascade
the PBB to the rank-and-file? What concrete evidence can you cite to show that the rank-and-
file understood what is expected of them?
a. What has been your experiences at your agency in participating in the scheme? How
long did it take you to comply with the PBB requirements for each PBB cycle?
b. How did the agency prepare for the PBB requirements?
c. What mechanisms have you put in place to ensure compliance?
d. What are the barriers and enablers to program implementation?
e. Were there costs (e.g., financial costs and staff-time) incurred by the agency to comply
with the PBB requirements (for instance for setting up and maintaining the Quality
Management System)? How much are the costs?

Page 75
f. So far, how successful has your agency been in carrying out the terms of the PBB?
Can you provide three major benefits of the PBB to the agency?
13. Do you think regular feedback can be sourced and used from agency stakeholders regarding
PBB processes?
14. What are the best practices of offices that you have heard of or read about regarding the PBB?
Are there any areas for improvement?
15. What challenge/s have you encountered related to the implementation of the PBB? What have
you done to respond to these challenges?
• What issues and concerns do you have now on PBB?
• Have workloads increased with the implementation of the PBB scheme?
• What policies or regulation changes do you think will help address them?
16. What mechanisms have you put in place to ensure compliance?
17. What complaint mechanisms have been set up by your agency to respond to concerns and
issues? What are the most common problems have you encountered regarding the PBB and
how have you responded?
Sub-Discussion Point: Ways Forward
18. In your opinion, has the PBB met its overall objectives? What do you consider as the major
strengths in the design and implementation of the PBB scheme? How about the major
weaknesses?
19. Do you have any suggestions on how to improve the design and implementation of the PBB
(whether at your agency or government wide)?
D. Closing (2 minutes)
Wind down session. Ask if there are questions. Otherwise, thank respondent/s for their time and give
token from PIDS.

Page 76
Annex 4. FGD Instrument for Validating Agencies
Structure and section objectives
Section Time Intent
Introduction 3 minutes ◼ Warm-up and establish moderator rapport
◼ Get to know the respondents better
Processes on the
Performance-Based Bonus
Scheme
25 minutes ◼ Discuss what respondents know about objectives of
Performance-Based Bonus (PBB) scheme
◼ Identify the effects of PBB on compliance of
participating agencies to government regulations as
requirements for PBB eligibility
◼ Find out how this group reviews and validates
requirement of their agency
◼ Identify common issues and challenges that
government agencies encountered in compliance to
government regulations
◼ Identify issues and challenges that your agency
encountered in carrying out your role as a validating
agency
◼ Identify top issues that respondents are concerned
about PBB
◼ Identify policies or regulation changes to address these
issues
Closing 2 minutes ◼ Wrap up and thank respondent for participating

1
A. Introductions (3 minutes)
1. Moderator introduces himself/herself and thank respondents for joining the group
discussion
2. Introduce PIDS, the PBB study (e.g., description and objectives) and the study team;
Orient the respondents on the objective of the FGD/KII. Reminders:
a. There are no right or wrong answers.
b. Everyone is encouraged to share their thoughts and feelings as candidly as
possible.
c. Responses are to be treated with utmost confidentiality, but request is being
made to record conversations for ease of documentation.
d. When the moderator asks a question, those who wish to respond should
await the moderator’s cue (i.e., moderator identifies name of person).
NOTE: This is necessary for orderly documentation of the activity.
e. Keep mobile phones off or on silent mode.
3. Ask interviewee to introduce themselves: name, age, work (i.e. position and unit). How
long have they been in their current position, and what is the nature of their position.

2
B. Guide Questions for Validating Agencies (25 minutes)
Now, I would like to get your candid thoughts about PBB.
Discussion Point 1: Program Logic/Framework
1. What are the objectives of the Performance Based Bonus (PBB) scheme? When did the
scheme start, what is its legal basis, why was it conceived, and do you think it is still
relevant today?
2. What other government incentives are you aware of? What do incentive schemes,
particularly those in the performance-based incentive system, in government generally
promote? On what is PBB based? What need is the PBB trying to address and how does
it intend to achieve it? In terms of reforming performance culture, how does PBB differ
from other performance-based government incentives?
Discussion Point 2: Program Organization/Governance
3. Are there institutional structures that have been set up at your agency for review and
validation of PBB requirements? How do you review and validate the submissions of
government agencies? How do you ensure that operational procedures for review and
validation are followed?
Discussion Point 3: Implementation
4. What are the specific government regulations overseen by your agency that are part of
the requirements for the grant of PBB? How did the regulations become requirements
of PBB?
5. What are the processes in reviewing and validating compliance of agencies?
6. How do you ensure transparency in the results of the review and validation?
7. Are there complaint/feedback mechanisms for issues and concerns of agencies? How
often do you solicit/receive feedback from agencies?
8. What are the common feedbacks and concerns of agencies in complying with the PBB
requirements monitored by your agency?
9. What are the common issues and challenges that government agencies encountered in
complying with government regulations, before and after PBB scheme’s
implementation? (e.g. ARTA has been enforced even before the implementation of the
PBB).

3
10. What have you done to address them? Are there policies or policy changes that will
help to address them?
11. Please discuss your observations on the compliance rate of agencies/bureaus/delivery
units before and after PBB scheme’s implementation.
12. In your opinion, did the grant of PBB improve the compliance rate of agencies?
13. Are there any deviations or modifications made on specific requirements of your
agency for the PBB scheme (e.g. increasing BUR compliance to 100%)? If so, why
were these changes made? Did these changes affect the compliance rate of
agencies/bureaus/delivery units?
14. Do you think agencies/bureaus/delivery units will continue to comply with the
requirements in the long run even without an incentive?
15. What are the best practices of offices that you have heard of or read about regarding
compliance to your requirements for the PBB? What about areas for improvement
regarding compliance to your requirements for the PBB?
16. What are the issues and challenges that you encountered in carrying out your role as
validating agency? What have you done to address them?
17. As a validating agency, how are workloads divided among teams/personnel in charge
of enforcing PBB requirements? Aside from PBB-related work, are there any tasks
assigned from these teams/personnel? Were these tasks mandated before the
implementation of PBB or were they related to the enforcement of PBB throughout the
duration of its implementation?
18. How did feedbacks affect your work as a validating agency? (e.g. revision on criteria
of requirements, conduct of consultations to clarify PBB requirements, changes in
processes of compliance, etc.)
Sub-Discussion Point: Ways Forward
19. In your opinion, has the PBB met its overall objectives for your agency? What do you
consider as the major strengths and weaknesses in the design and implementation of
the PBB scheme?
20. Do you have any suggestions on how to improve the design and implementation of the
PBB (whether at your agency or government wide)?
C. Closing (2 minutes)
Wind down session. Ask if there are questions. Otherwise, thank respondent/s for their time and
give token from PIDS.