evaluation of the hinge moment and normal force aerodynamic loads from a seamless ... ·...
TRANSCRIPT

1
Evaluation of the Hinge Moment and Normal Force
Aerodynamic Loads from a Seamless Adaptive Compliant
Trailing Edge Flap in Flight
Eric J. Miller,1 Josue Cruz,2 and Shun-Fat Lung3
NASA Armstrong Flight Research Center, Edwards, California, 93523
Sridhar Kota, Ph.D.,4 Gregory Ervin,5 and Kerr-Jia Lu, Ph.D.6
FlexSys Inc., Ann Arbor, Michigan, 48105
and
Pete Flick7
AFRL Air Vehicles Directorate, Wright-Patterson Air Force Base, Ohio, 45433
A seamless adaptive compliant trailing edge (ACTE) flap was demonstrated in flight on a
Gulfstream III aircraft (Gulfstream Aerospace Corporation, Savannah, Georgia) at the
National Aeronautics and Space Administration (NASA) Armstrong Flight Research Center
(Edwards, California). The trailing edge flap was deflected between -2° up and +30° down in
flight. The safety-of-flight parameters for the ACTE flap experiment require that flap-to-wing
interface loads be sensed and monitored in real time to ensure that the structural load limits
of the wing are not exceeded. The attachment fittings connecting the flap to the aircraft wing
rear spar were instrumented with strain gages and calibrated using known loads for
measuring hinge moment and normal force loads in flight. The interface hardware
instrumentation layout and load calibration are discussed. Twenty-one applied calibration test
load cases were developed for each individual fitting. The 2-sigma residual errors for the hinge
moment was calculated to be 2.4 percent, and for normal force was calculated to be
7.3 percent. The hinge moment and normal force generated by the ACTE flap with a hinge
point located at 26-percent wing chord were measured during steady state and symmetric
pitch maneuvers. The loads predicted from analysis were compared to the loads observed in
flight. The hinge moment loads showed good agreement with the flight loads while the normal
force loads calculated from analysis were overpredicted by approximately 20 percent. Normal
force and hinge moment loads calculated from the pressure sensors located on the ACTE
showed good agreement with the loads calculated from the installed strain gages.
Nomenclature
ACTE = Adaptive Compliant Trailing Edge
AFRC = Armstrong Flight Research Center
AFRL = Air Force Research Laboratory
AOA = angle of attack
BL = butt line
1Research Engineer, Aerostructures Branch, P.O. Box 273, Edwards, California, 93523, AIAA member. 2Research Engineer, Aerostructures Branch, P.O. Box 273, Edwards, California, 93523, AIAA member. 3Research Engineer, Aerostructures Branch, P.O. Box 273, Edwards, California, 93523, AIAA nonmember. 4President and CEO, FlexSys Inc., Ann Arbor, Michigan, 48105, AIAA nonmember. 5Operations Manager, FlexSys Inc., Ann Arbor, Michigan, 48105, AIAA nonmember. 6Principal Engineer, FlexSys Inc., Ann Arbor, Michigan, 48105, AIAA nonmember. 7Research Engineer, AFRL Air Vehicles Directorate, Wright-Patterson Air Force Base, Ohio, 45433, AIAA
nonmember.
https://ntrs.nasa.gov/search.jsp?R=20160000870 2020-05-08T19:27:59+00:00Z

2
bf = flap span, 18.75 ft CFD = computational fluid dynamics
Chf = ACTE flap aerodynamic hinge moment coefficient,
Hf
qSfcf
CNf = ACTE flap aerodynamic normal force coefficient,
Nf
qSf
cf = flap average chord, 3.13 ft cgf = center of gravity of the total flap modification weight aft of the flap hinge point
FEM = finite element method
G-III = Gulfstream III
Hf = ACTE flap aerodynamic hinge moment, in-lb
IB = inboard
M = Mach number
NASA = National Aeronautics and Space Administration
Nf = ACTE flap aerodynamic normal force, lb
nz = airplane normal acceleration, g
OB = outboard
POPU = pushover-pullup
q = free stream dynamic pressure, lb/ft2
SCRAT = SubsoniC Research Aircraft Testbed
Sf = flap panel area, 58.8 ft2
TS = transition surface
Wf = total flap modification weight
WUT = wind-up turn
α = airplane angle of attack, deg
I. Introduction
light-testing new and innovative structures in a flight-relevant environment promotes the transition of structural
technologies from research to mainstream production. Wind-tunnel and ground-based load testing of structural
flight technologies have inherent limitations that can be overcome through flight-testing. The National Aeronautics
and Space Administration (NASA) Armstrong Flight Research Center (AFRC) (Edwards, California) has procured,
modified, and instrumented a Gulfstream G-III airplane (Gulfstream Aerospace Corporation, Savannah, Georgia), to
increase the Technology Readiness Level (TRL) of promising new flight technologies. This airplane is named the
SubsoniC Research Aircraft Testbed (SCRAT).1
The NASA AFRC partnered with the Air Force Research Laboratory (AFRL) and FlexSys Inc. (Ann Arbor,
Michigan) to flight test the Adaptive Compliant Trailing Edge (ACTE) experiment to demonstrate a seamless adaptive
compliant structural control surface in flight.2 Wind-tunnel testing and small-scale flight tests of the compliant
technology were conducted as a first step, but a full-scale compliant structure requires flight-testing to build confidence
before the technology can be fully transitioned to commercial industry.3
The Mission Adaptive Wing (MAW) program in the 1980s demonstrated the benefits of seamless, morphing, wing
leading and trailing edges on a modified F-111 airplane (General Dynamics); since then, many in the aviation research
and development community have attempted to realize those benefits without the associated weight and complexity
of the mechanism behind the MAW.4
Structural design optimization methods that produce a design for a structure that can bend and twist to achieve
various wing shapes for optimum flight throughout the flight envelope are the key enabler for ACTE. The ACTE
technology is envisioned as a multifunctional aerodynamic surface that enables the airfoil shape to be optimized for
minimum drag over a broad range of flight conditions, instead of a single flight condition using traditional wing
design. The ACTE is also envisioned to be actuated at high enough rates to enable structural load alleviation during
maneuvers and gusts, leading to lighter-weight wing structures and more efficient aerodynamic vehicle configurations.
The ACTE can also achieve large deflections for use in high-lift conditions. Contemporary aviation structures employ
a system of mechanisms to mechanically actuate control surfaces. FlexSys Inc. technology takes advantage of material
elasticity to produce large structural deformations while maintaining the structural strength required to carry the air
loads.
Two ACTE flaps were fabricated and assembled to replace both existing Fowler flaps on the SCRAT. Figure 1
shows the ACTE flaps installed on the Gulfstream III SCRAT at a flap deflection of 20°. The primary objective of the
F

3
flight-test program was structural flight demonstration of the ACTE technology. Demonstrating the ACTE technology
within the envelope applicable to cruise drag reduction and gust load alleviation was deemed an additional requirement
of this test program in order to demonstrate the versatility of this technology. The ACTE test program was structured
to collect aerodynamic and structural performance data for assessment of the technology for future flight applications,
so in-flight actuation was not required for this demonstration. The ACTE flaps were fixed at a predetermined
deflection angle for each flight and remained fixed in that position for the duration of that flight. The flight-test
deflection range of the ACTE was -2° to +30° (- signifies up-flap deflection, + signifies down-flap deflection). The
ACTE was designed and operated to -9° and +40° on the ground.
II. Compliant Design
The ACTE structure makes use of compliant design.5 When comparing human-engineered machines to systems
found in nature, we observe fundamental differences in composition, work, and performance. Most engineered
systems that transmit mechanical motions or forces or energy consist of a plurality of rigid components connected by
various interfaces or joints. Engineered artifacts such as engines, pumps, propellers, wings, et cetera, have fixed
geometry optimized for peak performance at a specific operating condition. Designs in nature, such as tree branches,
bird wings, elephant trunks, and invertebrates, which account for a majority of all living creatures, are suitably
compliant (flexible), comparatively strong, and offer a tremendous range of shape adaptation to dynamically maximize
their performance.
Compliant design embraces elasticity, rather than avoiding it, to create one-piece kinematic machines, or joint-less
mechanisms, that are strong and flexible (for shape adaptation). In common, flexural joints or flexures are concentrated
at localized zones, sometimes along a single axis, surrounded by relatively rigid sections. These zones of high stress
concentration limit the load-carrying capacity of systems with flexural joints. Distributed compliance is the ability of
a structural system to be simultaneously flexible and strong - two quantities that are usually considered contradictory
to each other in traditional engineering disciplines. Designs with distributed compliance exhibit both strength and
flexibility, because every section of the material participates in both load-sharing and kinematic functions. The
cascading benefits of elastic design include high fatigue life and a significant reduction in parts and mechanical
complexity. Elimination of joints improves precision and eliminates friction and wear.
The concept of distributed compliance and its associated design methods were developed by Sridhar Kota of the
University of Michigan. By combining the principles of continuum mechanics and kinematics, FlexSys Inc. developed
algorithms for synthesizing lightweight compliant structures that have high (static and fatigue) strength and are
sufficiently flexible to deliver a desired kinematic or shape-morphing function.6
The compliant iris mechanism developed by FlexSys Inc. shown in Fig. 2 demonstrates the concept of distributed
compliance. The actuation energy supplied by simply rotating the external tabs (one clockwise, the other
counterclockwise) is distributed more or less uniformly as strain energy. Large deformations can be achieved by
subjecting every section of the material to contribute equally to the (shape-morphing) objective while all components
share the loads. Every section of the material thus undergoes a very small amount of linear elastic strain with very low
stress; therefore, the structure can undergo large deformations with high fatigue life.
The design of the FlexFoil™ (FlexSys Inc.) ACTE is based on these principles of compliant design. The ACTE
distributes compliance throughout the structure, changing the wing camber from -9° to +40° on demand while
sustaining the required external load. The FlexFoil™ variable-geometry surface uses the natural flexibility of
aerospace-grade materials arranged in a joint-less skeletal configuration to continuously reshape its external form by
using internal actuators. Each section of the internal compliant structure is optimized to share the external load and
undergoes the specified deformation without overstressing any part of the structure. This “distributed compliance”
enables large deformations with very low stresses so that the system can be cycled thousands of times without failure.
III. Structural Composition
The ACTE structure consists of four components. The main flap spans 168 inches and is the main lifting surface.
The inboard and outboard transition surfaces each span 24 inches and blend the main flap structure into the inboard
and outboard wing structure. Closeout panels were added around the ACTE boundary to create the seamless structure.
All four components are shown in Fig. 3. The main flap, transition sections, and closeout structure are all contributing
to the flap hinge moment and normal force loads.
The ACTE flaps were attached to the wing rear spar at the existing four Fowler flap attachment points on each
wing. The existing G-III Fowler flaps are actuated aft and down using rollers guided by the four tracks attached to the
rear spar of the wing. The ACTE integration required that the G-III flight and ground spoilers be removed to make
room for the ACTE structure. The ACTE modification required the four Fowler flap tracks to be removed and replaced

4
with the wing interface fittings that attach each ACTE flap to each G-III wing rear spar. A secondary spar was used
to attach the ACTE main flap and transition structure to the four attachment points. The secondary spar minimized the
amount of modification required to the G-III for integrating the ACTE. A cross section view of the interface structure
is shown in Fig. 4.
All ACTE loads were transferred into the wing box through the four wing interface fittings. All closeout structure
is attached to the ACTE structure, minimizing additional load transfer paths into the wing box structure. The interface
fittings are labeled in Fig. 5. The inboard wing interface fitting is referenced as fitting A, proceeding outboard to fitting
D, which is closest to the aileron. The four interface fittings must constrain all three directions of motion of the ACTE
flap, but maintain adequate translational and rotational freedom to allow ACTE lateral movement and wing flex
reactions. Wing interface fittings A, B, and C allowed lateral span-wise movement. Interface fitting D constrained the
span-wise motion of the ACTE flap, as does the G-III Fowler flap interface.
The interface fittings were made from 4340 steel that was heat-treated to 200 ksi as required for meeting design
strength requirements. The forward end of each interface fitting matched the original production Fowler flap fitting
design, but the aft portion of each fitting was redesigned to interface with the new ACTE clevis fittings. All new
hardware was designed to a required AFRC (no proof test) factor of safety of 2.25 on ultimate strength, while all
existing G-III aircraft interfaces were shown to have positive margin to the original production airplane design factor
of safety of 1.5.
The ACTE mounting brackets attachment to the rear spar consisted of a main lug and upper attachment for reacting
out the flap interface loads. The main lug is shown in Figure 5 and is located at approximately 26 percent of wing
chord. The flap hinge moment and normal force loads were reacted about the main lug on each interface fitting. The
total normal force load was calculated as a summation of the normal force loads from each fitting. The total hinge
moment load was calculated similarly. The hinge moment load is consistent with typical control surface loads in which
negative loads are caused by positive flap deflections.
IV. Instrumentation and Calibration
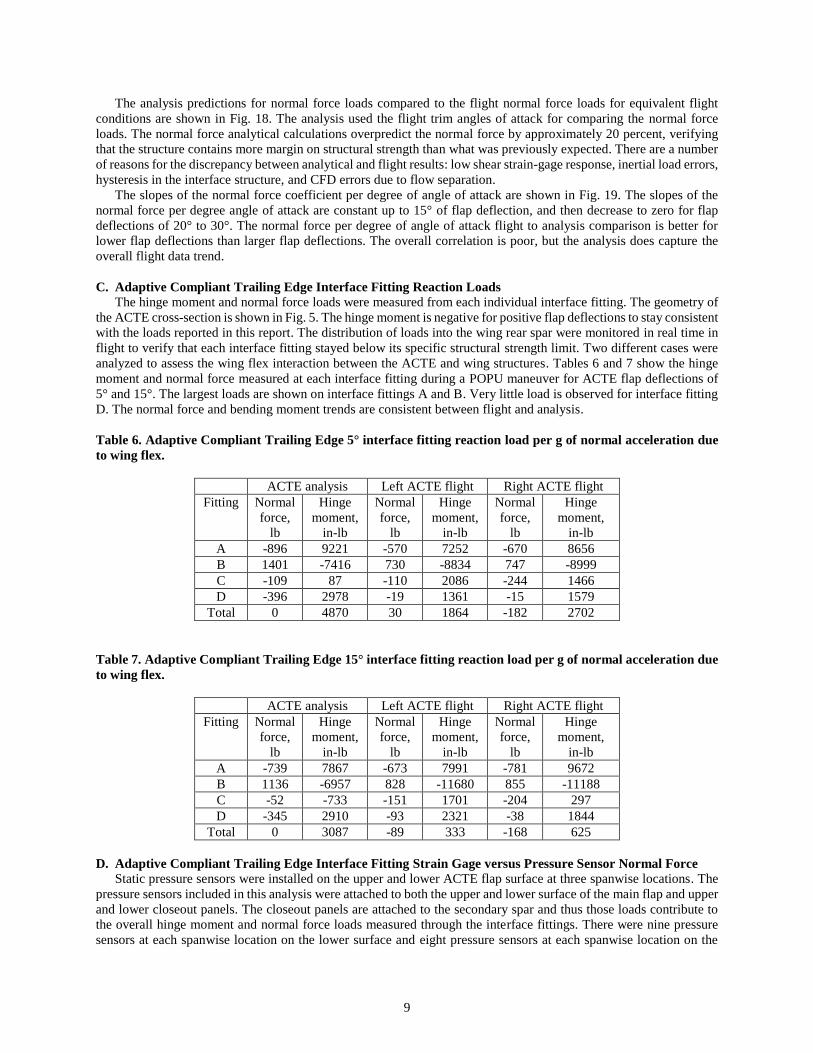
The four interface fittings on each wing were instrumented with metallic foil strain gages and calibrated separately
in a ground-test fixture in the Armstrong Flight Loads Laboratory (FLL).7 The load calibration methods utilized for
this project are consistent with proven methods used on past projects at AFRC. 8,9 The shear bridges are Vishay
CEA-06-250US-350 strain gages (Vishay Intertechnology, Inc., Malvern, Pennsylvania; specifically,
Micro-Measurements, Raleigh, North Carolina) and are located on the interface fitting web. Two tee rosettes were
placed on the top and bottom flanges of each interface fitting to comprise the axial and bending bridge response. The
tee rosettes are Vishay part number WK-06-125TB-10C/W strain gages. Each pair of rosettes (top and bottom)
was configured in a full bridge configuration. The bending gages are Vishay part number WK-06-125PC-10C/W.
A four-active-arm Wheatstone bridge configuration was chosen for all sensors to minimize thermal effects.10
Figure 6 shows the instrumented wing interface fittings A (left) and B (right).
The orientation and locations of the strain gages were determined based on finite element method (FEM) strain
predictions in the interface fittings in order to give an adequate calibration result. The center of each shear bridge was
located on the neutral axis of each interface fitting and oriented perpendicular to or parallel with a nearby flange for
ease of installation. The tee rosettes and linear pattern gages were aligned on center, with the shear gage on the inside
of the upper and lower flanges. The gages were installed on the inner flanges to protect them from abuse during
installation and actuation of the flap. The strain-gage bridge locations were selected on each interface fitting to avoid
fillets and geometry that could hinder the strain response of the bridge.
The interface fitting surface was prepared by baking it for 1 hr at 275 °F. The adhesive M-Bond 600
(Micro-Measurements) was used and was cured for 2 hr. The sealants M COAT-A (Micro-Measurements) and
M COAT-D (Micro-Measurements) were applied, followed by a final coat of MIL-S-8802 sealant to protect the strain
gage from the environment. Interbridge wiring was 32-gauge. Shielded four-conductor aircraft wire was used for the
leadwire from the solder tabs to the Teletronics Technology Corporation (TTC) (Newtown, Pennsylvania) boxes.
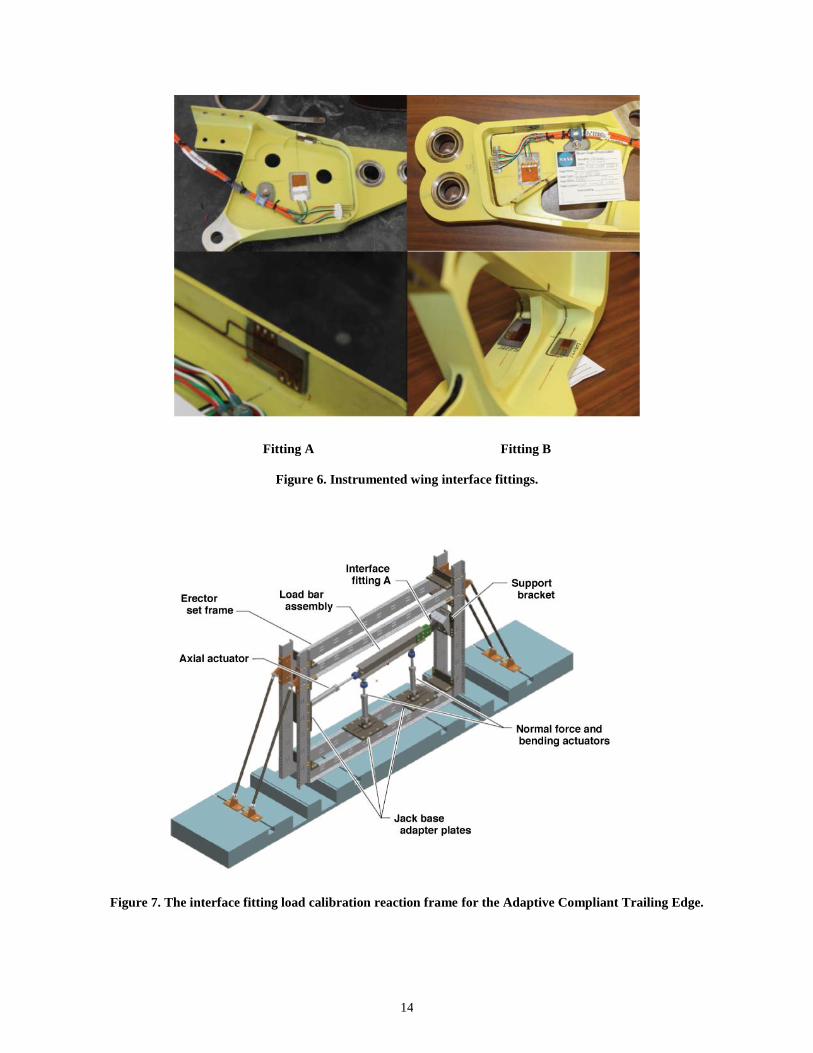
The ACTE project team decided to design a dedicated load fixture for calibration of the wing interface fittings.
Hinge moment, normal force, and axial loads were applied to each fitting to derive acceptable normal force and hinge
moment equations. The applied loads were scaled depending on the structural limits of each interface fitting. The
interface fitting load calibration reaction frame is shown in Fig. 7. Three hydraulic actuators were used to apply the
calibration loads. A total of 21 separate load cases were applied to each fitting. A subset of the load cases was used
for deriving load equations, while a few cases were excluded from the calibration set and used for validation of the
derived load equations. The BALFIT11 software tool, developed at the NASA Ames Research Center (Moffett Field,
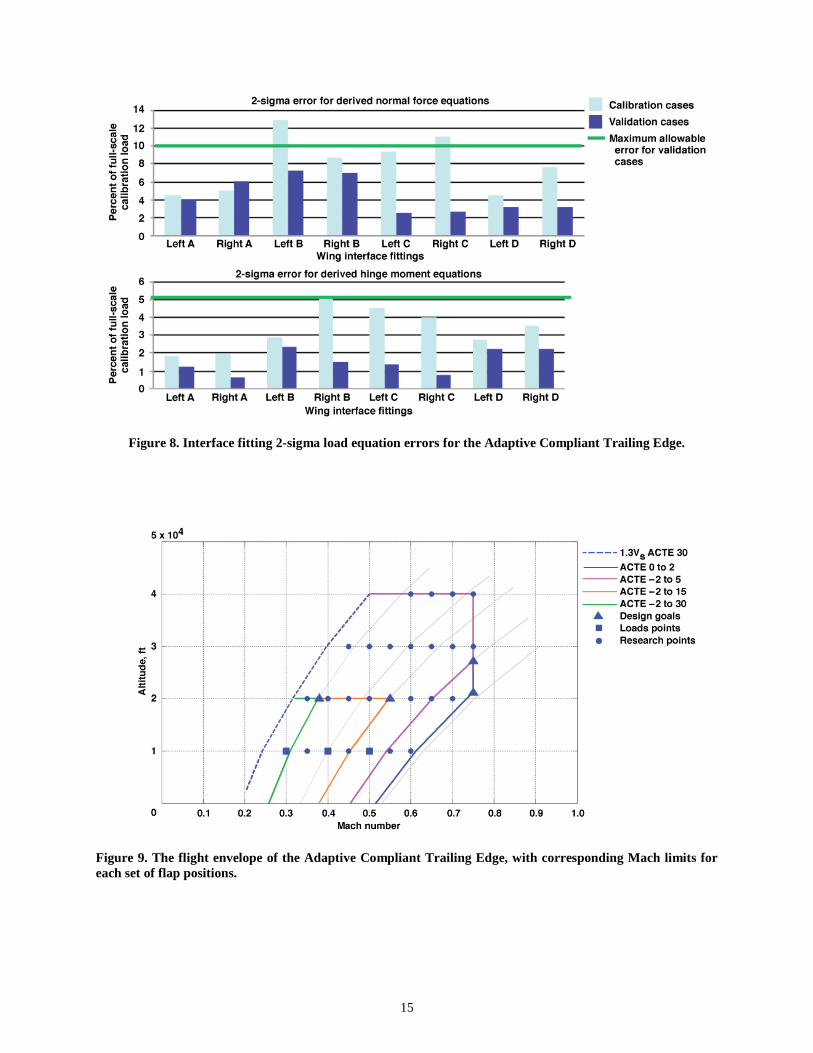
California), was utilized to determine which mathematical model coefficient to use for the calibration. The 2-sigma
5
errors for each fitting are shown in Fig. 8. Both the calibration set and validation errors are shown. The goal of the
calibration was to obtain normal force errors under 10 percent and hinge moment errors under 5 percent for
the validation cases. These errors were determined based on previous experience with strain-gage calibrations. The
validation case 2-sigma residual errors for the hinge moment was calculated to be 2.4 percent, and for normal force
was calculated to be 7.3 percent.
The interface fitting strain-gage-derived load equations were zeroed once the fittings were installed onto the
airplane, but before the ACTE flap was installed to the fittings. The summation of the loads from the four interface
fittings recorded on the ground represented the total flap modification weight. The total flap modification weight
includes the ACTE structure, closeout panels, and installed instrumentation hardware. Once the ACTE was installed
onto the airplane, additional check cases were performed to assess the total flap loads. The check-loading tests made
use of shot bags and applied loads from an aircraft jack with an attached load pad. The total normal force error was
calculated to be under 10 percent and the total bending or hinge moment load was calculated to be under 5 percent.
The SCRAT airplane instrumentation system collects data from sensors positioned throughout the airplane. The
data are recorded onboard and transmitted to the ground for real-time monitoring in the control room. The airplane
instrumentation system has 16-bit resolution, allowing adequate range and resolution in the measurements. The
instrumentation system is configured for monitoring approximately 6000 parameters at a range of 1 to 20,000 samples
per second. The interface fitting loads will be monitored at 500 samples per second to collect any dynamic response
in the structure. Previous wing strain-gage data recorded during the SCRAT baseline flights show minimal noise.
Flight condition information in addition to the strain-gage and pressure-port-sensor data were collected at each flight
condition. The measurement errors in the flight condition data propagate into the flight data hinge moment and normal
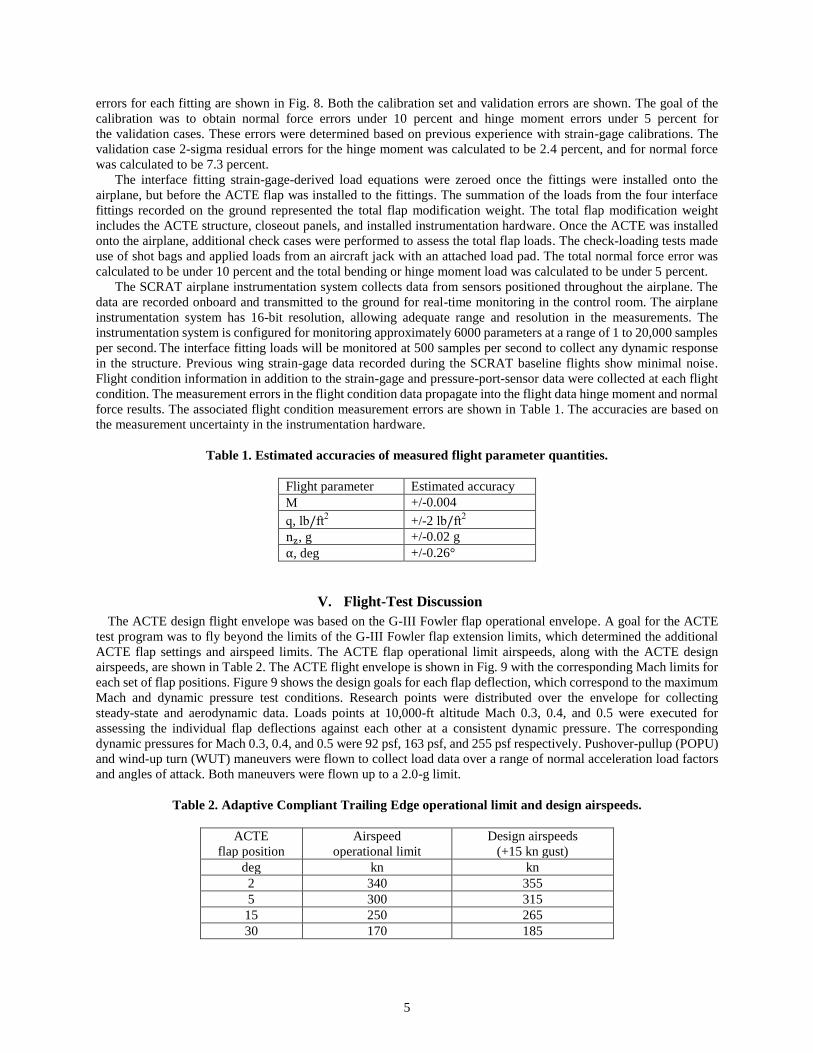
force results. The associated flight condition measurement errors are shown in Table 1. The accuracies are based on
the measurement uncertainty in the instrumentation hardware.
Table 1. Estimated accuracies of measured flight parameter quantities.
Flight parameter Estimated accuracy
M +/-0.004
q, lb/ft2 +/-2 lb/ft
2
nz, g +/-0.02 g
α, deg +/-0.26°
V. Flight-Test Discussion
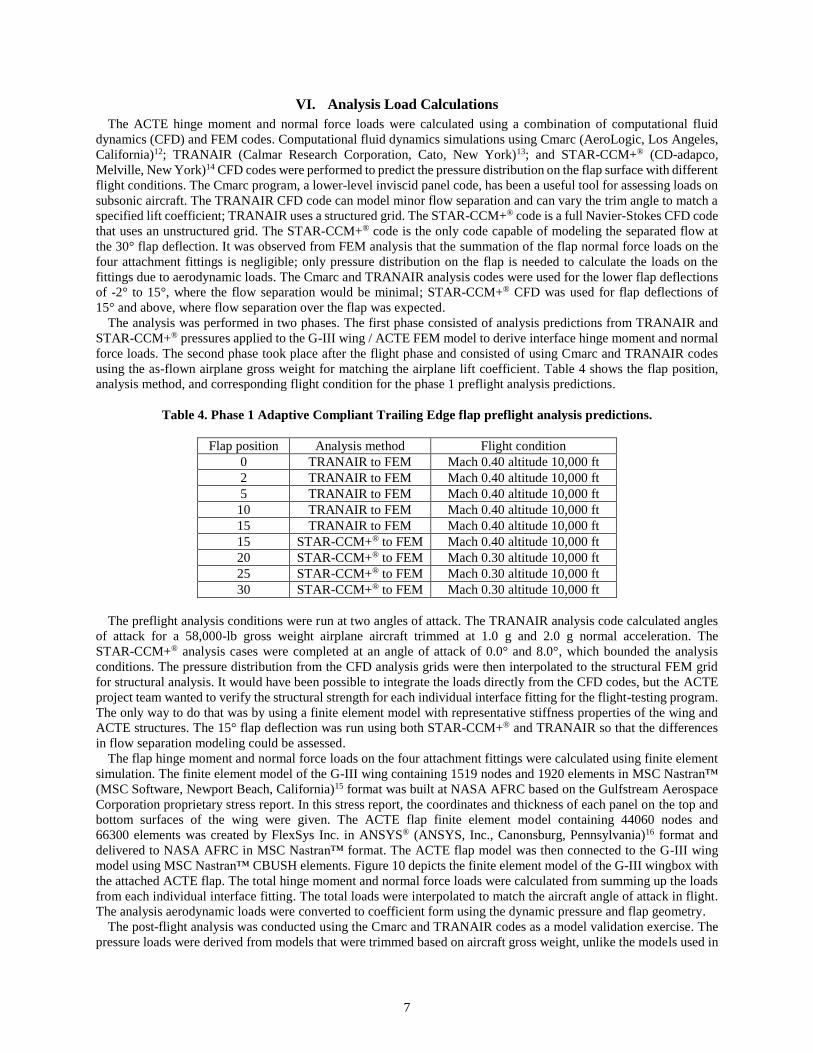
The ACTE design flight envelope was based on the G-III Fowler flap operational envelope. A goal for the ACTE
test program was to fly beyond the limits of the G-III Fowler flap extension limits, which determined the additional
ACTE flap settings and airspeed limits. The ACTE flap operational limit airspeeds, along with the ACTE design
airspeeds, are shown in Table 2. The ACTE flight envelope is shown in Fig. 9 with the corresponding Mach limits for
each set of flap positions. Figure 9 shows the design goals for each flap deflection, which correspond to the maximum
Mach and dynamic pressure test conditions. Research points were distributed over the envelope for collecting
steady-state and aerodynamic data. Loads points at 10,000-ft altitude Mach 0.3, 0.4, and 0.5 were executed for
assessing the individual flap deflections against each other at a consistent dynamic pressure. The corresponding
dynamic pressures for Mach 0.3, 0.4, and 0.5 were 92 psf, 163 psf, and 255 psf respectively. Pushover-pullup (POPU)
and wind-up turn (WUT) maneuvers were flown to collect load data over a range of normal acceleration load factors
and angles of attack. Both maneuvers were flown up to a 2.0-g limit.
Table 2. Adaptive Compliant Trailing Edge operational limit and design airspeeds.
ACTE
flap position
Airspeed
operational limit
Design airspeeds
(+15 kn gust)
deg kn kn
2 340 355
5 300 315
15 250 265
30 170 185

6
Although the ACTE structure was designed for a flap deflection range up to +40° down, the flight demonstration
was held to a maximum deflection of +30° because the flap would be exposed to fully-separated flow at that point,
negating any additional benefit of collecting additional aerodynamic data. The up-flap deflections were capable of
-9° but were limited to -2° due to the takeoff restrictions of the G-III. Research test points were distributed over the
envelope for collecting steady-state trim points and maneuvering data for each flap deflection.
The ACTE flaps were flown to a maximum airspeed of 340 knots calibrated airspeed (KCAS) and Mach .75. The
altitude was limited to 40,000 ft to minimize testing requirements. The stall limit was based on flap setting and airplane
gross weight. A range of maneuvers were flown at each test point, including doublets and raps in all three axes,
pushover-pullups and wind-up turns. The airplane was limited to a normal acceleration of 0g to 2.0g.
The flap total normal force and total hinge moment loads were a summation of the loads at the four attachment
fittings. The hinge moment and normal force loads recorded during flight represent a net load that includes
aerodynamic and inertial loads. The total aerodynamic loads were converted to coefficient form using the dynamic
pressure, q, flap surface area, Sf, and flap chord, cf. The inertial loads were developed from the total flap modification
weight, Wf, flap center of gravity, cgf, and aircraft normal acceleration, nz. The approach taken in this paper
for correcting the measured net flap hinge moment and normal force loads for inertial load effects is shown in
Eqs. 1 and 2.
Chf= (Hf + nzWfcgf)/qSfcf (1)
CNf= (Nf + nzWf)/qSf (2)
The loads from both left and right flaps were assessed for trends and compared to analysis. The loads overall were
consistent for both flaps. The average of both flaps appeared to smooth the data. The hinge moment and normal force
loads are only shown for the right flap for all data figures. All flight conditions shown in this report are contained in
Table 3.
Table 3. Adaptive Complaint Trailing Edge flight conditions.
ACTE setting Mach Altitude, ft
-2 0.30, 0.40, 0.50 10,000
-2 0.65 20,000
0 0.30, 0.40, 0.50, 0.60 10,000
0 0.75 21,200
2 0.30, 0.40, 0.50, 0.60 10,000
2 0.75 21,200
5 0.30, 0.40, 0.50 10,000
5 0.75 30,000
5 0.65 20,000
10 0.30, 0.40 10,000
10 0.55 20,000
12.5 0.40 10,000
12.5 0.55 20,000
15 0.30, .40 10,000
15 0.55 20,000
17.5 0.30 10,000
17.5 0.38 20,000
20 0.30 10,000
20 0.38 20,000
25 0.30 10,000
25 0.38 20,000
30 0.30 10,000
30 0.38 20,000
7
VI. Analysis Load Calculations
The ACTE hinge moment and normal force loads were calculated using a combination of computational fluid
dynamics (CFD) and FEM codes. Computational fluid dynamics simulations using Cmarc (AeroLogic, Los Angeles,
California)12; TRANAIR (Calmar Research Corporation, Cato, New York)13; and STAR-CCM+® (CD-adapco,
Melville, New York)14 CFD codes were performed to predict the pressure distribution on the flap surface with different
flight conditions. The Cmarc program, a lower-level inviscid panel code, has been a useful tool for assessing loads on
subsonic aircraft. The TRANAIR CFD code can model minor flow separation and can vary the trim angle to match a
specified lift coefficient; TRANAIR uses a structured grid. The STAR-CCM+® code is a full Navier-Stokes CFD code
that uses an unstructured grid. The STAR-CCM+® code is the only code capable of modeling the separated flow at
the 30° flap deflection. It was observed from FEM analysis that the summation of the flap normal force loads on the
four attachment fittings is negligible; only pressure distribution on the flap is needed to calculate the loads on the
fittings due to aerodynamic loads. The Cmarc and TRANAIR analysis codes were used for the lower flap deflections
of -2° to 15°, where the flow separation would be minimal; STAR-CCM+® CFD was used for flap deflections of
15° and above, where flow separation over the flap was expected.
The analysis was performed in two phases. The first phase consisted of analysis predictions from TRANAIR and
STAR-CCM+® pressures applied to the G-III wing / ACTE FEM model to derive interface hinge moment and normal
force loads. The second phase took place after the flight phase and consisted of using Cmarc and TRANAIR codes
using the as-flown airplane gross weight for matching the airplane lift coefficient. Table 4 shows the flap position,
analysis method, and corresponding flight condition for the phase 1 preflight analysis predictions.
Table 4. Phase 1 Adaptive Compliant Trailing Edge flap preflight analysis predictions.
Flap position Analysis method Flight condition
0 TRANAIR to FEM Mach 0.40 altitude 10,000 ft
2 TRANAIR to FEM Mach 0.40 altitude 10,000 ft
5 TRANAIR to FEM Mach 0.40 altitude 10,000 ft
10 TRANAIR to FEM Mach 0.40 altitude 10,000 ft
15 TRANAIR to FEM Mach 0.40 altitude 10,000 ft
15 STAR-CCM+® to FEM Mach 0.40 altitude 10,000 ft
20 STAR-CCM+® to FEM Mach 0.30 altitude 10,000 ft
25 STAR-CCM+® to FEM Mach 0.30 altitude 10,000 ft
30 STAR-CCM+® to FEM Mach 0.30 altitude 10,000 ft
The preflight analysis conditions were run at two angles of attack. The TRANAIR analysis code calculated angles
of attack for a 58,000-lb gross weight airplane aircraft trimmed at 1.0 g and 2.0 g normal acceleration. The
STAR-CCM+® analysis cases were completed at an angle of attack of 0.0° and 8.0°, which bounded the analysis
conditions. The pressure distribution from the CFD analysis grids were then interpolated to the structural FEM grid
for structural analysis. It would have been possible to integrate the loads directly from the CFD codes, but the ACTE
project team wanted to verify the structural strength for each individual interface fitting for the flight-testing program.
The only way to do that was by using a finite element model with representative stiffness properties of the wing and
ACTE structures. The 15° flap deflection was run using both STAR-CCM+® and TRANAIR so that the differences
in flow separation modeling could be assessed.
The flap hinge moment and normal force loads on the four attachment fittings were calculated using finite element
simulation. The finite element model of the G-III wing containing 1519 nodes and 1920 elements in MSC Nastran™
(MSC Software, Newport Beach, California)15 format was built at NASA AFRC based on the Gulfstream Aerospace
Corporation proprietary stress report. In this stress report, the coordinates and thickness of each panel on the top and
bottom surfaces of the wing were given. The ACTE flap finite element model containing 44060 nodes and
66300 elements was created by FlexSys Inc. in ANSYS® (ANSYS, Inc., Canonsburg, Pennsylvania)16 format and
delivered to NASA AFRC in MSC Nastran™ format. The ACTE flap model was then connected to the G-III wing
model using MSC Nastran™ CBUSH elements. Figure 10 depicts the finite element model of the G-III wingbox with
the attached ACTE flap. The total hinge moment and normal force loads were calculated from summing up the loads
from each individual interface fitting. The total loads were interpolated to match the aircraft angle of attack in flight.
The analysis aerodynamic loads were converted to coefficient form using the dynamic pressure and flap geometry.
The post-flight analysis was conducted using the Cmarc and TRANAIR codes as a model validation exercise. The
pressure loads were derived from models that were trimmed based on aircraft gross weight, unlike the models used in

8
the first phase that were trimmed to a maximum aircraft gross weight. Table 5 shows the flap position, analysis code,
and corresponding flight condition for the phase 2 post-flight analysis correlation. No FEM model was used for phase
2. The pressures on the surface of the model were integrated together to calculate the interface hinge and normal force
loads on the flap.
Table 5. Phase 2 Adaptive Compliant Trailing Edge flap post-flight analysis cases.
Flap position Analysis code Flight condition
0 TRANAIR and Cmarc Mach 0.30 altitude 10,000 ft
0 TRANAIR and Cmarc Mach 0.40 altitude 10,000 ft
0 TRANAIR and Cmarc Mach 0.50 altitude 10,000 ft
5 TRANAIR and Cmarc Mach 0.30 altitude 10,000 ft
5 TRANAIR and Cmarc Mach 0.40 altitude 10,000 ft
5 TRANAIR and Cmarc Mach 0.50 altitude 10,000 ft
15 TRANAIR and Cmarc Mach 0.30 altitude 10,000 ft
15 TRANAIR and Cmarc Mach 0.40 altitude 10,000 ft
15 TRANAIR and Cmarc Mach 0.50 altitude 20,000 ft
VII. Results and Discussion
A. Adaptive Compliant Trailing Edge Interface Hinge Moment
The flap interface hinge moment loads were collected over a flap range of -2° to +30°. The hinge moment loads
are plotted against angle of attack in Fig. 11. A least-squares fit line is shown for each flap deflection. The data were
taken from WUT and POPU maneuvers. The hinge moment coefficient reaches maximum at approximately -.45 for a
30° flap deflection. The hinge moment data are taken from test conditions at Mach numbers 0.3 and 0.4 and an altitude
of 10,000 ft. The hinge moment coefficient is plotted versus ACTE flap deflection in Fig. 12 for four different angles
of attack. The data from figure 11 were extrapolated to the angles of attack of -4° and +8° to create Fig. 12. It is
important to point out that there is very little load buildup during maneuvers as compared to the load increment
increase encountered during increases in flap deflection and airspeed. The slopes of the hinge moment loads plotted
in Fig. 11 change sign at a flap deflection of 17° due to flow separation over the flap; this phenomenon is highlighted
clearly by the intersection of loads in Fig. 12.
The analysis predictions for hinge moment loads compared to the flight hinge moment loads for equivalent flight
conditions are shown in Fig. 13. The analysis used the flight trim angles of attack for comparing the hinge moment
loads. The analytical calculations for hinge moment from phase 1 at the intermediate flap angles of 10° and 15°
overpredicted the loads compared to the flight hinge moment loads predicted from phase 2. The difference is for the
most part attributed to the methods used for interpolating the pressures to the FEM model and integration of the loads.
This result is good from a structural design standpoint in that the structure has extra margin built into it because the
load prediction was conservative. The phase 2 results show a slightly better correlation to the flight results than do the
result from phase 1, which could be attributed to an improved matching of aircraft gross weight and lift coefficient
post-flight. No FEM model was used, which eliminates one additional source of error that was introduced during the
first phase. Figure 14 shows a plot of the hinge moment per degree of angle of attack for analysis conditions and
equivalent flight conditions. The agreement overall is adequate given the low load response observed during the
maneuver.
Additional hinge moment coefficients were calculated at the additional anchor points and maximum Mach number
and dynamic pressures for each flap deflection; those results are plotted in Fig. 15. The higher flap deflections have a
smaller envelope and less scatter should be expected in those results.
B. Adaptive Compliant Trailing Edge Interface Normal force
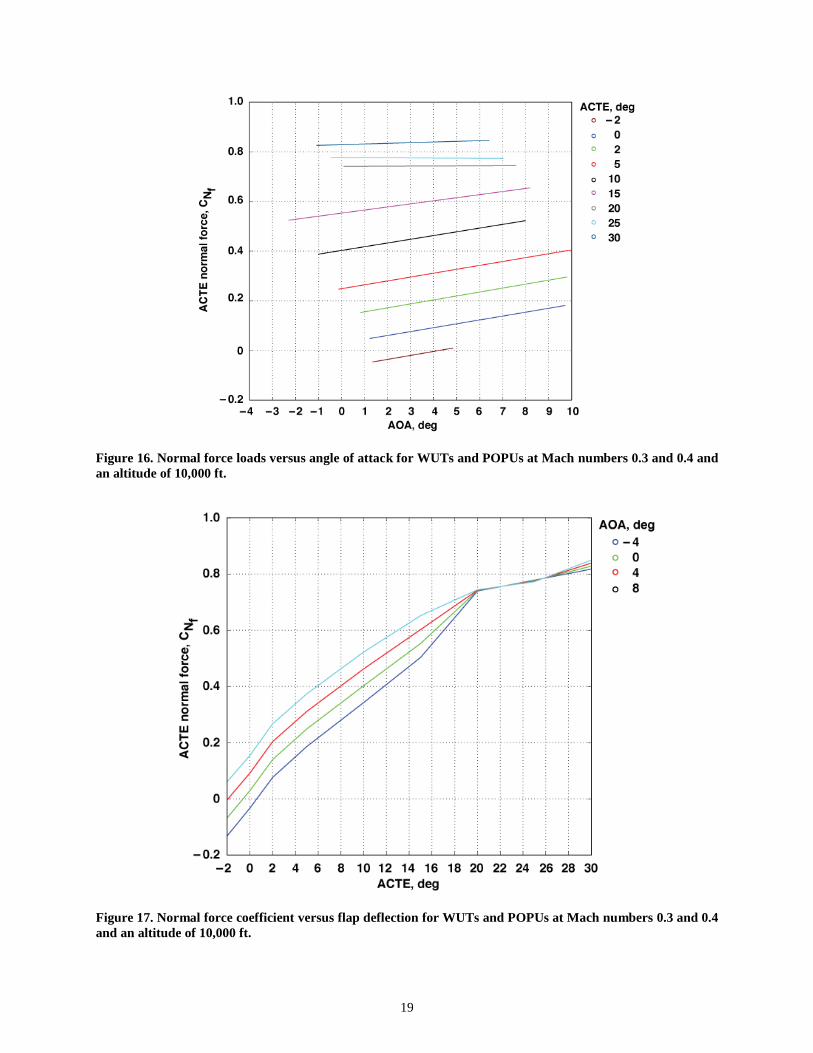
The flap interface normal force loads were collected over a flap range of -2° to +30°. The normal force loads are
plotted against angle of attack in Fig. 16. The normal force coefficient reaches maximum at approximately .85 for a
flap deflection of 30°. The normal force data are taken from test conditions at Mach numbers 0.3 and 0.4 and an
altitude of 10,000 ft. The normal force coefficient is plotted versus ACTE flap deflection in Fig. 17 for four different
angles of attack. Very similar trends as observed in the hinge moment data are observed for the normal force loads in
flight. Just as was observed within the hinge moment results, there is very little normal force load buildup during
maneuvers as compared to the load increment increase encountered during increases in flap deflection and airspeed.
9
The analysis predictions for normal force loads compared to the flight normal force loads for equivalent flight
conditions are shown in Fig. 18. The analysis used the flight trim angles of attack for comparing the normal force
loads. The normal force analytical calculations overpredict the normal force by approximately 20 percent, verifying
that the structure contains more margin on structural strength than what was previously expected. There are a number
of reasons for the discrepancy between analytical and flight results: low shear strain-gage response, inertial load errors,
hysteresis in the interface structure, and CFD errors due to flow separation.
The slopes of the normal force coefficient per degree of angle of attack are shown in Fig. 19. The slopes of the
normal force per degree angle of attack are constant up to 15° of flap deflection, and then decrease to zero for flap
deflections of 20° to 30°. The normal force per degree of angle of attack flight to analysis comparison is better for
lower flap deflections than larger flap deflections. The overall correlation is poor, but the analysis does capture the
overall flight data trend.
C. Adaptive Compliant Trailing Edge Interface Fitting Reaction Loads The hinge moment and normal force loads were measured from each individual interface fitting. The geometry of
the ACTE cross-section is shown in Fig. 5. The hinge moment is negative for positive flap deflections to stay consistent
with the loads reported in this report. The distribution of loads into the wing rear spar were monitored in real time in
flight to verify that each interface fitting stayed below its specific structural strength limit. Two different cases were
analyzed to assess the wing flex interaction between the ACTE and wing structures. Tables 6 and 7 show the hinge
moment and normal force measured at each interface fitting during a POPU maneuver for ACTE flap deflections of
5° and 15°. The largest loads are shown on interface fittings A and B. Very little load is observed for interface fitting
D. The normal force and bending moment trends are consistent between flight and analysis.
Table 6. Adaptive Compliant Trailing Edge 5° interface fitting reaction load per g of normal acceleration due
to wing flex.
ACTE analysis Left ACTE flight Right ACTE flight
Fitting Normal
force,
lb
Hinge
moment,
in-lb
Normal
force,
lb
Hinge
moment,
in-lb
Normal
force,
lb
Hinge
moment,
in-lb
A -896 9221 -570 7252 -670 8656
B 1401 -7416 730 -8834 747 -8999
C -109 87 -110 2086 -244 1466
D -396 2978 -19 1361 -15 1579
Total 0 4870 30 1864 -182 2702
Table 7. Adaptive Compliant Trailing Edge 15° interface fitting reaction load per g of normal acceleration due
to wing flex.
ACTE analysis Left ACTE flight Right ACTE flight
Fitting Normal
force,
lb
Hinge
moment,
in-lb
Normal
force,
lb
Hinge
moment,
in-lb
Normal
force,
lb
Hinge
moment,
in-lb
A -739 7867 -673 7991 -781 9672
B 1136 -6957 828 -11680 855 -11188
C -52 -733 -151 1701 -204 297
D -345 2910 -93 2321 -38 1844
Total 0 3087 -89 333 -168 625
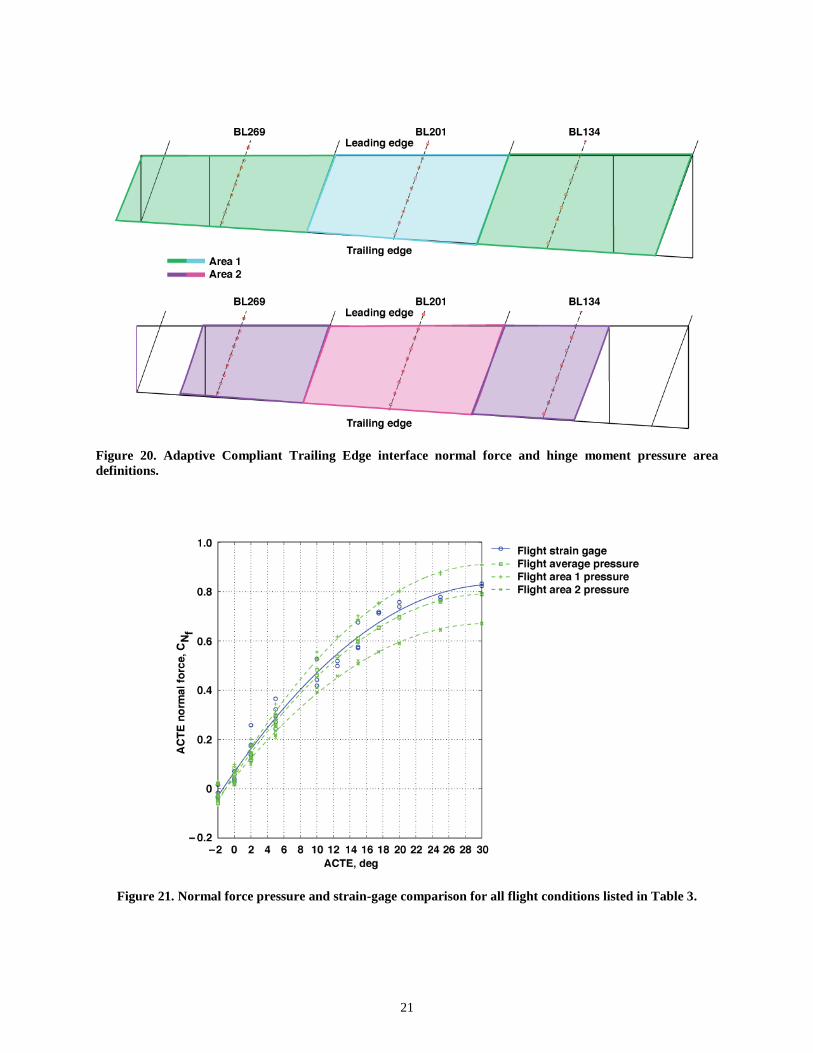
D. Adaptive Compliant Trailing Edge Interface Fitting Strain Gage versus Pressure Sensor Normal Force Static pressure sensors were installed on the upper and lower ACTE flap surface at three spanwise locations. The
pressure sensors included in this analysis were attached to both the upper and lower surface of the main flap and upper
and lower closeout panels. The closeout panels are attached to the secondary spar and thus those loads contribute to
the overall hinge moment and normal force loads measured through the interface fittings. There were nine pressure
sensors at each spanwise location on the lower surface and eight pressure sensors at each spanwise location on the

10
upper surface. Each strip of sensors was multiplied by its corresponding area, dynamic pressure, and the vertical
component of the normal surface vector. The loads at each upper and lower surface strip were multiplied by a spanwise
length. Two specific flap geometries were used to average the normal force load to account for the loss of load in the
transition sections. The two areas are shown in Fig. 20, where Area 1 represents the loads as if the entire flap surface
(including transition surfaces) were generating a uniform pressure, and Area 2 represents the loads as if only the main
flap is generating load. The average of the pressure surface load was converted to coefficient form using the same
values used for converting the strain-gage loads to coefficients.
The comparison of strain-gage bridge normal force coefficient and the load from the pressure sensors are shown
in Fig. 21. The integrated loads from Area 1 and Area 2 bound the flight data normal force. The integrated pressures
along with the strain-gage normal force are plotted along with the CFD analysis normal force in Fig. 22. The CFD is
predicting a normal force greater than the load produced from Area 1. This is representative of what is observed from
looking at the flap pressure coefficient (Cp) butt line (BL) plots comparisons.
The comparison of strain-gage bridge hinge moment coefficient and the load from the pressure sensors are shown
in Fig. 23. The integrated loads from Area 1 and Area 2 bound the flight data hinge moment. The integrated pressures
along with the strain-gage hinge moment are plotted along with the CFD analysis hinge moment in Fig. 24. The CFD
is predicting a hinge moment that compares better to the flight data than that predicted for the normal force. It is
observed for both the normal force and hinge moment comparisons that the strain-gage loads are larger than the
averaged pressure sensor loads. The calculation of the average pressure sensor loads could be biased to better match
the strain-gage loads for future flight load measurement efforts.
VIII. Conclusions
The hinge moment and normal force loads collected from a seamless adaptive compliant trailing edge (ACTE) flap
in flight have been presented. The flap was fixed on the ground and flown between flap deflections of -2° to +30° over
a range of flight conditions. The ACTE interface structure geometry, instrumentation layout, calibration test design,
and analysis procedures were discussed. Steady state and symmetric pitch maneuvers were conducted at analysis
points and at maximum allowable dynamic pressure points to capture the hinge moment and normal force loads on
the ACTE flap. Comparisons with analytical predictions were shown. The following conclusions were drawn from
this work:
The ACTE technology on the GIII SCRAT was not optimized for maximum aerodynamic load benefit, it
was mainly a structural demonstration project, but future clean sheet designs will be able tailor the
structure for maximum aerodynamic load advantage.
The hinge moment and normal force loads generated at ACTE flap positions above 15° plateaued due to
flow separation and were lower than the loads generated by a typical Fowler flap that creates a gap in the
structure for energizing the flow over the flap.
The interface fittings in general do not lend themselves to ample bridge response given the large design
factors of safety and the short, stubby nature of the flight fittings, but the resulting flight data were
sufficient for flight monitoring and analysis comparisons.
The Cmarc panel code and TRANAIR code produced identical results for flap positions up to 15° where
flow separation was observed.
Cmarc is a time efficient CFD code as compared to TRANAIR, thus future work will make use of the
Cmarc code more significantly for flap positions up to 15°.
The extensive flow separation at flap positions above 15° require the use of a full Navier-Stokes CFD
code such as StarCCM+.
Normal forces and hinge moment loads were overpredicted by the analysis, confirming that the interface
structure maintained additional margin in structural strength.
The analysis-predicted interface reaction loads compare reasonably well to the reaction loads observed in
flight, validating the finite element models used for calculating the individual interface fitting reaction
loads.
Normal force and hinge moment loads measured from the static pressure sensors located on the flap
surface compared well to the calibrated strain-gage loads and can provide additional insight into the
external air loads acting on the flap.
The ACTE interface loads into the wing were successfully monitored in real time in flight, allowing the safe
expansion of the ACTE flight envelope. The work presented in this paper is a first step in assessing the performance
of the ACTE technology and validating the tools required for predicting the in-flight loads.

11
Acknowledgements
The authors gratefully acknowledge the work performed by Andrew Holguin in planning and executing the load
calibration of the interface fittings. The authors also acknowledge Christian Garcia for providing the STAR-CCM+®
CFD solutions and Aliyah Ali for providing the flap pressure coefficient (Cp) flight pressure data. The work from
Christine Olson in calculating loads from the Cp data is also greatly appreciated. As well, the authors extend thanks
to everyone in the Flight Loads Laboratory who assisted with the ACTE instrumentation installation and calibration
of the interface fittings.
References 1Baumann, E., Hernandez, J., and Ruhf, J., “An Overview of NASA’s SubsoniC Research Aircraft Testbed (SCRAT),”
AIAA-2013-5083, 2013. 2Miller, E. J., Lokos, W. A., Cruz, J., Crampton, G., Stephens, C. A., Kota, S., Ervin, G., and Flick, P., “Approach for
Structurally Clearing an Adaptive Compliant Trailing Edge Flap for Flight,” 46th Society of Flight Test Engineers (SFTE)
International Symposium, Lancaster, California, 2015. 3Kota, S., Osborn, R., Ervin, G., Maric, D., Flick, P., and Paul, D., “Mission Adaptive Compliant Wing – Design, Fabrication
and Flight Test,” RTO-MP-AVT-168, 2009. 4Gilyard, G., and Espana, M., “On the Use of Controls for Subsonic Transport Performance Improvement: Overview and Future
Directions,” NASA TM-4605, 1994. 5Kota, S., “Shape-Shifting Things to Come,” Scientific American, May 2014, pp. 58-65. 6Hetrick, J. A., Osborn, R. F., Kota, S., Flick, P. M., and Paul, D. B., “Flight Testing of Mission Adaptive Compliant Wing,”
AIAA 2007-1709, 2007. 7Miller, E. J., Holguin, A. C., Cruz, J., and Lokos, W. A., “Strain Gage Load Calibration of the Wing Interface Fittings for the
Adaptive Compliant Trailing Edge Flap Flight Test,” AIAA-2017-0277, 2014. 8Skopinski, T. H, Aiken, W. S. Jr., and Huston, W. B., “Calibration of Strain-Gage Installations in Aircraft Structures for the
Measurement of Flight Loads,” NACA Report 1178, 1954. 9Jenkins, J. M., and DeAngelis, V. M., “A Summary of Numerous Strain-Gage Load Calibrations on Aircraft Wings and Tails
in a Technological Format,” NASA TM-4804, 1997. 10Murray, W. M, and Miller, W. R., The Bonded Electrical Resistance Strain Gage, an Introduction, Oxford University Press,
New York, 1992, pp. 337-359. 11Ulbrich, N., and Volden, T., “Development of a New Software Tool for Balance Calibration Analysis,” AIAA-2006-3434,
2006. 12Cmarc Personal Simulation Works, http://www.aerologic.com/cmarc [cited 2 November 2015]. 13TRANAIR++, CALMAR Research Corporation, http://www.calmarresearch.com/NF/STG/Tranair/Tranair.htm
[cited 2 November 2015]. 14STAR-CCM+®, CD-adapco, http://www.cd-adapco.com [cited 2 November 2015]. 15MSC Nastran, MSC Software Corporation, http://www.mscsoftware.com/product/msc-nastran [cited 2 November 2015]. 16ANSYS, ANSYS, Inc., http://www.ansys.com/?gclid=CNic5Cb13cYCFYM9aQodmP8MRA [cited 2 November 2015].

12
FIGURES
Figure 1. The Adaptive Compliant Trailing Edge flaps installed on the Gulfstream III SubsoniC Research
Aircraft Testbed at a flap deflection of 20°.
Figure 2. Example of a compliant iris mechanism.
Figure 3. The primary components of the Adaptive Compliant Trailing Edge structure.

13
Figure 4. The interface attachment structure of the Adaptive Compliant Trailing Edge.
Figure 5. The interface fittings and hinge moment and normal force load coordinates of the Adaptive Compliant
Trailing Edge structure.
14
Fitting A Fitting B
Figure 6. Instrumented wing interface fittings.
Figure 7. The interface fitting load calibration reaction frame for the Adaptive Compliant Trailing Edge.
15
Figure 8. Interface fitting 2-sigma load equation errors for the Adaptive Compliant Trailing Edge.
Figure 9. The flight envelope of the Adaptive Compliant Trailing Edge, with corresponding Mach limits for
each set of flap positions.

16
Figure 10. The finite element model of the Gulfstream III wingbox and the ACTE.
Figure 11. Flap interface hinge moment loads versus angle of attack for WUTs and POPUs at Mach numbers
0.3 and 0.4 and an altitude of 10,000 ft.

17
Figure 12. Hinge moment coefficient versus Adaptive Compliant Trailing Edge flap deflection for four different
angles of attack.
Figure 13. Analysis predictions for hinge moment loads versus flight hinge moment loads for equivalent flight
conditions.

18
Figure 14. Hinge moment per degree of angle of attack for analysis conditions and equivalent flight conditions.
Figure 15. Hinge moment coefficient versus flap deflection comparison with analysis for all conditions listed in
Table 3.
19
Figure 16. Normal force loads versus angle of attack for WUTs and POPUs at Mach numbers 0.3 and 0.4 and
an altitude of 10,000 ft.
Figure 17. Normal force coefficient versus flap deflection for WUTs and POPUs at Mach numbers 0.3 and 0.4
and an altitude of 10,000 ft.

20
Figure 18. Normal force loads versus deflection comparison with analysis for all conditions listed in Table 3.
Figure 19. Slopes of the normal force coefficient per degree of angle of attack for WUTs and POPUs at Mach
numbers 0.3 and 0.4 and an altitude of 10,000 ft.
21
Figure 20. Adaptive Compliant Trailing Edge interface normal force and hinge moment pressure area
definitions.
Figure 21. Normal force pressure and strain-gage comparison for all flight conditions listed in Table 3.

22
Figure 22. Normal force pressure and strain-gage comparison with analysis for all flight conditions listed in
Table 3.
Figure 23. Hinge moment pressure and strain-gage comparison for all flight conditions listed in Table 3.

23
Figure 24. Hinge moment pressure and strain-gage comparison with analysis for all flight conditions listed in
Table 3.