evaluation of the ia roe array lome-period · pdf filesap •ccrparisonu0f ki ... (703)...
TRANSCRIPT

puvt:]
EVALUATION OF THE IA ROE ARRAY LOme-PERIOD HETWORK
Htm men stwue 4/Mir Amnu tmnn
PvpruHucvd i »
NATIONAL TECHNICAL INFORMATION SERVICE
>piin<)ii«id. v« ;7i»i
ueutun n. wi
AIH mice rtcmcAi MPHICMTIOKS CIHTM WnUW*. O.C.
■a?r haltet ¥IIA UHIFOnH
AOVAMID HCStAKH MOJICTS A6EMY Hnltar Mmittimi Rnunh 0/fiet
AHM Otto Il:1i20
^TTELEOVNE GEOTECH AUXAmiA lABORATOmS
APM0¥10 FOH NilIC KllASl OlSTOItUmH UHUMITtO.
I

**»* a.™.,., * ' '* **""* "-"•* "*" ""*. t* »„ „n, r„Me„ A„Ha,„„ c,Mf>
Tix0M E

Ilnc-ln«t«;i fißcl S<curHy CUntflotton
DOCUMENT CONTROL DATA • R&D
I OWIOIM»TIMO AcfltflfV ffiigSS «yllUfJ
TELEDYNE GEOTECII ALEXANDRIA, VIRGINIA
I RI»MT TITLf
i* «IOOMT (icuaiT* ckMiinetfieV Unclassified
Ik oaoup
EVALUATION OF THE LARGE ARRAY LONG-PERIOD NETWORK
«UTNORm n.«V( Mm«. SnlMäw! iüSSSfJ
Mack, Harry
December 17, 1971
»■ VHOJICT NO
VELA T/1709
ARPA Order No. 1620 rfARPA Program Code No. 1F10
7« TOTAL NO. Or ■>*•(•
35 76. NO or ntw»
• • OniOINATOK-l niPoatT MUMtmrSi
** SJi'Slponl*0*'' t>0(" ^n»'oU'»">""»»'» «•> may »• •••(«)•«
IP « VAILAIILITV/LIMITATION NOTICES
APPROVED FOR PUBLIC RELEASE; DISTRIBUTION UNLIMITED.
II (UPPLCMCNTARV NOTCI I» «PONtORINO MILITAHV ACTIVITV
ADVANCED RESEARCH PROJECTS AGENCY NUCLEAR MONITORING RESEARCH OFFICE WASHINGTON. D. C.
It ABSTRACT
Rav^?ain™ f^ysfs of LASA long period data has shown that the S f8^ rieteCtl0n rate is ^uite Poor for event:s located to the south of the array and to be best for events from the north- SAP •CCrpariSOnu0f KIJrile earthquakes recorded by LASA and NORSAR indicates that the Rayleigh wave detection rates are
?omi nran3r^wntS rith b0dy Wave magnitudes greater than or equal
to .,0 and that surface waves from such small events are con- sisttntly detected. Preliminary studies of central Asian and western Soviet Union events recorded by any of the three laree arrays shows that surface waves are detected from earthquakes with body wave magnitudes of 4.0 but the data set is too incomplete as yet to establish a network threshold.
Al!^-1 ariy Processing technique is introduced which allows the detection and measurement of small amplitude Rayleigh waves.
I« KEY WORDS
Large Arrtiy Network Evaluati Large Array Network
on
L Unclassified
Security Classification

HVALUATION OF THE LARGE
ARRAY LONG-PERIOD NETWORK
SEISMIC ARRAY ANALYSIS CENTER No. 4
AFTAC Project Number:
Project Title:
ARPA Order No.:
ARPA Program Code No.!
VELA T/1709
Seismic Array Analysis Center
1620
1F10
Name of Contractor: TELEDYNE GEOTEC11
Contract No.:
Effective Date of Contract:
Amount of Contract:
Contract Expiration Date:
Project Manager:
F33657-71-C-0510
1 December 1970
$1,034,946
31 December 1971
Wm. C. Dean (703) 836-7647
P. Q. Box 334. Alexandria, Virginia
APPROVED FOR PUBLIC RELEASE; DISTRIBUTION UNLIMITED.
>

This research was supported by the Advanced Research
Projects Agency, Nuclear Monitoring Research Office, under
Project VELA-UNIFORM, and accomplished under the technical
direction of the Air Force Technical Applications Center
under Contract F33657-71-C-0510.
Neither the advanced Research Projects Agency nor the Air
Force Technical Applications Center will be responsible for
information contained herein which has been supplied by other
organizations or contractors, and this document is subject to
lacer revision as may be necessary. The views and conclusions
presented are those of the authors and should not be interpreted
as necessarily representing the official policies, either expressed
or implied, of the Advanced Research Projects Agency, the Air
Force Technical Applications Center, or the U S Government.
^

ABSTRACT
A continuous analysis of LASA long period data has
shown that the Rayleigh wave detection rate is quite
poor for events located to the south of the array and
to be best for events from the northwest, A comparison
of Kurile earthquakes recorded by LASA aid WORSAR
indicates that the Rayleigh wave detection rates are
similar for events with body wave magnitudes greater
than or equal to 4.0 and that surface waves from such
small events are consistently detected. Preliminary
studies of central Asian and western Soviet Union events
recorded by any of the three large arrays shows that
surface waves are detected from earthquakes with body
wave magnitudes of 4,0 but the data set is too
incomplete as yet to establish a network threshold,
A novel array processing technique is introduced
which allows the detection and measurement of small
amplitude Rayleigh waves.
izT

TABLE OF CONTENTS
Page No.
INTRODUCTION 1
CONTINUOUS ANALYSIS OF LASA LP DATA 2
ARRAY COMPARISONS 3
LASA-NORSAR 3
ALPA-NORSAR 5
THE NETWORK 7
SIGNAL PROCESSING DEVELOPMENTS 8
^

LIST OF FIGURES
Figure Title Figure No.
Location of regions used in LASA continuous analysis. 1
Raylcigh wave detections/non-detections for region 1. 2a
Rayleigh wave detections/non-detections for region 2. 2b
Rayleigh wave detections/non-detections for region 3. 2c
Rayleigh wave detections/non-detections for region 4. 2d
Rayleigh wave detections/non-detections for region 5. 2e
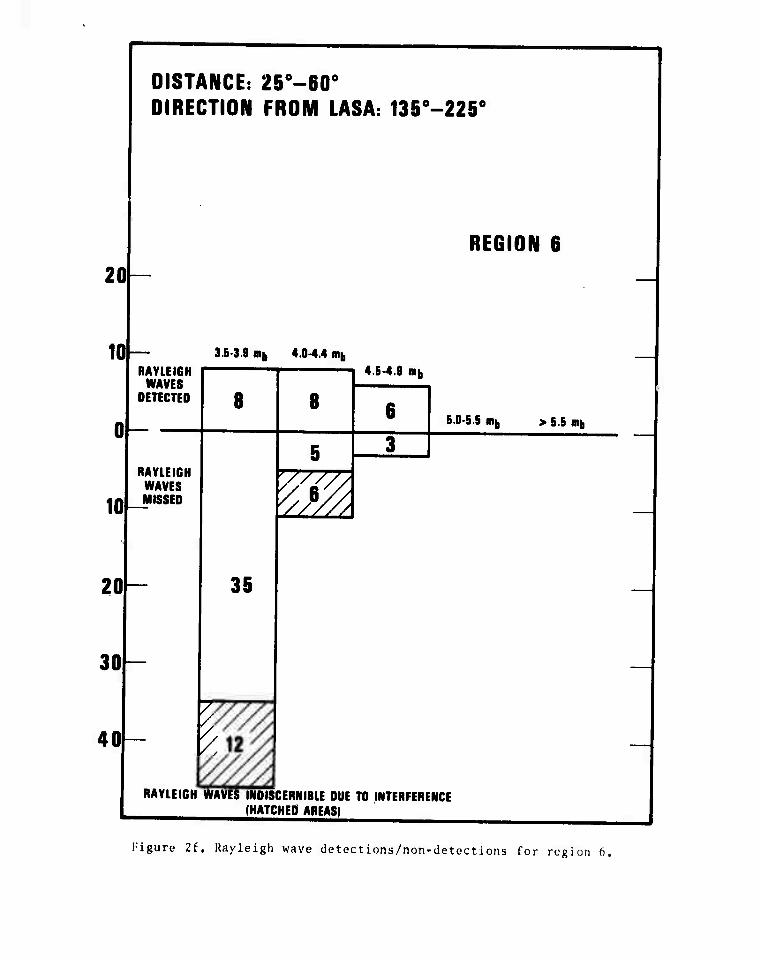
Rayleigh wave detections/non-detections for region 6. 2f
Rayleigh wave detections/non-detections for region 7. 2g
Rayleigh wave detections/non-detections for region 8. 2h
SAAC mb/Ms for suite of Kurile events recorded at LASA. 3a
SAAC m^/Mg for suite of Kurile events recorded at NORSAR. 3b
Rayleigh wave detections and non-detections for Kurile suite at LASA. 4a
Rayleigh wave detections and non-detections for Kurile suite at NORSAR. 4b
Ms - mu plot for central Asian events recorded at both ALPA and NORSAR September - November 1971. 5
^

LIST OF FIGURES (Cont'd.)
figure Title Figurc No
Ms " mb Plot for central Asian events recorded at ALPA and/oi NORSAR September - November 1971.
-JC
6
Ms - m|j plots for western and southwestern Soviet Union events recorded at NORSAR. 7
NORSAR beam showing coherent noise propagating from the east, masking a Rayleigh wave from a west Russian event, 3
Ms-inb plot for events in the central Asia-western Soviet Union region as recorded by ALPA. NORSAR and LASA. All the earthquakes were from the time interval September-November 9
Wave number domain representation of two interfering signals, one 100X the power of the other, as they would appear recorded by the ALPA array. ' 10a
The same representation as Figure 10a after a wavenuraber filter has removed the effects of the large signal. The second signal is now clearly visible and a good estimate of its power is obtained. job
Spatial coherence exhibited at LASA by a Rayleigh wave from an event in Bai a California. -Q
Spatial coherence exhibited at NORSAR by a Rayleigh wave from an event in Turkey. 12

INTRODUCTION
One of our current tasks in the SAAC in Alexandria
is to evaluate the capability of the network of the
three large LP arrays, NORSAR, LASA and ALPA to detect
and measure the amplitude of Rayleigh waves associated
with P-wave detections reported in the LASA and NORSAR
daily event summaries. There arc two facets to this
work. One is to perform the actual analyses and the
other is to develop und implement suitable processing
techniques so the data may be analyzed automatically
within real-time.
The assumption is made that the SP detection thres-
hold is inherently lower than the LP threshold. Hence,
the SP bulletin is used to predict times at which Rayleigh
waves, associated with each reported event, would be
recorded by the three large arrays» All the LP data from
the three arrays are stored in multiplexed form on a
common tape; the SAAC low rate tape. Each tape contains
approximately 12 hours of data. Software has been
developed to access this tape directly, edit the indi-
vidual channels and perform frequency-domain beamforming
to detect and measure the power of Rayleigh waves. Time
domain beamforming and plotting are available for visual
display.
Preceding page blank
-i-

CONTINUOUS ANALYSIS OF LASA LP DATA
One of the experiments performed was to analyze 50
days of LASA LP recordings using the LASA Daily Event
Summary as a guide. To summarize the results the events
were assigned to one of four azimuth ranges and one of
two distance ranges. These are shown in Figure 1.
The ratios of detected to missed Rayleigh waves
are shown in Figures 2a - 2h, The data have not been
reworked to see whether or not more careful processing
could bring out some of the missed events and so these
results do not necessarily reflect true detection thres-
holds. Also only deep events reported by NOS have been
left out but we must presume that many deep events, not
reported by NOA, are included. Even with these restric-
tions there are some striking comparisons. Detection
ratios for events from the south are poor when compared
with those from the west and northwest. Detection ratios
from the north arc also lower than the west and north-
west. Obviously deep events from South America and Asia
are influencing these results but the difference is
sufficient to suggest that comparisons would be similar
if only shallow events were considered.
This continuous study also provided an estimate of
how long a large event could render the array ineffective.
The energy scattered from huge Rayleigh waves washes
across the array from all directions for a period of
hours and makes the detection of small surface waves
impossible. After a magnitude 6.8 earthquake in Japan
no events could be detected at LASA for a period of
4 hours. Also persistent coherent propagation was detected from an azimuth of around 70°.
-2-

ARRAY COMPARISONS
LASA-NORSAR
As part of the network evaluation, individual pairs
of arrays are being compared by beaming them into an
area which is equidistant from the two arrays in question.
In the case of NORSAR and LASA a very convenient region
is the Kurile Islands area. Both arrays are approxi-
mately 65° away from this seismic area. The structure
of the travel paths is somewhat different. Raylcigh
waves received at LASA travel through the north Pacific
and the Aleutians area, then through western Canada,
altogether a rather complex path. The path from the
Kuriles to NORSAR may be considered a bit simpler as the
bulk of the propagation occurs through the northern
part of the Asian continent. Using Kurile islands events
reported in the LASA Daily Event Summary the LP data
from NORSAR and LASA was beamed and searched to detect
and measure Rayleigh waves from these events. The seismic
events used so far in this study were recorded in the
period May-November of this year. No events were used
previous to this period as the current format for data
transmitted from NORSAR to the SAAC was established
on May 1st.
Figure 3 shows the rab - Ms plots for these data
for both NORSAR and LASA. The events used were the same
in both cases. There are more points visible on the
LASA plot. This is because the NORSAR data transmitted
by the TAL, contains gaps during the analysis period
and so some events analyzed for LASA were not available
for NORSAR.
There is however, a good deal of similarity between
the two distributions, with most of the events occupying
the same relative positions in the two respective plots.
Of the points that are common to the two, most exhibit
a slightly higher Ms value at NORSAR than at LASA. The
difference is typically 0,2 - 0.3 M but some larger
differences can be seen. This may be an effect of the
travel path difference mentioned before.
In Figure 4 the events have been broken down into
magnitude groups with a view to establishing detection/
non-detection ratios. The magnitudes are the body wave
magnitudes reported in the LASA Daily Event Summary.
Rayleigh waves from all ev nts with m. > 5.0 were
detected, as would be expected. In the range m. ■ 4.5 - 4.9,
two events at LASA and three events at NORSAR were not
detected by either array. In each case high amplitude
waves from other events caused such strong interference
that a detection of waves from the Kurile Islands could
not be confidently picked.
The magnitude range mb 4.0 - 4,4 is the range where
we are currently expending the most effort and it can be
seen that both arrays are quite good.
In the suite of events examined both NORSAR and LASA
missed one event each of magnitude greater than 4,0. Both
were of magnitude 4.1 and were different events. We have
no way of deciding whether or not these events had marked
radiation patterns. Also we do not know whether or not the

events classified as missed due to intorference would
in fact have been defected had the interfering signal
not been present. It Must be remembered that our data
source is the I.ASA Daily livent Summary which we must
presume is not complete especially at m. = 4.0-4.1.
Hence even though detect ions were made for all events
in the data set used it cannot be claimed that we
are detecting surface waves from all events with mb - 4•0• "owever we arc encouraged by the results so far.
Although we have not analyzed many events at magni-
tudes lower than mb = 4.0, a few have been included here
to show that surface wave detections from such small
events do occur. More will be added as the work continues.
It would appear that there is no nujor difference
between NORSAR and LASA in the detection of Rayleigh waves
from the Kurile Islands, at least for events with body
wave magnitudes greater than 4.0.
ALPA-NORSAR
ALPA and NORSAR have special interest because they
are closest to the Sino-Soviet region and the ray paths
from a particular event to each array are approximately orthogonal.
Unfortunately there is no highly seismic region
equidistant from ALPA and NORSAR as the Kuriles served
LASA-NORSAR, but if the central Asian area as a whole
is considered then useful comparisons can be made.
Due to the poor quality of the LP data from both
arrays until just recently, only events recorded since
September have been considered. mb - Ms plots for events
commonly recorded at both arrays are shown in Figure 5.
The distributions are similar but there is no indication
of a systematic difference between the two sets.
Many events were detected at one array and not the
other. Over one third fell into this category because
of no data or bad data at one of the two arrays. This situation is improving.
A few are detected at one array only because of
interference at the others. Figure 6 shows an M - m,
plot for all central Asian events recorded by one array or the other, or both,
NORSAR has the capability of detecting small events
in the western and southwestern Soviet Union which
cannot be detected by ALPA or LASA. So far we only have
a small collection and an Ms - mb plot is shown in
Figure 7. Actually one of these points situated at
Ms = 2.95, mb = 4.9 was not well recorded at NORSAR due
to coherent noise coming from the same azimuth. Figure
8 shows the NORSAR beam for this event. The noise is
rather obvious and has been observed on several other occasions.

THE NETWORK
Figure 9 gives a composite M - m, for the central
Asia-west Soviet Union region as seen by ALPA-NORSAR
and a little help from LASA. Some presumed explosions
recorded by I,ASA before August have been added. These
data are continuously being added to and reviewed as
better processing techniques become available. With
refined processing we consistently detect surface waves
associated with events of m, > 4,0 from Central Asia
and the western part of the Soviet Union, Again it must
be cautioned that our data set is small so far and
cannot be considered complete and so we cannot as yet
establish a network threshold for these regions.

SIGNAL PROCESSING DEVELOPMENTS
The design of our processing techniques is influ-
enced by the volume of data to be processed. A fast
frequency domain beamforming approach has been developed
and utilized and operates at approximately 3-4 times
real-time on continuous data. The output is a continuous
listing of coherent detections with velocity, azimuth,
signal power and signal-to-noise ratio. A wavenumber
filtering scheme is included whereby a small signal
can be detected in the presence of a much larger signal.
An example is given in Figures la and 10b. Figure 10a
shows the wavenumber plane for ALPA at a period of
19.0 seconds with two signals imposed. One is from the
southwest and the other, with only 0.01 the power of
the first, is from the northeast. The smaller signal
is not at all visible. In fact time domain beamforming
for the second small signal would give a spurious output
of 8X the actual signal power. In Figure 10b the filter
has been used and the data renormalized. The second
signal is now dominant, the signal power estimate being
90 per cent of the true value. This type of processing
allows us to detect and measure the power of small
Rayleigh waves.
One other study in progress is the comparison of
the spatial coherence of Rayleigh waves recorded at the
three arrays. This study provides a quantitative com-
parison of signal deterioration across each array. Two
examples are shown. The first in Figure 11 is for an
event from Baja California recorded at LASA. The

spatial coherence is estimated in two orthogonal directions,
It can be shown that the loss in coherence in the direction
of propagation is caused by a variation in phase velocity
at the period used and the loss of coherence along the
mean wavefront is caused entirely by azimuthal scattering.
The data can be explained by an angular scatter of + 6°
and a velocity scatter of + 0.1 km/sec. A good example
for NORSAR is a Turkish event and the spatial coherence
estimates are shown in Figure 12. An angular scatter of
1 10° and a velocity scatter of + 0.2 km/sec would explain these data.
Such studies as these have direct application in array
processing as they indicate what type of weighting pro-
cedures should be incorporated to improve signal-to-noise
ratios. There is also an interesting scientific content
as the scattering affects the spectrum of a signal
recorded at a single point and the fact that the phase
velocity cannot be measured uniquely for a particular
period would impose restrictions on structural models
obtained by phase velocity inversion.
-9-

N CENTRALi ASIA
Figure 1. Location of regions used in LASA continuous analysis.

DISTANCE: 61e-100o
DIRECTION FROM LASA: 31S0-450
REGION 1 30
20
10 _J!*VIE,GH 3.S-3.I m. mi WAVES
4.0-4.4 inb
DETECTED
0 —
10
20
30
JMYLEIGH WAVES
MISSED
9
24
16
14
4.5-4.9 inb
10
4 zz^za
S.O-S.S mb > 5.5 mb
zzrz 4
?
- mk RAYLEIGH WAVES INDISCERNIBLE DUE TO INTERFERENCE
(HATCHED AREAS)
Figure 2a. Kayleigh wave detections/non-dctections for region I.

DISTANCE: 25e-60e
DIRECTION FROM LASA: 315e-45e
20 —
REGION 2
in JIAYLEIGN ,MrWAV»
DETECTED
..-
RAVIEIGH WAVES MISSED
3 6 3 ' "fc 4P44«.k J
6 7 / I f
^4.641 iBh 6.0-B.S nib > B.5 Mb
^
1 RAYLEIGH WAVES INDISCERNIBLE DUE TO INTERFERENCE
(HATCHED AREAS)
20
Figure 2b. Rayleigh wave detections/non-detections for region 2.

DISTANCE: 61o-100o
DIRECTION FROM LASA. 450-1350
REGION 3
10 RAYLEIGH
WAVES DETECTED
4.0-4.4 iiib
3.6-3.9 inb
10
20
RAYLEIGH WAVES MISSED
8
j
8
4.5-4.9 mb
7Z1 Ty
5.0-5.5 mh \ >6
2 Z ^-^ s
1
RAYLEIGH WAVES INDISCERNIBLE DUE TO INTERFERENCE (HATCHED AREAS)
Figure 2c. Rayleigh wave dctections/non-detections for region 3.

DISTANCF: 25o-60o
DIRECTION FROM LASA: 45e-135e
REGION 4
20
IQ JtAVLEIGH 3.63J iib WrWAVE8
4.0-4.4 iiib
DETECTED
10
20
30
9
JRAYLEIGH WAVES MISSED
12
y^1
¥^-
4.54.1 iiib 6.0-6.6 Mb
I - I >5B">
2
17
Z
g« J
RAVLEIGH WAVES INDISCERNIBLE DUE TO INTERFERENCE
(HATCHED AREAS)
_
Figure 2d. Rayleigh wave detections/non-detections for region 4.

DISTANCE: 61o-100o
DIRECTION FROM LASA: 135e-2250
20
RAVLEIGH WAVES DETECTED
Ml 3.8-3.9 iiib
REGION 5
4.0-4.4 r^ >».5-4Jmb 5.0-8.5 inb
10
20
30
40
50-
RAVLEI6H WAVES MISSED
8
54
10
31
^
*m
11 10 >5.5 1115
1
RAYLEIGH WAVES INDISCERNIBLE DUE TO INTERFERENCE (HATCHED AREAS)
Figure 2e. Rayleigh wave detections/non-detections for region 5.
DISTANCE: 25o-60o
DIRECTION FROM LASA: 135e-2250
20
10
REGION 8
3.5-3.9 ni|, 4.0-4.4 nib
RAYLEIGH WAVES
DETECTED
10
20
30
40
RAYLEIGH WAVES MISSED
8
35
8
m. 4.5-4.9 fflb
8 5.0-5.5 mb > s.5 mb
RAYLEIGH WAVES INDISCERNIBLE DUE TO INTERFERENCE . (HATCHED AREAS)
Figure li, Rayleigh wave detoctions/non-detections for region 6.

4.0-4.4 Mb
40
50
RAYLEIGH WAVES MISSES DUE TO INTERFERENCE (HATCHED AREAS)
Figure 2g. Rayleigh wave detections/non-dctcctions for region 7.

20
DISTANCE: 25o-60o
DIRECTION FROM LASA: 225°
3.B-3.9 mb 4.0-4.4 inb
-315°
REGION 8
10 RAYLEI6H WAVES
DETECTED 12 12
4.5-4.9 mb
8 5.0-5.B HU
0 4 3 1
RAYLEIGH WAVES MISSED
13
4 j^iJ 1
W, 1
10
20
30 RAYLEIGH WAVES INDI!
(HATCI ICERNIBLE DUi IED AREAS)
: TD INTERFEH ENGE
Figure 2h. Rayleigh wave detections/non-detections for region 8.

< <
CD
(U T) t- O u o
'/I
c QJ
> 01
CJ rH • H ^
O
o •H 3
O
E
U
L0
to
be ■ H
s l/\l

OS < in oi o
4-1 re
o •a ^ o u (U u
** m
£2
$ ^ ^
m
r 5
w
c >
3
o
3
U o
s
CM
u
<S)
m CO CM J-
u 3 M
•H
rW

LASA - KURILES RAYLEIGH WAVE DETECTIONS
4.0-4.4 ni|,
30
20
NO. OF DETECTIONS
10
2 3.5-3.9 iRb
SAAC m|| R/.4GE
34
NO. NOT DETECTED -Mggl^
4.5-4.9 mb 5.0-5.5 »b
6 5.5-5.9 mb
6.0-8.4 mb
r
10 HATCHING DENOTES MISSES DUE TO INTERFERENCE
Figure 4a. Rayleigh wave detections and non-detections for Kurile suite at LASA.

NORSAR - KURILES RAYLEIGH WAVE DETECTIONS
30
20
10
4.0-4.4 mb
NO. OF DETECTIONS
3.5-3.9 mi,
SAAC nib
RANGE
NO. NOT OETECTED
29
fe«!
4.5-4.9 mb
10
?7??%za
5.0-5.4 nib 5.5-5.9 nib
1.0-6.4 mb
y
10 HATCHING DENOTES MISSES DUE TO INTERFERENCE
Figure 4b, Rayleigh wave detections and non-detections for Kurile suite at NORSAR.

NORSAR
x PRESUMED EXPLOSION
ALPA
55
• EARTHQUAKES
4 5 6 SAAC mfi
Figure 5. M - nu. , .._.._..,. ,,._.... „.„..k.,. both ALPA and NORSAR September - November 1971.
- mu plot for central Asian events recorded at

< 5
SS
o -d u o o ü ^ in 4-1
C • 0) t-H > h- 4) Ol
rH C rt (-,
■H O '/) J3 < E
o « O
4-t C i o 'J >-.
Hl ^ x> O E ^ o •M ß. 0 OJ
—I LO
E LO cd
i C
o ■ ^
C o ca
3 <

c
5
> o
c u u
o S x; 4-1 3 O 1/1
T) C ra
C v- 0) 4-1 I VI Oi 4» < St^ u. ^ o o z:
4-1
4-1
O T)
a-3
ja o E u
■ >-
1/1 VI S 4-1
c • o
l-~ >
Ü
3
•H C U. 3
C o
s w

f^JMlMM». •
2
i
e o •
<* c V
M > c u
• H
ca rt bC-H n I« P. V) O 3 up: & 0) V) « o
•H 15 o c rt ^ e c o V u
Ä 0) o > u ca
to CC
•H M »•H O Q
EOS rt 0) n
x> oe
a: c <.H
O tfl ^ 6
(ü n
3 M 0)
•H JS

5
i u
• o I <Xl
•H < 01
' -a a
>H f—I
C < > O LT, S- u a: o
o t-1
o ^ e
W >. Ü
O 4-< > "3 O O E
-a o u u u o o *-*
o o 4-> l-i ^■ O Ü
rH C S ^•2 t/,
!«■>
o ,s «^ W 4) .
M
COO Ü I- JS J3 I- O t-l E 3 W O
M O —• O X 2S < 12
s HI/

3.6 Km/sec
PEAK POWER = I.SxIO9
CONTOURS db DOWN FROM MAXIMUM
I'Lgurc 10a. Wave number domain representation of two interfering signals, one 100X the power of the other, as they would appear recorded by the ALPA array.

12
12
/3.6 Km/sec
PEAK POWER = 1.7*107
CONTOURS db DOWN FROM MAXIMUM
Figure 10b. The same representation as Figure 10a after a wavenumbcr filter has removed the effects of the large signal. The second signal is now clearly visible and a good estimate of its power ' obtained.
i s

Cft
to UJ
XI 60
13 Ü
* C a» u
o o CM u -H C M ü n i- u
o en
« •H C
a) 0.+J
•-0 c 0)
• > i—I OJ
c
3 E M O
■H I- U, '-M
/ 33N3U3H03

1.0
^010 oa>ooo 0 « 0
O o 00
CM
** 0.6 CJ
0.4
A A
O NORMAL TO WAVEFRONT
A PARALLEL TO WAVEFRONT
A A A
-
20 40 60 80 100
SEISMOMETER SEPARATION (Km)
l;igurc 12. Sp.itiiil coherence exhibited at NORSAR bv a Rayieifth wave from an event in Turkey.