evaluation of the mike she model for application in …...tianshui city, gansu province in northwest...
TRANSCRIPT

EVALUATION OF THE MIKE SHE MODEL FOR APPLICATIONIN THE LOESS PLATEAU, CHINA1
Zhiqiang Zhang, Shengping Wang, Ge Sun, Steven G. McNulty, Huayong Zhang, Jianlao Li,
Manliang Zhang, Eduard Klaghofer, and Peter Strauss2
ABSTRACT: Quantifying the hydrologic responses to land use ⁄ land cover change and climate variability isessential for integrated sustainable watershed management in water limited regions such as the Loess Plateauin Northwestern China where an adaptive watershed management approach is being implemented. Traditionalempirical modeling approach to quantifying the accumulated hydrologic effects of watershed management is lim-ited due to its complex nature of soil and water conservation practices (e.g., biological, structural, and agricul-tural measures) in the region. Therefore, the objective of this study was to evaluate the ability of the distributedhydrologic model, MIKE SHE to simulate basin runoff. Streamflow data measured from an overland flow-dominant watershed (12 km2) in northwestern China were used for model evaluation. Model calibration and val-idation suggested that the model could capture the dominant runoff process of the small watershed. We foundthat the physically based model required calibration at appropriate scales and estimated model parameters wereinfluenced by both temporal and spatial scales of input data. We concluded that the model was useful for under-standing the rainfall-runoff mechanisms. However, more measured data with higher temporal resolution areneeded to further test the model for regional applications.
(KEY TERMS: Loess Plateau; MIKE SHE; model calibration and validation; China.)
Zhang, Zhiqiang, Shengping Wang, Ge Sun, Steven G. McNulty, Huayong Zhang, Jianlao Li, Manliang Zhang,Eduard Klaghofer, and Peter Strauss, 2008. Evaluation of the MIKE SHE Model for Application in the LoessPlateau, China. Journal of the American Water Resources Association (JAWRA) 44(5):1108-1120. DOI: 10.1111/j.1752-1688.2008.00244.x
INTRODUCTION
Quantifying the hydrological responses to landuse ⁄ land cover change and climate variability is
essential for integrated sustainable watershed man-agement, especially for water limited regions such asthe Loess Plateau of the Yellow River Basin in north-western China. Adaptive watershed managementpractices have been proposed and are being adopted
1Paper No. JAWRA-07-0137-P of the Journal of the American Water Resources Association (JAWRA). Received September 26, 2007;accepted May 13, 2008. ª 2008 American Water Resources Association. No claim to original U.S. government works. Discussions are openuntil April 1, 2009.
2Respectively, Associated Professor and Graduate Student (Z. Zhang, Wang), College of Soil and Water Conservation, Beijing ForestryUniversity, Beijing 100083, China; Research Hydrologist and Research Ecologist (Sun, McNulty), Southern Global Change Program, USDAForest Service, 920 Main Campus Dr., Venture II, Suite 300, Raleigh, North Carolina 27606; Professor (H. Zhang), Energy and Environmen-tal Research Center, North China Electric Power University, Beijing 102206, China; Senior Engineers (Li, M. Zhang), Tianshui Soil & WaterConservation Experimental Station, Tianshui, Gansu Province, China; Professor and Hydrologist (Klaghofer, Strauss), Institute for Land andWater Management Research, Federal Agency for Water Management, A-3252 Petzenkirchen, Austria (E-Mail ⁄ Zhang: [email protected]).
JAWRA 1108 JOURNAL OF THE AMERICAN WATER RESOURCES ASSOCIATION
JOURNAL OF THE AMERICAN WATER RESOURCES ASSOCIATION
Vol. 44, No. 5 AMERICAN WATER RESOURCES ASSOCIATION October 2008
around the world to address natural resource man-agement challenges and uncertainty associated withincreasing human disturbances and climate change.However, these adaptive approaches are largelydependent on our prediction accuracy and certaintyof future conditions.
Predicting the impacts of land use ⁄ land cover,land management, and climatic change on thehydrological processes is especially challenging forthe Loess Plateau region. The region contributeslarge amount of sediment to the middle reach ofthe Yellow River and has been significantly dis-turbed in the past century. Past studies suggestthat the arid and semiarid regions are more sensi-tive than other geographical regions in China interms of the effects of watershed management prac-tices on water resource availability (Wang andZhang, 2001; Zhang and Liu, 2005; Sun et al.,2006; Wang et al., 2006). In 1972, the Yellow Riverran dry for the first time in recorded history. Dry-ing has repeatedly occurred during the 1980s to1990s with the longest dry-up time equaling100 days. Each year, tremendous impacts on theaquatic ecosystems in the downstream area andwater supply have been experienced in the basin(Su, 1996; Cheng et al., 1998; Wang et al., 2006).Afforestation efforts were identified as one of thepossible reasons for reduced downstream runoff(Cheng et al., 1998; Wang et al., 2006; McVicaret al., 2007). Several studies have suggested thatwatershed management can substantially affect thewater resources in the region (He et al., 2003; Hu-ang and Zhang, 2004; Ran et al., 2006; Sun et al.,2006; McVicar et al., 2007).
Large uncertainty and controversy on the effectsof management on watershed hydrology remains inChina due to the lack of long-term ‘‘pairedwatershed’’ experiments and the complexity of thewatershed management issues (Ran et al., 2006).Recent studies that used a rational or empiricalmodeling approach to assess land use and climaticvariability impacts on water yield in the region wereinconclusive, indicating that the hydrologic responseto watershed management scheme and soil andwater conservation measures are rather complex(Huang and Zhang, 2004; Ran et al., 2006; Sunet al., 2006; Li et al., 2007; McVicar et al., 2007; Muet al., 2007).
Physically based distributed models have manyadvantages compared with traditional lumpedparameters models in simulating hydrologic responseto forest management and global change (Sun et al.,1998, 2007). Above all, distributed models can takeinto account of the spatial heterogeneity ofwatershed conditions. This is extremely importantfor watersheds with mixed land uses, such as the
Loess Plateau region. In addition, distributed modelscan simulate the interactions among precipitation,geomorphology, vegetation, land use, and anthropo-genic influences using Geographical Information Sys-tems (GIS) and remote sensing technology(Ciarapica and Todini, 2002; Singh and Woolhiser,2002).
The distributed watershed hydrologic simulationmodel, MIKE SHE originally derived from theSHE model (Abbott et al., 1986a,b), has been widelyused for examining hydrological responses to landuse ⁄ land cover change and climate variability(Graham and Butts, 2005), operations of irrigation(Jayatilaka et al., 1998; Singh et al., 1999), hydro-logical manipulations for grass wetlands (Thompsonet al., 2004), forestry management and forest fireimpact assessment (Lu 2006; McMichael and Hope,2007), and for sustainable ground-water manage-ment (Demetriou and Punthakey, 1999). It has alsobeen applied in more basic process studies includingmodel structure and internal model assessment(Butts et al., 2004; Christiansen et al., 2004), andmodel uncertainty analysis (Christiaens andFeyen, 2001; Butts et al., 2004; McMichaeland Hope, 2007). Other areas of study on MIKESHE include sensitivity analysis and spatial scaleeffects (Xevi et al., 1997; V’azquez et al., 2002; V’az-quez and Feyen, 2007), model parameterization,calibration, and validation (Refsgaard, 1997;Andersen et al., 2001; Henriksen et al., 2003;Madsen, 2003), and evaluation of the potentialevapotranspiration (PET) methods (V’azquez andFeyen, 2003). However, most of those studies wereconducted in the temperate and humid climate con-ditions where shallow ground-water and surfacewater are tightly linked (Lu, 2006). Those sites arevery different from the hydrological environments ofthe Loess Plateau of China (Sun et al., 2007). Thehydrologic processes of the Loess Plateau weredominated by overland flow, and ground water haslittle contribution to streamflow of small headwaterwatersheds.
Therefore, the overall objective of our studywas to evaluate the applicability of the MIKESHE model in a region where runoff generation isdominated by the overland flow processes. Our hypo-thesis was that a process-based, distributed hydro-logical model is capable to simulate the variousaspects of the hydrologic cycle within a watershed.We tested the model’s ability to replicate stormevents and daily time scale hydrology. To our knowl-edge, this study represents the first effort that teststhe MIKE SHE model in a semiarid region in China,and perhaps one of the few studies using a fullydistributed hydrologic model for the Loess Plateauregion.
EVALUATION OF THE MIKE SHE MODEL FOR APPLICATION IN THE LOESS PLATEAU, CHINA
JOURNAL OF THE AMERICAN WATER RESOURCES ASSOCIATION 1109 JAWRA
METHODS
Watershed Characteristics and HydrologicMeasurements
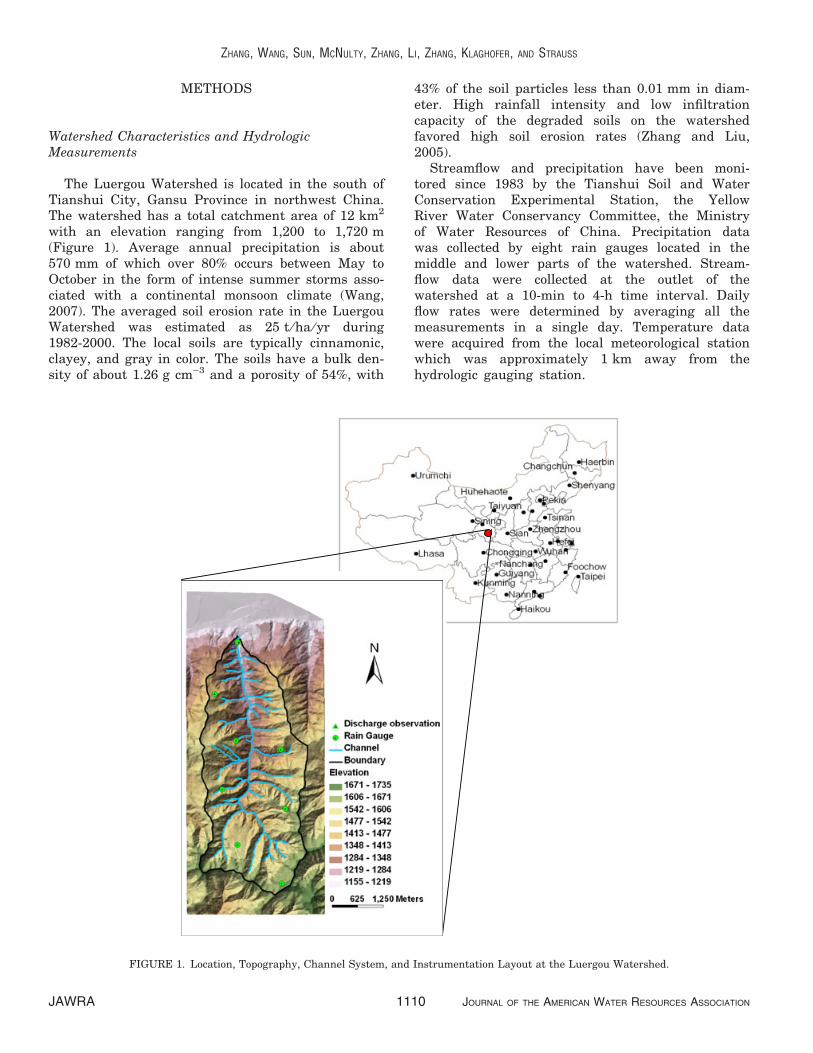
The Luergou Watershed is located in the south ofTianshui City, Gansu Province in northwest China.The watershed has a total catchment area of 12 km2
with an elevation ranging from 1,200 to 1,720 m(Figure 1). Average annual precipitation is about570 mm of which over 80% occurs between May toOctober in the form of intense summer storms asso-ciated with a continental monsoon climate (Wang,2007). The averaged soil erosion rate in the LuergouWatershed was estimated as 25 t ⁄ ha ⁄ yr during1982-2000. The local soils are typically cinnamonic,clayey, and gray in color. The soils have a bulk den-sity of about 1.26 g cm)3 and a porosity of 54%, with
43% of the soil particles less than 0.01 mm in diam-eter. High rainfall intensity and low infiltrationcapacity of the degraded soils on the watershedfavored high soil erosion rates (Zhang and Liu,2005).
Streamflow and precipitation have been moni-tored since 1983 by the Tianshui Soil and WaterConservation Experimental Station, the YellowRiver Water Conservancy Committee, the Ministryof Water Resources of China. Precipitation datawas collected by eight rain gauges located in themiddle and lower parts of the watershed. Stream-flow data were collected at the outlet of thewatershed at a 10-min to 4-h time interval. Dailyflow rates were determined by averaging all themeasurements in a single day. Temperature datawere acquired from the local meteorological stationwhich was approximately 1 km away from thehydrologic gauging station.
FIGURE 1. Location, Topography, Channel System, and Instrumentation Layout at the Luergou Watershed.
ZHANG, WANG, SUN, MCNULTY, ZHANG, LI, ZHANG, KLAGHOFER, AND STRAUSS
JAWRA 1110 JOURNAL OF THE AMERICAN WATER RESOURCES ASSOCIATION

The MIKE SHE Model
There are numerous watershed-scale hydrologicmodels. The choice of models should be based on theobjectives of use. Literature reviews suggest that theMIKE SHE ⁄ MIKE 11 modeling package (DHI,Hørsholm, Denmark) has several advantages overother hydrologic models for estimating watershedrunoff: (1) it is a distributed model and most of thealgorithms in describing the water movements arebased a physical processes, (2) it simulates the over-land flow processes commonly found in dry regions,and (3) it has been commercialized and a GIS userinterface was built in the system that can directlyuse spatial GIS databases for model inputs. Also,the model has a strong visualization utility thatmakes interpretation of modeling outputs mucheasier.
MIKE SHE is a first generation of spatially dis-tributed and physically based hydrologic model(Abbott et al., 1986a,b). MIKE SHE simulates theterrestrial water cycle including evapotranspiration(ET), overland flow, unsaturated soil water, andground-water movements. ET is modeled as a func-tion of PET, leaf area index (LAI), and soil moisturecontent using the Kristensen and Jensen (1975)method. The unsaturated soil water infiltration andredistribution processes are modeled using Richard’sequation or a simple wetland soil water balanceequation. Saturated water flow (i.e., ground water)is simulated by a 3-D ground-water flow model.Channel flows and channel surface water andupland ground-water interactions are controlled bythe MIKE 11 model, and by coupling of MIKE SHEand MIKE 11. MIKE 11 is a one-dimensional modelthat tracks channel water levels using a fullydynamic wave version of the Saint Venant equa-tions. The coupling of MIKE SHE and MIKE 11 isespecially important for simulating the dynamics ofvariable source areas in both wetland and uplandwatersheds. Detailed descriptions of the modelingprocedures and mathematical formulation can befound in the MIKE SHE user’s manual (DHI, 2004)and associated publications (Abbott et al., 1986a,b;Graham and Butts, 2005).
Model Setup and Parameterization
Watershed Discretization. The Digital ElevationModel (DEM) data for model inputs were generatedfrom a digitized 1:10,000 topographical map. Ourinitial analysis (Wang, 2007) indicated that a finergrid size (i.e., 10 or 30 m) keeps the modeling areaclose to the original watershed very well, but it did notsuccessfully capture the peak flow observation due to
the elongated river link with relative change of around27%. While a coarser grid size (100 or 200 m) improvedthe peak flow simulation and kept the length of riverlink similar to the original, nevertheless it increasesthe modeling area by 11 and 21%, respectively (Wang,2007). Therefore, the grid size for running the modelwas set as 50 · 50 m to compromise the simulationaccuracy and physical characteristics of the water-shed. The soil profile for the loess soil was assumed tobe relatively uniform. According to the user referenceof MIKE SHE (DHI, 2004), the vertical soil profile fromthe surface to 30 m was divided into a 10 cm intervalfor the upper most layer of 0-0.5 m, 25 cm interval for0.5-2 m, and 50 cm interval for the layers deeper than2 m, respectively. A complete list of model parametersis presented in Table 1.
Precipitation and Potential Evapotrans-piration. We acquired rainfall records from eightautomatic rain gauges. For simplification, a spatialdistribution of precipitation model setup was definedas station based. The rainfall input was directly linkedto each station and the controlled area for each stationwas determined by creating a Thiessen polygon usingthe terrace GIS tool. For annual rainfall runoff simula-tion, default values for the snowmelt component wereused (e.g., snowmelt temperature 0�C and degree-dayfactor equal to 2 mm ⁄ day ⁄ �C (DHI, 2004). The uniformvalue of PET calculated by a temperature-based PETequation (Hamon, 1963) was used due to limitation ofmeteorological data.
Land Use and Land Cover. Land use surveysconducted in 1982, 1989, and 2002 indicated that theland use of the watershed has not changed signifi-cantly through the time period of this study (Wang,2007; Wang et al., this issue). Therefore, land useand land cover data of 1982 and 1989 were used forthe model calibration and validation, respectively.Seasonal dynamics of LAI was specified according tothe field measurement conducted in the summersfrom 2004 to 2006 with a LAI-2000 Plant CanopyAnalyzer (LI-COR, Lincoln, Nebraska, USA) (Fig-ure 2), and rooting depth was set up based on theprevious study conducted in the region (Li, 2001).Preliminary analysis prior to model calibration sug-gested that discharge was insensitive to most of theET parameters in the region. Therefore, defaultparameter values of C1, C2, C3, Cint, and Aroot wereused in calculating the actual ET (Kristensen andJensen, 1975; DHI, 2004).
Unsaturated Zone. Soil samples were taken dur-ing the summers in 2004-2006 from the top 0.5 mlayer of the all land use types and from the deeperlayer below 0.5 m of the terraces. The soil water
EVALUATION OF THE MIKE SHE MODEL FOR APPLICATION IN THE LOESS PLATEAU, CHINA
JOURNAL OF THE AMERICAN WATER RESOURCES ASSOCIATION 1111 JAWRA

retention curve for soil samples was determinedusing a No. 1500 15-bar Pressure Plate Extractor(Soilmoisture, Santa Barbara, CA, USA) in the labo-ratory. For forestlands, shrubs and grasslands, ter-races, sloping croplands, and non production lands,Van Genuchten (1980) model was fitted using mea-sured soil water retention curves for each soil layerfrom the surface to 0.5 m. For deeper soil layersbelow 0.5 m, measured soil water retention curvefor terraces were applied across all land uses assum-
ing a uniform soil texture. Saturated soil hydraulicconductivity (Ks) values were found from publishedliterature in the study region (Luo et al., 2003; Stolteet al., 2003; Zhang et al., 2005a; Ran et al., 2006).
Saturated Zone. The ground-water depth wasapproximately 50 m in the study watershed, andthus base flow contributed very little to streamflow.Therefore, we assumed the distribution of soilparameters such as horizontal saturated hydraulicconductivities (Ks_h), vertical saturated hydraulicconductivities (Ks_v), specific yield, storage coeffi-cient, and drainage time constant were uniformacross the watershed (Henriksen et al., 2003; Mad-sen, 2003). Our sensitivity analysis indicated thatsimulated peak flow and total surface flow changedby 1 and 12%, respectively, when Ks_h varied from1e-008 to 1e-006. In addition, changes in the verticalsaturated hydraulic conductivity (i.e., Ks_v), the spe-cific yield, and the storage coefficient did not makeany difference for peak flow and surface flow simula-tions. This was expected because there was littleinteraction between surface and ground-water flowsat the study watershed.
Overland Flow and Channel Flow. The stream-flow was dominated by surface flow, and parameter of
FIGURE 2. Leaf Areas Index (LAI)Dynamics for Various Land Uses.
TABLE 1. Parameter Setting for MIKE SHE Model With Procedure of Auto-Calibration.
Module Parameter Value ⁄ Range Auto-Calibration
ET C1 0.3 NC2 0.2 NC3 (mm ⁄ day) 20 NCint (mm) 0.25 NAroot (1 ⁄ m) 0.25 N
Unsaturated Zone(Ks in m ⁄ s)
Forestland 0-2 m 5e-008-5e-006 Y2 m below 1e-009 to 5e-007 Y
Shrub and grassland 0-1 m 5e-008 to 5e-006 Y1 m below 1e-009 to 5e-007
Terrace 0-0.5 m 1e-009 to 5e-007 Y0.5 m below 1e-009 to 5e-007 Y
YSloping cropland 0-0.5 m 1e-009 to 5e-007 Y
0.5 m below 1e-009 to 5e-007 YNon productive land 0-0.5 m 1e-009 to 5e-007 Y
0.5 m below 1e-009 to 5e-007 YOverland Flow Manning number ⁄ M [m(1 ⁄ 3) ⁄ s] 20-40 Y
Detention storage(mm) 2 NInitial water depth (mm) 0 N
Saturated Zone Horizontal saturated hydraulic conductivity ⁄Ks_horizontal (m ⁄ s)
1e-007 N
Vertical saturated hydraulic conductivity ⁄Ks_vertical (m ⁄ s)
1e-007 N
Specific yield 0.5 NStorage coefficient (1 ⁄ m) 0.0001 N
Channel Flow Manning number ⁄ M [m(1 ⁄ 3) ⁄ s] 25 NLeakage coefficient (1 ⁄ s) 1e-006 N
Note: ET, evapotranspiration.
ZHANG, WANG, SUN, MCNULTY, ZHANG, LI, ZHANG, KLAGHOFER, AND STRAUSS
JAWRA 1112 JOURNAL OF THE AMERICAN WATER RESOURCES ASSOCIATION

Manning number (M) was found to be sensitive forthe simulation. Therefore, Manning number (M) wassubject to auto-calibration. Channel discharge andwater level can be dynamically simulated by couplingMIKE SHE and MIKE 11. The drainage network thatconsists of 27 channels including first-order, second-order, and third-order ephemeral streams wereextracted from a digitized terrain map at 1:10,000scale. Cross-section for each channel in model setupwas generally specified according to the field investi-gations. Uniform initial Manning number (M) for allchannels was set as 25 m1 ⁄ 3 ⁄ s (Fu et al., 2002) andthe channel leakage coefficient was set as 1e-006 ⁄ s(Henriksen et al., 2003; DHI, 2004).
Simulation Time Steps. Due to the coarse reso-lutions of rainfall and runoff data, the initial timestep for storm events model and annual scale modelwas set as 4 and 24 h, respectively. MIKE SHE hasthe flexibility of using variable simulation time stepsin modeling different hydrologic components and flowcharacteristics (Demetriou and Punthakey, 1999).Therefore, for the event scale model, the maximumtime step for the saturated zone component was setas 12 h to reduce the computation time in view of theless importance of saturated flow in the watershed,and the maximum time steps for other components(e.g., overland flow, unsaturated flow, and ET) werespecified as 4 h as the initial time step.
Initial Conditions. Initial values for severalstate variables such as soil moisture content andground-water level affect model performances greatly(Refsgaard, 1997), especially for simulating storm hy-drographs. Deep ground-water levels, very low baseflow, and low soil moisture content were some of thecharacteristics in our study region. We applied the‘‘hot start’’ utility provided by MIKE SHE to generatethe initial conditions before simulating storm eventsby simulating the 15-day rainfall runoff process. Wegenerated the initial conditions for the annual runsby simulating one whole year prior to model calibra-tion and validation.
Model Performance Evaluation Methods
Theoretically, parameters for a physical based dis-tributed hydrological model are all measurable in thefield. Yet, model calibration is usually a necessarystep to derive the ‘‘effective’’ parameters for theentire watersheds or individual modeling element(Madsen, 2003). We evaluated the model performanceby visual inspection of the simulated vs. observed dis-charge hydrographs (Jayatilaka et al., 1998; Chris-tiansen et al., 2004). In addition, four quantitative
criterions including coefficient of correlation (R), coef-ficient of determination (CD), root mean squareerrors (RMSE), and mean streamflow simulatingerror, FBal were used to evaluate the model perfor-mances on both the storm event of subdaily timescale and continuous simulation on a daily time scale(Xevi et al., 1997; V’azquez and Feyen, 2002; Henrik-sen et al., 2003).
R ¼
Pni¼1ðOi �OÞðSi � SÞffiffiffiffiffiffiffiffiffiffiffiffiffiffiffiffiffiffiffiffiffiffiffiffiffiffiPn
i¼1ðOi �OÞ2
s ffiffiffiffiffiffiffiffiffiffiffiffiffiffiffiffiffiffiffiffiffiffiffiffiffiPni¼1ðSi � SÞ2
s ð1Þ
CD ¼
Pni¼1ðOi �OÞ2
Pni¼1ðSi �OÞ2
2 0;þ1ð Þ ð2Þ
RMSE ¼
ffiffiffiffiffiffiffiffiffiffiffiffiffiffiffiffiffiffiffiffiffiffiffiffiffiffiffiffiffiffiffiffiffi1
N
XNi¼1ðOi � SiÞ2
vuut ð3Þ
FBalð%Þ ¼ 100� ðO� SÞO
; ð4Þ
where Oi measured streamflow(m3 ⁄ s); Si simulatedstreamflow(m3 ⁄ s); O measured mean streamflow(m3 ⁄ s); and S simulated mean streamflow (m3 ⁄ s).
Those four measures of model performance reflectthe different aspect of goodness of fit. The correlationcoefficient was called the goodness of fit (Legates andMcCabe, 1999), reflecting the degree of the similarityfor the patterns between the simulated and observedhydrographs. CD value represents the ratio of thescatter of simulated and the measured values aroundthe average of the observations (V’azquez et al.,2002). FBal indicates general streamflow simulationcapability (Henriksen et al., 2003). The RMSE crite-ria were used for auto-calibration.
Due to the high intensity of the rainfall in thisregion, the hydrologic processes were governed by theoverland flow mechanism (Ran et al., 2006), and thetotal annual water yield of the watershed was pro-duced from several thunder storms. Furthermore, therunoff coefficient of the studied watershed was verylow throughout the monitoring period (Wang et al.,this issue), therefore, the dataset from 1983 to 1984and 1989 to 1990 with higher rainfall and runoffamount were selected to run the model for calibrationand validation, respectively. Both time periods werewet years with average annual precipitation of 773
EVALUATION OF THE MIKE SHE MODEL FOR APPLICATION IN THE LOESS PLATEAU, CHINA
JOURNAL OF THE AMERICAN WATER RESOURCES ASSOCIATION 1113 JAWRA

and 701 mm, and the average daily temperatureswere 10.2�C and 10.9�C, respectively (Wang et al.,2006).
In addition, we also used a subdaily time step tosimulate the storm-flow processes. Flood durationcurve analysis indicated that the peak flow for thefrequency greater than 80% was 1.19 m3 ⁄ s (Zhanget al., 2005b). Therefore, three storm events, Sep-tember 7th of 1983, September 27th of 1983, andAugust 16th of 1983 which had peak flows rangingfrom 0.5 to 1.5 m3 ⁄ s were chosen to calibrate thesubdaily process. Seven storms with a similar mag-nitude of peak flow and one with an extreme value(Table 2) were used to validate the model. Bothannual scale model and storm event models werecalibrated against discharge by the auto-calibrationprocedure with RMSE as an objective function. Dur-ing auto-calibration, parameters are adjusted auto-matically according to a specific search scheme foroptimization of certain calibration criteria (objectivefunctions). Detailed procedures are found in Madsen(2003).
RESULTS
Model Calibration and Validation for Daily Flows
Hydrographs for the model calibration and valida-tion periods show that the annual model could cap-ture the dominant runoff process and streamflowdynamics of the small watershed (Figure 3). How-ever, the model both overestimated and underesti-mated streamflow during the simulation period(Figures 3A and 3B). Reasonable coefficients of corre-lation R of 0.83 and 0.63 and RMSEs of 0.06 and 0.05for model calibration and validation period wereobtained. The mean streamflow simulating error for
model calibration (FBal = )40.0%) was much higherthan that for model validation (FBal = )17.9) eventhough R for the calibration was higher than that forvalidation. The higher coefficient of correlationR = 0.83 between modeled and measured dischargeduring calibration period was mainly due to the factthat fewer flow events with high peak flows wereunderestimated and less modeling errors occurred.For instance, the simulated and observed highestpeak flows in August 3, 1984, were 1.9 and 1.6 m3 ⁄ s,respectively, during the calibration period The simu-lation error was only )14%. For the validation period,peak flow rates for a few more events were underesti-mated or overestimated and resulting in much highersimulation errors. The observed and simulated peakflows on September 7, 1990, were 0.5 and 0.3 m3 ⁄ s,respectively, indicating a much higher simulationerror (i.e., )34%) than that of the calibration period.Much higher simulation errors of 6 and 92% werefound for the events of June 13, 1989 and August 18,1989, respectively.
Model Calibration and Validation for Storm Events
The model matched the general storm-flow patternsand the time to peaks for the selected storms usedfor both calibration (Figures 4A-4C) and validation(Figures 5A and 5B) periods. The correlation coeffi-cients between predicted and measured flows for thecalibrations for events of August 16, 1983, September7, 1983, and September 27, 1983 were 0.73, 0.81, and0.83, respectively. Those values were consideredrather high for storm event simulations. However, CDfor these three events during the calibration periodwere 0.39, 0.71, and 0.50, respectively. The FBal val-ues were all higher than 20% indicating that themodel could not simulate the average flow as well.Details of statistics for model validations for eightstorm events were presented in Table 2. Most of coeffi-
TABLE 2. Statistics of Storm Event Modeling for Selected Storm Events.
Storm Event CD R RMSE FBal (%) P (mm) QPeak_O (m3 ⁄ s) QPeak_S (m3 ⁄ s)
Calibration September 7, 1983 0.707 0.805 0.1559 38.58 32 0.874 0.789September 27, 1983 0.502 0.834 0.3478 33.56 58 1.420 1.401August 16, 1983 0.391 0.732 0.1693 )38.48 62 0.593 0.947
Validation June 21, 1984 1.449 0.799 0.7763 41.84 71 2.94 1.769July 25, 1984 0.913 0.496 0.4903 62.65 39 1.980 1.636September 7, 1985 0.252 0.759 0.2970 )0.71 42 1.150 1.511September 14, 1985 0.395 0.981 0.1927 36.16 23 0.675 0.825October 15, 1985 0.868 0.723 0.1226 )30.12 35 1.060 0.777July 9, 1985 0.187 0.567 0.0857 )53.72 29 0.411 0.646June 25, 1987 0.093 0.923 0.2471 8.43 75 0.786 1.508July 25, 1985 1.581 0.801 11.6838 90.40 17 22.4 2.879
Notes: CD, coefficient of determination; RMSE, root mean standard error.
ZHANG, WANG, SUN, MCNULTY, ZHANG, LI, ZHANG, KLAGHOFER, AND STRAUSS
JAWRA 1114 JOURNAL OF THE AMERICAN WATER RESOURCES ASSOCIATION

cients of correlation were found acceptable, but CDsand FBal varied greatly among the simulated events.For the extreme magnitude of event, July 25th of1985, R = 0.80, while CD and FBal were 1.6 and90.4%, respectively. Again, validation results showthat the model could simulate the general hydrologi-cal processes even though the model could overesti-mate (Figure 4B) or underestimate (Figure 4A) peakflows and volumes.
Parameters Calibrated
The saturated hydraulic conductivity for the unsat-urated zone and Manning coefficient for modelingoverland flow were the two most sensitive parametersfor this study. The derived saturated hydraulic con-ductivity values for the top soil layer in the unsatu-rated zone through calibration by the storm event
model and annual model for the same land use werequite different (Table 3). We found that the saturatedhydraulic conductivity calibrated by the storm eventmodel for forestland (i.e., 0-2.0 m) and shrublandand grassland (i.e., 0-1.0 m) were higher than thatcalibrated by the annual model. Saturated hydraulicconductivity calibrated by the storm event model forterrace, sloping agricultural land, and non productiveland within the top soil layer were less than that cali-brated by the annual model. Manning coefficients ofoverland flow calibrated for storm event model andannual model were 0.05 and 0.03, respectively. Thismay indicate that modeling overland flow at the finerscale resulted in higher roughness than at a coarsertime scale, and thus the temporal scale effect isimportant for model performance. Higher saturatedhydraulic conductivity (Ks) of vegetated landsresulted in lower overland flow than other land useswith lower Ks. This may have important implications
FIGURE 3. Precipitation and Annual MIKE SHE Model at Daily Time Scale Calibration (A) and Validation(B) Showing RMSE (root mean standard error), R (coefficient of correlation between measured and simulated
daily streamflow), FBal (simulating errors for average streamflows), and CD (coefficient of determination).
EVALUATION OF THE MIKE SHE MODEL FOR APPLICATION IN THE LOESS PLATEAU, CHINA
JOURNAL OF THE AMERICAN WATER RESOURCES ASSOCIATION 1115 JAWRA

to the local revegetation efforts in reducing soilerosion.
DISCUSSION
Hydrographs measured at the watershed outlet inthe semiarid regions are the synergistic outcomes ofmany key interacting processes that control thewatershed hydrology such as rainfall, infiltration,overland flow, and flow routing in various channels.To simulate those processes for a watershed withmixed land uses and a complex terrain, this studyfound that the MIKE SHE had to be calibrated toproduce a reasonable hydrograph. As discussedbelow, several key factors affect the matches betweensimulated by MIKE SHE and measured hydrographs.
Temporal Scale Effects on Model ParameterDetermination
Past modeling studies suggested that the most sen-sitive parameters for watersheds dominated by infil-tration-excess flow generation are those that controlthe infiltration and overland flow routing processes(Senarath et al., 2000; Downer et al., 2002). Daviset al. (1999) demonstrated that soil saturated hydrau-lic conductivity measured by different methods couldbe different by 1 to 3 orders of magnitude. Manyresearchers have evaluated impact of varying spatialresolution, and it is widely accepted that calibratedparameters are effective for a particular spatial scale(Wood et al., 1988; V’azquez et al., 2002, V’azquez andFeyen, 2007). Our study suggested that the effectiveparameter was not only dependent on the spatialscale, but also dependent on the temporal scale.Therefore, the optimization of the temporal-scaledependent parameters also was a key process for suc-cessful hydrological modeling watersheds on the LoessPlateau in Northwest China.
FIGURE 4. Calibration of Storm Event Model (A) Event of 7September 1983, (B) 16 August 1983, and (C) 27 September 1983.
FIGURE 5. Validation of Storm Event Model (A) Event of 21 June 1984 and (B) 9 July 1987.
ZHANG, WANG, SUN, MCNULTY, ZHANG, LI, ZHANG, KLAGHOFER, AND STRAUSS
JAWRA 1116 JOURNAL OF THE AMERICAN WATER RESOURCES ASSOCIATION

Effects of Hydrologic Processes on Model Performance
The annual scale MIKE SHE model performed bet-ter in simulating the general hydrograph patternsthan modeling the total water yield and the averageflow rates as indicated by the various performancecriteria. Model performance may be influenced by theunderlining runoff generation mechanisms as deter-mined by the interactions between rainfall amountand intensity, antecedent soil moisture, vegetation,topography, and geology (Beven, 2002; Ciarapica andTodini, 2002). It is critically important to understandthe runoff production mechanisms for physicallybased distributed watershed hydrologic model devel-opment and applications to produce realistic modelpredictions (Downer et al., 2002; V’azquez et al.,2007). Our model analysis suggested that a daily timestep scale model was not sufficient to capture thevery quick response of runoff in a watershed thatwas dominated by infiltration-excess overland flows.The calibrated daily time step model could simulatethe saturation-excess runoff better during the dryperiod under big storm conditions than infiltration-excess runoff. For instance, the storm-flow events(peak flow 0.4-0.7 m3 ⁄ s) on June 5, 1984, and June13, 1989, corresponded to high rainfall intensities(Table 4), while the simulated peak flow for these twoevents were lower than 0.1 m3 ⁄ s. We believe that theapplication of aggregated daily rainfall moderated theinfluence of the high rainfall intensity, resulting inthe lower runoff estimation. In addition, large ante-cedent precipitation might have offset the deficiencyof aggregated rainfall, and thus the estimated runofffor August 3, 1984, and September 27, 1983, withlarge antecedent rainfall having the same magnitudeas the observation (Table 4). Improved daily stream-flow modeling during the period of higher antecedentrainfall conditions suggested that MIKE SHE couldsimulate saturated overland flow better than duringdry spells with big storm conditions. Other modeling
studies for overland flow-dominated watersheds alsosuggested that models were not very sensitive to sat-urated hydraulic conductivity in unsaturated zone forlarge rainfall-runoff events (Ogden and Julien, 1993;Woolhiser et al., 1996).
Effects of Model Setups
Although the time step for the storm event modelshould be as fine as possible in order to produce rea-sonable hydrographs to compare, calibrate, and vali-date the model (Bergstrom et al., 2002; V’azquezet al., 2002), the calibration and validation of thestorm event model was not necessarily better thanthe annual streamflow simulation as demonstrated inour study. The effect of temporal and spatial scales(i.e., time step and grid size) of model setup is one ofimportant factors influencing model performances(V’azquez et al., 2002). The time step is normally setto the same resolution as the discharge measure-ments when continuous fine-scale measurements arenot available (Ciarapica and Todini, 2002; Downeret al., 2002). In our study, only 20% of runoff flowdata were measured at an interval from 15 min to4 h and the other 80% with much coarser time inter-
TABLE 3. Auto-Calibrated Parameters for Event and Annual Models.
Module ParameterSoil
Depth (m)
Values
Storm Event Annual Range
Unsaturated ZoneKs, m ⁄ s
Forested land 0-2.0 9.92e-007 2.05e-006 5e-008 to 5e-006>2.0 3.89e-008 4.58e-009 1e-009 to 5e-007
Shrub and grassland 0-1.0 8.84-007 3.98e-006 5e-008 to 5e-006>1.0 3.89e-008 4.58e-009 1e-009 to 5e-007
Terrace 0-0.5 3.89e-008 6.20e-009 1e-009 to 5e-007>0.5 3.89e-008 4.58e-009 1e-009 to 5e-007
Sloping agricultural land 0-0.5 1.83e-007 1.67e-007 1e-009 to 5e-007>0.5 3.89e-008 4.58e-009 1e-009 to 5e-007
Non productive land use 0-0.5 3.12e-007 2.56e-007 1e-009 to 5e-007>0.5 3.89e-008 4.58e-009 1e-009 to 5e-007
Overland Flow Manning number ⁄ M [m(1 ⁄ 3) ⁄ s] 36.3 22.4 20-40
TABLE 4. Comparison Between Simulated and Observed Runofffor Selected Time Period in Annual Scale Model.
Period
ModeledRunoff(m3 ⁄ s)
ObservedRunoff(m3 ⁄ s)
Rainfall(mm)
RainfallIntensity(mm ⁄ h)
AntecedentRainfall
(mm)(7 days)
June 5, 1984 0.003 0.702 24.4 15 13.5June 13, 1989 0.098 0.409 34.7 Not
available33.4
August 3,1984
1.624 1.9 24.7 10 61.8
September27, 1983
0.575 0.578 24.4 12.4 82.3
EVALUATION OF THE MIKE SHE MODEL FOR APPLICATION IN THE LOESS PLATEAU, CHINA
JOURNAL OF THE AMERICAN WATER RESOURCES ASSOCIATION 1117 JAWRA

vals. The data problem made it very difficult to setup a proper time step for model calibration and vali-dation. We suspected that the data resolutions hadindirect effects on the model calibration and valida-tion results. Therefore, runoff overestimation andunderestimation could be possible when calibratedparameters from one time step were used for valida-tion purposes when the data were measured at a dif-ferent time interval.
As mentioned previously, using a daily time step tocalibrate and validate the model might give largeerrors for infiltration-excess overland flow dominatedwatersheds. Finer time step and rainfall datasetswith a higher temporal resolution should be used inthis region to simulate the watershed hydrology suffi-ciently. However, it should be emphasized that thesimulation of the storm event model will not neces-sarily be improved given the coarse resolutions inputand the inevitable potential errors associated withthe precipitation and the PET estimation (Andersenet al., 2001; V’azquez and Feyen, 2003). It wasreported that the method of calculating PET has sig-nificant effects not only on the optimization of someET model parameters in MIKE SHE but also on themodel performances in terms of streamflow prediction(V’azquez and Feyen, 2003). Although a spatially dis-tributed rainfall input was applied throughout thewhole model exercises, uniformed PET values esti-mated by the temperature-based Hamon method forall land uses might also contribute to the simulationerrors.
CONCLUSIONS
The MIKE SHE hydrologic simulation model wascalibrated and validated with measured streamflowsat a storm event subdaily and continuous dailyscales. This modeling exercise clearly identified defi-ciency of field data and research gaps The MIKESHE could simulate the overland runoff generationmechanisms that occurred in the study watershed,but the model had large simulation errors for someindividual storm events. Model performance for stormevents was not as satisfactory as for the continuousdaily streamflow simulation. To further test themodel performances in the study region, it isessential to continuously measure the rainfall andstreamflow at finer temporal scale. Moreover, betterestimation of PET is important as well. Model uncer-tainty analysis using the Generalized LikelihoodUncertainty Estimation (GLUE) method (Butts et al.,2004) would be required in the future to betterunderstand the hydrologic processes.
This modeling study demonstrated that the well-recognized ‘‘equifinality’’ phenomenon of a physicallybased distributed hydrological model plays a signifi-cant role in affecting model performance. Differentsets of parameters are needed to construct models fordifferent purposes (e.g., storm hydrograph vs. long-term water balance studies). Integrated watershedmanagement practices to reduce soil erosion and sedi-mentation in the Loess Plateau of northwest Chinausually include biological measures (e.g., forestation)and structural measures (e.g., terraces and checkdams). The complex land use and management prac-tices further challenge watershed hydrological model-ing. This study focused on land use types in modelparameterization and few studies have been con-ducted to quantitatively develop the relationshipsbetween structural measures and model parameters.Understanding the coupling impacts of soil and waterconservation measures and rainfall regimes on therunoff generation mechanisms and their quantitativelinkages with hydraulic parameters could furtherimprove the MIKE SHE model application in theregion.
In addition to land use change, climate in the studyhas showed a warming trend in recent decades. Thephysically based MIKE SHE has a great potential to beused to evaluate the coupling effects of future soil con-servation practices and climatic change and variabilityon watershed hydrology at multiple scales.
ACKNOWLEDGMENTS
Major support was from the China Key Basic Research Program(973 Program) ‘‘Influence and Control of Forest Vegetation Coverson Agricultural Ecological Environments in Western China’’(2002CB111502) and the China National Scientific and TechnicalResearch Project for 11th Five Year Planning (Grant No.2006BAD03A0202). Support was also provided by the SouthernGlobal Change Program (SGCP), and the USDA Forest Servicethrough an international collaboration program between BeijingForestry University and SGCP.
LITERATURE CITED
Abbott, M.B., J.C. Bathurst, J.A. Cunge, P.E. O’Connel, and J. Ras-mussen, 1986a. An Introduction to the European HydrologicalSystems-Systeme Hydrologique Europeen, ‘SHE’. 1. History andPhilosophy of a Physically Based Distributed Modelling System.Journal of Hydrology 87:45-59.
Abbott, M.B., J.C. Bathurst, J.A. Cunge, P.E. O’Connel, and J. Ras-mussen, 1986b. An Introduction to the European HydrologicalSystems-Systeme Hydrologique Europeen, ‘SHE’. 2. Structure ofa Physically Based Distributed Modelling System. Journal ofHydrology 87:61-77.
Andersen, J., J.C. Refsgaard, and K.H. Jensen, 2001. DistributedHydrological Modelling of the Senegal River Basin – Model Con-struction and Validation. Journal of Hydrology 247:200-214.
ZHANG, WANG, SUN, MCNULTY, ZHANG, LI, ZHANG, KLAGHOFER, AND STRAUSS
JAWRA 1118 JOURNAL OF THE AMERICAN WATER RESOURCES ASSOCIATION

Bergstrom, S., G. Lindstrom, and A. Pettersson, 2002. Multi-Vari-able Parameter Estimation to Increase Confidence in Hydrologi-cal Modeling. Hydrological Process 16:413-421.
Beven, K., 2002. Towards an Alternative Blueprint for a PhysicallyBased Digitally Simulated Hydrologic Response Modeling Sys-tem. Hydrological Process 16:189-206.
Butts, M.B., J.T. Payne, M. Kristensen, and H. Madsen, 2004. AnEvaluation of the Impact of Model Structure on HydrologicalModelling Uncertainty for Streamflow Simulation. Journal ofHydrology 298:242-266.
Cheng, J.H., W.M. Wang, H. Wang, M. Lv, and D.Z. Wang, 1998.On the Dried up of the Yellow River. Journal of Hydraulic Engi-neering 5:75-80 (in Chinese).
Christiaens, K. and J. Feyen, 2001. Analysis of Uncertainties Asso-ciated With Different Methods to Determine Soil HydraulicProperties and Their Propagation in the Distributed Hydrologi-cal MIKE SHE Model. Journal of Hydrology 246:63.
Christiansen, J.S., M. Thorsen, T. Clausen, S. Hansen, and J.C. Ref-sgaard, 2004. Modelling of Macropore Flow and Transport Pro-cesses at Catchment Scale. Journal of Hydrology 299:136-159.
Ciarapica, L. and E. Todini, 2002. TOPKAPI: A Model for the Rep-resentation of the Rainfall-Runoff Process at Different Scales.Hydrological Process 16:207-220.
Davis, S.H., R.A. Vertessy, and R.P. Silberstein, 1999. The Sensi-tivity of a Catchment Model to Soil Hydraulic PropertiesObtained by Using Different Measurement Techniques. Hydro-logical Processes 13:677-688.
Demetriou, C. and J.F. Punthakey, 1999. Evaluating SustainableGroundwater Management Options Using the MIKE SHE Inte-grated Hydrogeological Modelling Package. Environmental Mod-eling and Software 14:129-140.
DHI, 2004. MIKE SHE: An Integrated Hydrological Modeling Sys-tem. Danish Hydraulic Institute, Hørsholm, Denmark.
Downer, C.W., F.L. Ogden, W.D. Martin, and R.S. Harmon, 2002.Theory, Development, and Applicability of the Surface WaterHydrologic Model CASC2D. Hydrological Process 16:255-275.
Fu, B.J., Y. Qiu, J. Wang, and L.D. Chen, 2002. Effect Simulationsof Landuse Change on the Runoff and Erosion for a GullyCatchment of the Loess Plateau, China. Acta Geographica Sini-ca 57(6):717-722 (in Chinese).
Graham, D.N. and M.B. Butts, 2005. Chapter 10 Flexible Inte-grated Watershed Modeling With MIKE SHE. In: WatershedModels, V.P. Singh and D.K. Frevert (Editors). CRC Press, BocaRaton, FL, USA, pp. 245-272.
Hamon, W.R., 1963. Computation of Direct Runoff Amounts FromStorm Rainfall. International Association of Scientific HydrologyPublication 63:52-62.
He, X.B., Z.B. Li, M.D. Hao, K.L. Tang, and F.L. Zheng, 2003.Down-Scale Analysis for Water Scarcity in Response to Soil-Water Conservation on Loess Plateau of China. Agriculture,Ecosystems and Environment 94(3):355-361.
Henriksen, H.J., L. Troldborg, P. Nyegaard, T.O. Sonnenborg, J.C.Refsgaard, and B. Madsen, 2003. Methodology for Construction,Calibration and Validation of a National Hydrological Model forDenmark. Journal of Hydrology 280:52-71.
Huang, M.B. and L. Zhang, 2004. Hydrological Responses to Con-servation Practices in a Catchment of the Loess Plateau, China.Hydrological Processes 18:1885-1898.
Jayatilaka, C.J., B. Storm, and L.B. Mudgway, 1998. Simulation ofWater Flow on Irrigation Bay Scale With MIKESHE. Journal ofHydrology 208:108-130.
Kristensen, K.J. and S.E. Jensen, 1975. A Model for EstimatingActual Evapotranspiration From Potential Evapotranspiration.Nordic Hydrology 6:170-188.
Legates, D.R. and G.J. McCabe, 1999. Evaluating the Use of ‘‘Good-ness-of-fit’’ Measures in Hydrologic and Hydroclimate ModelValidation. Water Resources Research 35(1):233-241.
Li, L., L. Zhang, H. Wang, J. Wang, J.W. Yang, D. Jiang, J. Li,and D. Qin, 2007. Assessing the Impact of Climate Variabilityand Human Activities on Streamflow From the Wuding RiverBasin in China. Hydrological Processes 21:3485-3491.
Li, Y.S., 2001. Effects of Forest on Water Cycles on the Loess Pla-teau. Journal of Natural Resources 10(5):427-432 (in Chinese).
Lu, J. 2006. Modeling Hydrologic Responses to Forest Managementand Climate Change at Contrasting Watersheds in the South-eastern United States. Dissertation, North Carolina State Uni-versity, Raleigh, NC, USA, 147 p.
Luo, L.F., K.L. Zhang, and S.C. Li, 2003. Change in Soil Permeabil-ity and Anti-Scourability of Farmland After Abandonment.Scientia Geographica Sinica 23(6):728-733 (in Chinese).
McMichael, C.E. and A.S. Hope, 2007. Predicting StreamflowResponse to Fire-Induced Landcover Change: Implications ofParameter Uncertainty in the MIKE SHE Model. Journal ofEnvironmental Management 84:245-256.
McVicar, T.R., L.T. Li, T.G. Van Niel, L. Zhang, R. Li, Q.K. Yang,X.P. Zhang, X.M. Mu, Z.M. Wen, W.Z. Liu, Y.A. Zhao, Z.H. Liu,and P. Gao, 2007. Developing a Decision Support Tool for Chi-na’s re-Vegetation Program: Simulating Regional Impacts ofAfforestation on Average Annual Streamflow in the Loess Pla-teau. Forest Ecology and Management 251:65-81.
Madsen, H., 2003. Parameter Estimation in Distributed Hydro-logical Catchment Modelling Using Automatic CalibrationWith Multiple Objectives. Advances in Water Resources26:205-216.
Mu, X.M., C. Basang, L. Zhang, P. Gao, F. Wang, and X.P. Zhang,2007. Impact of Soil Conservation Measures on Runoff and Sedi-ment in Hekou-Longmen Region of the Yellow River. Journal ofSediment Research 2:36-41 (in Chinese).
Ogden, F.L. and P.Y. Julien, 1993. Runoff Sensitivity toTemporal and Spatial Rainfall Variability at Runoff Planeand Small Basin Scales. Water Resources Research29(8):2589-2597.
Ran, D., B. Liu, H. Wang, Q. Luo, and Y. Ma (Editors), 2006.Reduction of Sediment and Storm Flow by Soil and Water Con-servation Measures in Typical Branches of Middle Reach of Yel-low River. Huanhe Water Conservancy Publishing House,Zhengzhou.
Refsgaard, J.C., 1997. Parameterization, Calibration, and Valida-tion of Distributed Hydrological Models. Journal of Hydrology198:69-97.
Senarath, U.S., F.L. Ogden, C.W. Downer, and H.O. Sharif, 2000.On the Calibration and Verification of Two-Dimensional, Dis-tributed, Hortonian, Continuous Watershed Models. WaterResources Research 36(6):1495-1510.
Singh, R., K. Subramanian, and J.C. Refsgaard, 1999. HydrologicalModelling of a Small Watershed Using MIKESHE for IrrigationPlanning. Agricultural Water Management 41:149-166.
Singh, V.P. and D.A. Woolhiser, 2002. Mathematical Modeling ofWatershed Hydrology. Journal of Hydrologic Engineering7(4):270-292.
Stolte, J., B. van Venrooij, G. Zhang, K.O. Trouwborst, G. Liu, C.J.Ritsema, and R. Hessel, 2003. Land-use Induced Spatial Hetero-geneity of Soil Hydraulic Properties on the Loess Plateau inChina. CATENA 54(1):59-75.
Su, R.Q., 1996. Rational Utilization of the Water Resources in theLoess Plateau Region. Journal of Natural Resource 11(1):15-22(In Chinese).
Sun, G., H. Riekerk, and N.B. Comerford, 1998. Modeling theHydrologic Impacts of Forest Harvesting on Flatwoods. Journalof the American Water Resources Association 34:843-854.
Sun, G., Z.Q. Zhang, G.Y. Zhou, and X. Wei, 2007. ForestWatershed Hydrological Simulation Models: Concepts, Use andApplication Problems in China. Journal of Beijing Forestry Uni-versity 29(3):178-184 (in Chinese).
EVALUATION OF THE MIKE SHE MODEL FOR APPLICATION IN THE LOESS PLATEAU, CHINA
JOURNAL OF THE AMERICAN WATER RESOURCES ASSOCIATION 1119 JAWRA

Sun, G., G. Zhou, Z. Zhang, X. Wei, S.G. McNulty, and J.M. Vose,2006. Potential Water Yield Reduction Due to ForestationAcross China. Journal of Hydrology 328(3-4):548-558.
Thompson, J.R., H.R. Sorenson, H. Gavina, and A. Refsgaard,2004. Application of the Coupled MIKE SHE ⁄ MIKE 11 Model-ling System to a Lowland Wet Grassland in Southeast England.Journal of Hydrology 293:151-179.
Van Genuchten, M.Th., 1980. A Closed Form Equation for Predict-ing the Hydraulic Conductivity in Unsaturated Soils. Soil Sci-ence Society American Journal 44:892-898.
V’azquez, R.F. and J. Feyen, 2003. Effect of Potential Evapotrans-piration Estimates on Effective Parameters and Performance ofthe MIKE SHE-Code Applied to a Medium-Size Catchment.Journal of Hydrology 270:309-327.
V’azquez, R.F. and J. Feyen, 2007. Assessment of the Effects ofDEM Gridding on the Predictions of Basin Runoff Using MIKESHE and a Modelling Resolution of 600 m. Journal of Hydrology334:73-87.
V’azquez, R.F., L. Feyen, J. Feyen, and J.C. Refsgaard, 2002. Effectof Grid Size on Effective Parameters and Model Performance ofthe MIKE-SHE Code. Hydrological Process 16:355-372.
Wang, H.J., Z.S. Yang, Y. Saito, J.P. Liu, and X. Sun, 2006. Inter-annual and Seasonal Variation of the Huanghe (Yellow River)Water Discharge Over the Past 50 Years: Connections toImpacts From ENSO Events and Dams. Global and PlanetaryChange 50(3-4):212-225.
Wang, L.X. and Z.Q. Zhang, 2001. Impacts of Forest Vegetation onWatershed Runoff in Dryland Areas. Journal of NaturalResources 16(5):439-444 (in Chinese).
Wang, S.P., 2007. Eco-Hydrological Response of a Small Watershedto Landuse Change and Climate Variation. PhD Dissertation,Beijing Forestry University, Beijing (in Chinese).
Wang, S.P., Z.Q. Zhang, G. Sun, S.G. McNulty, H.Y. Zhang, J.L.Li, and M.L. Zhang, 2008. Long-Term Streamflow Response toClimatic Variability in the Loess Plateau, China. Journal of theAmerican Water Resources Association (JAWRA) 44(5):1098-1107.
Wood, E.F., M. Sivapalan, K. Beven, and L. Band, 1988. Effects ofSpatial Variability and Scale With Implications to HydrologicModelling. Journal of Hydrology 102:29-47.
Woolhiser, D.A., R.E. Smith, and J.V. Giraldez, 1996. Effects ofSpatial Variability of Saturated Hydraulic Conductivity onHortonian Overland Flow. Water Resources Research32(3):671-678.
Xevi, E., K. Christiaens, A. Espino, W. Sewnandan, D. Mallants, H.Sorensen, and J. Feyen, 1997. Calibration, Validation and Sen-sitivity Analysis of the MIKE-SHE Model Using the Neuenkir-chen Catchment as Case Study. Water Resources Management11:219-239.
Zhang, S.L., L. Luvdahl, H. Grip, and Y. Tong, 2005a. Soil Hydrau-lic Properties of two Loess Soils in China Measured by VariousField-Scale and Laboratory Methods. CATENA 69(3):264-273.
Zhang, X.J. and W. Liu, 2005. Simulating Potential Response ofHydrology, Soil Erosion, and Crop Productivity to ClimateChange in Changwu Tablel and on Southern Loess Plateau ofChina. Agricultural and Forest Meteorology 131:127-142.
Zhang, Z.Q., S.P. Wang, G. Sun, M.L. Zhang, and J.L. Li, 2005b.Response of Sediment Yield to Land-Use Change in LuergouWatershed in the Loess Plateau, Gansu Province, WesternChina. Chinese Journal of Applied Ecology 16(9):1607-1612 (inChinese).
ZHANG, WANG, SUN, MCNULTY, ZHANG, LI, ZHANG, KLAGHOFER, AND STRAUSS
JAWRA 1120 JOURNAL OF THE AMERICAN WATER RESOURCES ASSOCIATION