evaluation of the multimodal level of service (los) analysis · background •hcm 2010 - changes to...
TRANSCRIPT

B A S E D O N T H E H I G H W A Y C A P A C I T Y M A N U A L ( H C M 2 0 1 0 ) U R B A N S T R E E T L E V E L O F S E R V I C E ( L O S )
A N A L Y S I S M E T H O D O L O G I E S
EVALUATION OF THE MULTIMODAL LEVEL OF SERVICE (LOS) ANALYSIS

AGENDA
• Goals
• Background
• 2010 HCM Methodology Evaluation
• Alternative Multimodal LOS Models

GOALS
• Assess the quality of various multimodal
level-of-service (MMLOS) evaluation tools to
simply and reliably provide results that are
meaningful to decision makers
• Improve confidence in the quality of the
MMLOS tools used to assess multimodal
facilities and projects
BACKGROUND
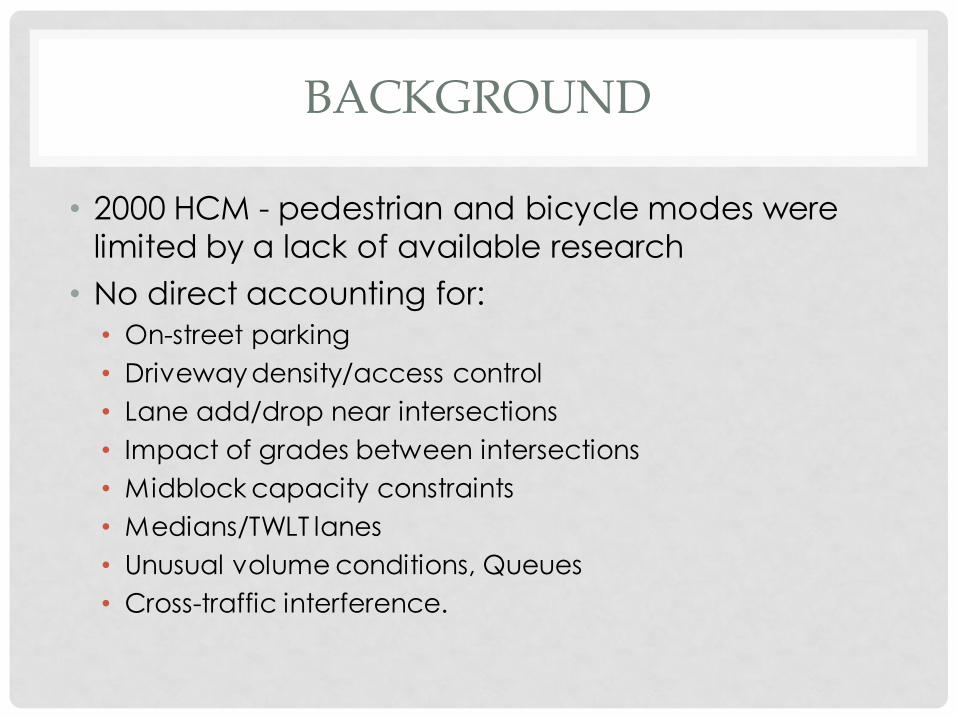
• 2000 HCM - pedestrian and bicycle modes were
limited by a lack of available research
• No direct accounting for:
• On-street parking
• Driveway density/access control
• Lane add/drop near intersections
• Impact of grades between intersections
• Midblock capacity constraints
• Medians/TWLT lanes
• Unusual volume conditions, Queues
• Cross-traffic interference.
BACKGROUND
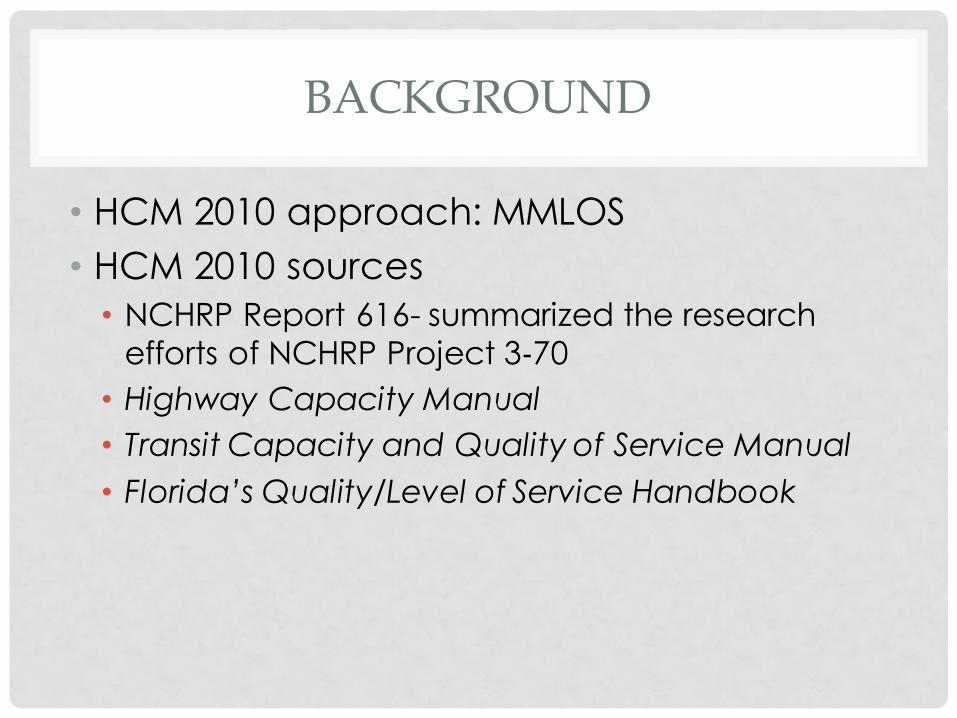
• HCM 2010 approach: MMLOS
• HCM 2010 sources
• NCHRP Report 616- summarized the research
efforts of NCHRP Project 3‐70
• Highway Capacity Manual
• Transit Capacity and Quality of Service Manual
• Florida’s Quality/Level of Service Handbook

BACKGROUND
• The HCM 2010 provides a common LOS
scoring system for the pedestrian, bicycle,
and transit modes.
• LOS model incorporates research on
bicyclists’ and pedestrians’ perceptions.
• Provides a new definition of an urban street
segment and combines link and intersection
scores into a single LOS.

BACKGROUND
• HCM 2010 - Changes to Pedestrian Methodology
• Largely adopts the recommendations of NCHRP Report 616.
• Link LOS is based on the FDOT Q/LOS methodology.
• Differs from the previous HCM as follows: • Estimate of delay at boundary intersections;
• Estimate of the difficulty of crossing the street segment in the LOS Segment Score; and
• Combines the LOS Segment Score with a LOS score for Pedestrian Space to determine the overall Pedestrian LOS.

BACKGROUND
• HCM 2010 - Changes to Bicycle Methodology
• Largely adopts the recommendations of NCHRP
Report 616.
• Link LOS is based on the FDOT Q/LOS
methodology.
• Expands on the previous HCM in several ways:
• Accounts for traffic control and integrates an estimate of
delay and LOS at boundary intersections;
• Accounts for the affect of access points along the right
side of the street.
CRITICAL METHODOLOGY FINDINGS
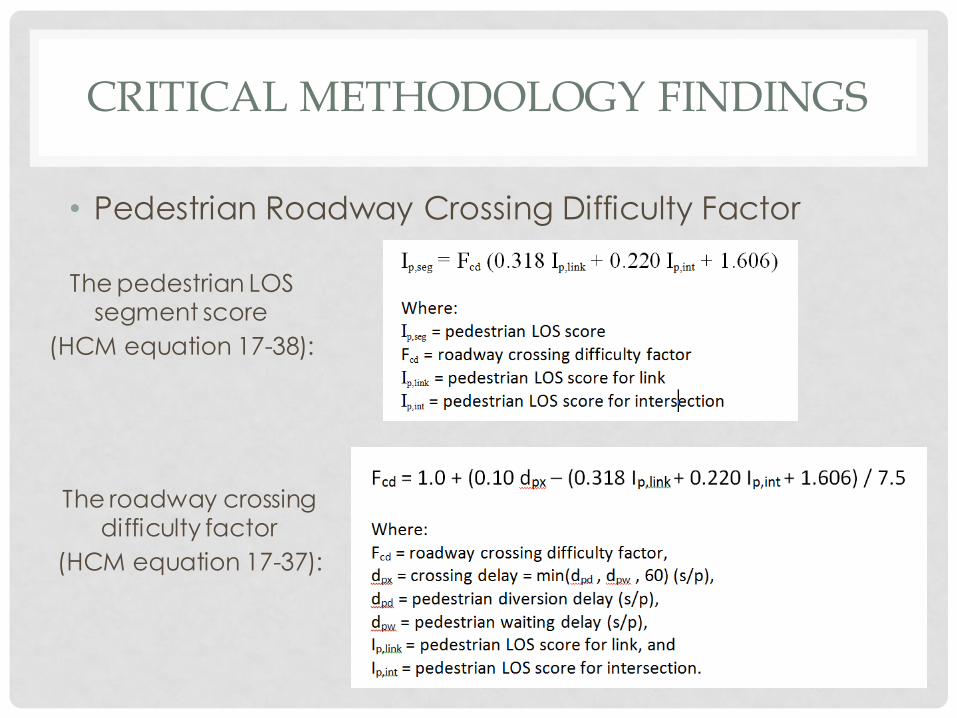
• Pedestrian Roadway Crossing Difficulty Factor
The pedestrian LOS
segment score
(HCM equation 17-38):
The roadway crossing difficulty factor
(HCM equation 17-37):

CRITICAL METHODOLOGY FINDINGS
• Pedestrian Roadway Crossing Difficulty Factor
• Ped Waiting Delay input has a significant effect
• A value for ped waiting delay isn’t necessary for segments
without legal uncontrolled crossings.
• A one second increase in Pedestrian Waiting Delay results in
the largest possible impact on the Roadway Crossing
Difficulty Factor.

CRITICAL METHODOLOGY FINDINGS
• Pedestrian Roadway Crossing Difficulty Factor

CRITICAL METHODOLOGY FINDINGS
• Bicycle Mode Methodology
The bicycle segment LOS score (HCM equation 17-45):
The bicycle segment LOS table
(HCM exhibit 17-4):

CRITICAL METHODOLOGY FINDINGS
• Bicycle Mode Methodology
• The Bicycle Segment LOS Score can never be lower than
2.85, which limits the LOS range between LOS C to F.
• The number of access points has a significant affect on the
Segment LOS.

MULTIMODAL LOS METHODOLOGY SENSITIVITY ANALYSIS
• The baseline roadway segment was tested by
varying the following key attributes:
• Number of Access Points
• On-street Parking Occupancy Proportion
• Bicycle Lane Width
• Outside Lane Width
• Traffic volumes levels (100, 200, 500, 1,000, 1,500, and 2,000
vph)
2
2.5
3
3.5
4
4.5
5
5.5
6
6.5
7
7.5
8
8.5
9
9.5
10
0 1 2 3 4 5 6 7 8 9 9.9
HC
M 2
01
0 S
egm
en
t LO
S Sc
ore
Bicycle Lane Width
Urban Street Segment LOS vs. Bike Lane Width
Pedestrian Mode (Adjacent Traffic: 100 vph) Bike Mode (Adjacent Traffic: 100 vph)
Pedestrian Mode (Adjacent Traffic: 200 vph) Bike Mode (Adjacent Traffic: 200 vph)
Pedestrian Mode (Adjacent Traffic: 500 vph) Bike Mode (Adjacent Traffic: 500 vph)
Pedestrian Mode (Adjacent Traffic: 1000 vph) Bike Mode (Adjacent Traffic: 1000 vph)
Pedestrian Mode (Adjacent Traffic: 1500 vph) Bike Mode (Adjacent Traffic: 1500 vph)
Pedestrian Mode (Adjacent Traffic: 2000 vph) Bike Mode (Adjacent Traffic: 2000 vph)
LOS B
LOS C
LOS D
LOS E
LOS F
2
2.5
3
3.5
4
4.5
5
5.5
6
6.5
7
7.5
8
8.5
9
9.5
10
9 10 11 12 13 14 15 16
HC
M 2
01
0 S
egm
en
t LO
S Sc
ore
Outside Lane Width
Urban Street Segment LOS vs. Outside Lane Width
Pedestrian Mode (Adjacent Traffic: 100 vph) Bike Mode (Adjacent Traffic: 100 vph)
Pedestrian Mode (Adjacent Traffic: 200 vph) Bike Mode (Adjacent Traffic: 200 vph)
Pedestrian Mode (Adjacent Traffic: 500 vph) Bike Mode (Adjacent Traffic: 500 vph)
Pedestrian Mode (Adjacent Traffic: 1000 vph) Bike Mode (Adjacent Traffic: 1000 vph)
Pedestrian Mode (Adjacent Traffic: 1500 vph) Bike Mode (Adjacent Traffic: 1500 vph)
Pedestrian Mode (Adjacent Traffic: 2000 vph) Bike Mode (Adjacent Traffic: 2000 vph)
LOS B
LOS C
LOS D
LOS E
LOS F
2
2.5
3
3.5
4
4.5
5
5.5
0% 10% 20% 30% 40% 50% 60% 70% 80% 90% 100%
HC
M 2
01
0 S
egm
en
t LO
S Sc
ore
On-street Parking Occupancy
Urban Streets Segment LOS vs. On-street Parking Occupancy
Pedestrian Mode (Adjacent Traffic: 100 vph) Bike Mode (Adjacent Traffic: 100 vph)Pedestrian Mode (Adjacent Traffic: 200 vph) Bike Mode (Adjacent Traffic: 200 vph)Pedestrian Mode (Adjacent Traffic: 500 vph) Bike Mode (Adjacent Traffic: 500 vph)Pedestrian Mode (Adjacent Traffic: 1000 vph) Bike Mode (Adjacent Traffic: 1000 vph)Pedestrian Mode (Adjacent Traffic: 1500 vph) Bike Mode (Adjacent Traffic: 1500 vph)Pedestrian Mode (Adjacent Traffic: 2000 vph) Bike Mode (Adjacent Traffic: 2000 vph)
LOS B
LOS C
LOS D
LOS E
LOS F
2
2.5
3
3.5
4
4.5
5
5.5
6
6.5
7
0 1 2 3 4 5 6 7 8 9 10 11 12 13 14 15 16 17 18 19 20
HC
M 2
01
0 S
egm
en
t LO
S Sc
ore
Number of Access Points per Segment
Urban Streets Segment LOS vs. Access Points
Pedestrian Mode (Adjacent Traffic: 100 vph) Bike Mode (Adjacent Traffic: 100 vph)
Pedestrian Mode (Adjacent Traffic: 200 vph) Bike Mode (Adjacent Traffic: 200 vph)
Pedestrian Mode (Adjacent Traffic: 500 vph) Bike Mode (Adjacent Traffic: 500 vph)
Pedestrian Mode (Adjacent Traffic: 1000 vph) Bike Mode (Adjacent Traffic: 1000 vph)
Pedestrian Mode (Adjacent Traffic: 1500 vph) Bike Mode (Adjacent Traffic: 1500 vph)
Pedestrian Mode (Adjacent Traffic: 2000 vph) Bike Mode (Adjacent Traffic: 2000 vph)
LOS B
LOS C
LOS D
LOS E
LOS F
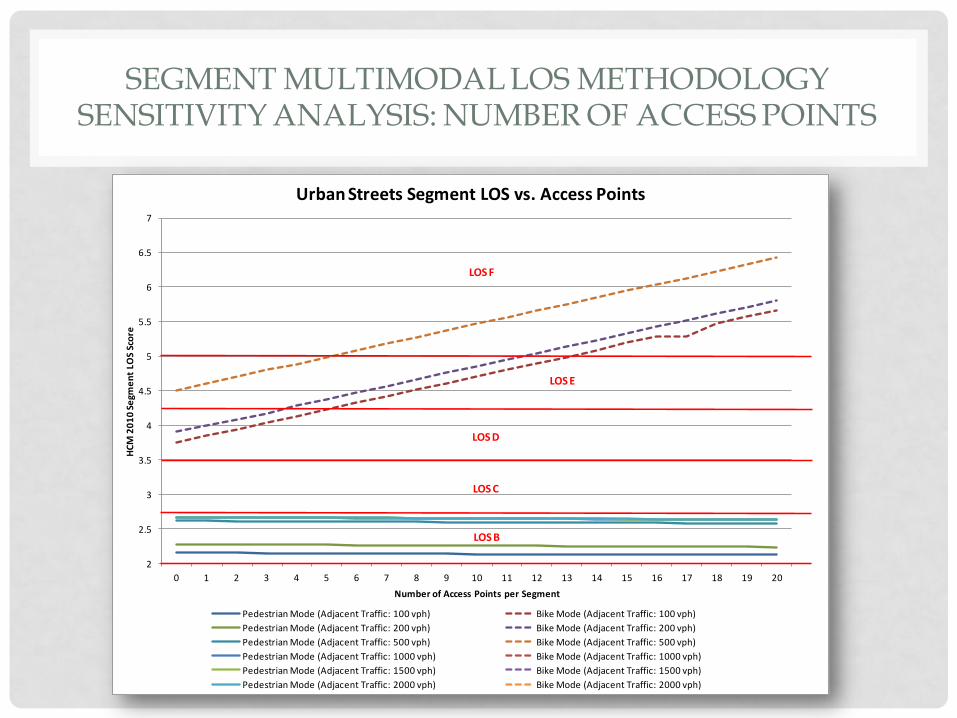
SEGMENT MULTIMODAL LOS METHODOLOGY SENSITIVITY ANALYSIS: NUMBER OF ACCESS POINTS
2
2.5
3
3.5
4
4.5
5
5.5
6
6.5
7
0 1 2 3 4 5 6 7 8 9 10 11 12 13 14 15 16 17 18 19 20
HC
M 2
01
0 S
egm
en
t LO
S Sc
ore
Number of Access Points per Segment
Urban Streets Segment LOS vs. Access Points
Pedestrian Mode (Adjacent Traffic: 100 vph) Bike Mode (Adjacent Traffic: 100 vph)
Pedestrian Mode (Adjacent Traffic: 200 vph) Bike Mode (Adjacent Traffic: 200 vph)
Pedestrian Mode (Adjacent Traffic: 500 vph) Bike Mode (Adjacent Traffic: 500 vph)
Pedestrian Mode (Adjacent Traffic: 1000 vph) Bike Mode (Adjacent Traffic: 1000 vph)
Pedestrian Mode (Adjacent Traffic: 1500 vph) Bike Mode (Adjacent Traffic: 1500 vph)
Pedestrian Mode (Adjacent Traffic: 2000 vph) Bike Mode (Adjacent Traffic: 2000 vph)
LOS B
LOS C
LOS D
LOS E
LOS F

SEGMENT MULTIMODAL LOS METHODOLOGY SENSITIVITY ANALYSIS: ON-STREET PARKING
OCCUPANCY PROPORTION
2
2.5
3
3.5
4
4.5
5
5.5
0% 10% 20% 30% 40% 50% 60% 70% 80% 90% 100%
HC
M 2
01
0 S
egm
en
t LO
S Sc
ore
On-street Parking Occupancy
Urban Streets Segment LOS vs. On-street Parking Occupancy
Pedestrian Mode (Adjacent Traffic: 100 vph) Bike Mode (Adjacent Traffic: 100 vph)Pedestrian Mode (Adjacent Traffic: 200 vph) Bike Mode (Adjacent Traffic: 200 vph)Pedestrian Mode (Adjacent Traffic: 500 vph) Bike Mode (Adjacent Traffic: 500 vph)Pedestrian Mode (Adjacent Traffic: 1000 vph) Bike Mode (Adjacent Traffic: 1000 vph)Pedestrian Mode (Adjacent Traffic: 1500 vph) Bike Mode (Adjacent Traffic: 1500 vph)Pedestrian Mode (Adjacent Traffic: 2000 vph) Bike Mode (Adjacent Traffic: 2000 vph)
LOS B
LOS C
LOS D
LOS E
LOS F

SEGMENT MULTIMODAL LOS METHODOLOGY SENSITIVITY ANALYSIS: BICYCLE LANE WIDTH
2
2.5
3
3.5
4
4.5
5
5.5
6
6.5
7
7.5
8
8.5
9
9.5
10
0 1 2 3 4 5 6 7 8 9 9.9
HC
M 2
01
0 S
egm
en
t LO
S Sc
ore
Bicycle Lane Width
Urban Street Segment LOS vs. Bike Lane Width
Pedestrian Mode (Adjacent Traffic: 100 vph) Bike Mode (Adjacent Traffic: 100 vph)
Pedestrian Mode (Adjacent Traffic: 200 vph) Bike Mode (Adjacent Traffic: 200 vph)
Pedestrian Mode (Adjacent Traffic: 500 vph) Bike Mode (Adjacent Traffic: 500 vph)
Pedestrian Mode (Adjacent Traffic: 1000 vph) Bike Mode (Adjacent Traffic: 1000 vph)
Pedestrian Mode (Adjacent Traffic: 1500 vph) Bike Mode (Adjacent Traffic: 1500 vph)
Pedestrian Mode (Adjacent Traffic: 2000 vph) Bike Mode (Adjacent Traffic: 2000 vph)
LOS B
LOS C
LOS D
LOS E
LOS F
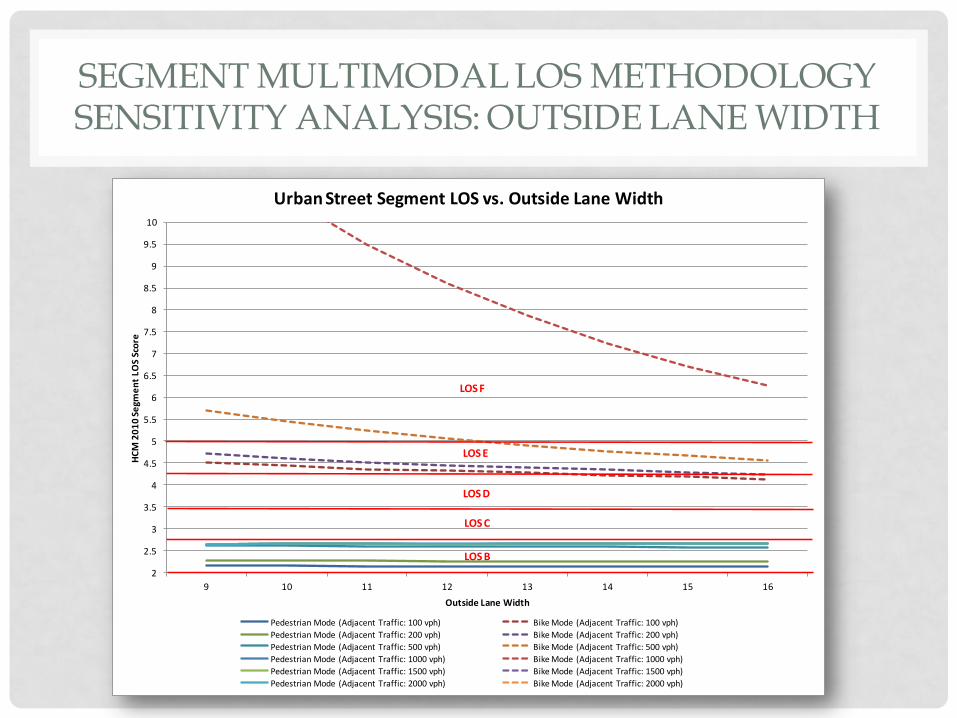
SEGMENT MULTIMODAL LOS METHODOLOGY SENSITIVITY ANALYSIS: OUTSIDE LANE WIDTH
2
2.5
3
3.5
4
4.5
5
5.5
6
6.5
7
7.5
8
8.5
9
9.5
10
9 10 11 12 13 14 15 16
HC
M 2
01
0 S
egm
en
t LO
S Sc
ore
Outside Lane Width
Urban Street Segment LOS vs. Outside Lane Width
Pedestrian Mode (Adjacent Traffic: 100 vph) Bike Mode (Adjacent Traffic: 100 vph)
Pedestrian Mode (Adjacent Traffic: 200 vph) Bike Mode (Adjacent Traffic: 200 vph)
Pedestrian Mode (Adjacent Traffic: 500 vph) Bike Mode (Adjacent Traffic: 500 vph)
Pedestrian Mode (Adjacent Traffic: 1000 vph) Bike Mode (Adjacent Traffic: 1000 vph)
Pedestrian Mode (Adjacent Traffic: 1500 vph) Bike Mode (Adjacent Traffic: 1500 vph)
Pedestrian Mode (Adjacent Traffic: 2000 vph) Bike Mode (Adjacent Traffic: 2000 vph)
LOS B
LOS C
LOS D
LOS E
LOS F

LINK MULTIMODAL LOS METHODOLOGY SENSITIVITY ANALYSIS: NUMBER OF ACCESS POINTS

LINK MULTIMODAL LOS METHODOLOGY SENSITIVITY ANALYSIS: ON-STREET PARKING OCCUPANCY
PROPORTION
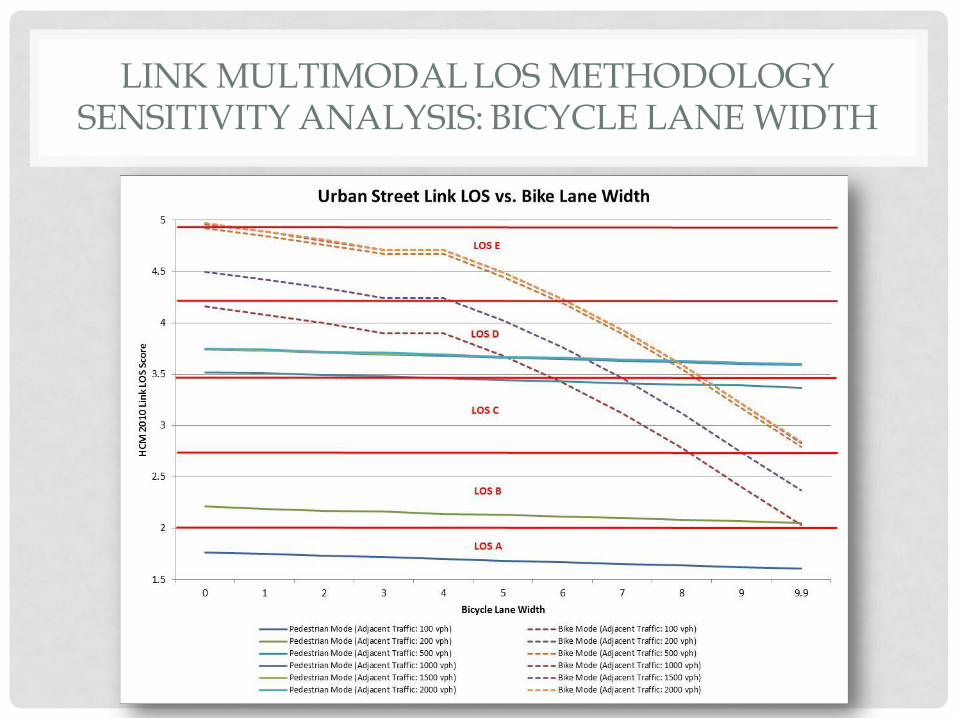
LINK MULTIMODAL LOS METHODOLOGY SENSITIVITY ANALYSIS: BICYCLE LANE WIDTH
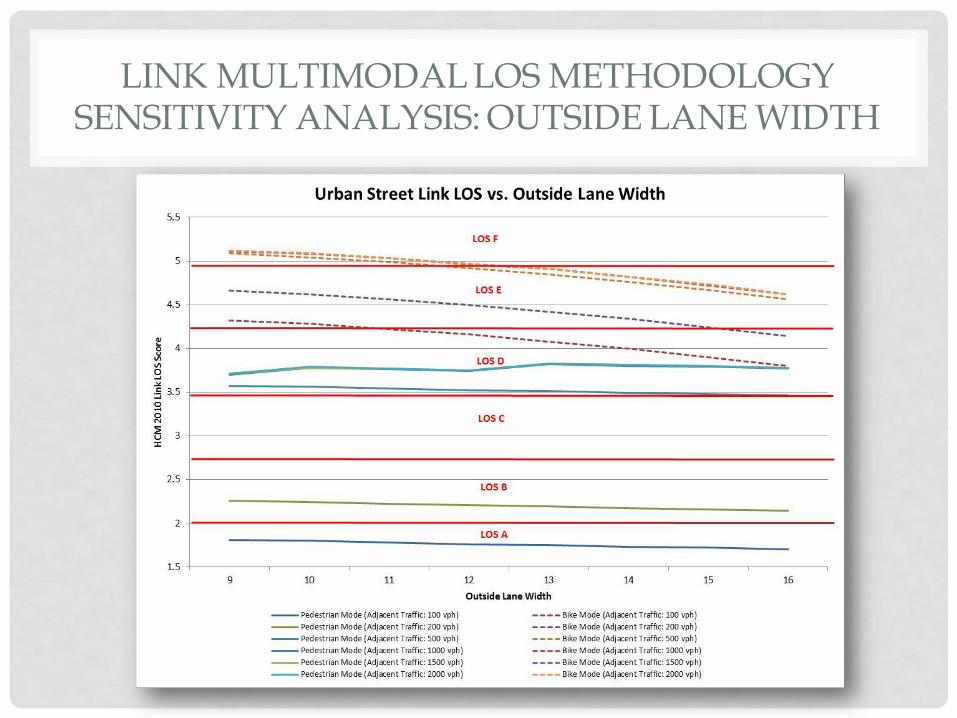
LINK MULTIMODAL LOS METHODOLOGY SENSITIVITY ANALYSIS: OUTSIDE LANE WIDTH
EXISTING METHODOLOGY SUMMARY
• The HCM 2010 Urban Street LOS methodology is a data-intensive and complex operational model for non-automotive transportation
• Pedestrian Waiting Delay heavily influences LOS and returns illogical results when equal to 0.
• The Bicycle mode segment methodology limits results to LOS C or greater.
• The sensitivity analyses indicates the following: • Varying geometric attributes of the street has minimal
impact on the pedestrian segment LOS.
• Varying the number of access points, outside lane width, and bicycle lane width have a significant impact on the bicycle segment LOS results.

EXISTING METHODOLOGY SUMMARY
• An alternative approach for multimodal design
projects may be to rely on the results of the
pedestrian and bicycle link analysis:
• The Pedestrian and Bicycle Link LOS results show greater
sensitivity .
• Provides a full range of results (LOS A to F).
ALTERNATIVE MULTIMODAL LOS MODEL OPTIONS
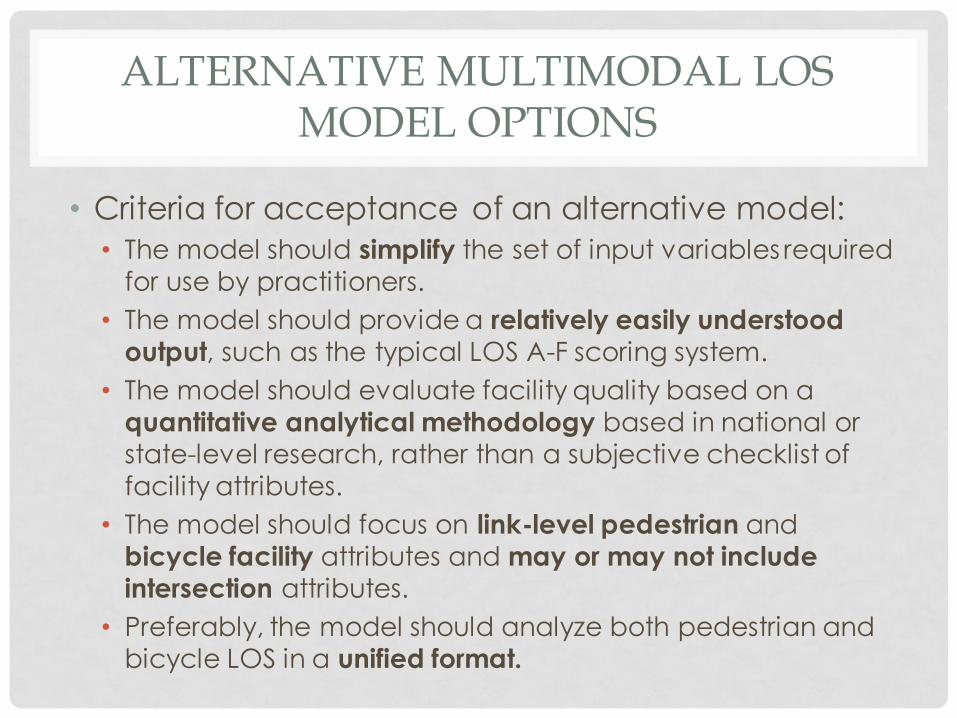
• Criteria for acceptance of an alternative model:
• The model should simplify the set of input variables required
for use by practitioners.
• The model should provide a relatively easily understood
output, such as the typical LOS A-F scoring system.
• The model should evaluate facility quality based on a
quantitative analytical methodology based in national or
state-level research, rather than a subjective checklist of
facility attributes.
• The model should focus on link-level pedestrian and
bicycle facility attributes and may or may not include
intersection attributes.
• Preferably, the model should analyze both pedestrian and
bicycle LOS in a unified format.

ALTERNATIVE MULTIMODAL LOS MODEL OPTIONS
• Key variables affecting multimodal LOS:
Pedestrian Mode Variables Bicycle Mode Variables
Average Pedestrian Space
Walkway Presence/Width
On-street Parking
Adjacent Traffic Volume
Adjacent Traffic Speed
Street Crossing Delay/Difficulty
Bicycle Lane Presence/Width
Adjacent Traffic Volume
Adjacent Traffic Speed
On-street Parking
Pavement Condition
Conflicting Access Points
ALTERNATIVE MULTIMODAL LOS MODEL OPTIONS
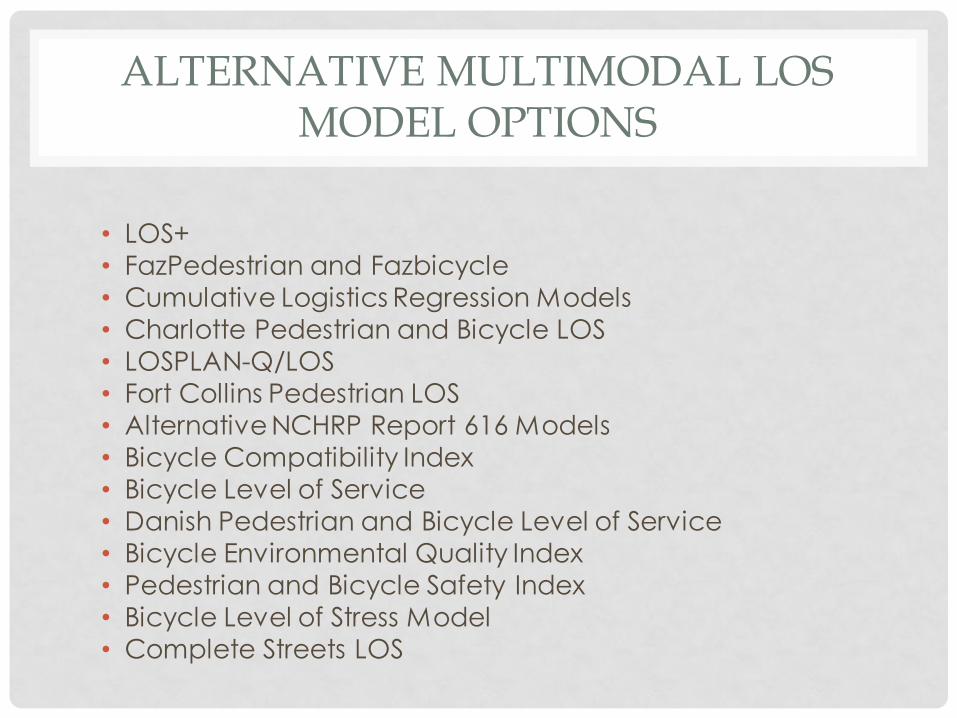
• LOS+
• FazPedestrian and Fazbicycle
• Cumulative Logistics Regression Models
• Charlotte Pedestrian and Bicycle LOS
• LOSPLAN-Q/LOS
• Fort Collins Pedestrian LOS
• Alternative NCHRP Report 616 Models
• Bicycle Compatibility Index
• Bicycle Level of Service
• Danish Pedestrian and Bicycle Level of Service
• Bicycle Environmental Quality Index
• Pedestrian and Bicycle Safety Index
• Bicycle Level of Stress Model
• Complete Streets LOS

ALTERNATIVE MULTIMODAL LOS MODEL OPTIONS
• Most promising alternatives:
• LOS Plus.
• FDOT LOSPLAN-Q/LOS.
• Alternative NCHRP Report 616 Models.
• Cumulative Logistics Regression Models.
• Bicycle Compatibility Index (BCI).
• Bicycle Level of Stress Model.
ALTERNATIVE MULTIMODAL LOS MODEL OPTIONS
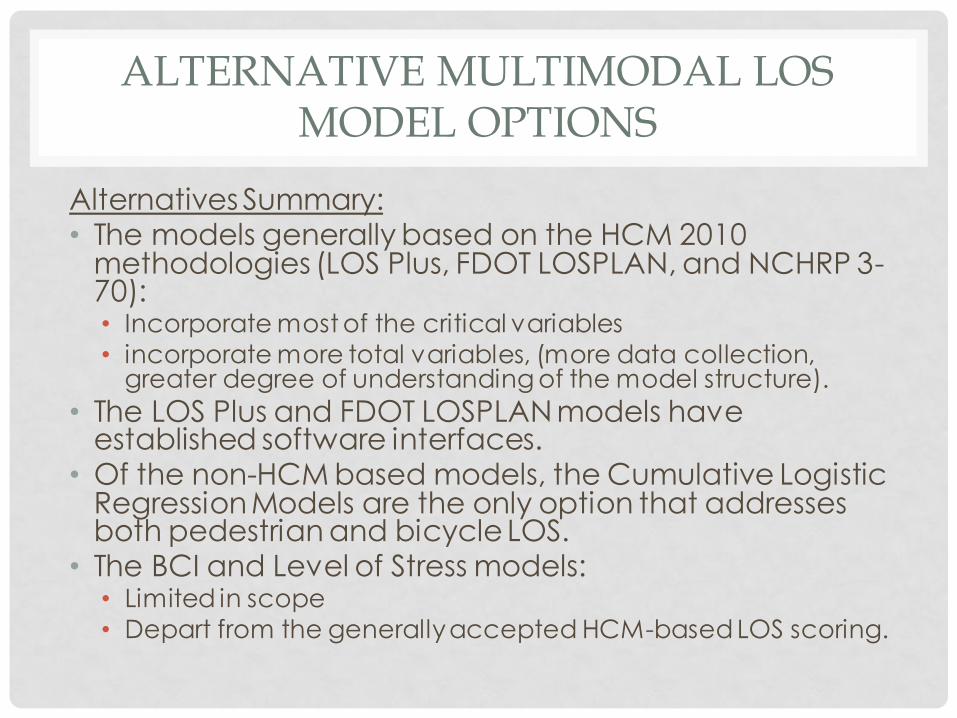
Alternatives Summary: • The models generally based on the HCM 2010
methodologies (LOS Plus, FDOT LOSPLAN, and NCHRP 3-70): • Incorporate most of the critical variables
• incorporate more total variables, (more data collection, greater degree of understanding of the model structure).
• The LOS Plus and FDOT LOSPLAN models have established software interfaces.
• Of the non-HCM based models, the Cumulative Logistic Regression Models are the only option that addresses both pedestrian and bicycle LOS.
• The BCI and Level of Stress models: • Limited in scope
• Depart from the generally accepted HCM-based LOS scoring.

FUTURE CONSIDERATIONS
• Identify supplemental studies
• Review other alternative methodologies warranting
further exploration

QUESTIONS