evaluation of the sony gdm-f520 - defense technical .... makes any warranty or representation,...
TRANSCRIPT

The Sony GDM-F520 21 inch, flat face monitor (NIDL paid $1700) has excellent image quality and features that make it an excellent display device for NIMA Imagery Exploitation Capability workstations. The improved electronics of the GDM-F520 allow this monitor to display 1024 x 1024 pixel stereo images at 60.5 Hz per eye (121 Hz vertical refresh rate), which exceeds the IEC specification of 60 Hz per eye. The vertical refresh rate for the 1024 x 1024 or the 1280 x 1024 stereo formats could be increased to as high as 128 Hz. NIDL rates this color monitor “A” in monoscopic mode and “A” in stereoscopic mode and thereby certifies the 21 inch Sony GDM-F520 color monitor as being suitable for IEC workstations for both monoscopic and stereoscopic modes. Briggs Scores for the BTP #4 Delta-1, Delta-3, Delta-7 and Delta-15 contrast ratio targets sets averaged 8, 46, 57 and 61, respectively, for the GDM-F520 monitor in 1600 x 1200 monoscopic mode. These scores are comparable to the Sony 24 inch FW900 monitor, and slightly better than the scores for the ViewSonic P815, and for the Cornerstone p1700 and p1750 monitors.
Evaluation of the Sony GDM-F520 21-Inch Diagonal Color CRT Monitor
for Monoscopic and Stereoscopic Imagery
National Technology Alliance
National Information Display Laboratory P. O. Box 8619
Princeton, NJ 08543-8619 Tel: (609) 951-0150 Fax: (609) 734-2313
e-mail: [email protected]
Publication No. 750811001-128
December 21, 2001
NOTICE: The National Information Display Laboratory (NIDL) at the Sarnoff Corporation prepared this report. Neither the NIDL nor any person acting on their behalf: A. Makes any warranty or representation, expressed or implied, with respect to the use of any information contained
in this report, or that the use of any information, apparatus, method, or process disclosed in this report is free from infringement of any third party rights; or
B. Makes any endorsement of any of the products reported on herein; or C. Assumes any liabilities with respect to the use of, or for damages resulting from the use of, any information,
apparatus, method, or process disclosed in this report.
NIDL

Report Documentation Page
Report Date 21122001
Report Type N/A
Dates Covered (from... to) -
Title and Subtitle Evaluation of the Sony GDM-F520 21-Inch Diagonal ColorCRT Monitor for Monoscopic and Stereoscopic Imagery
Contract Number
Grant Number
Program Element Number
Author(s) Project Number
Task Number
Work Unit Number
Performing Organization Name(s) and Address(es) National Information Display Laboratory P. O. Box 8619Princeton, NJ 08543-8619
Performing Organization Report Number
Sponsoring/Monitoring Agency Name(s) and Address(es) Sponsor/Monitor’s Acronym(s)
Sponsor/Monitor’s Report Number(s)
Distribution/Availability Statement Approved for public release, distribution unlimited
Supplementary Notes The original document contains color images.
Abstract
Subject Terms
Report Classification unclassified
Classification of this page unclassified
Classification of Abstract unclassified
Limitation of Abstract UU
Number of Pages 69

-ii- NIDL
Use or disclosure of data on this sheet is subject to the restrictions on the cover and title of this report.
CONTENTS
NIDL IEC Monitor Certification Report........................................................... iii
Evaluation Datasheet for Sony GDM-F500R and Sony GDM-F520...............viii Evaluation Datasheet for Sony GDM-FW900 and Sony GDM-F520................ ix Evaluation Datasheet for ViewSonic P815-4 and Sony GDM-F520.................. x Evaluation Datasheet for Cornerstone P1700 and Sony GDM-F520 ................ xi
Section I INTRODUCTION ............................................................................. 12
I.1. Manufacturer’s Specifications for the Sony GDM-F520 Monitor ............... 2 I.2. Initial Monitor Set Up.................................................................................... 4 I.3. Equipment ...................................................................................................... 4
Section II PHOTOMETRIC MEASUREMENTS ........................................... 5
II.1. Dynamic range and Screen Reflectance....................................................... 5 II.2. Maximum Luminance (Lmax) in Monoscopic and Stereo Modes .............. 7 II.3. Luminance at Lmax and Color Uniformity.................................................. 8 II.4. Halation ...................................................................................................... 11 II.5. Color Temperature...................................................................................... 13 II.6. Bit Depth..................................................................................................... 14 II.8. Luminance Step Response ......................................................................... 21 II.9. Monoscopic and Stereoscopic Addressability ........................................... 22 II.10. Pixel Aspect Ratio .................................................................................... 23 II.11. Screen Size (Viewable Active Image) ..................................................... 23 II.12. Contrast Modulation................................................................................. 25 II.13. Pixel Density ............................................................................................ 27 II.14. Moiré ........................................................................................................ 28 II.15. Straightness .............................................................................................. 29 II.16. Refresh Rate ............................................................................................. 32 II.17. Extinction Ratio........................................................................................ 33 II.18. Linearity.................................................................................................... 40 II.19. Jitter/Swim/Drift....................................................................................... 43 II.20. Warm-up Period ....................................................................................... 45 II. 21. Briggs Scores........................................................................................... 46 II. 22. Output Luminance with Color Temperature Setting .............................. 49 II. 23. Electron Beam Line Width and RAR...................................................... 50 II. 24. Electron Beam Line Contrast .................................................................. 54 II. 25. Electron Beam Spot Size......................................................................... 55

Sony GDM-F520 21-inch Color CRT Monitor -iii-
Use or disclosure of data on this sheet is subject to the restrictions on the cover and title of this report.
NIDL IEC Monitor Certification Report
The Sony GDM F520 Color CRT Monitor
FINAL GRADES
Monoscopic Mode: A Stereoscopic Mode: A
A=Substantially exceeds IEC Requirements; B= Meets IEC Requirements; C=Nearly meets
IEC Requirements; F=Fails to meet IEC Requirements in a substantial way. Color monitors are more difficult to evaluate and their performance may not compare to monochrome monitors. Color monitors have three electron guns (R, G, and B) to focus and converge. They also have a perforated steel shadow mask that separates the colors on the screen and this adds complexity. Color lines formed on the phosphor screen may not be as narrow as for a monochrome, single electron gun-formed spot. The color monitor’s light output may not be as high. The IEC monitor specifications for color monitors reflect this difference, and have lower luminance and stereo extinction ratio requirements than a monochrome monitor. In spite of these limitations, Imagery and Geospatial Analysts at a number of sites may do all their analyses on color monitors. NIDL was looking for a color monitor that would perform both monoscopic and stereoscopic tasks on an IEC workstation, particularly since the NIDL-certified Cornerstone P1700 is no longer being manufactured. Based on the excellent published manufacturer’s specifications, we decided this monitor has the potential for satisfying the IEC Working Group specifications for both stereoscopic and monoscopic IA and GI specific tasks. Since Sony did not provide a monitor for loan, NIDL purchased the monitor and then proceeded with our tests. We found the Sony GDM-F520 21 inch, flat face monitor (NIDL paid $1700) has excellent image quality and features that make it an excellent display device for NIMA Imagery Exploitation Capability workstations. It has a phosphor pitch of 0.22 mm over the entire face and 2048 x 1536 pixel maximum addressability. NIDL has verified that this monitor achieves stereo mode operation at 1024 x 1024 addressability at 120 Hz and also at 1280 x 1024 at 120 Hz. NIDL rates this color monitor “A” in monoscopic mode and “A” in stereoscopic mode and thereby certifies the 21 inch Sony GDM-F520 color monitor as being suitable for IEC workstations for both monoscopic and stereoscopic modes. NIDL tested the monitor at an addressability of 1600 x 1200 pixels, as would be used in an IEC W2K PC–based workstation. Our tests show that the monoscopic contrast modulation is excellent and exceeds 43% in Zone A and 41% over the face of the whole CRT, well above the IEC minimum performance values. The reliability of the Sony GDM-F520 monitor is expected to be excellent; it has a limited warranty of 3 years for parts, labor and the CRT. Briggs Scores for the BTP #4 Delta-1, Delta-3, Delta-7 and Delta-15 contrast ratio targets sets averaged 8, 46, 57 and 61, respectively, for the GDM-F520 monitor. These scores were comparable to the FW900 monitor and slightly better than the scores for the ViewSonic P815 monitor.

-iv- NIDL
Use or disclosure of data on this sheet is subject to the restrictions on the cover and title of this report.
The color temperature can be preset to 5000, 6500, and 9300K, or can be adjusted by the user from 5000 to 11000K. Adjusting the color temperature somewhat affects the output luminance of the monitor. The luminance of a white full screen, Lmax, is approximately 15% higher at 9300K (34fL) compared to 6500K (30fL). Other color features include: variable RGB gain/bias and the sRGB color display system. NIMA has stated that color reproducibility over time is an important feature for IEC workstations. Accordingly, NIDL demonstrated for the Sony GDM-FW900 monitor that the CIE x and y coordinates can be reproduced over a period of five months by using the Sony factory default button on the front panel and adjusting Lmin to 0.1 fL. In this way, accuracy of color reproduction can be assured. NIDL recommends periodic use of the color default setting to assure accurate color reproduction over time for the Sony GDM-F520 monitor as well. The manufacturer lists the maximum addressability for the Sony F520 as 2048 x 1536 pixels. However, the horizontal phosphor pitch of 0.22 mm limits the number of red, green and blue phosphor stripes that can be addressed to fewer than 2048 pixels in the horizontal direction. As evaluated, NIDL's measurements for a viewable image size of 15.288 x 11.405 inches indicate a maximum of 1765 pixels in the horizontal direction based on the horizontal phosphor pitch. The manufacturer recommended addressability setting is 1600 x 1200 at 85Hz. The improved electronics of the GDM-F520 allow this monitor to display 1024 x 1024 pixel stereo images at 60.5 Hz per eye (121 Hz vertical refresh rate), which is exceeds the IEC specification of 60 Hz per eye. The monitor exceeds the IEC stereo extinction ratio specification of 15:1 with the StereoGraphics CrystalEyes shutter glasses and achieves 26:1 at 60.5 Hz per eye. The stereo extinction ratio at 60.5 Hz per eye with the StereoGraphics ZScreen is 12:1. With a value of 6.1 fL at the analyst’s eye position, the Sony GDM-F520 meets the IEC luminance specification in the stereoscopic mode. The Sony GDM-F520 monitor is described in the Manufacturer’s Specifications in the section below and on the Sony website: http://www.ita.sel.sony.com/support/displays/legacy/specs/gdmf520.pdf The Sony GDM-F520 passes all the IEC Working Group specifications for monoscopic and stereoscopic modes. Highlights of NIDL’s evaluation results for the Sony GDM-520 monitor are summarized below: • Full screen white-to-black contrast ratio measured in 1600 x 1200 format is 315:1 (25.0 dB
dynamic range) in a dark room. With a measured screen reflectance of 6.2%, the contrast ratio decreases to 142:1 (21.5 dB) in 2-fc diffuse ambient illumination.
• The luminance of a white full screen, Lmax, was 31.8 fL at 6500K measured at screen center in 1600 x 1200 format and exceeded the 30 fL minimum value. Lmax was 33.6 fL at a CCT of 9300K.
• Lmax can vary with luminance mode from 20.9 fL in the professional mode to 25.4 fL in the standard mode, and to 29.5 fL in the dynamic mode at a CCT of 6500K.
• Maximum luminance (Lmax) varied by up to 6.0% across the screen. Chromaticity variations were 0.002 delta u'v' units or less.
• The CCT of the measured white point is 6941 K as tested and lies within the boundaries accepted by IEC.
• Halation was 3.88% +/- 0.33% on a small black patch surrounded by a large full white area.
Sony GDM-F520 21-inch Color CRT Monitor -v-
Use or disclosure of data on this sheet is subject to the restrictions on the cover and title of this report.
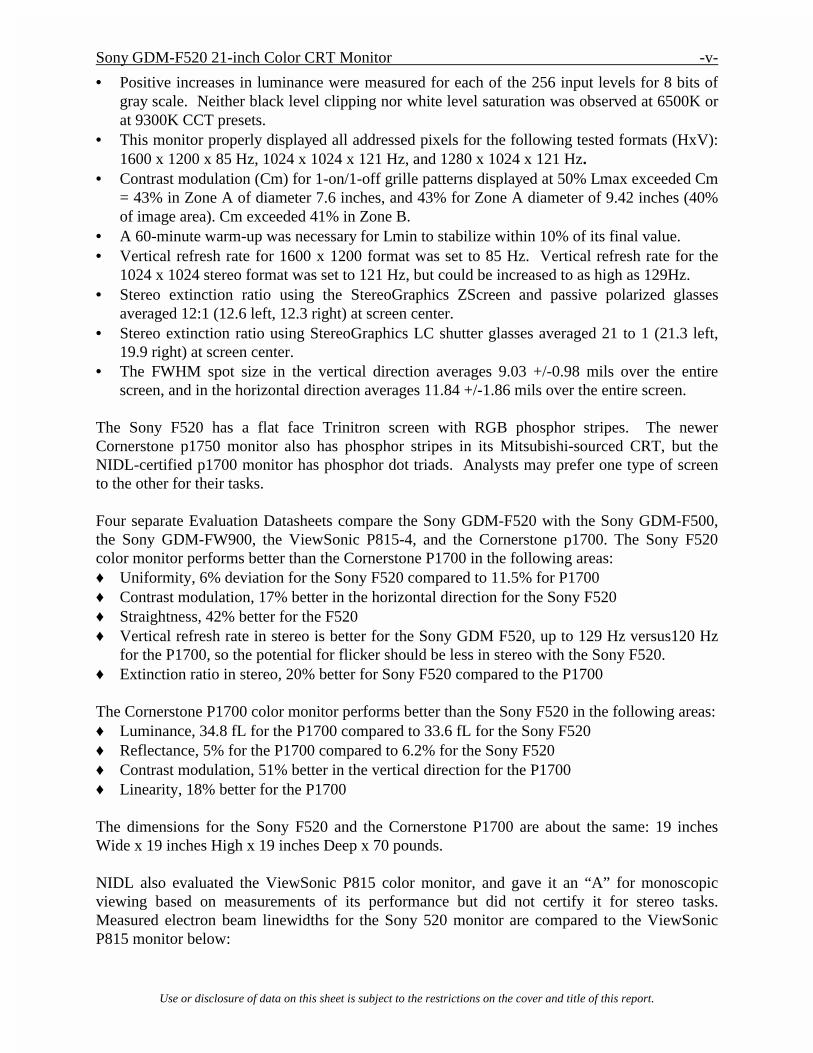
• Positive increases in luminance were measured for each of the 256 input levels for 8 bits of gray scale. Neither black level clipping nor white level saturation was observed at 6500K or at 9300K CCT presets.
• This monitor properly displayed all addressed pixels for the following tested formats (HxV): 1600 x 1200 x 85 Hz, 1024 x 1024 x 121 Hz, and 1280 x 1024 x 121 Hz.
• Contrast modulation (Cm) for 1-on/1-off grille patterns displayed at 50% Lmax exceeded Cm = 43% in Zone A of diameter 7.6 inches, and 43% for Zone A diameter of 9.42 inches (40% of image area). Cm exceeded 41% in Zone B.
• A 60-minute warm-up was necessary for Lmin to stabilize within 10% of its final value. • Vertical refresh rate for 1600 x 1200 format was set to 85 Hz. Vertical refresh rate for the
1024 x 1024 stereo format was set to 121 Hz, but could be increased to as high as 129Hz. • Stereo extinction ratio using the StereoGraphics ZScreen and passive polarized glasses
averaged 12:1 (12.6 left, 12.3 right) at screen center. • Stereo extinction ratio using StereoGraphics LC shutter glasses averaged 21 to 1 (21.3 left,
19.9 right) at screen center. • The FWHM spot size in the vertical direction averages 9.03 +/-0.98 mils over the entire
screen, and in the horizontal direction averages 11.84 +/-1.86 mils over the entire screen. The Sony F520 has a flat face Trinitron screen with RGB phosphor stripes. The newer Cornerstone p1750 monitor also has phosphor stripes in its Mitsubishi-sourced CRT, but the NIDL-certified p1700 monitor has phosphor dot triads. Analysts may prefer one type of screen to the other for their tasks. Four separate Evaluation Datasheets compare the Sony GDM-F520 with the Sony GDM-F500, the Sony GDM-FW900, the ViewSonic P815-4, and the Cornerstone p1700. The Sony F520 color monitor performs better than the Cornerstone P1700 in the following areas: ♦ Uniformity, 6% deviation for the Sony F520 compared to 11.5% for P1700 ♦ Contrast modulation, 17% better in the horizontal direction for the Sony F520 ♦ Straightness, 42% better for the F520 ♦ Vertical refresh rate in stereo is better for the Sony GDM F520, up to 129 Hz versus120 Hz
for the P1700, so the potential for flicker should be less in stereo with the Sony F520. ♦ Extinction ratio in stereo, 20% better for Sony F520 compared to the P1700 The Cornerstone P1700 color monitor performs better than the Sony F520 in the following areas: ♦ Luminance, 34.8 fL for the P1700 compared to 33.6 fL for the Sony F520 ♦ Reflectance, 5% for the P1700 compared to 6.2% for the Sony F520 ♦ Contrast modulation, 51% better in the vertical direction for the P1700 ♦ Linearity, 18% better for the P1700 The dimensions for the Sony F520 and the Cornerstone P1700 are about the same: 19 inches Wide x 19 inches High x 19 inches Deep x 70 pounds. NIDL also evaluated the ViewSonic P815 color monitor, and gave it an “A” for monoscopic viewing based on measurements of its performance but did not certify it for stereo tasks. Measured electron beam linewidths for the Sony 520 monitor are compared to the ViewSonic P815 monitor below:

-vi- NIDL
Use or disclosure of data on this sheet is subject to the restrictions on the cover and title of this report.
• The Sony F520 achieves, on average, 29% smaller line widths at the 50% intensity level compared to the ViewSonic P815. The RAR for the Sony F520 averages 0.5 H x 1.0 V compared to 1.3 H x 0.9 V for the ViewSonic P815.
• The monitors also differ significantly in that the F520 linewidths are more constant over the entire luminance range while the P815 linewidths increase by up to 87% between 7fL to 29fL.
• The contrast modulations of 1 pixel wide white lines on 7 pixel wide black backgrounds and 1 pixel wide black lines on 7 pixel wide white backgrounds were measured for the Sony F520 monitor with Trinitron CRT, and compared to the ViewSonic P815 monitor with phosphor dot shadowmask CRT. White lines are displayed with about the same contrast on both monitors and averaged greater than 90% over luminance values ranging from 10 to 29 fL. The Sony F520 displayed better white or black line contrast than the ViewSonic P815 at the highest luminance setting of 29 fL did. For lower luminances (7fL to 22 fL) horizontal black lines are displayed with slightly more contrast on the ViewSonic P815 (60-66% versus 42-53%) while vertical black lines are displayed with slightly more contrast on the Sony F520 (71-75% versus 58-64%).
Sony GDM-F520 21-inch Color CRT Monitor -vii-
Use or disclosure of data on this sheet is subject to the restrictions on the cover and title of this report.
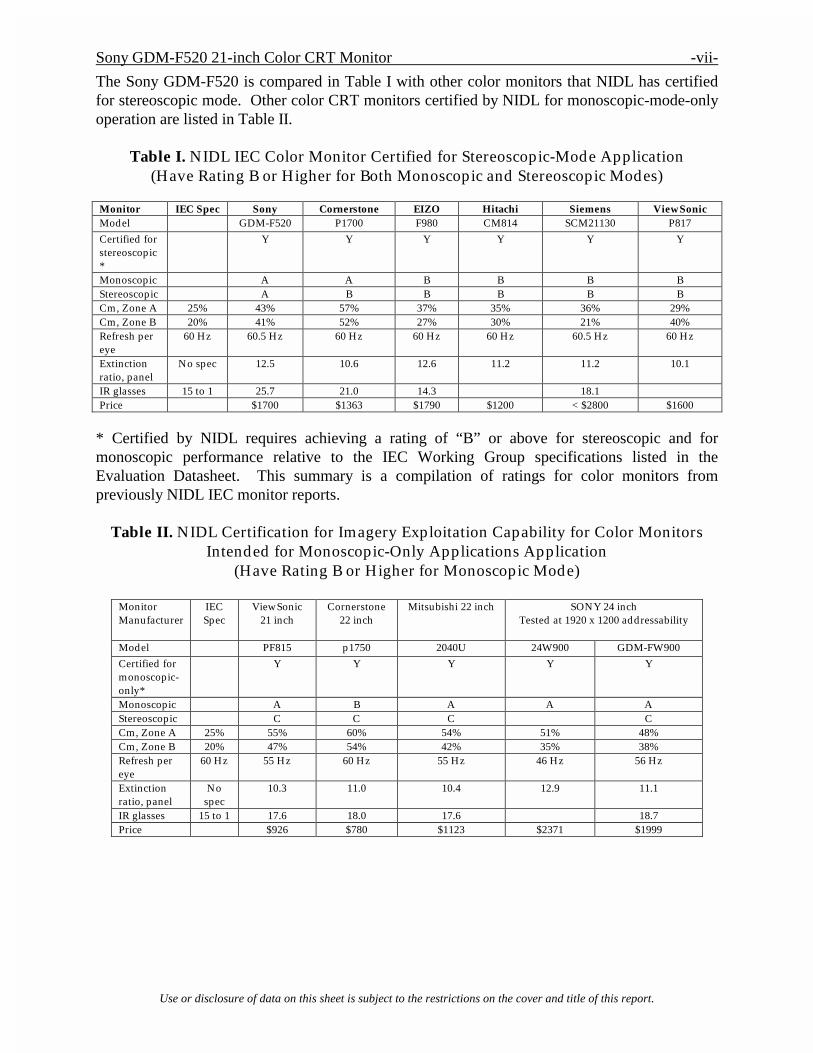
The Sony GDM-F520 is compared in Table I with other color monitors that NIDL has certified for stereoscopic mode. Other color CRT monitors certified by NIDL for monoscopic-mode-only operation are listed in Table II.
Table I. NIDL IEC Color Monitor Certified for Stereoscopic-Mode Application (Have Rating B or Higher for Both Monoscopic and Stereoscopic Modes)
Monitor IEC Spec Sony Cornerstone EIZO Hitachi Siemens ViewSonic Model GDM-F520 P1700 F980 CM814 SCM21130 P817 Certified for stereoscopic*
Y Y Y Y Y Y
Monoscopic A A B B B B Stereoscopic A B B B B B Cm, Zone A 25% 43% 57% 37% 35% 36% 29% Cm, Zone B 20% 41% 52% 27% 30% 21% 40% Refresh per eye
60 Hz 60.5 Hz 60 Hz 60 Hz 60 Hz 60.5 Hz 60 Hz
Extinction ratio, panel
No spec 12.5 10.6 12.6 11.2 11.2 10.1
IR glasses 15 to 1 25.7 21.0 14.3 18.1 Price $1700 $1363 $1790 $1200 < $2800 $1600
* Certified by NIDL requires achieving a rating of “B” or above for stereoscopic and for monoscopic performance relative to the IEC Working Group specifications listed in the Evaluation Datasheet. This summary is a compilation of ratings for color monitors from previously NIDL IEC monitor reports.
Table II. NIDL Certification for Imagery Exploitation Capability for Color Monitors Intended for Monoscopic-Only Applications Application
(Have Rating B or Higher for Monoscopic Mode)
Monitor Manufacturer
IEC Spec
ViewSonic 21 inch
Cornerstone 22 inch
Mitsubishi 22 inch
SONY 24 inch Tested at 1920 x 1200 addressability
Model PF815 p1750 2040U 24W900 GDM-FW900 Certified for monoscopic-only*
Y Y Y Y Y
Monoscopic A B A A A Stereoscopic C C C C Cm, Zone A 25% 55% 60% 54% 51% 48% Cm, Zone B 20% 47% 54% 42% 35% 38% Refresh per eye
60 Hz 55 Hz 60 Hz 55 Hz 46 Hz 56 Hz
Extinction ratio, panel
No spec
10.3 11.0 10.4 12.9 11.1
IR glasses 15 to 1 17.6 18.0 17.6 18.7 Price $926 $780 $1123 $2371 $1999
-viii- NIDL
Use or disclosure of data on this sheet is subject to the restrictions on the cover and title of this report.
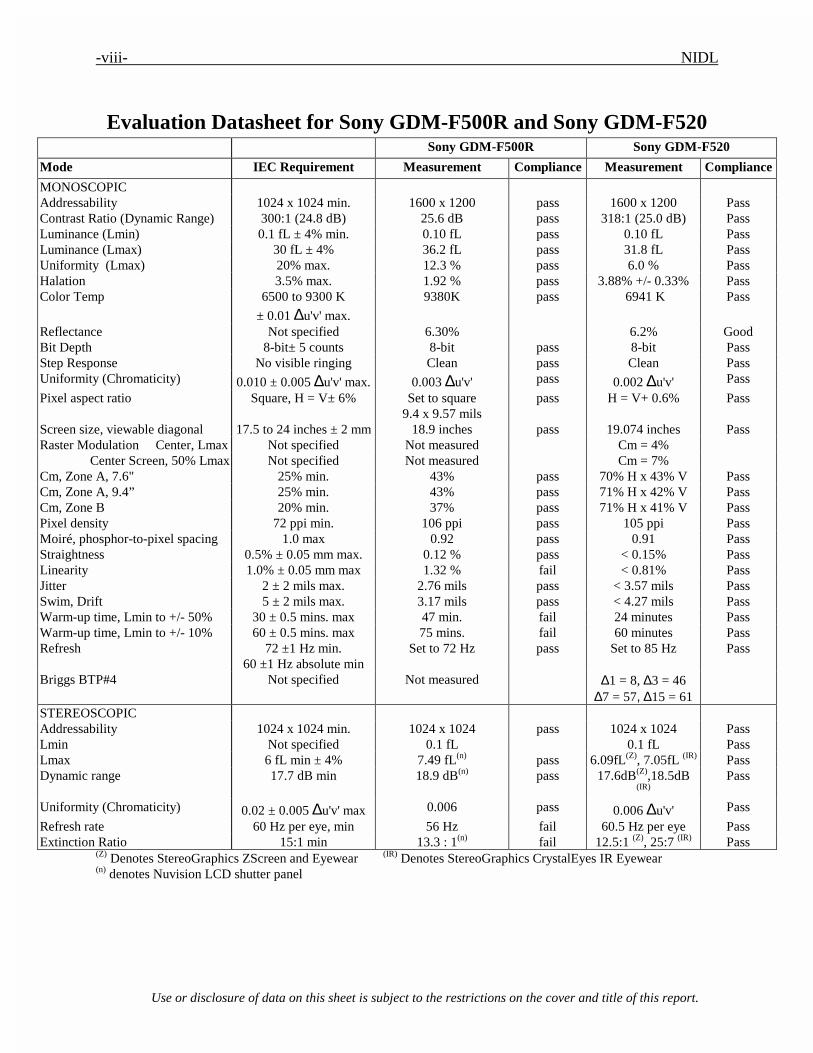
Evaluation Datasheet for Sony GDM-F500R and Sony GDM-F520 Sony GDM-F500R Sony GDM-F520
Mode IEC Requirement Measurement Compliance Measurement Compliance
MONOSCOPIC Addressability 1024 x 1024 min. 1600 x 1200 pass 1600 x 1200 Pass Contrast Ratio (Dynamic Range) 300:1 (24.8 dB) 25.6 dB pass 318:1 (25.0 dB) Pass Luminance (Lmin) 0.1 fL ± 4% min. 0.10 fL pass 0.10 fL Pass Luminance (Lmax) 30 fL ± 4% 36.2 fL pass 31.8 fL Pass Uniformity (Lmax) 20% max. 12.3 % pass 6.0 % Pass Halation 3.5% max. 1.92 % pass 3.88% +/- 0.33% Pass Color Temp 6500 to 9300 K
± 0.01 ∆u'v' max.
9380K pass 6941 K Pass
Reflectance Not specified 6.30% 6.2% Good Bit Depth 8-bit± 5 counts 8-bit pass 8-bit Pass Step Response No visible ringing Clean pass Clean Pass Uniformity (Chromaticity) 0.010 ± 0.005 ∆u'v' max. 0.003 ∆u'v' pass 0.002 ∆u'v' Pass
Pixel aspect ratio Square, H = V± 6% Set to square 9.4 x 9.57 mils
pass H = V+ 0.6% Pass
Screen size, viewable diagonal 17.5 to 24 inches ± 2 mm 18.9 inches pass 19.074 inches Pass Raster Modulation Center, Lmax Not specified Not measured Cm = 4%
Center Screen, 50% Lmax Not specified Not measured Cm = 7% Cm, Zone A, 7.6" 25% min. 43% pass 70% H x 43% V Pass Cm, Zone A, 9.4” 25% min. 43% pass 71% H x 42% V Pass Cm, Zone B 20% min. 37% pass 71% H x 41% V Pass Pixel density 72 ppi min. 106 ppi pass 105 ppi Pass Moiré, phosphor-to-pixel spacing 1.0 max 0.92 pass 0.91 Pass Straightness 0.5% ± 0.05 mm max. 0.12 % pass < 0.15% Pass Linearity 1.0% ± 0.05 mm max 1.32 % fail < 0.81% Pass Jitter 2 ± 2 mils max. 2.76 mils pass < 3.57 mils Pass Swim, Drift 5 ± 2 mils max. 3.17 mils pass < 4.27 mils Pass Warm-up time, Lmin to +/- 50% 30 ± 0.5 mins. max 47 min. fail 24 minutes Pass Warm-up time, Lmin to +/- 10% 60 ± 0.5 mins. max 75 mins. fail 60 minutes Pass Refresh 72 ±1 Hz min.
60 ±1 Hz absolute min Set to 72 Hz pass Set to 85 Hz Pass
Briggs BTP#4 Not specified Not measured ∆1 = 8, ∆3 = 46 ∆7 = 57, ∆15 = 61
STEREOSCOPIC Addressability 1024 x 1024 min. 1024 x 1024 pass 1024 x 1024 Pass Lmin Not specified 0.1 fL 0.1 fL Pass Lmax 6 fL min ± 4% 7.49 fL(n) pass 6.09fL(Z), 7.05fL (IR) Pass Dynamic range 17.7 dB min 18.9 dB(n) pass 17.6dB(Z),18.5dB
(IR) Pass
Uniformity (Chromaticity) 0.02 ± 0.005 ∆u'v' max 0.006 pass 0.006 ∆u'v' Pass
Refresh rate 60 Hz per eye, min 56 Hz fail 60.5 Hz per eye Pass Extinction Ratio 15:1 min 13.3 : 1(n) fail 12.5:1 (Z), 25:7 (IR) Pass
(Z) Denotes StereoGraphics ZScreen and Eyewear (IR) Denotes StereoGraphics CrystalEyes IR Eyewear (n) denotes Nuvision LCD shutter panel
Sony GDM-F520 21-inch Color CRT Monitor -ix-
Use or disclosure of data on this sheet is subject to the restrictions on the cover and title of this report.
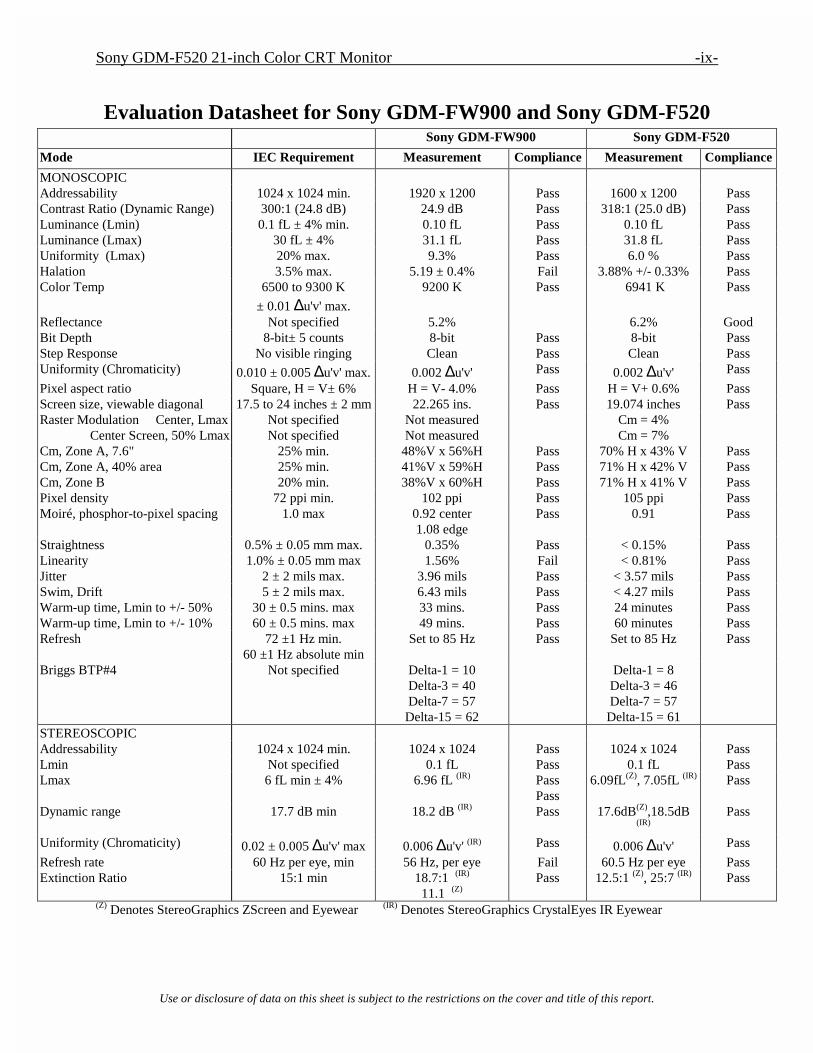
Evaluation Datasheet for Sony GDM-FW900 and Sony GDM-F520 Sony GDM-FW900 Sony GDM-F520
Mode IEC Requirement Measurement Compliance Measurement Compliance
MONOSCOPIC Addressability 1024 x 1024 min. 1920 x 1200 Pass 1600 x 1200 Pass Contrast Ratio (Dynamic Range) 300:1 (24.8 dB) 24.9 dB Pass 318:1 (25.0 dB) Pass Luminance (Lmin) 0.1 fL ± 4% min. 0.10 fL Pass 0.10 fL Pass Luminance (Lmax) 30 fL ± 4% 31.1 fL Pass 31.8 fL Pass Uniformity (Lmax) 20% max. 9.3% Pass 6.0 % Pass Halation 3.5% max. 5.19 ± 0.4% Fail 3.88% +/- 0.33% Pass Color Temp 6500 to 9300 K
± 0.01 ∆u'v' max.
9200 K Pass 6941 K Pass
Reflectance Not specified 5.2% 6.2% Good Bit Depth 8-bit± 5 counts 8-bit Pass 8-bit Pass Step Response No visible ringing Clean Pass Clean Pass Uniformity (Chromaticity) 0.010 ± 0.005 ∆u'v' max. 0.002 ∆u'v' Pass 0.002 ∆u'v' Pass
Pixel aspect ratio Square, H = V± 6% H = V- 4.0% Pass H = V+ 0.6% Pass Screen size, viewable diagonal 17.5 to 24 inches ± 2 mm 22.265 ins. Pass 19.074 inches Pass Raster Modulation Center, Lmax Not specified Not measured Cm = 4%
Center Screen, 50% Lmax Not specified Not measured Cm = 7% Cm, Zone A, 7.6" 25% min. 48%V x 56%H Pass 70% H x 43% V Pass Cm, Zone A, 40% area 25% min. 41%V x 59%H Pass 71% H x 42% V Pass Cm, Zone B 20% min. 38%V x 60%H Pass 71% H x 41% V Pass Pixel density 72 ppi min. 102 ppi Pass 105 ppi Pass Moiré, phosphor-to-pixel spacing 1.0 max 0.92 center
1.08 edge Pass 0.91 Pass
Straightness 0.5% ± 0.05 mm max. 0.35% Pass < 0.15% Pass Linearity 1.0% ± 0.05 mm max 1.56% Fail < 0.81% Pass Jitter 2 ± 2 mils max. 3.96 mils Pass < 3.57 mils Pass Swim, Drift 5 ± 2 mils max. 6.43 mils Pass < 4.27 mils Pass Warm-up time, Lmin to +/- 50% 30 ± 0.5 mins. max 33 mins. Pass 24 minutes Pass Warm-up time, Lmin to +/- 10% 60 ± 0.5 mins. max 49 mins. Pass 60 minutes Pass Refresh 72 ±1 Hz min.
60 ±1 Hz absolute min Set to 85 Hz Pass Set to 85 Hz Pass
Briggs BTP#4 Not specified Delta-1 = 10 Delta-3 = 40 Delta-7 = 57
Delta-15 = 62
Delta-1 = 8 Delta-3 = 46 Delta-7 = 57
Delta-15 = 61
STEREOSCOPIC Addressability 1024 x 1024 min. 1024 x 1024 Pass 1024 x 1024 Pass Lmin Not specified 0.1 fL Pass 0.1 fL Pass Lmax 6 fL min ± 4% 6.96 fL (IR) Pass
Pass 6.09fL(Z), 7.05fL (IR) Pass
Dynamic range 17.7 dB min 18.2 dB (IR) Pass 17.6dB(Z),18.5dB (IR)
Pass
Uniformity (Chromaticity) 0.02 ± 0.005 ∆u'v' max 0.006 ∆u'v' (IR) Pass 0.006 ∆u'v' Pass
Refresh rate 60 Hz per eye, min 56 Hz, per eye Fail 60.5 Hz per eye Pass Extinction Ratio 15:1 min 18.7:1 (IR)
11.1 (Z) Pass 12.5:1 (Z), 25:7 (IR) Pass
(Z) Denotes StereoGraphics ZScreen and Eyewear (IR) Denotes StereoGraphics CrystalEyes IR Eyewear

-x- NIDL
Use or disclosure of data on this sheet is subject to the restrictions on the cover and title of this report.
Evaluation Datasheet for ViewSonic P815-4 and Sony GDM-F520 ViewSonic P815-4 Sony GDM-F520
Mode IEC Requirement Measurement Compliance Measurement Compliance
MONOSCOPIC Addressability 1024 x 1024 min. 1600 x 1200 Pass 1600 x 1200 Pass Contrast Ratio (Dynamic Range) 300:1 (24.8 dB) 311:1 (24.9 dB) Pass 318:1 (25.0 dB) Pass Luminance (Lmin) 0.1 fL ± 4% min. 0.107 fL Pass 0.10 fL Pass Luminance (Lmax) 30 fL ± 4% 33.27 fL Pass 31.8 fL Pass Uniformity (Lmax) 20% max. 10.8 % Pass 6.0 % Pass Halation 3.5% max. Not measured 3.88% +/- 0.33% Pass Color Temp 6500 to 9300 K
± 0.01 ∆u'v' max.
8326 K, 9629 K Pass 6941 K Pass
Reflectance Not specified Not measured 6.2% Good Bit Depth 8-bit± 5 counts Not measured 8-bit Pass Step Response No visible ringing Clean Pass Clean Pass Uniformity (Chromaticity) 0.010 ± 0.005 ∆u'v' max. Not measured 0.002 ∆u'v' Pass
Pixel aspect ratio Square, H = V± 6% Not measured H = V+ 0.6% Pass Screen size, viewable diagonal 17.5 to 24 inches ± 2 mm Not measured 19.074 inches Pass Raster Modulation Center, Lmax Not specified Cm = 36% Cm = 4%
Center Screen, 50% Lmax Not specified Cm = 65% Cm = 7% Cm, Zone A, 7.6" 25% min. Not measured 70% H x 43% V Pass Cm, Zone A, 9.4” 25% min. Not measured 71% H x 42% V Pass Cm, Zone B 20% min. Not measured 71% H x 41% V Pass Pixel density 72 ppi min. Not measured 105 ppi Pass Moiré, phosphor-to-pixel spacing 1.0 max Not measured 0.91 Pass Straightness 0.5% ± 0.05 mm max. Not measured < 0.15% Pass Linearity 1.0% ± 0.05 mm max 0.82% Pass < 0.81% Pass Jitter 2 ± 2 mils max. Not measured < 3.57 mils Pass Swim, Drift 5 ± 2 mils max. Not measured < 4.27 mils Pass Warm-up time, Lmin to +/- 50% 30 ± 0.5 mins. max Not measured 24 minutes Pass Warm-up time, Lmin to +/- 10% 60 ± 0.5 mins. max Not measured 60 minutes Pass Refresh 72 ±1 Hz min.
60 ±1 Hz absolute min Set to 85 Hz Pass Set to 85 Hz Pass
Briggs BTP#4 Not specified ∆1 = 9, ∆3 = 39, ∆7 = 52, ∆15 = 57
∆1 = 8, ∆3 = 46 ∆7 = 57, ∆15 = 61
STEREOSCOPIC Addressability 1024 x 1024 min. 1024 x 1024 Pass 1024 x 1024 Pass Lmin Not specified 0.1 fL 0.1 fL Pass Lmax 6 fL min ± 4% 5.05 fL (Z), 5.86 (IR) Pass 6.09fL(Z), 7.05fL (IR) Pass Dynamic range 17.7 dB min 17.0 dB (Z), 17.7 dB (IR) Pass 17.6dB(Z),18.5dB(IR) Pass Uniformity (Chromaticity) 0.02 ± 0.005 ∆u'v' max 0.008 ∆u'v' Pass 0.006 ∆u'v' Pass
Refresh rate 60 Hz per eye, min 55 Hz per eye Fail 60.5 Hz per eye Pass Extinction Ratio 15:1 min 10.2:1 (Z), 15:1 (IR) Pass 12.5:1 (Z), 25:7 (IR) Pass Addressability 1024 x 1024 min. 1280 x 1024 Lmin Not specified Not measured 0.1 fL Lmax 6 fL min ± 4% Not measured 4.89 fL (IR) Dynamic range 17.7 dB min Not measured 16.9 dB (IR) Refresh rate 60 Hz per eye, min Not measured 60.5 Hz per eye Extinction Ratio 15:1 min Not measured 16 .1 (IR)
Max. Refresh ViewSonic P815-4 Sony F520 Addressability 1152 x 864 1024 x 1024 1152 x 864 1024 x 1024 1280 x 1024 Vertical Scan 128.9 Hz 110 Hz 153.3 Hz 128.2 Hz 129.4 Hz Horizontal Scan 116 kHz 117.310 kHz 137.968 kHz 137.969 kHz 137.968 kHz
(Z) Denotes StereoGraphics ZScreen and Eyewear (IR) Denotes StereoGraphics CrystalEyes IR Eyewear
Sony GDM-F520 21-inch Color CRT Monitor -xi-
Use or disclosure of data on this sheet is subject to the restrictions on the cover and title of this report.
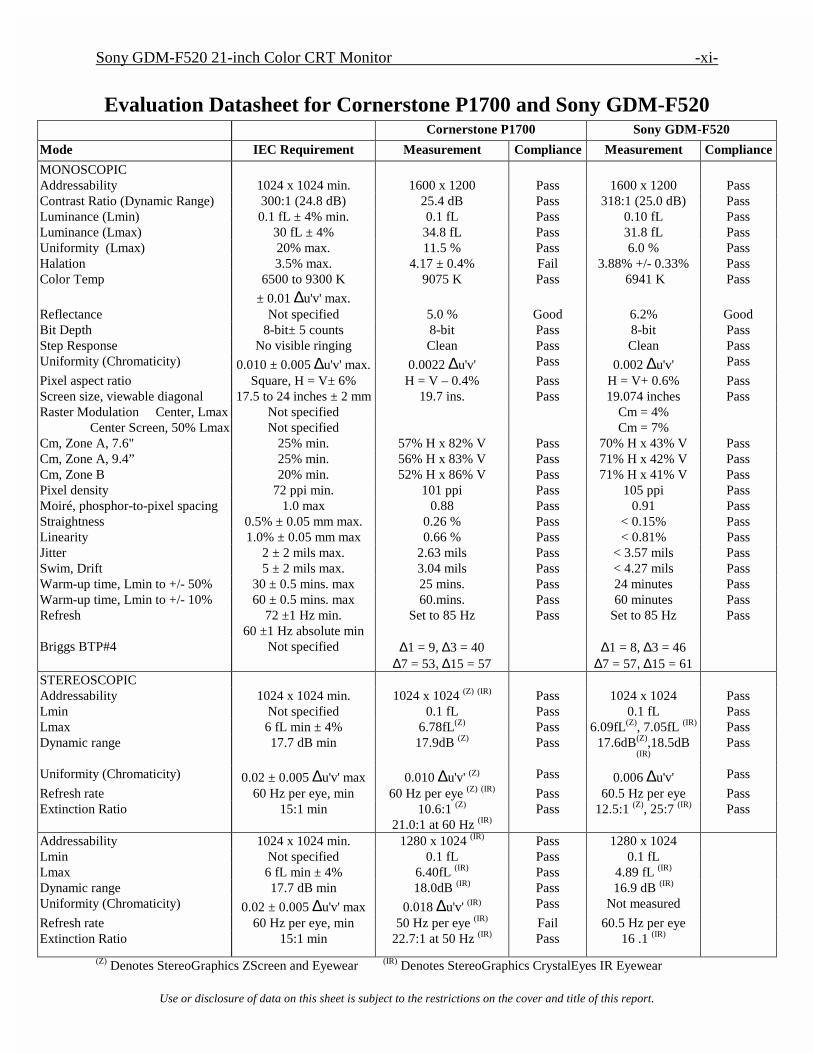
Evaluation Datasheet for Cornerstone P1700 and Sony GDM-F520 Cornerstone P1700 Sony GDM-F520
Mode IEC Requirement Measurement Compliance Measurement Compliance
MONOSCOPIC Addressability 1024 x 1024 min. 1600 x 1200 Pass 1600 x 1200 Pass Contrast Ratio (Dynamic Range) 300:1 (24.8 dB) 25.4 dB Pass 318:1 (25.0 dB) Pass Luminance (Lmin) 0.1 fL ± 4% min. 0.1 fL Pass 0.10 fL Pass Luminance (Lmax) 30 fL ± 4% 34.8 fL Pass 31.8 fL Pass Uniformity (Lmax) 20% max. 11.5 % Pass 6.0 % Pass Halation 3.5% max. 4.17 ± 0.4% Fail 3.88% +/- 0.33% Pass Color Temp 6500 to 9300 K
± 0.01 ∆u'v' max.
9075 K Pass 6941 K Pass
Reflectance Not specified 5.0 % Good 6.2% Good Bit Depth 8-bit± 5 counts 8-bit Pass 8-bit Pass Step Response No visible ringing Clean Pass Clean Pass Uniformity (Chromaticity) 0.010 ± 0.005 ∆u'v' max. 0.0022 ∆u'v' Pass 0.002 ∆u'v' Pass
Pixel aspect ratio Square, H = V± 6% H = V – 0.4% Pass H = V+ 0.6% Pass Screen size, viewable diagonal 17.5 to 24 inches ± 2 mm 19.7 ins. Pass 19.074 inches Pass Raster Modulation Center, Lmax Not specified Cm = 4%
Center Screen, 50% Lmax Not specified Cm = 7% Cm, Zone A, 7.6" 25% min. 57% H x 82% V Pass 70% H x 43% V Pass Cm, Zone A, 9.4” 25% min. 56% H x 83% V Pass 71% H x 42% V Pass Cm, Zone B 20% min. 52% H x 86% V Pass 71% H x 41% V Pass Pixel density 72 ppi min. 101 ppi Pass 105 ppi Pass Moiré, phosphor-to-pixel spacing 1.0 max 0.88 Pass 0.91 Pass Straightness 0.5% ± 0.05 mm max. 0.26 % Pass < 0.15% Pass Linearity 1.0% ± 0.05 mm max 0.66 % Pass < 0.81% Pass Jitter 2 ± 2 mils max. 2.63 mils Pass < 3.57 mils Pass Swim, Drift 5 ± 2 mils max. 3.04 mils Pass < 4.27 mils Pass Warm-up time, Lmin to +/- 50% 30 ± 0.5 mins. max 25 mins. Pass 24 minutes Pass Warm-up time, Lmin to +/- 10% 60 ± 0.5 mins. max 60.mins. Pass 60 minutes Pass Refresh 72 ±1 Hz min.
60 ±1 Hz absolute min Set to 85 Hz Pass Set to 85 Hz Pass
Briggs BTP#4 Not specified ∆1 = 9, ∆3 = 40 ∆7 = 53, ∆15 = 57
∆1 = 8, ∆3 = 46 ∆7 = 57, ∆15 = 61
STEREOSCOPIC Addressability 1024 x 1024 min. 1024 x 1024 (Z) (IR) Pass 1024 x 1024 Pass Lmin Not specified 0.1 fL Pass 0.1 fL Pass Lmax 6 fL min ± 4% 6.78fL(Z) Pass 6.09fL(Z), 7.05fL (IR) Pass Dynamic range 17.7 dB min 17.9dB (Z) Pass 17.6dB(Z),18.5dB
(IR) Pass
Uniformity (Chromaticity) 0.02 ± 0.005 ∆u'v' max 0.010 ∆u'v' (Z) Pass 0.006 ∆u'v' Pass
Refresh rate 60 Hz per eye, min 60 Hz per eye (Z) (IR) Pass 60.5 Hz per eye Pass Extinction Ratio 15:1 min 10.6:1 (Z)
21.0:1 at 60 Hz (IR) Pass 12.5:1 (Z), 25:7 (IR) Pass
Addressability 1024 x 1024 min. 1280 x 1024 (IR) Pass 1280 x 1024 Lmin Not specified 0.1 fL Pass 0.1 fL Lmax 6 fL min ± 4% 6.40fL (IR) Pass 4.89 fL (IR) Dynamic range 17.7 dB min 18.0dB (IR) Pass 16.9 dB (IR) Uniformity (Chromaticity) 0.02 ± 0.005 ∆u'v' max 0.018 ∆u'v' (IR) Pass Not measured
Refresh rate 60 Hz per eye, min 50 Hz per eye (IR) Fail 60.5 Hz per eye Extinction Ratio 15:1 min 22.7:1 at 50 Hz (IR) Pass 16 .1 (IR)
(Z) Denotes StereoGraphics ZScreen and Eyewear (IR) Denotes StereoGraphics CrystalEyes IR Eyewear
-xii- NIDL
Use or disclosure of data on this sheet is subject to the restrictions on the cover and title of this report.
Section I INTRODUCTION The National Information Display Laboratory (NIDL) was established in 1990 to bring together technology providers - commercial and academic leaders in advanced display hardware, softcopy information processing tools, and information collaboration and communications techniques - with government users. The Sarnoff Corporation in Princeton, New Jersey, a world research leader in high-definition digital TV, advanced displays, computing and electronics, hosts the NIDL. The present study evaluates a production unit of the Sony GDM-F520 color CRT high-resolution display monitor. This report is intended for both technical users, such as system integrators, monitor designers, and monitor evaluators, and non-technical users, such as image analysts, software developers, or other users unfamiliar with detailed monitor technology. The IEC requirements, procedures and calibrations used in the measurements are detailed in the following: • NIDL Publication No. 0201099-091, Request for Evaluation Monitors for the National
Imagery & Mapping Agency (NIMA) Integrated Exploitation Capability (IEC), August 25, 1999.
Two companion documents that describe how the measurements are made are available from the NIDL and the Defense Technology Information Center at http://www.dtic.mil: • NIDL Publication No. 171795-036 Display Monitor Measurement Methods under
Discussion by EIA (Electronic Industries Association) Committee JT-20 Part 1: Monochrome CRT Monitor Performance Draft Version 2.0. (ADA353605)
• NIDL Publication No. 171795-037 Display Monitor Measurement Methods under Discussion by EIA (Electronic Industries Association) Committee JT-20 Part 2: Color CRT Monitor Performance Draft Version 2.0. (ADA341357)
Other procedures are found in a recently approved standard available from the Video Electronics Standards Association (VESA) at http://www.vesa.org: • VESA Flat Panel Display Measurements Standard, Version 2.0, June 1, 2001. The IEC workstation provides the capability to display image and other geospatial data on either monochrome or color monitors, or a combination of both. Either of these monitors may be required to support stereoscopic viewing. Selection and configuration of these monitors will be made in accordance with mission needs for each site. NIMA users will select from monitors included on the NIMA-approved Certified Monitor List compiled by the NIDL. The color and monochrome, monoscopic and stereoscopic, monitor requirements are listed in the Evaluation Datasheet.
-2- NIDL
Use or disclosure of data on this sheet is subject to the restrictions on the cover and title of this report.
I.1. Manufacturer’s Specifications for the Sony GDM-F520 Monitor For details of the manufacture’s specifications, please go to Sony web page http://www.ita.sel.sony.com/support/displays/legacy/specs/gdmf520.pdf . Features of the Sony GDM-F520 color CRT monitor
• 21 inch (19.8 inch actual visible size) virtually flat Trinitron CRT • Supports PC resolutions up to 2048 x 1536 pixels • 0.22 mm aperture grille pitch across the entire screen • Picture effect to boost image luminance to optimize performance for graphics and
video applications • HD15 and BNC connectors support the use of two computers • A new level of performance with superb image clarity and brighter colors make it
perfect for detailed graphic design work

Sony GDM-F520 21-inch Color CRT Monitor -3-
Use or disclosure of data on this sheet is subject to the restrictions on the cover and title of this report.
Specifications of Sony GDM-F520 CRT monitor
• Screen treatment High contrast anti-reflection coating • Horizontal scan 30 to 137 kHz • Vertical refresh 48 to 170 Hz • Maximum resolution 2048 x 1536 pixels • Recommended resolutions 1920 x 1440 at 85 Hz, 1600 x 1200 at 85 Hz • Factory preset timings 27 modes • User adjustable timings 15 settings • Color temperature presets 5000K, 6500K, 9300K; 5000K to 10,000K adjustable • \Display weight 67.4 pounds • Power requirements 90 to 264 V AC at 50/60 Hz • Power management 145 W maximum; 3 W active off • Operating conditions 50 to 104 F, 10 to 80% relative humidity • Front panel user controls • On screen display controls • Warranty Parts, CRT and labor for 3 years

-4- NIDL
Use or disclosure of data on this sheet is subject to the restrictions on the cover and title of this report.
I.2. Initial Monitor Set Up Reference: Request for Evaluation Monitors, NIDL Pub. 0201099-091, Section 5, p 5. All measurements will be made with the display commanded through a laboratory grade programmable test pattern generator. The system will be operated in at least a 24 bit mode (as opposed to a lesser or pseudo-color mode) for color and at least 8 bits for monochrome. As a first step, refresh rate should be measured and verified to be at least 72 Hz. The screen should then be commanded to full addressability and Lmin set to 0.1 fL. Lmax should be measured at screen center with color temperature between D65 and D93 allowable and any operator adjustment of gain allowable. If a value >35fL is not achieved (>30 fL for color), addressability should be lowered. For a nominal 1200 by 1600 addressability, addressability should be lowered to 1280 by 1024 or to 1024 by 1024. For a nominal 2048 by 2560 addressability, addressabilities of 1200 x 1600 and 1024 x 1024 can be evaluated if the desired Lmax is not achieved at full addressability.
I.3. Equipment Reference: Monochrome CRT Monitor Performance, Draft Version 2.0 Section 2.0, page 3.
The procedures described in this report should be carried out in a darkened environment such that the stray luminance diffusely reflected by the screen in the absence of electron-beam excitation is less than 0.003 cd/m2 (1mfL).
Instruments used in these measurements included: • Quantum Data 8701 400 MHz programmable test pattern signal generator • Quantum Data 903 250 MHz programmable test pattern signal generator • Photo Research SpectraScan PR-650 spectroradiometer • Photo Research SpectraScan PR-704 spectroradiometer • Minolta LS-100 Photometer • Minolta CA-100 Colorimeter • Graseby S370 Illuminance Meter • Microvision Superspot 100 Display Characterization System which included OM-1 optic
module (Two Dimensional photodiode linear array device, projected element size at screen set to 1.3 mils with photopic filter) and Spotseeker 4-Axis Positioner
Stereoscopic-mode measurements were made using the following commercially-available stereo products: • StereoGraphics ZScreen 19-inch LCD shutter with passive polarized eyeglasses. • StereoGraphics CrystalEyes IR Eyewear.

Sony GDM-F520 21-inch Color CRT Monitor -5-
Use or disclosure of data on this sheet is subject to the restrictions on the cover and title of this report.
Section II PHOTOMETRIC MEASUREMENTS
II.1. Dynamic range and Screen Reflectance
References: Request for Evaluation Monitors, NIDL Pub. 0201099-091, Section 5.6, p 6.
VESA Flat Panel Display Measurements Standard, Version 1.0, May 15, 199, Section 308-1.
Full screen white-to-black contrast ratio measured in 1600 x 1200 format is 315:1 (25.0 dB dynamic range) in a dark room and exceeds the IEC specification. We measured a screen reflectance of 6.2% which is fairly low. In spite of this average-to-low reflectivity, the contrast ratio decreases to 196:1 (22.9 dB) in 1 fc diffuse ambient illumination. The absolute threshold for IEC is 158:1 (22 dB). Thus, the strong influence of ambient light on the achievable contrast ratio is shown. For the highest contrast ratio, the amount of light falling on the screen should be minimized by turning off overhead florescent lights and substituting indirect reflected light from a wall wash. Objective: Measure the photometric output (luminance vs. input command level) at Lmax
and Lmin in both dark room and illuminated ambient conditions. Equipment: Photometer, Integrating Hemisphere Light Source or equivalent Procedure: Luminance at center of screen is measured for input counts of 0 and Max Count.
Test targets are full screen (flat fields) where full screen is defined addressability. Set Lmin to 0.1 fL. For color monitors, set color temperature between D65 to D93. Measure Lmax. This procedure applies when intended ambient light level measured at the display is 2fc or less. For conditions of higher ambient light level, Lmin and Lmax should be measured at some nominal intended ambient light level (e.g., 18-20 fc for normal office lighting with no shielding). This requires use of a remote spot photometer following procedures outlined in reference 2, paragraph 308-2. This will at best be only an approximation since specular reflections will not be captured. A Lmin > 0.1 fL may be required to meet grayscale visibility requirements. According to the VESA directed hemispherical reflectance (DHR) measurement method, total combined reflections due to specular, haze and diffuse components of reflection arising from uniform diffuse illumination are simultaneously quantified as a fraction of the reflectance of a perfect white diffuse reflector using the set up depicted in figure II.1-1. Total reflectance was calculated from measured luminances reflected by the screen (display turned off) when uniformly illuminated by an integrating hemisphere simulated using a polystyrene icebox.

-6- NIDL
Use or disclosure of data on this sheet is subject to the restrictions on the cover and title of this report.
Luminance is measured using a spot photometer with 1° measurement field and an illuminance sensor as depicted in Figure II.1-1. The measured values and calculated reflectances are given in Table II.1-1.
Data: Contrast ratio is a linear expression of Lmax to Lmin. Dynamic range expresses the contrast ratio in log units, dB, which correlates more closely with the sensitivity of the human vision system.
Define contrast ratio by: CR = Lmax/Lmin
Define dynamic range by: DR = 10log(Lmax/Lmin)
Monitor under test
0°8°
Photometer
White polystyrene box
- Top View -
Illuminance sensor
Halogen lamps, total four, (1 each corner)
Figure II.1-1. Test setup according to VESA FPDM procedures for measuring
total reflectance of screen.
Table II.1-1. Directed Hemispherical Reflectance of Faceplate VESA ambient contrast illuminance source (polystyrene box)
Ambient Illuminance 20.4 fc Reflected Luminance 1.26 fL Faceplate Reflectance 6.2 %
Ambient dynamic ranges of full screen white-to-black given in Table II.1-2 were computed for various levels of diffuse ambient lighting using the measured value for DHR and the darkroom dynamic range measurements. Full screen white-to-black contrast ratio decreases from 315:1 (25.0 dynamic range) in a dark room to 142:1 (21.5 dB) in 2 fc diffuse ambient illumination. The absolute threshold for IEC is 158:1 (22 dB).

Sony GDM-F520 21-inch Color CRT Monitor -7-
Use or disclosure of data on this sheet is subject to the restrictions on the cover and title of this report.
Table II.1-2.Dynamic Range in Dark and Illuminated Rooms
Effect of ambient lighting on dynamic range is calculated by multiplying the measured CRT faceplate reflectivity times the ambient illumination measured at the CRT in foot candles added to the minimum screen luminance, Lmin,
where Lmin = 0.10.
Ambient Illumination Contrast Ratio Dynamic Range, dB 0 fc (Dark Room) 315 :1 25.0 dB 1 fc 196 :1 22.9 dB 2 fc 142 :1 21.5 dB 3 fc 112 :1 20.5 dB 4 fc 92 :1 19.6 dB 5 fc 78 :1 18.9 dB 6 fc 68 :1 18.3 dB 7 fc 60 :1 17.8 dB 8 fc 54 :1 17.3 dB 9 fc 49 :1 16.9 dB
10 fc 45 :1 16.5 dB 11 fc 42 :1 16.2 dB 12 fc 39 :1 15.9 dB 13 fc 36 :1 15.6 dB 14 fc 34 :1 15.3 dB 15 fc 32 :1 15.0 dB
II.2. Maximum Luminance (Lmax) in Monoscopic and Stereo Modes
References: Request for Evaluation Monitors, NIDL Pub. 0201099-091, Section 5.2, p 6. Lmax can be as high as 33.6 fL depending on the choice of preset modes and CCT. Through the ZScreen and passive glasses, it exceeds 6 fL for stereo viewing in the standard and dynamic modes when the gain is at its maximum setting. The professional setting yields less than 6 fL in stereo. With stereo active glasses, Lmax is greater than 7 fL in 1024 x 1024 and about 4.9 fL in a 1280 x 1024 pixel addressability. Objective: Measure the maximum output display luminance. Equipment: Photometer Procedure: See dynamic range. Use the value of Lmax defined for the Dynamic Range
measurement. Data: The maximum output display luminance, Lmax, and associated CIE x, y
chromaticity coordinates (CIE 1976) were measured using a hand-held colorimeter (Minolta CA-100). The correlated color temperature (CCT) computed from the measured CIE x, y chromaticity coordinates was within range specified by IEC (6500K and 9300K).
-8- NIDL
Use or disclosure of data on this sheet is subject to the restrictions on the cover and title of this report.
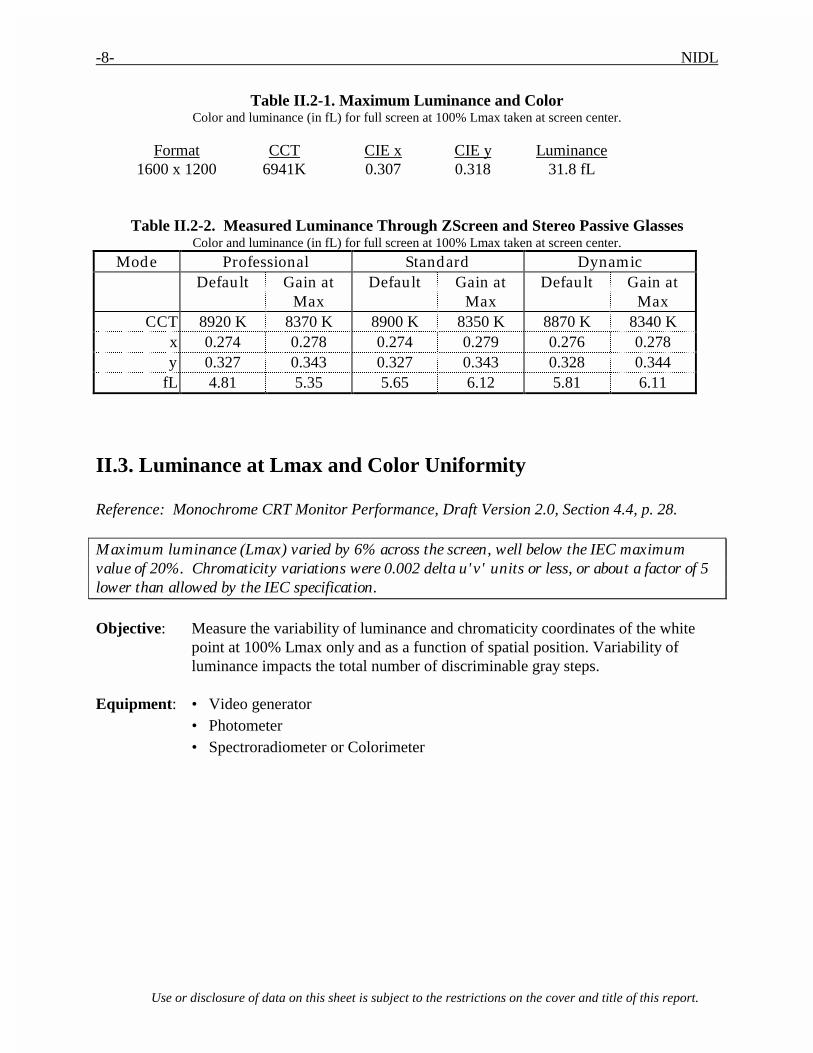
Table II.2-1. Maximum Luminance and Color
Color and luminance (in fL) for full screen at 100% Lmax taken at screen center.
Format CCT CIE x CIE y Luminance 1600 x 1200 6941K 0.307 0.318 31.8 fL
Table II.2-2. Measured Luminance Through ZScreen and Stereo Passive Glasses Color and luminance (in fL) for full screen at 100% Lmax taken at screen center.
Mode Professional Standard Dynamic Default Gain at
Max Default Gain at
Max Default Gain at
Max CCT 8920 K 8370 K 8900 K 8350 K 8870 K 8340 K
x 0.274 0.278 0.274 0.279 0.276 0.278 y 0.327 0.343 0.327 0.343 0.328 0.344
fL 4.81 5.35 5.65 6.12 5.81 6.11
II.3. Luminance at Lmax and Color Uniformity
Reference: Monochrome CRT Monitor Performance, Draft Version 2.0, Section 4.4, p. 28. Maximum luminance (Lmax) varied by 6% across the screen, well below the IEC maximum value of 20%. Chromaticity variations were 0.002 delta u'v' units or less, or about a factor of 5 lower than allowed by the IEC specification. Objective: Measure the variability of luminance and chromaticity coordinates of the white
point at 100% Lmax only and as a function of spatial position. Variability of luminance impacts the total number of discriminable gray steps.
Equipment: • Video generator • Photometer • Spectroradiometer or Colorimeter

Sony GDM-F520 21-inch Color CRT Monitor -9-
Use or disclosure of data on this sheet is subject to the restrictions on the cover and title of this report.
Test Pattern: Full screen flat field with visible edges at Lmin as shown in Figure II.3-1.
Center
Minor
Major
12
6
2D10D
39
4D8D
10% V
10% H
H
V
Full Screen Flat Field test pattern. Nine screen test locations. Figure II.3-1 Figure II.3-2
Procedure: Investigate the temporal variation of luminance and the white point as a function of intensity by displaying a full flat field shown in Figure II.3-1 for video input count levels corresponding Lmax. Measure the luminance and C.I.E. color coordinates at center screen.
Investigate the temporal variation of luminance and the white point as a function of spatial position by repeating these measurements at each of the locations depicted in Figure II.3-2. Define color uniformity in terms of ∆u´v´.
Data: Tabulate the luminance and 1931 C.I.E. chromaticity coordinates (x, y) or correlated color temperature of the white point at each of the nine locations depicted in Figure II.3-2. Additionally, note the location of any additional points that are measured along with the corresponding luminance values.

-10- NIDL
Use or disclosure of data on this sheet is subject to the restrictions on the cover and title of this report.
Table II.3-1.Spatial Uniformity of Luminance and Color
Color and luminance (in fL) for Full screen at 100% Lmax taken at nine screen positions.
1600 x 1200 POSITION CCT CIE x CIE y L, fL
center 6941 0.307 0.318 31.8 2 6817 0.309 0.318 30.2 3 6890 0.308 0.317 29.9 4 6929 0.307 0.319 30.1 6 6806 0.309 0.319 31.7 8 6745 0.310 0.319 31.6 9 6745 0.310 0.319 30.5 10 6726 0.310 0.321 30.6 12 6817 0.309 0.318 31.2
12 2
3
468
9
10
CENTERKey to clock positions used in the tables
05
101520253035
Left Center Right
Lum
inan
ce [f
L]
Top Center Bottom
Full screen at 100% Lmax
0.0000
0.0005
0.0010
0.0015
0.0020
0.0025
Left Center Right
delt
a u'
v'
Top Center Bottom
Full screen at 100% Lmax
Fig.II.3-3. Spatial Uniformity of Luminance and Chromaticity at Lmax. (Delta u'v' of 0.004 is just visible.)

Sony GDM-F520 21-inch Color CRT Monitor -11-
Use or disclosure of data on this sheet is subject to the restrictions on the cover and title of this report.
II.4. Halation
Reference: Monochrome CRT Monitor Performance, Draft Version 2.0 Section 4.6, page 48.
Halation was 3.88% +/- 0.33% on a small black patch surrounded by a large full white area and within the tolerance range of the IEC specification of 3.5% for a color temperature of 6500K.
Objective: Measure the contribution of halation to contrast degradation. Halation is a
phenomenon in which the luminance of a given region of the screen is increased by contributions from surrounding areas caused by light scattering within the phosphor layer and internal reflections inside the glass faceplate. The mechanisms that give rise to halation, and its detailed non-monotonic dependence on the distance along the screen between the source of illumination and the region being measured have been described by E. B. Gindele and S.L. Shaffer. The measurements specified below determine the percentage of light that is piped into the dark areas as a function of the extent of the surrounding light areas.
Equipment: • Photometer • Video generator Test Pattern:
0.01% screen area11-pixel square(L )
Surround(L )white
black
Figure II.4-1 Test pattern for measuring halation.
Procedure: Note: The halation measurements require changing the setting of the
BRIGHTNESS control and will perturb the values of Lmax and Lmin that are established during the initial monitor set-up. The halation measurements should therefore be made either first, before the monitor setup, or last, after all other photometric measurements have been completed.
Determine halation by measuring the luminance of a small square displayed at Lblack (essentially zero) and at Lwhite when surrounded by a much larger square displayed at Lwhite (approximately 75% Lmax).
Establish Lblack by setting the display to cutoff. To set the display to cut-off, display a flat field using video input count level zero, and use a photometer to monitor the luminance at center screen. Vary the BRIGHTNESS control until the CRT beam is visually cut off, and confirm that the corresponding luminance
-12- NIDL
Use or disclosure of data on this sheet is subject to the restrictions on the cover and title of this report.
(Lstray) is essentially equal to zero. Fine tune the BRIGHTNESS control such that CRT beam is just on the verge of being cut off. These measurements should be made with a photometer that is sensitive at low light levels (below Lmin of the display). Make no further adjustments or changes to the BRIGHTNESS control or the photometer measurement field.
Next, decrease the video-input level to display a measured full-screen luminance of 75% Lmax measured at screen center. Record this luminance (Lwhite).
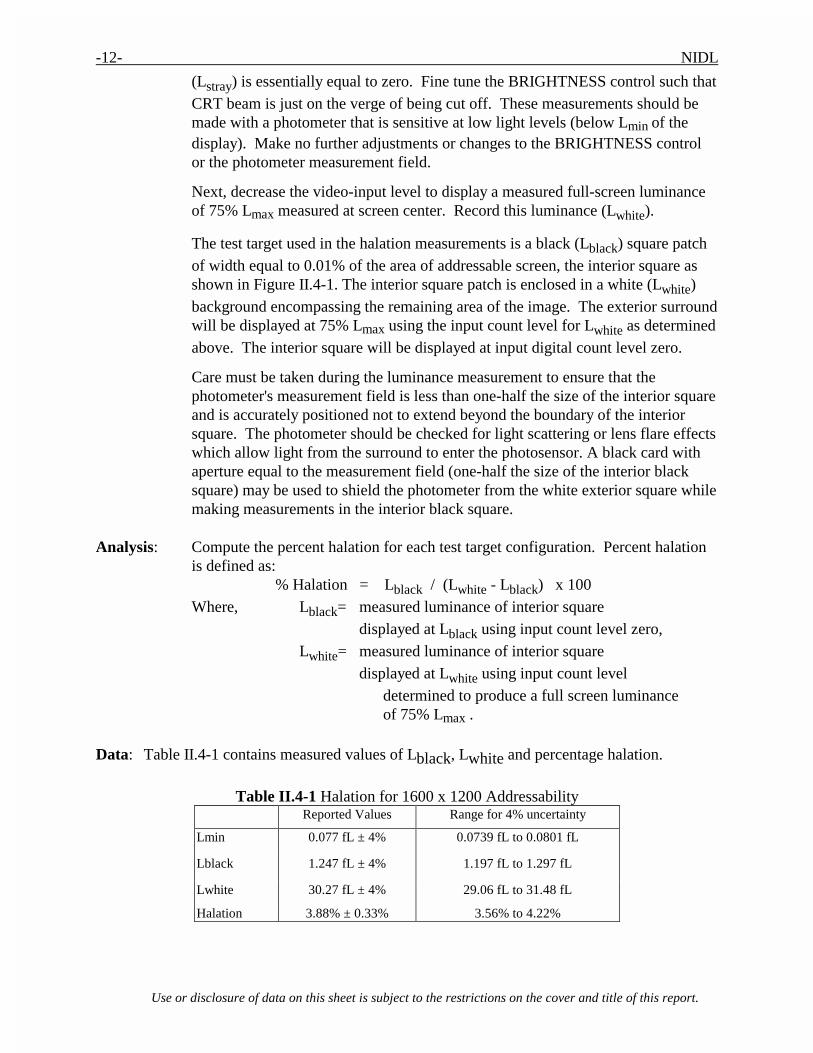
The test target used in the halation measurements is a black (Lblack) square patch of width equal to 0.01% of the area of addressable screen, the interior square as shown in Figure II.4-1. The interior square patch is enclosed in a white (Lwhite) background encompassing the remaining area of the image. The exterior surround will be displayed at 75% Lmax using the input count level for Lwhite as determined above. The interior square will be displayed at input digital count level zero.
Care must be taken during the luminance measurement to ensure that the photometer's measurement field is less than one-half the size of the interior square and is accurately positioned not to extend beyond the boundary of the interior square. The photometer should be checked for light scattering or lens flare effects which allow light from the surround to enter the photosensor. A black card with aperture equal to the measurement field (one-half the size of the interior black square) may be used to shield the photometer from the white exterior square while making measurements in the interior black square.
Analysis: Compute the percent halation for each test target configuration. Percent halation
is defined as: % Halation = Lblack / (Lwhite - Lblack) x 100 Where, Lblack= measured luminance of interior square
displayed at Lblack using input count level zero, Lwhite= measured luminance of interior square
displayed at Lwhite using input count level determined to produce a full screen luminance of 75% Lmax .
Data: Table II.4-1 contains measured values of Lblack, Lwhite and percentage halation.
Table II.4-1 Halation for 1600 x 1200 Addressability
Reported Values Range for 4% uncertainty
Lmin 0.077 fL ± 4% 0.0739 fL to 0.0801 fL
Lblack 1.247 fL ± 4% 1.197 fL to 1.297 fL
Lwhite 30.27 fL ± 4% 29.06 fL to 31.48 fL
Halation 3.88% ± 0.33% 3.56% to 4.22%

Sony GDM-F520 21-inch Color CRT Monitor -13-
Use or disclosure of data on this sheet is subject to the restrictions on the cover and title of this report.
II.5. Color Temperature
Reference: Monochrome CRT Monitor Performance, Draft Version 2.0 Section 5.4, page 22.
The CCT of the measured white point is 6941 K as tested and lies within the boundaries accepted by IEC.
Objective: Insure measured screen white of a color monitor has a correlated color
temperature (CCT) between 6500K and 9300K. Equipment: Colorimeter Procedure: Command screen to Lmax. Measure u’v’ chromaticity coordinates (CIE 1976). Data: Coordinates of screen white should be within 0.01 ∆u’v’ of the corresponding CIE
daylight, which is defined as follows: If the measured screen white has a CCT between 6500 and 9300 K, the corresponding daylight has the same CCT as the screen white. If the measured CCT is greater than 9300 K, the corresponding daylight is D93. If the measured CCT is less than 6500 K, the corresponding daylight is D65. The following equations were used to compute ∆u’v’ values listed in table II.5.1: 1. Compute the correlated color temperature (CCT) associated with (x,y) by the
VESA/McCamy formula: CCT = 437 n^3 + 3601 n^2 + 6831 n + 5517, where n = (x-0.3320)/(0.1858 - y). [This is on p. 227 of the FPDM standard]
2. If CCT < 6500, replace CCT by 6500. If CCT > 9300, replace CCT by 9300. 4. Use formulas 5(3.3.4) and 6(3.3.4) in Wyszecki and Stiles (pp.145-146 second
edition) to compute the point (xd,yd) associated with CCT. • First, define u = 1000/CCT. • If CCT < 7000, then xd = -4.6070 u^3 + 2.9678 u^2 + 0.09911 u + • 0.244063. • If CCT > 7000, then xd = -2.0064 u^3 + 1.9018 u^2 + 0.24748 u + • 0.237040. • In either case, yd = -3.000 xd^2 + 2.870 xd -0.275.
5. Convert (x,y) and (xd,yd) to u'v' coordinates:
• (u',v') = (4x,9y)/(3 + 12y - 2x) • (u'd,v'd) = (4xd,9yd)/(3 + 12yd - 2xd)
6. Evaluate delta-u'v' between (u,v) and (ud,vd):
• delta-u'v' = sqrt[(u' - u'd)^2 + (v' - v'd)^2].

-14- NIDL
Use or disclosure of data on this sheet is subject to the restrictions on the cover and title of this report.
7. If delta-u'v' is greater than 0.01, display fails the test. Otherwise it passes the test.
Correlated Color Temperature
0.43
0.44
0.45
0.46
0.47
0.48
0.17 0.18 0.19 0.20 0.21 0.22
u'
v'
9300 Limit
6500 Limit
1600 x 1200 x 85 hz
Error bars denote delta u'v' = 0.010
Figure II.5-1 CCTs of measured white points are within the boundaries required by IEC.
Table II.5-1 ∆u’v’ Distances between measured white points and CIE coordinate values from D65 to D93.
1600 x 1200
CIE x 0.307 CIE y 0.318 CIE u' 0.198 CIE v' 0.461
CCT 6941 K delta u'v' 0.003
II.6. Bit Depth
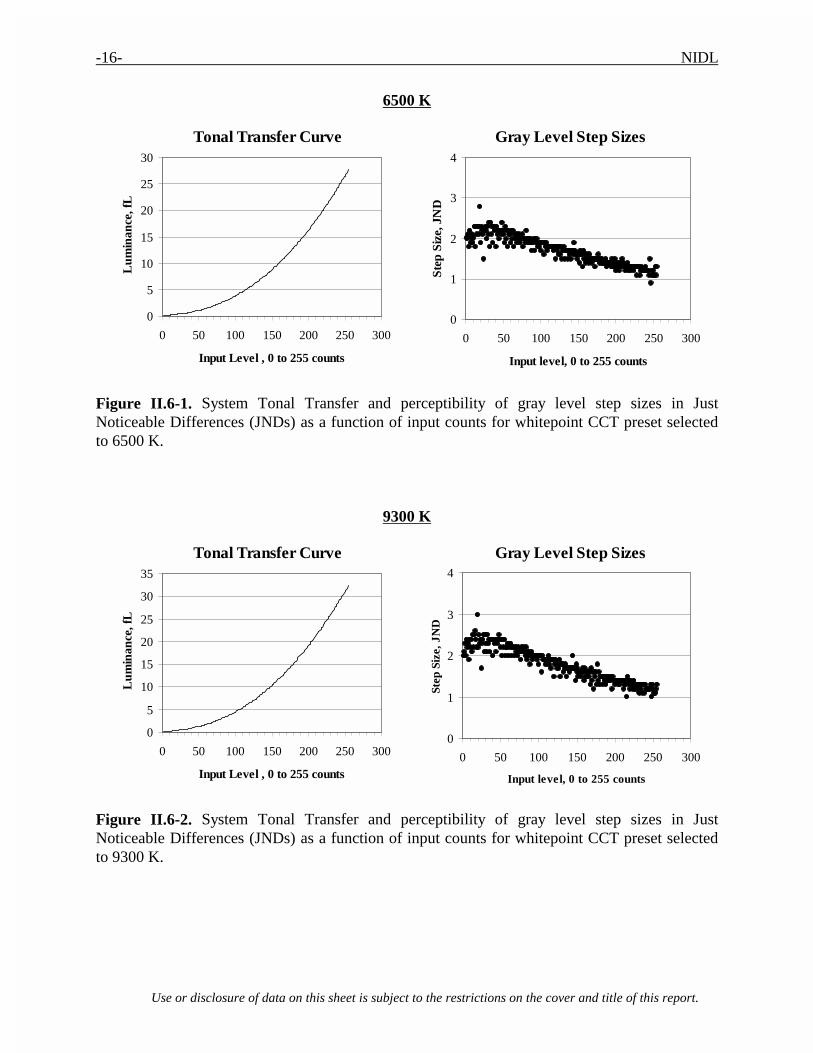
Reference: Request for Evaluation Monitors, NIDL Pub. 0201099-091, Section 5.6, p 6. Positive increases in luminance were measured for each of the 256 input levels for 8 bits of gray scale. Between one and two JNDs separated each level. Neither black level clipping nor white level saturation was observed at 6500K or 9300K CCT presets. The shapes of the tonal transfer curves for both 6500K and 9300K are similar; 9300K achieves a 20% higher Lmax compared to 6500K.
Sony GDM-F520 21-inch Color CRT Monitor -15-
Use or disclosure of data on this sheet is subject to the restrictions on the cover and title of this report.
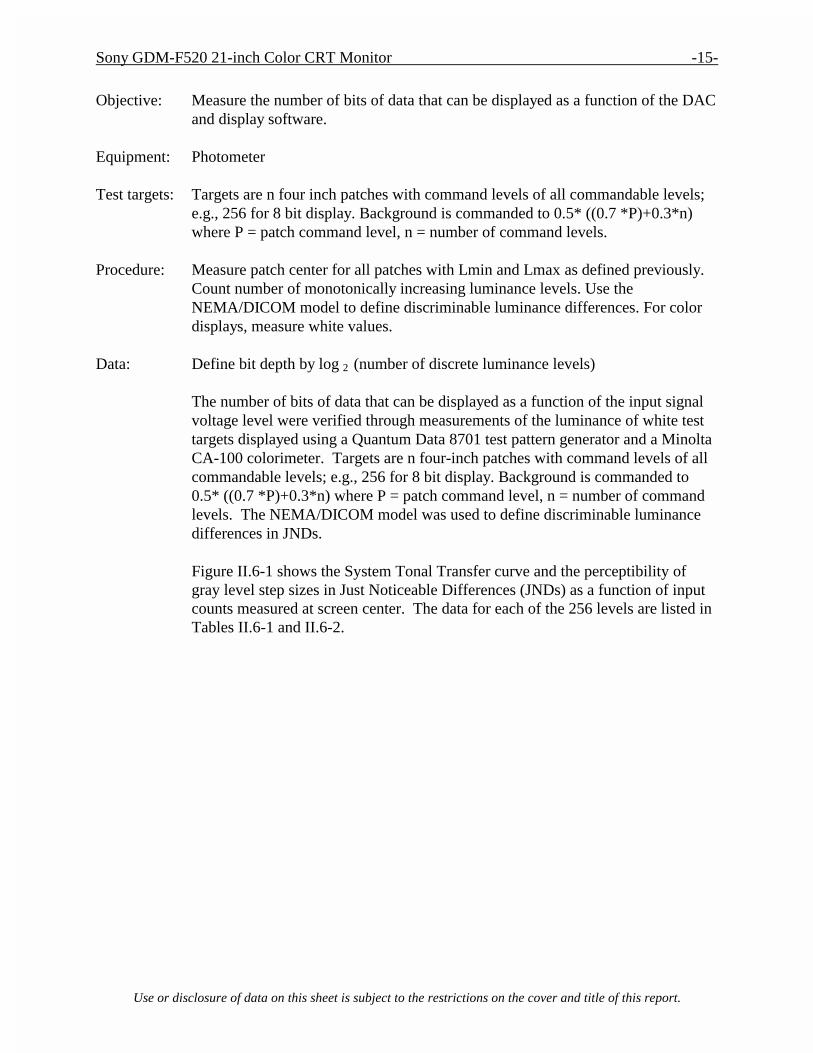
Objective: Measure the number of bits of data that can be displayed as a function of the DAC
and display software. Equipment: Photometer Test targets: Targets are n four inch patches with command levels of all commandable levels;
e.g., 256 for 8 bit display. Background is commanded to 0.5* ((0.7 *P)+0.3*n) where P = patch command level, n = number of command levels.
Procedure: Measure patch center for all patches with Lmin and Lmax as defined previously.
Count number of monotonically increasing luminance levels. Use the NEMA/DICOM model to define discriminable luminance differences. For color displays, measure white values.
Data: Define bit depth by log 2 (number of discrete luminance levels)
The number of bits of data that can be displayed as a function of the input signal voltage level were verified through measurements of the luminance of white test targets displayed using a Quantum Data 8701 test pattern generator and a Minolta CA-100 colorimeter. Targets are n four-inch patches with command levels of all commandable levels; e.g., 256 for 8 bit display. Background is commanded to 0.5* ((0.7 *P)+0.3*n) where P = patch command level, n = number of command levels. The NEMA/DICOM model was used to define discriminable luminance differences in JNDs. Figure II.6-1 shows the System Tonal Transfer curve and the perceptibility of gray level step sizes in Just Noticeable Differences (JNDs) as a function of input counts measured at screen center. The data for each of the 256 levels are listed in Tables II.6-1 and II.6-2.
-16- NIDL
Use or disclosure of data on this sheet is subject to the restrictions on the cover and title of this report.
6500 K
Tonal Transfer Curve
0
5
10
15
20
25
30
0 50 100 150 200 250 300
Input Level , 0 to 255 counts
Lum
inan
ce, f
LGray Level Step Sizes
0
1
2
3
4
0 50 100 150 200 250 300
Input level, 0 to 255 counts
Step
Siz
e, J
ND
Figure II.6-1. System Tonal Transfer and perceptibility of gray level step sizes in Just Noticeable Differences (JNDs) as a function of input counts for whitepoint CCT preset selected to 6500 K.
9300 K
Tonal Transfer Curve
0
5
10
15
20
25
30
35
0 50 100 150 200 250 300
Input Level , 0 to 255 counts
Lum
inan
ce, f
L
Gray Level Step Sizes
0
1
2
3
4
0 50 100 150 200 250 300
Input level, 0 to 255 counts
Step
Siz
e, J
ND
Figure II.6-2. System Tonal Transfer and perceptibility of gray level step sizes in Just Noticeable Differences (JNDs) as a function of input counts for whitepoint CCT preset selected to 9300 K.

Sony GDM-F520 21-inch Color CRT Monitor -17-
Use or disclosure of data on this sheet is subject to the restrictions on the cover and title of this report.
Table II.6-1. System Tonal Transfer for CCT of 6500K as a function of input counts 000 to 127. Background Target L, fL Diff, fL Diff, JND Background Target L, fL Diff, fL Diff, JND
38 0 0.104 0 0.0 61 64 1.692 0.040 1.8 39 1 0.112 0.008 2.0 61 65 1.74 0.048 2.1 39 2 0.12 0.008 2.0 62 66 1.787 0.047 2.0 39 3 0.129 0.009 2.1 62 67 1.836 0.049 2.1 40 4 0.137 0.008 1.8 62 68 1.882 0.046 1.9 40 5 0.147 0.010 2.2 63 69 1.932 0.050 2.1 41 6 0.156 0.009 1.9 63 70 1.982 0.050 2.0 41 7 0.166 0.010 2.0 63 71 2.035 0.053 2.1 41 8 0.177 0.011 2.1 64 72 2.083 0.048 1.9 42 9 0.187 0.010 1.9 64 73 2.137 0.054 2.0 42 10 0.198 0.011 2.0 64 74 2.190 0.053 2.0 42 11 0.211 0.013 2.3 65 75 2.246 0.056 2.1 43 12 0.222 0.011 1.8 65 76 2.296 0.050 1.8 43 13 0.236 0.014 2.3 65 77 2.353 0.057 2.0 43 14 0.249 0.013 2.1 66 78 2.409 0.056 2.0 44 15 0.264 0.015 2.3 66 79 2.464 0.055 1.9 44 16 0.28 0.016 2.3 66 80 2.528 0.064 2.2 44 17 0.296 0.016 2.3 67 81 2.589 0.061 2.0 45 18 0.311 0.015 2.1 67 82 2.650 0.061 2.0 45 19 0.332 0.021 2.8 67 83 2.710 0.060 1.9 45 20 0.347 0.015 1.9 68 84 2.768 0.058 1.9 46 21 0.366 0.019 2.3 68 85 2.832 0.064 2.0 46 22 0.384 0.018 2.2 69 86 2.895 0.063 1.9 46 23 0.402 0.018 2.1 69 87 2.962 0.067 2.0 47 24 0.415 0.013 1.5 69 88 3.018 0.056 1.7 47 25 0.435 0.020 2.2 70 89 3.085 0.067 1.9 48 26 0.456 0.021 2.3 70 90 3.152 0.067 1.9 48 27 0.477 0.021 2.2 70 91 3.222 0.070 2.0 48 28 0.496 0.019 2.0 71 92 3.283 0.061 1.7 49 29 0.519 0.023 2.3 71 93 3.354 0.071 2.0 49 30 0.541 0.022 2.1 71 94 3.424 0.070 1.9 49 31 0.566 0.025 2.4 72 95 3.499 0.075 2.0 50 32 0.586 0.020 1.8 72 96 3.567 0.068 1.8 50 33 0.613 0.027 2.4 72 97 3.642 0.075 1.9 50 34 0.637 0.024 2.1 73 98 3.715 0.073 1.8 51 35 0.664 0.027 2.3 73 99 3.791 0.076 1.9 51 36 0.687 0.023 1.9 73 100 3.858 0.067 1.7 51 37 0.715 0.028 2.3 74 101 3.937 0.079 1.9 52 38 0.743 0.028 2.2 74 102 4.016 0.079 1.9 52 39 0.773 0.030 2.3 74 103 4.095 0.079 1.9 52 40 0.797 0.024 1.8 75 104 4.165 0.070 1.6 53 41 0.828 0.031 2.3 75 105 4.247 0.082 1.9 53 42 0.857 0.029 2.1 76 106 4.328 0.081 1.8 53 43 0.889 0.032 2.2 76 107 4.413 0.085 1.9 54 44 0.918 0.029 2.0 76 108 4.489 0.076 1.7 54 45 0.951 0.033 2.2 77 109 4.574 0.085 1.8 55 46 0.984 0.033 2.2 77 110 4.655 0.081 1.8 55 47 1.018 0.034 2.1 77 111 4.743 0.088 1.8 55 48 1.055 0.037 2.4 78 112 4.830 0.087 1.8 56 49 1.092 0.037 2.2 78 113 4.918 0.088 1.8 56 50 1.127 0.035 2.1 78 114 5.005 0.087 1.8 56 51 1.165 0.038 2.2 79 115 5.096 0.091 1.8 57 52 1.198 0.033 1.9 79 116 5.181 0.085 1.7 57 53 1.238 0.040 2.3 79 117 5.274 0.093 1.8 57 54 1.275 0.037 2.0 80 118 5.367 0.093 1.8 58 55 1.316 0.041 2.2 80 119 5.464 0.097 1.8 58 56 1.351 0.035 1.8 80 120 5.545 0.081 1.5 58 57 1.393 0.042 2.2 81 121 5.642 0.097 1.8 59 58 1.434 0.041 2.1 81 122 5.735 0.093 1.7 59 59 1.477 0.043 2.1 81 123 5.837 0.102 1.8 59 60 1.516 0.039 1.9 82 124 5.925 0.088 1.6 60 61 1.561 0.045 2.2 82 125 6.027 0.102 1.8 60 62 1.604 0.043 2.0 83 126 6.123 0.096 1.6 60 63 1.652 0.048 2.2 83 127 6.228 0.105 1.8

-18- NIDL
Use or disclosure of data on this sheet is subject to the restrictions on the cover and title of this report.
Table II.6-2. System Tonal Transfer for CCT of 6500K as a function of input counts 128 to 255. Background Target L, fL Diff, fL Diff, JND Background Target L, fL Diff, fL Diff, JND
83 128 6.313 0.085 1.5 106 192 14.89 0.16 1.4 84 129 6.418 0.105 1.7 106 193 15.07 0.18 1.4 84 130 6.523 0.105 1.7 106 194 15.23 0.16 1.3 84 131 6.631 0.108 1.8 107 195 15.41 0.18 1.5 85 132 6.727 0.096 1.5 107 196 15.57 0.16 1.3 85 133 6.836 0.109 1.7 107 197 15.75 0.18 1.4 85 134 6.943 0.107 1.7 108 198 15.92 0.17 1.3 86 135 7.054 0.111 1.7 108 199 16.11 0.19 1.5 86 136 7.151 0.097 1.5 108 200 16.27 0.16 1.2 86 137 7.262 0.111 1.7 109 201 16.45 0.18 1.4 87 138 7.372 0.11 1.6 109 202 16.62 0.17 1.3 87 139 7.489 0.117 1.7 109 203 16.81 0.19 1.4 87 140 7.591 0.102 1.5 110 204 16.97 0.16 1.2 88 141 7.711 0.12 1.7 110 205 17.16 0.19 1.4 88 142 7.825 0.114 1.7 111 206 17.34 0.18 1.3 88 143 7.945 0.12 1.6 111 207 17.53 0.19 1.4 89 144 8.082 0.137 1.9 111 208 17.74 0.21 1.5 89 145 8.202 0.12 1.7 112 209 17.93 0.19 1.3 90 146 8.321 0.119 1.6 112 210 18.12 0.19 1.4 90 147 8.444 0.123 1.6 112 211 18.31 0.19 1.3 90 148 8.555 0.111 1.5 113 212 18.48 0.17 1.2 91 149 8.680 0.125 1.6 113 213 18.68 0.2 1.3 91 150 8.803 0.123 1.6 113 214 18.87 0.19 1.3 91 151 8.931 0.128 1.6 114 215 19.08 0.21 1.4 92 152 9.042 0.111 1.4 114 216 19.25 0.17 1.2 92 153 9.173 0.131 1.7 114 217 19.45 0.2 1.3 92 154 9.302 0.129 1.6 115 218 19.65 0.2 1.3 93 155 9.433 0.131 1.6 115 219 19.85 0.2 1.3 93 156 9.547 0.114 1.3 115 220 20.04 0.19 1.2 93 157 9.684 0.137 1.7 116 221 20.25 0.21 1.3 94 158 9.815 0.131 1.5 116 222 20.45 0.2 1.3 94 159 9.95 0.135 1.6 116 223 20.65 0.2 1.3 94 160 10.07 0.12 1.4 117 224 20.85 0.2 1.2 95 161 10.21 0.14 1.6 117 225 21.06 0.21 1.3 95 162 10.35 0.14 1.5 118 226 21.27 0.21 1.3 95 163 10.49 0.14 1.6 118 227 21.49 0.22 1.3 96 164 10.62 0.13 1.4 118 228 21.68 0.19 1.1 96 165 10.76 0.14 1.6 119 229 21.90 0.22 1.3 97 166 10.90 0.14 1.5 119 230 22.11 0.21 1.3 97 167 11.04 0.14 1.5 119 231 22.33 0.22 1.3 97 168 11.17 0.13 1.4 120 232 22.52 0.19 1.1 98 169 11.32 0.15 1.5 120 233 22.74 0.22 1.2 98 170 11.46 0.14 1.5 120 234 22.96 0.22 1.3 98 171 11.61 0.15 1.5 121 235 23.18 0.22 1.2 99 172 11.74 0.13 1.3 121 236 23.38 0.2 1.2 99 173 11.89 0.15 1.5 121 237 23.61 0.23 1.2 99 174 12.04 0.15 1.5 122 238 23.82 0.21 1.2
100 175 12.19 0.15 1.5 122 239 24.05 0.23 1.3 100 176 12.35 0.16 1.6 122 240 24.27 0.22 1.2 100 177 12.51 0.16 1.5 123 241 24.50 0.23 1.2 101 178 12.66 0.15 1.4 123 242 24.72 0.22 1.2 101 179 12.82 0.16 1.5 123 243 24.96 0.24 1.2 101 180 12.96 0.14 1.4 124 244 25.17 0.21 1.1 102 181 13.13 0.17 1.5 124 245 25.45 0.281 1.5 102 182 13.28 0.15 1.4 125 246 25.63 0.179 0.9 102 183 13.44 0.16 1.4 125 247 25.86 0.23 1.2 103 184 13.59 0.15 1.4 125 248 26.07 0.21 1.1 103 185 13.75 0.16 1.4 126 249 26.31 0.24 1.2 104 186 13.91 0.16 1.4 126 250 26.53 0.22 1.1 104 187 14.08 0.17 1.5 126 251 26.76 0.23 1.1 104 188 14.23 0.15 1.3 127 252 26.98 0.22 1.1 105 189 14.39 0.16 1.4 127 253 27.24 0.26 1.3 105 190 14.56 0.17 1.4 127 254 27.47 0.23 1.1 105 191 14.73 0.17 1.4 128 255 27.74 0.27 1.3
Sony GDM-F520 21-inch Color CRT Monitor -19-
Use or disclosure of data on this sheet is subject to the restrictions on the cover and title of this report.
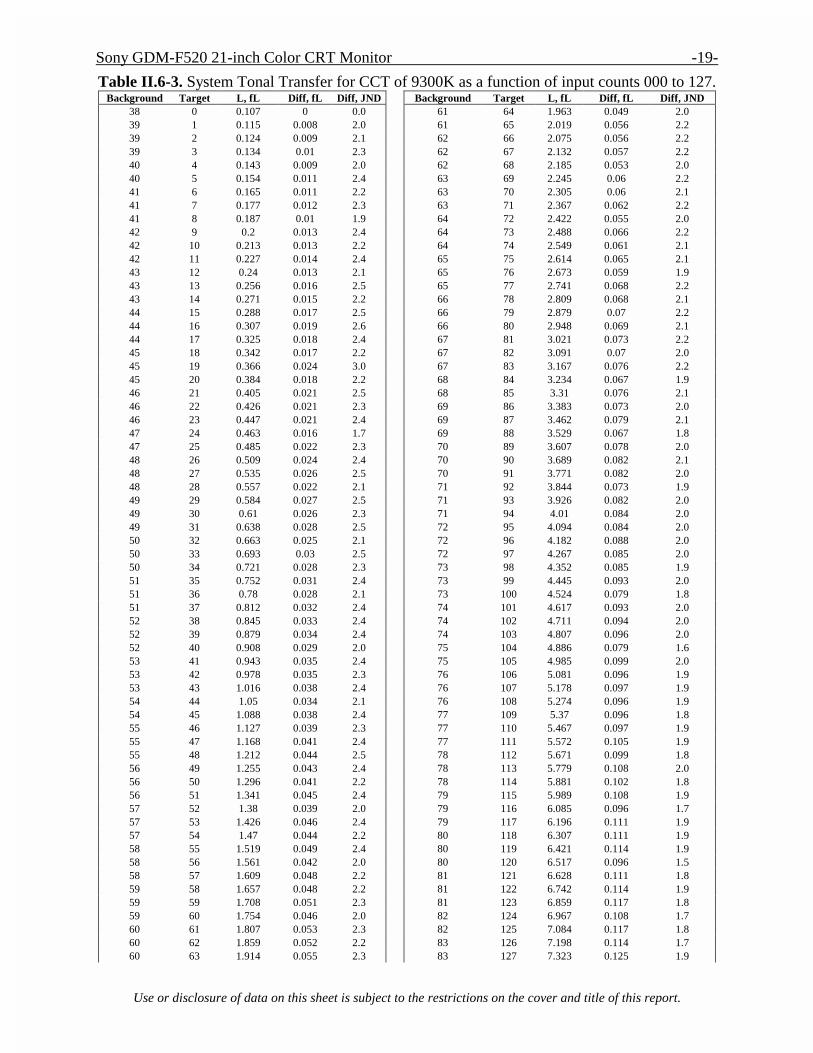
Table II.6-3. System Tonal Transfer for CCT of 9300K as a function of input counts 000 to 127. Background Target L, fL Diff, fL Diff, JND Background Target L, fL Diff, fL Diff, JND
38 0 0.107 0 0.0 61 64 1.963 0.049 2.0 39 1 0.115 0.008 2.0 61 65 2.019 0.056 2.2 39 2 0.124 0.009 2.1 62 66 2.075 0.056 2.2 39 3 0.134 0.01 2.3 62 67 2.132 0.057 2.2 40 4 0.143 0.009 2.0 62 68 2.185 0.053 2.0 40 5 0.154 0.011 2.4 63 69 2.245 0.06 2.2 41 6 0.165 0.011 2.2 63 70 2.305 0.06 2.1 41 7 0.177 0.012 2.3 63 71 2.367 0.062 2.2 41 8 0.187 0.01 1.9 64 72 2.422 0.055 2.0 42 9 0.2 0.013 2.4 64 73 2.488 0.066 2.2 42 10 0.213 0.013 2.2 64 74 2.549 0.061 2.1 42 11 0.227 0.014 2.4 65 75 2.614 0.065 2.1 43 12 0.24 0.013 2.1 65 76 2.673 0.059 1.9 43 13 0.256 0.016 2.5 65 77 2.741 0.068 2.2 43 14 0.271 0.015 2.2 66 78 2.809 0.068 2.1 44 15 0.288 0.017 2.5 66 79 2.879 0.07 2.2 44 16 0.307 0.019 2.6 66 80 2.948 0.069 2.1 44 17 0.325 0.018 2.4 67 81 3.021 0.073 2.2 45 18 0.342 0.017 2.2 67 82 3.091 0.07 2.0 45 19 0.366 0.024 3.0 67 83 3.167 0.076 2.2 45 20 0.384 0.018 2.2 68 84 3.234 0.067 1.9 46 21 0.405 0.021 2.5 68 85 3.31 0.076 2.1 46 22 0.426 0.021 2.3 69 86 3.383 0.073 2.0 46 23 0.447 0.021 2.4 69 87 3.462 0.079 2.1 47 24 0.463 0.016 1.7 69 88 3.529 0.067 1.8 47 25 0.485 0.022 2.3 70 89 3.607 0.078 2.0 48 26 0.509 0.024 2.4 70 90 3.689 0.082 2.1 48 27 0.535 0.026 2.5 70 91 3.771 0.082 2.0 48 28 0.557 0.022 2.1 71 92 3.844 0.073 1.9 49 29 0.584 0.027 2.5 71 93 3.926 0.082 2.0 49 30 0.61 0.026 2.3 71 94 4.01 0.084 2.0 49 31 0.638 0.028 2.5 72 95 4.094 0.084 2.0 50 32 0.663 0.025 2.1 72 96 4.182 0.088 2.0 50 33 0.693 0.03 2.5 72 97 4.267 0.085 2.0 50 34 0.721 0.028 2.3 73 98 4.352 0.085 1.9 51 35 0.752 0.031 2.4 73 99 4.445 0.093 2.0 51 36 0.78 0.028 2.1 73 100 4.524 0.079 1.8 51 37 0.812 0.032 2.4 74 101 4.617 0.093 2.0 52 38 0.845 0.033 2.4 74 102 4.711 0.094 2.0 52 39 0.879 0.034 2.4 74 103 4.807 0.096 2.0 52 40 0.908 0.029 2.0 75 104 4.886 0.079 1.6 53 41 0.943 0.035 2.4 75 105 4.985 0.099 2.0 53 42 0.978 0.035 2.3 76 106 5.081 0.096 1.9 53 43 1.016 0.038 2.4 76 107 5.178 0.097 1.9 54 44 1.05 0.034 2.1 76 108 5.274 0.096 1.9 54 45 1.088 0.038 2.4 77 109 5.37 0.096 1.8 55 46 1.127 0.039 2.3 77 110 5.467 0.097 1.9 55 47 1.168 0.041 2.4 77 111 5.572 0.105 1.9 55 48 1.212 0.044 2.5 78 112 5.671 0.099 1.8 56 49 1.255 0.043 2.4 78 113 5.779 0.108 2.0 56 50 1.296 0.041 2.2 78 114 5.881 0.102 1.8 56 51 1.341 0.045 2.4 79 115 5.989 0.108 1.9 57 52 1.38 0.039 2.0 79 116 6.085 0.096 1.7 57 53 1.426 0.046 2.4 79 117 6.196 0.111 1.9 57 54 1.47 0.044 2.2 80 118 6.307 0.111 1.9 58 55 1.519 0.049 2.4 80 119 6.421 0.114 1.9 58 56 1.561 0.042 2.0 80 120 6.517 0.096 1.5 58 57 1.609 0.048 2.2 81 121 6.628 0.111 1.8 59 58 1.657 0.048 2.2 81 122 6.742 0.114 1.9 59 59 1.708 0.051 2.3 81 123 6.859 0.117 1.8 59 60 1.754 0.046 2.0 82 124 6.967 0.108 1.7 60 61 1.807 0.053 2.3 82 125 7.084 0.117 1.8 60 62 1.859 0.052 2.2 83 126 7.198 0.114 1.7 60 63 1.914 0.055 2.3 83 127 7.323 0.125 1.9

-20- NIDL
Use or disclosure of data on this sheet is subject to the restrictions on the cover and title of this report.
Table II.6-4. System Tonal Transfer for CCT of 9300K as a function of input counts 128 to 255. Background Target L, fL Diff, fL Diff, JND Background Target L, fL Diff, fL Diff, JND
83 128 7.425 0.102 1.5 106 192 17.47 0.2 1.5 84 129 7.551 0.126 1.8 106 193 17.67 0.2 1.4 84 130 7.67 0.119 1.8 106 194 17.87 0.2 1.4 84 131 7.799 0.129 1.8 107 195 18.08 0.21 1.5 85 132 7.91 0.111 1.6 107 196 18.26 0.18 1.2 85 133 8.041 0.131 1.8 107 197 18.47 0.21 1.5 85 134 8.164 0.123 1.7 108 198 18.68 0.21 1.4 86 135 8.298 0.134 1.8 108 199 18.89 0.21 1.4 86 136 8.409 0.111 1.5 108 200 19.08 0.19 1.3 86 137 8.543 0.134 1.7 109 201 19.29 0.21 1.4 87 138 8.669 0.126 1.7 109 202 19.5 0.21 1.4 87 139 8.806 0.137 1.7 109 203 19.72 0.22 1.4 87 140 8.925 0.119 1.6 110 204 19.91 0.19 1.3 88 141 9.065 0.14 1.7 110 205 20.13 0.22 1.4 88 142 9.201 0.136 1.7 111 206 20.34 0.21 1.3 88 143 9.34 0.139 1.7 111 207 20.56 0.22 1.4 89 144 9.5 0.16 2.0 111 208 20.79 0.23 1.4 89 145 9.646 0.146 1.7 112 209 21.02 0.23 1.4 90 146 9.786 0.14 1.7 112 210 21.24 0.22 1.4 90 147 9.932 0.146 1.7 112 211 21.47 0.23 1.4 90 148 10.06 0.128 1.4 113 212 21.67 0.2 1.2 91 149 10.21 0.15 1.8 113 213 21.9 0.23 1.3 91 150 10.36 0.15 1.7 113 214 22.13 0.23 1.4 91 151 10.51 0.15 1.6 114 215 22.36 0.23 1.3 92 152 10.64 0.13 1.5 114 216 22.526 0.166 1.0 92 153 10.79 0.15 1.6 114 217 22.79 0.264 1.5 92 154 10.94 0.15 1.6 115 218 23.03 0.24 1.4 93 155 11.09 0.15 1.6 115 219 23.26 0.23 1.3 93 156 11.23 0.14 1.5 115 220 23.48 0.22 1.2 93 157 11.39 0.16 1.6 116 221 23.73 0.25 1.4 94 158 11.55 0.16 1.7 116 222 23.96 0.23 1.3 94 159 11.71 0.16 1.6 116 223 24.2 0.24 1.3 94 160 11.85 0.14 1.4 117 224 24.43 0.23 1.2 95 161 12.02 0.17 1.7 117 225 24.68 0.25 1.4 95 162 12.17 0.15 1.5 118 226 24.92 0.24 1.2 95 163 12.33 0.16 1.6 118 227 25.17 0.25 1.3 96 164 12.49 0.16 1.5 118 228 25.39 0.22 1.2 96 165 12.66 0.17 1.6 119 229 25.64 0.25 1.3 97 166 12.82 0.16 1.5 119 230 25.87 0.23 1.2 97 167 12.99 0.17 1.6 119 231 26.13 0.26 1.3 97 168 13.13 0.14 1.3 120 232 26.35 0.22 1.1 98 169 13.31 0.18 1.7 120 233 26.61 0.26 1.3 98 170 13.47 0.16 1.4 120 234 26.85 0.24 1.2 98 171 13.65 0.18 1.6 121 235 27.11 0.26 1.3 99 172 13.78 0.13 1.2 121 236 27.34 0.23 1.1 99 173 13.97 0.19 1.6 121 237 27.6 0.26 1.3 99 174 14.14 0.17 1.5 122 238 27.87 0.27 1.3
100 175 14.32 0.18 1.6 122 239 28.12 0.25 1.1 100 176 14.48 0.16 1.3 122 240 28.38 0.26 1.3 100 177 14.69 0.21 1.8 123 241 28.65 0.27 1.2 101 178 14.86 0.17 1.4 123 242 28.89 0.24 1.2 101 179 15.05 0.19 1.6 123 243 29.17 0.28 1.2 101 180 15.21 0.16 1.3 124 244 29.42 0.25 1.2 102 181 15.4 0.19 1.5 124 245 29.68 0.26 1.2 102 182 15.58 0.18 1.5 125 246 29.95 0.27 1.2 102 183 15.78 0.2 1.5 125 247 30.24 0.29 1.3 103 184 15.94 0.16 1.3 125 248 30.47 0.23 1.0 103 185 16.13 0.19 1.5 126 249 30.76 0.29 1.3 104 186 16.32 0.19 1.4 126 250 31.03 0.27 1.2 104 187 16.52 0.2 1.5 126 251 31.29 0.26 1.1 104 188 16.69 0.17 1.3 127 252 31.55 0.26 1.1 105 189 16.89 0.2 1.5 127 253 31.81 0.26 1.1 105 190 17.08 0.19 1.4 127 254 32.1 0.29 1.2 105 191 17.27 0.19 1.4 128 255 32.4 0.3 1.3
Sony GDM-F520 21-inch Color CRT Monitor -21-
Use or disclosure of data on this sheet is subject to the restrictions on the cover and title of this report.
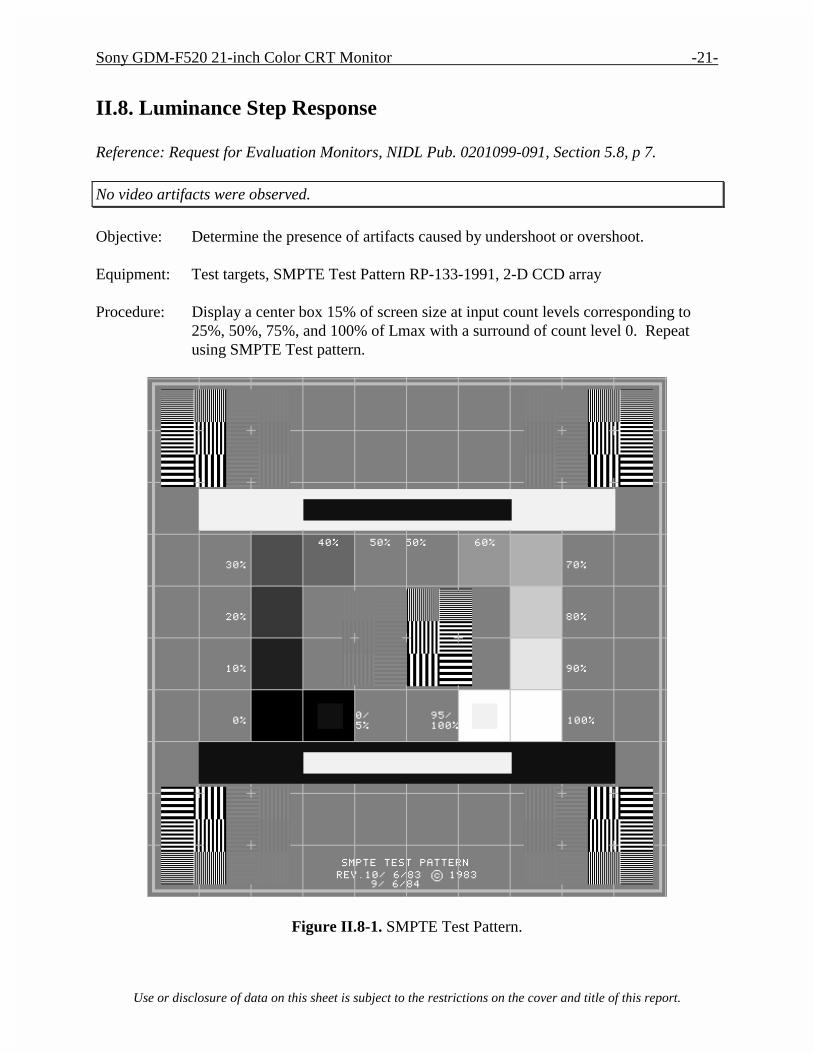
II.8. Luminance Step Response
Reference: Request for Evaluation Monitors, NIDL Pub. 0201099-091, Section 5.8, p 7.
No video artifacts were observed.
Objective: Determine the presence of artifacts caused by undershoot or overshoot. Equipment: Test targets, SMPTE Test Pattern RP-133-1991, 2-D CCD array Procedure: Display a center box 15% of screen size at input count levels corresponding to
25%, 50%, 75%, and 100% of Lmax with a surround of count level 0. Repeat using SMPTE Test pattern.
Figure II.8-1. SMPTE Test Pattern.
-22- NIDL
Use or disclosure of data on this sheet is subject to the restrictions on the cover and title of this report.
Data: Define passes by absence of noticeable ringing, undershoot, overshoot, or streaking. The test pattern shown in Figure II.8-1 was used in the visual evaluation of the monitor. This test pattern is defined in SMPTE Recommended Practice RP-133-1986 published by the Society of Motion Picture and Television Engineers (SMPTE) for medical imaging applications. Referring to the large white-in-black and black-in-white horizontal bars contained in the test pattern, RP133-1986, paragraph 2.7 states “ These areas of maximum contrast facilitate detection of mid-band streaking (poor low-frequency response), video amplifier ringing or overshoot, deflection interference, and halo.” None of these artifacts was observed in the Sony GDM-F520 monitor, signifying good electrical performance of the video circuits.
II.9. Monoscopic and Stereoscopic Addressability
Reference: Monochrome CRT Monitor Performance, Draft Version 2.0, Section 6.1, page 67.
This monitor properly displayed all addressed pixels for the following tested formats (HxV): 1600 x 1200 x 85 Hz, monoscopic mode; 1024 x 1024 x 121 up to 128 Hz, 1280 x 1024 x 121 Hz, stereoscopic mode.
Objective: Define the number of addressable pixels in the horizontal and vertical dimension;
confirm that stated number of pixels is displayed. Equipment: Programmable video signal generator.
Test pattern with pixels lit on first and last addressable rows and columns and on two diagonal lines beginning at upper left and lower right; H & V grill patterns 1-on/1-off.
Procedure: The number of addressed pixels were programmed into the Quantum Data 8701 test pattern generator for 85 Hz refresh rate which exceeds the 72 Hz minimum required by IEC for monoscopic mode and 120 Hz for stereoscopic mode, the minimum required by IEC. All perimeter lines were confirmed to be visible with no irregular jaggies on diagonals.
Data: If tests passed, number of pixels in horizontal and vertical dimension. If test fails,
addressability unknown.
Table II.9-1 Addressabilities Tested Monoscopic Mode Stereoscopic Modes
1600 x 1200 x 85 Hz 1024 x 1024 x 121 Hz 1280 x 1024 x 121 Hz 1024 x 1024 x 128 Hz
Sony GDM-F520 21-inch Color CRT Monitor -23-
Use or disclosure of data on this sheet is subject to the restrictions on the cover and title of this report.
II.10. Pixel Aspect Ratio
Reference: Request for Evaluation Monitors, NIDL Pub. 0201099-091, Section 5.10, p 8.
Pixel aspect ratio is within 0.6%.
Objective: Characterize aspect ratio of pixels. Equipment: Test target, measuring tape with at least 1/16th inch increments Procedure: Display box of 400 x 400 pixels at input count corresponding to 50% Lmax and
background of 0. Measure horizontal and vertical dimension.
Alternatively, divide number of addressable pixels by the total image size to obtain nominal pixel spacings in horizontal and vertical directions.
Data: Define pass if H= V± 6% for pixel density <100 ppi and ± 10% for pixel density >
100 ppi.
Table II.10-1. Pixel Aspect Ratio
Addressability (H x V) 1600 x 1200 full image
H x V Image Size (inches) 15.288 x 11.405 H x V Average Pixel Spacing (mils) 9.56 x 9.50 mils H x V Pixel Aspect Ratio H = V + 0.6%
II.11. Screen Size (Viewable Active Image)
Reference: VESA Flat Panel Display Measurements Standard, Version 1.0, May 15, 1998, Section 501-1.
Image size for 1600 x 1200 format was 19.074 inches in diagonal.
Objective: Measure beam position on the CRT display to quantify width and height of active
image size visible by the user (excludes any over scanned portion of an image). Equipment: • Video generator
• Spatially calibrated CCD or photodiode array optic module • Calibrated X-Y translation stage
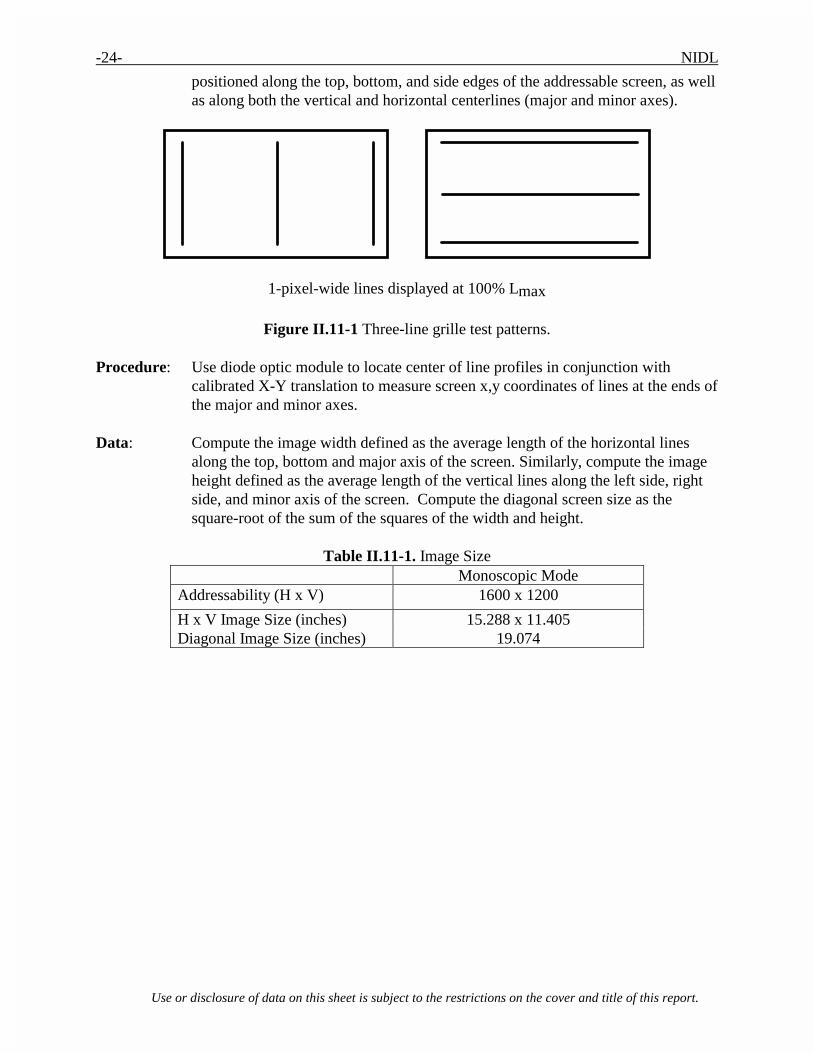
Test Pattern: Use the three-line grille patterns in Figure II.11-1 for vertical and horizontal lines
each 1-pixel wide. Lines in test pattern are displayed at 100% Lmax must be
-24- NIDL
Use or disclosure of data on this sheet is subject to the restrictions on the cover and title of this report.
positioned along the top, bottom, and side edges of the addressable screen, as well as along both the vertical and horizontal centerlines (major and minor axes).
1-pixel-wide lines displayed at 100% Lmax
Figure II.11-1 Three-line grille test patterns.
Procedure: Use diode optic module to locate center of line profiles in conjunction with calibrated X-Y translation to measure screen x,y coordinates of lines at the ends of the major and minor axes.
Data: Compute the image width defined as the average length of the horizontal lines
along the top, bottom and major axis of the screen. Similarly, compute the image height defined as the average length of the vertical lines along the left side, right side, and minor axis of the screen. Compute the diagonal screen size as the square-root of the sum of the squares of the width and height.
Table II.11-1. Image Size
Monoscopic Mode Addressability (H x V) 1600 x 1200
H x V Image Size (inches) 15.288 x 11.405 Diagonal Image Size (inches) 19.074

Sony GDM-F520 21-inch Color CRT Monitor -25-
Use or disclosure of data on this sheet is subject to the restrictions on the cover and title of this report.
II.12. Contrast Modulation
Reference: Monochrome CRT Monitor Performance, Draft Version 2.0, Section 5.2, page 57. Contrast modulation (Cm) for 1-on/1-off grille patterns displayed at 50% Lmax exceeded Cm = 43% in Zone A of diameter 7.6 inches, and Zone A diameter of 9.42 inches (40% of image area). Cm exceeded 41% in Zone B. Moiré cancellation circuitry was turned OFF for this measurement. These values substantially exceed the IEC specifications. Contrast modulation for a vertical grille pattern (measurement in the horizontal direction) is somewhat lower for a 9300K setting than for 6500K. The horizontal grille values (measurement in the vertical direction) are virtually identical for both 9300K and 6500K.
Objective: Quantify contrast modulation as a function of screen position. Equipment: • Video generator • Spatially calibrated CCD or photodiode array optic module • Photometer with linearized response Procedure: The maximum video modulation frequency for each format (1024 x 1024, 1920 x
1200) was examined using horizontal and vertical grille test patterns consisting of alternating lines with 1 pixel on, 1 pixel off. Contrast modulation was measured in both horizontal and vertical directions at screen center and at eight peripheral screen positions. The measurements should be along the horizontal and vertical axes and along the diagonal from these axes. Use edge measurements no more than 10% of screen size in from border of active screen. The input signal level was set so that 1-line-on/1-line-off horizontal grille patterns produced a screen area-luminance of 25% of maximum level, Lmax.
Zone A is defined as a 24 degree subtended circle from a viewing distance of 18 inches (7.6 inch circle). Zone B is the remainder of the display. Use edge measurements no more than 10% of screen size in from border of active screen area to define Cm for Zone B (remaining area outside center circle). Determine Cm at eight points on circumference of circle by interpolating between center and display edge measurements to define Cm for Zone A. If measurements exceed the threshold, do not make any more measurements. If one or more measurements fail the threshold, make eight additional measurements at the edge (but wholly within) the defined circle.
Data: Values of vertical and horizontal Cm for Zone A and Zone B are given in Table
II.12-1. The contrast modulation, Cm, is reported (the defining equation is given below) for the 1-on/1-off grille patterns.
Lpeak - Lvalley Cm =
Lpeak + Lvalley

-26- NIDL
Use or disclosure of data on this sheet is subject to the restrictions on the cover and title of this report.
The sample contrast modulations shown in Figure II.12-1 for two different color CRTs are not fully realized because of the presence of moiré caused by aliasing between the image and the shadow mask. Because contrast modulation values are calculated for the maximum peak and minimum valley luminance levels as indicated in the sample data shown, they do not include the degrading effects of aliasing.
0
30
60
90
120
0 250 500
0
50
100
150
200
0 250 500
Monitor A Monitor B
0.28mm dot pitch 0.26mm dot pitch
Figure II.12-1. Contrast modulation for sample luminance profiles (1 pixel at input level corresponding to 50% Lmax, 1 pixel at level 0 = Lmin) for monitors exhibiting moiré due to aliasing.

Sony GDM-F520 21-inch Color CRT Monitor -27-
Use or disclosure of data on this sheet is subject to the restrictions on the cover and title of this report.
Table II.12-1. Contrast Modulation Corrected for lens flare and Zone Interpolation
Moiré Cancellation OFF
CCT Set to 6941K
Zone A = 7.6-inch diameter circle for 24-degree subtended circle at 18-inches viewing distance
Left Minor Right H-grille V-grille H-grille V-grille H-grille V-grille H-grille V-grille H-grille V-grille
Top 53% 62% 44% 66% 49% 63% 49% 66% 45% 67% 47% 66%
Major 62% 61% 54% 65% 46% 68% 53% 66% 60% 63% 47% 67% 43% 70% 52% 67%
Bottom 50% 66% 41% 71% 61% 66%
Zone A = 9.42-inch diameter circle for 40% area
Left Minor Right H-grille V-grille H-grille V-grille H-grille V-grille H-grille V-grille H-grille V-grille
Top 53% 62% 44% 66% 49% 63% 49% 65% 44% 66% 47% 66%
Major 62% 61% 56% 64% 46% 68% 54% 65% 60% 63% 48% 67% 42% 71% 53% 67%
Bottom 50% 66% 41% 71% 61% 66%
CCT Set to 9300K
Zone A = 7.6-inch diameter circle for 24-degree subtended circle at 18-inches viewing distance
Left Minor Right H-grille V-grille H-grille V-grille H-grille V-grille H-grille V-grille H-grille V-grille
Top 63% 56% 44% 59% 63% 42% 50% 56% 43% 58% 51% 50%
Major 60% 47% 51% 52% 42% 56% 55% 58% 68% 59% 48% 51% 43% 56% 52% 56%
Bottom 56% 42% 43% 55% 66% 55%
Zone A = 9.42-inch diameter circle for 40% area
Left Minor Right H-grille V-grille H-grille V-grille H-grille V-grille H-grille V-grille H-grille V-grille
Top 63% 56% 44% 59% 63% 42% 52% 56% 44% 59% 53% 49%
Major 60% 47% 53% 51% 42% 56% 58% 58% 68% 59% 49% 49% 43% 55% 54% 56%
Bottom 56% 42% 43% 55% 66% 55%
II.13. Pixel Density
Reference: Request for Evaluation Monitors, NIDL Pub. 0201099-091, Section 5.13, p 9.
Pixel density was 105 ppi as tested for the 1600 x 1200-line addressable format.
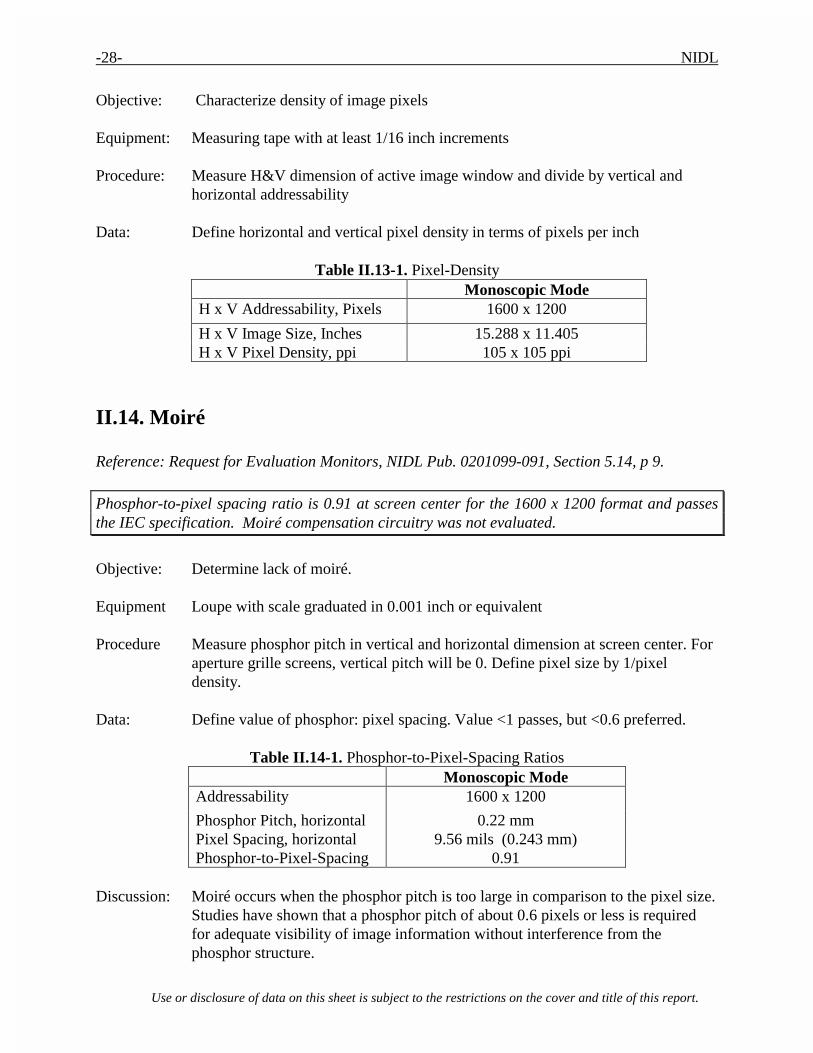
-28- NIDL
Use or disclosure of data on this sheet is subject to the restrictions on the cover and title of this report.
Objective: Characterize density of image pixels Equipment: Measuring tape with at least 1/16 inch increments Procedure: Measure H&V dimension of active image window and divide by vertical and
horizontal addressability Data: Define horizontal and vertical pixel density in terms of pixels per inch
Table II.13-1. Pixel-Density
Monoscopic Mode H x V Addressability, Pixels 1600 x 1200
H x V Image Size, Inches 15.288 x 11.405 H x V Pixel Density, ppi 105 x 105 ppi
II.14. Moiré
Reference: Request for Evaluation Monitors, NIDL Pub. 0201099-091, Section 5.14, p 9.
Phosphor-to-pixel spacing ratio is 0.91 at screen center for the 1600 x 1200 format and passes the IEC specification. Moiré compensation circuitry was not evaluated.
Objective: Determine lack of moiré. Equipment Loupe with scale graduated in 0.001 inch or equivalent Procedure Measure phosphor pitch in vertical and horizontal dimension at screen center. For
aperture grille screens, vertical pitch will be 0. Define pixel size by 1/pixel density.
Data: Define value of phosphor: pixel spacing. Value <1 passes, but <0.6 preferred.
Table II.14-1. Phosphor-to-Pixel-Spacing Ratios Monoscopic Mode Addressability 1600 x 1200
Phosphor Pitch, horizontal 0.22 mm Pixel Spacing, horizontal 9.56 mils (0.243 mm) Phosphor-to-Pixel-Spacing 0.91
Discussion: Moiré occurs when the phosphor pitch is too large in comparison to the pixel size.
Studies have shown that a phosphor pitch of about 0.6 pixels or less is required for adequate visibility of image information without interference from the phosphor structure.

Sony GDM-F520 21-inch Color CRT Monitor -29-
Use or disclosure of data on this sheet is subject to the restrictions on the cover and title of this report.
0
30
60
90
120
0 250 500
0
50
100
150
200
0 250 500
Monitor A Monitor B
0.28mm dot pitch 0.26mm dot pitch
Figure II.14-1. Contrast modulation for sample luminance profiles (1pixel at level 50, 1 pixel at level 0) for monitors exhibiting moiré due to aliasing. In Figure II.14-1, Monitor A phosphor pitch is 0.90 pixels as compared with 0.84 pixels in Monitor B. Moiré is more visible in Monitor A, appearing as long stripes where contrast modulation has been degraded. In Monitor B, moiré is less visible, appearing as "fish-scales" where contrast modulation has been reduced. Even though the Monitor A exhibits a greater loss of contrast modulation from the presence of moiré on 1-on/1-off vertical grille patterns, there is little or no visual impact when aerial photographic images are displayed. NIDL experts in human vision and psychophysics were unable to discern presence of moiré on either monitor when grayscale imagery was displayed.
II.15. Straightness
Reference: Monochrome CRT Monitor Performance, Draft Version 2.0, Section 6.1 Waviness, page 67.
Waviness, a measure of straightness, did not exceed 0.15% of the image width or height and passes the IEC specification.
Objective: Measure beam position on the CRT display to quantify effects of waviness
which causes nonlinearities within small areas of the display distorting nominally straight features in images, characters, and symbols.
Equipment: • Video generator
• Spatially calibrated CCD or photodiode array optic module • Calibrated X-Y translation stage

-30- NIDL
Use or disclosure of data on this sheet is subject to the restrictions on the cover and title of this report.
Test Pattern: Use the three-line grille patterns in Figure II.15-1 for vertical and
horizontal lines each 1-pixel wide. Lines in test pattern are displayed at 100% Lmax must be positioned along the top, bottom, and side edges of the addressable screen, as well as along both the vertical and horizontal centerlines (major and minor axes).
1-pixel-wide lines displayed at 100% Lmax
Figure II.15-1. Three-line grille test patterns.
A
CD
5% of total widthTotal width of addressable screen
Center screen (x=0, y=0)
B
-x +x
+y
-y
E
F
G
H
Figure II.15-2. Measurement locations for waviness along horizontal lines. Points A, B, C, D are extreme corner points of addressable screen. Points E, F, G, H are the endpoints of the axes.
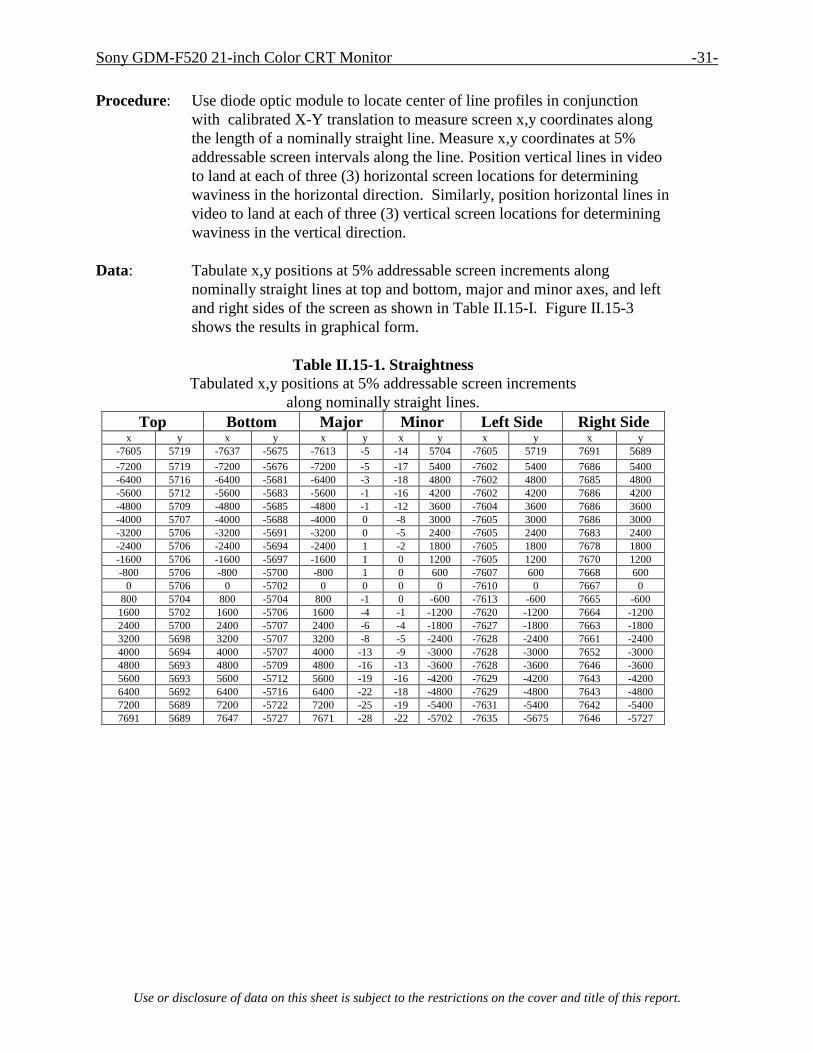
Sony GDM-F520 21-inch Color CRT Monitor -31-
Use or disclosure of data on this sheet is subject to the restrictions on the cover and title of this report.
Procedure: Use diode optic module to locate center of line profiles in conjunction
with calibrated X-Y translation to measure screen x,y coordinates along the length of a nominally straight line. Measure x,y coordinates at 5% addressable screen intervals along the line. Position vertical lines in video to land at each of three (3) horizontal screen locations for determining waviness in the horizontal direction. Similarly, position horizontal lines in video to land at each of three (3) vertical screen locations for determining waviness in the vertical direction.
Data: Tabulate x,y positions at 5% addressable screen increments along
nominally straight lines at top and bottom, major and minor axes, and left and right sides of the screen as shown in Table II.15-I. Figure II.15-3 shows the results in graphical form.
Table II.15-1. Straightness
Tabulated x,y positions at 5% addressable screen increments along nominally straight lines.
Top Bottom Major Minor Left Side Right Side x y x y x y x y x y x y
-7605 5719 -7637 -5675 -7613 -5 -14 5704 -7605 5719 7691 5689
-7200 5719 -7200 -5676 -7200 -5 -17 5400 -7602 5400 7686 5400 -6400 5716 -6400 -5681 -6400 -3 -18 4800 -7602 4800 7685 4800 -5600 5712 -5600 -5683 -5600 -1 -16 4200 -7602 4200 7686 4200 -4800 5709 -4800 -5685 -4800 -1 -12 3600 -7604 3600 7686 3600 -4000 5707 -4000 -5688 -4000 0 -8 3000 -7605 3000 7686 3000 -3200 5706 -3200 -5691 -3200 0 -5 2400 -7605 2400 7683 2400 -2400 5706 -2400 -5694 -2400 1 -2 1800 -7605 1800 7678 1800 -1600 5706 -1600 -5697 -1600 1 0 1200 -7605 1200 7670 1200 -800 5706 -800 -5700 -800 1 0 600 -7607 600 7668 600
0 5706 0 -5702 0 0 0 0 -7610 0 7667 0 800 5704 800 -5704 800 -1 0 -600 -7613 -600 7665 -600
1600 5702 1600 -5706 1600 -4 -1 -1200 -7620 -1200 7664 -1200 2400 5700 2400 -5707 2400 -6 -4 -1800 -7627 -1800 7663 -1800 3200 5698 3200 -5707 3200 -8 -5 -2400 -7628 -2400 7661 -2400 4000 5694 4000 -5707 4000 -13 -9 -3000 -7628 -3000 7652 -3000 4800 5693 4800 -5709 4800 -16 -13 -3600 -7628 -3600 7646 -3600 5600 5693 5600 -5712 5600 -19 -16 -4200 -7629 -4200 7643 -4200 6400 5692 6400 -5716 6400 -22 -18 -4800 -7629 -4800 7643 -4800 7200 5689 7200 -5722 7200 -25 -19 -5400 -7631 -5400 7642 -5400 7691 5689 7647 -5727 7671 -28 -22 -5702 -7635 -5675 7646 -5727

-32- NIDL
Use or disclosure of data on this sheet is subject to the restrictions on the cover and title of this report.
Figure II.15-3. Waviness of Sony GDM-F520 color monitor in 1600 x 1200 mode. Departures from straight lines are exaggerated on a 10X scale. Error bars are +/- 0.5% of total screen size.
II.16. Refresh Rate
Reference: Request for Evaluation Monitors, NIDL Pub. 0201099-091, Section 5.16, p 9.
Vertical refresh rate for 1600 x 1200 format was set to 85 Hz. Vertical refresh rate for the 1024 x 1024 or 1280 x 1024 stereo format was set to 121 Hz. The maximum vertical refresh rate achieved at 1024 x 1024 is 128.2 Hz, and at 1280 x 1024 is 129.4 Hz.
Objective: Define vertical and horizontal refresh rates. Equipment: Programmable video signal generator. Procedure: The refresh rates were programmed into the Quantum Data 8701 test
pattern generator for 72 Hz minimum for monoscopic mode and 120 Hz minimum for stereoscopic mode, where possible.
Data: Report refresh rates in Hz.
Table II.16-1 Refresh Rates as Tested Monoscopic Mode Stereo Mode Addressability 1600 x 1200 1024 x 1024 Vertical Scan 85.0 Hz 121-128.2 Hz Horizontal Scan 106.250 kHz 130.243 – 137.969 kHz

Sony GDM-F520 21-inch Color CRT Monitor -33-
Use or disclosure of data on this sheet is subject to the restrictions on the cover and title of this report.
II.17. Extinction Ratio
Reference: Request for Evaluation Monitors, NIDL Pub. 0201099-091, Section 5.17, p10.
Stereo extinction ratio using the StereoGraphics ZScreen and passive polarized glasses averaged 12:1 (12.6 left, 12.3 right) at screen center. Luminance of white varied by up to 9.6 % across the screen. Chromaticity variations of white were less than 0.006 delta u'v' units. Stereo extinction ratio using StereoGraphics LC shutter glasses averaged 21 to 1 (21.3 left, 19.9 right) at screen center, and 11 to 1 along the bottom of the screen when tested in 1024 x 1024 x 121 Hz (60.5 Hz per eye) mode. Luminance of white varied by up to 17.3% across the screen.
Objective: Measure stereo extinction ratio. Equipment: Two “stereo” pairs with full addressability. One pair has left center at
command level of 255 (or Cmax) and right center at 0. The other pair has right center at command level of 255 (or Cmax) and left center at 0.
Stereoscopic-mode measurements were made using commercially available StereoGraphics CrystalEyes 3 Stereoscopic Visualization Eyewear and ENT Emitter. Stereoscopic-mode measurements were also made using a commercially-available StereoGraphics ZScreen with passive polarized eyeglasses.
Procedure: Calibrate monitor to 0.1 fL Lmin and at least 30 fL Lmax for monochrome
monitors and at least 6 fL Lmax for color monitors (no ambient) at the analyst's eye position, e.g., through the ZScreen and passive glasses. Measure ratio of Lmax to Lmin on both left and right side images through the stereo system.
Data: Extinction ratio (left) = L (left,on, white/black)/left,off, black/white)
L(left,on, white/black) ~ trans(left,on)*trans(stereo)*L(max)*Duty(left) + trans(left,off)*trans (stereo)*L(min)*Duty (right) Use left,off/right,on to perform this measurement Extinction ratio (right) = L (right,on,white/black)/right,off, black/white) L(right,on, white/black) ~ trans(right,on)*trans(stereo)*L(max)*Duty(right) + trans(right,off)*trans (stereo)*L(min)*Duty (left) Use left,on/right,off to perform this measurement Stereo extinction ratio is average of left and right ratios defined above.

-34- NIDL
Use or disclosure of data on this sheet is subject to the restrictions on the cover and title of this report.
Left Eye Image Right Eye Image
StereoGraphics ZScreen LC Shutter with Passive Glasses
02
4
6
8
10
Left Center RightL
umin
ance
[fL
] .Top Center Bottom
Right Eye, Black/White
0
0.2
0.4
0.6
0.8
Left Center Right
Lum
inan
ce [f
L] .
Top Center Bottom
Left Eye, Black/White
StereoGraphics CrystalEyes Active Glasses
02468
10
Left Center Right
Lum
inan
ce [f
L] .
Top Center Bottom
Right Eye, Black/White
0
0.2
0.4
0.6
0.8
Left Center Right
Lum
inan
ce [f
L] .
Top Center Bottom
Left Eye, Black/White
Figure II.17-1. Spatial Uniformity of luminance in stereo mode when displaying black
to the left eye while displaying white to the right eye.
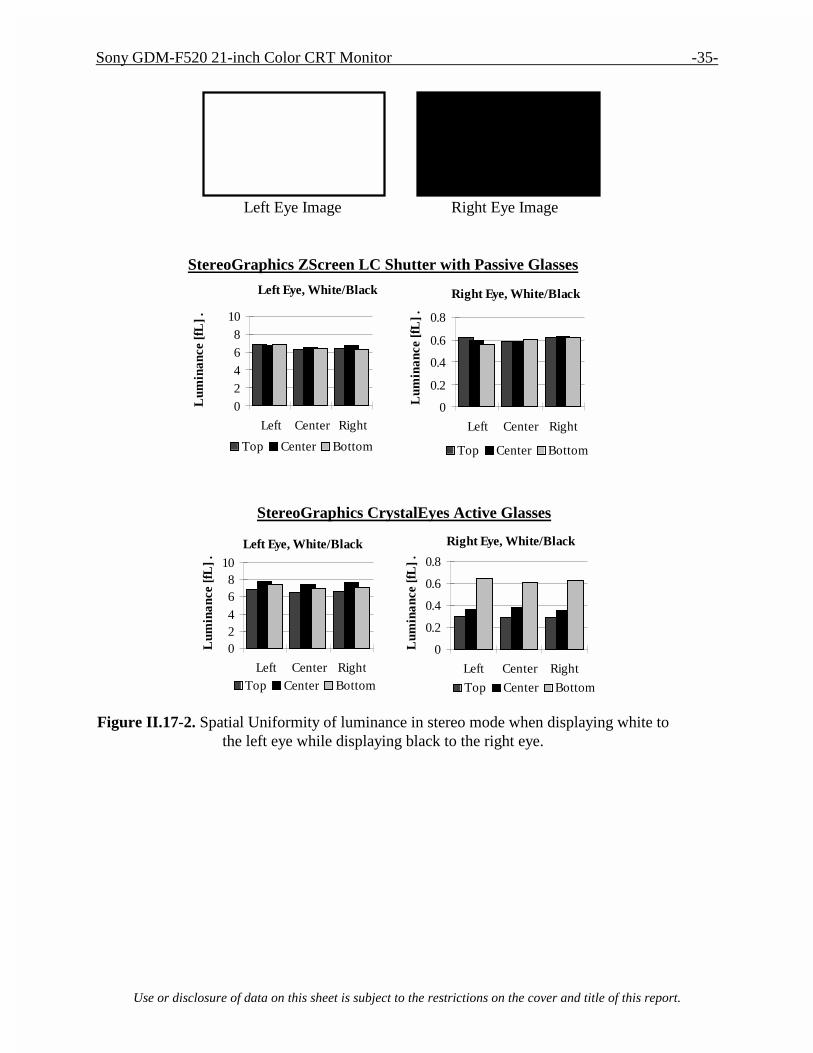
Sony GDM-F520 21-inch Color CRT Monitor -35-
Use or disclosure of data on this sheet is subject to the restrictions on the cover and title of this report.
Left Eye Image Right Eye Image
StereoGraphics ZScreen LC Shutter with Passive Glasses
0
0.2
0.4
0.6
0.8
Left Center RightL
umin
ance
[fL
] .
Top Center Bottom
Right Eye, White/Black
0
24
68
10
Left Center Right
Lum
inan
ce [f
L] .
Top Center Bottom
Left Eye, White/Black
StereoGraphics CrystalEyes Active Glasses
0
0.2
0.4
0.6
0.8
Left Center Right
Lum
inan
ce [f
L] .
Top Center Bottom
Right Eye, White/Black
024
68
10
Left Center Right
Lum
inan
ce [f
L] .
Top Center Bottom
Left Eye, White/Black
Figure II.17-2. Spatial Uniformity of luminance in stereo mode when displaying white to
the left eye while displaying black to the right eye.

-36- NIDL
Use or disclosure of data on this sheet is subject to the restrictions on the cover and title of this report.
StereoGraphics ZScreen LC Shutter with Passive Glasses
Right Eye
02468
101214
Left Center Right
Ext
inct
ion
Rat
io
Top Center Bottom
Left Eye
02468
101214
Left Center Right
Ext
inct
ion
Rat
io
Top Center Bottom
StereoGraphics CrystalEyes Active Glasses
Right Eye
0
5
10
15
20
25
Left Center Right
Top Center Bottom
Left Eye
0
5
10
15
20
25
Left Center Right
Ext
inct
ion
Rat
io
Top Center Bottom
Figure II.17-3. Spatial Uniformity of extinction ratio in stereo mode.

Sony GDM-F520 21-inch Color CRT Monitor -37-
Use or disclosure of data on this sheet is subject to the restrictions on the cover and title of this report.
Left Eye Image Right Eye Image
StereoGraphics ZScreen LC Shutter with Passive Glasses
0
2
4
6
8
Left Center Right
Lum
inan
ce [f
L] .
Top Center Bottom
Right Eye, White/White
0
2
4
6
8
Left Center Right
Lum
inan
ce [f
L] .
Top Center Bottom
Left Eye, White/White
StereoGraphics CrystalEyes Active Glasses
0
2
4
6
8
Left Center Right
Lum
inan
ce [f
L] .
Top Center Bottom
Right Eye, White/White
0
2
4
6
8
Left Center Right
Lum
inan
ce [f
L] .
Top Center Bottom
Left Eye, White/White
Figure II.17-4. Spatial uniformity of luminance of white in stereo mode.
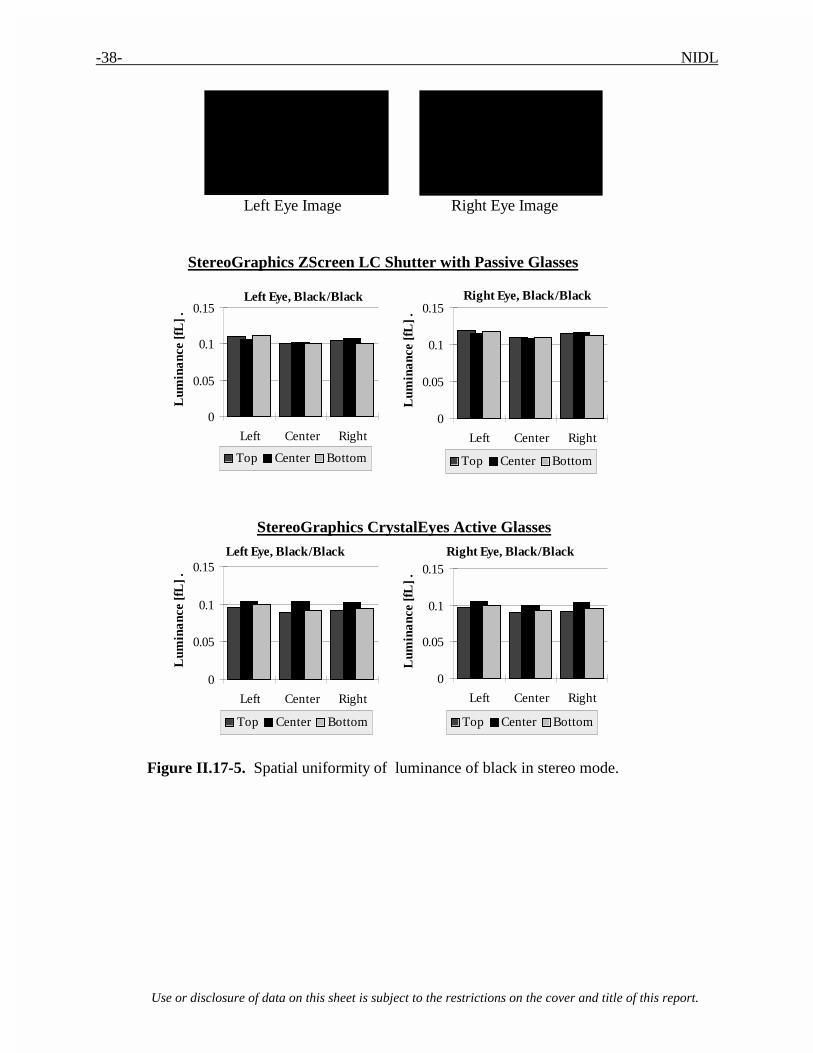
-38- NIDL
Use or disclosure of data on this sheet is subject to the restrictions on the cover and title of this report.
Left Eye Image Right Eye Image
StereoGraphics ZScreen LC Shutter with Passive Glasses
0
0.05
0.1
0.15
Left Center Right
Lum
inan
ce [f
L] .
Top Center Bottom
Right Eye, Black/Black
0
0.05
0.1
0.15
Left Center Right
Lum
inan
ce [f
L] .
Top Center Bottom
Left Eye, Black/Black
StereoGraphics CrystalEyes Active Glasses
0
0.05
0.1
0.15
Left Center Right
Lum
inan
ce [f
L] .
Top Center Bottom
Right Eye, Black/Black
0
0.05
0.1
0.15
Left Center Right
Lum
inan
ce [f
L] .
Top Center Bottom
Left Eye, Black/Black
Figure II.17-5. Spatial uniformity of luminance of black in stereo mode.

Sony GDM-F520 21-inch Color CRT Monitor -39-
Use or disclosure of data on this sheet is subject to the restrictions on the cover and title of this report.
Left Eye Image Right Eye Image
StereoGraphics ZScreen LC Shutter with Passive Glasses
0.0000.0010.0020.0030.0040.0050.0060.007
Left Center Right
Del
ta u
'v'
Top Center Bottom
Left Eye, White/White
0.0000.0010.0020.0030.0040.0050.0060.007
Left Center Right
Del
ta u
'v'
Top Center Bottom
Right Eye, White/White
Figure II.17-6. Spatial uniformity of chromaticity of white in stereo mode.
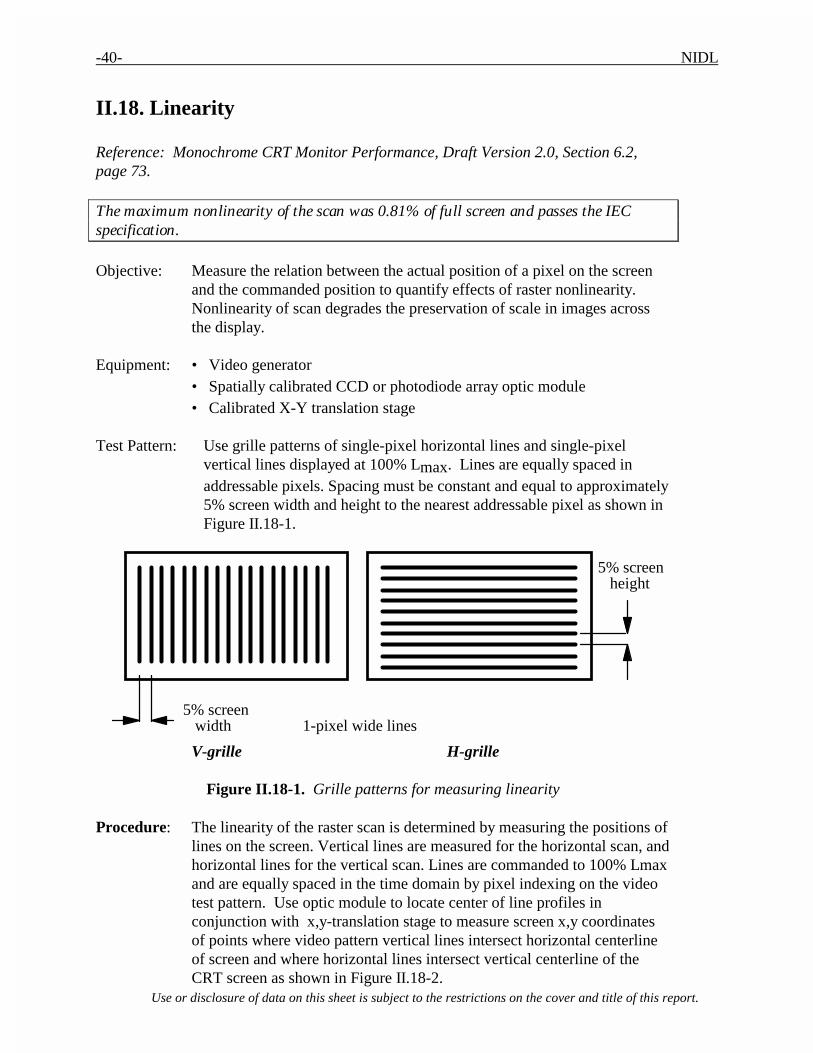
-40- NIDL
Use or disclosure of data on this sheet is subject to the restrictions on the cover and title of this report.
II.18. Linearity
Reference: Monochrome CRT Monitor Performance, Draft Version 2.0, Section 6.2, page 73. The maximum nonlinearity of the scan was 0.81% of full screen and passes the IEC specification. Objective: Measure the relation between the actual position of a pixel on the screen
and the commanded position to quantify effects of raster nonlinearity. Nonlinearity of scan degrades the preservation of scale in images across the display.
Equipment: • Video generator • Spatially calibrated CCD or photodiode array optic module • Calibrated X-Y translation stage Test Pattern: Use grille patterns of single-pixel horizontal lines and single-pixel
vertical lines displayed at 100% Lmax. Lines are equally spaced in addressable pixels. Spacing must be constant and equal to approximately 5% screen width and height to the nearest addressable pixel as shown in Figure II.18-1.
5% screen height
5% screen width 1-pixel wide lines
V-grille H-grille
Figure II.18-1. Grille patterns for measuring linearity
Procedure: The linearity of the raster scan is determined by measuring the positions of lines on the screen. Vertical lines are measured for the horizontal scan, and horizontal lines for the vertical scan. Lines are commanded to 100% Lmax and are equally spaced in the time domain by pixel indexing on the video test pattern. Use optic module to locate center of line profiles in conjunction with x,y-translation stage to measure screen x,y coordinates of points where video pattern vertical lines intersect horizontal centerline of screen and where horizontal lines intersect vertical centerline of the CRT screen as shown in Figure II.18-2.
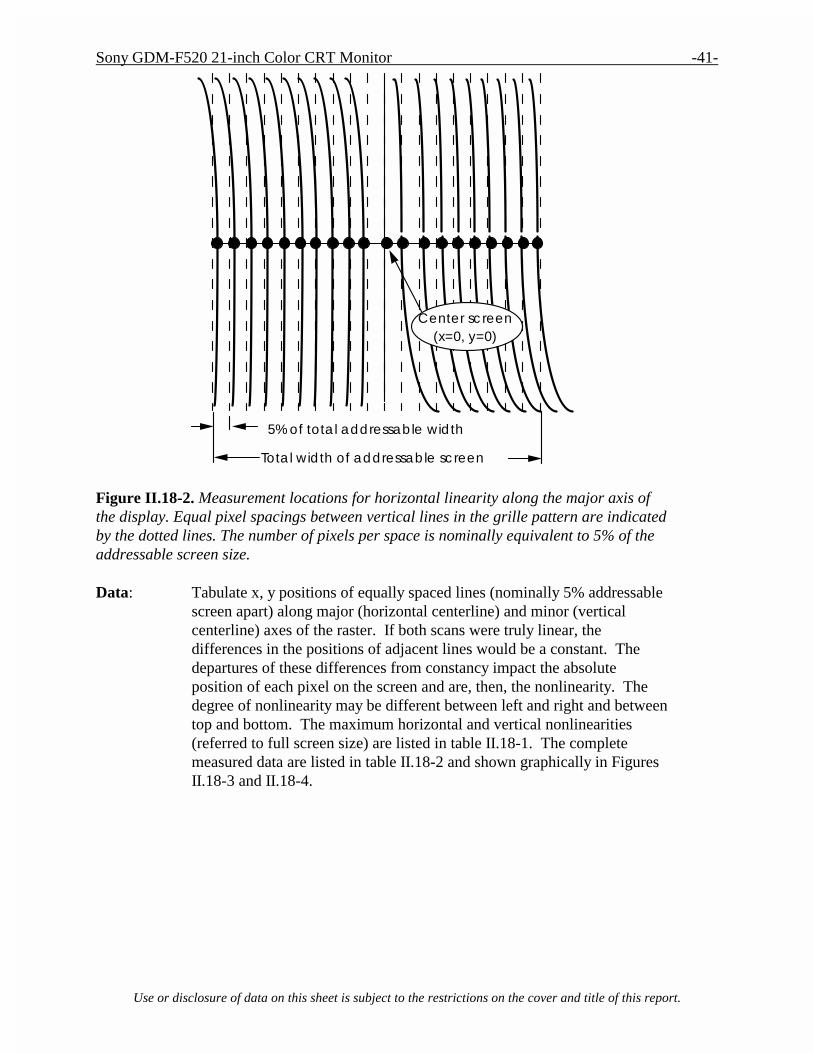
Sony GDM-F520 21-inch Color CRT Monitor -41-
Use or disclosure of data on this sheet is subject to the restrictions on the cover and title of this report.
5% of total addressable width
Total width of addressable screen
Center screen (x=0, y=0)
Figure II.18-2. Measurement locations for horizontal linearity along the major axis of the display. Equal pixel spacings between vertical lines in the grille pattern are indicated by the dotted lines. The number of pixels per space is nominally equivalent to 5% of the addressable screen size.
Data: Tabulate x, y positions of equally spaced lines (nominally 5% addressable
screen apart) along major (horizontal centerline) and minor (vertical centerline) axes of the raster. If both scans were truly linear, the differences in the positions of adjacent lines would be a constant. The departures of these differences from constancy impact the absolute position of each pixel on the screen and are, then, the nonlinearity. The degree of nonlinearity may be different between left and right and between top and bottom. The maximum horizontal and vertical nonlinearities (referred to full screen size) are listed in table II.18-1. The complete measured data are listed in table II.18-2 and shown graphically in Figures II.18-3 and II.18-4.
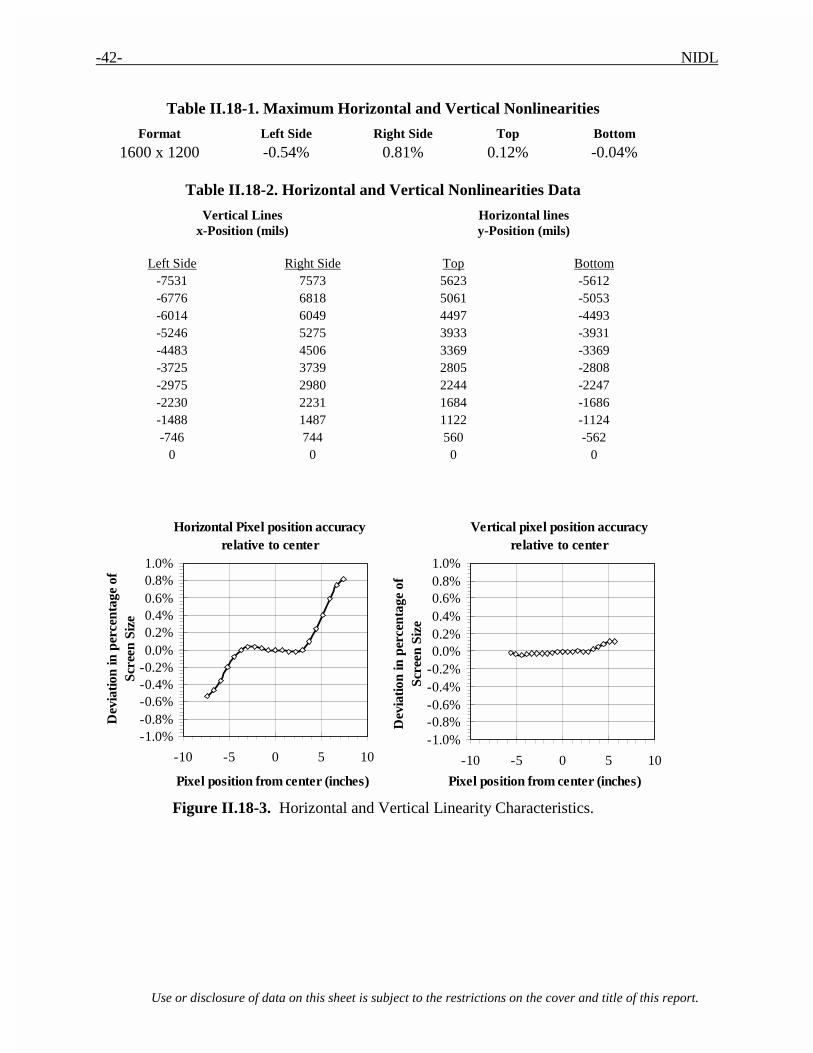
-42- NIDL
Use or disclosure of data on this sheet is subject to the restrictions on the cover and title of this report.
Table II.18-1. Maximum Horizontal and Vertical Nonlinearities
Format Left Side Right Side Top Bottom
1600 x 1200 -0.54% 0.81% 0.12% -0.04%
Table II.18-2. Horizontal and Vertical Nonlinearities Data
Vertical Lines x-Position (mils)
Horizontal lines y-Position (mils)
Left Side Right Side Top Bottom
-7531 7573 5623 -5612 -6776 6818 5061 -5053 -6014 6049 4497 -4493 -5246 5275 3933 -3931 -4483 4506 3369 -3369 -3725 3739 2805 -2808 -2975 2980 2244 -2247 -2230 2231 1684 -1686 -1488 1487 1122 -1124 -746 744 560 -562
0 0 0 0
Horizontal Pixel position accuracyrelative to center
-1.0%-0.8%-0.6%-0.4%-0.2%0.0%0.2%0.4%0.6%0.8%1.0%
-10 -5 0 5 10
Pixel position from center (inches)
Dev
iatio
n in
per
cent
age
of
Scre
en S
ize
Vertical pixel position accuracyrelative to center
-1.0%-0.8%-0.6%-0.4%-0.2%0.0%0.2%0.4%0.6%0.8%1.0%
-10 -5 0 5 10
Pixel position from center (inches)
Dev
iatio
n in
per
cent
age
of
Scre
en S
ize
Figure II.18-3. Horizontal and Vertical Linearity Characteristics.

Sony GDM-F520 21-inch Color CRT Monitor -43-
Use or disclosure of data on this sheet is subject to the restrictions on the cover and title of this report.
II.19. Jitter/Swim/Drift
Reference: Monochrome CRT Monitor Performance, Draft Version 2.0 Section 6.4, p80.
Maximum jitter and swim/drift were 3.57 mils and 4.27 mils, respectively, and pass the IEC specification. Objective: Measure amplitude and frequency of variations in beam spot position of
the CRT display. Quantify the effects of perceptible time varying raster distortions: jitter, swim, and drift. The perceptibility of changes in the position of an image depends upon the amplitude and frequency of the motions, which can be caused by imprecise control electronics or external magnetic fields.
Equipment: • Video generator • Spatially calibrated CCD or photodiode array optic module • Calibrated X-Y translation stage Test Pattern: Use the three-line grille patterns in Figure II.19-1 for vertical and
horizontal lines each 1-pixel wide. Lines in test pattern must be positioned along the top, bottom, and side edges of the addressable screen, as well as along both the vertical and horizontal centerlines (major and minor axes).
V-grille for measuring horizontal motion H-grille for measuring vertical motion
1-pixel wide lines
Three-line grille test patterns. Figure II.19-1.
Procedure: With the monitor set up for intended scanning rates, measure vertical and
horizontal line jitter (0.01 to 2 seconds), swim (2 to 60 seconds) and drift (over 60 seconds) over a 2.5 minute duration as displayed using grille video test patterns. Generate a histogram of raster variance with time. The measurement interval must be equal to a single field period.
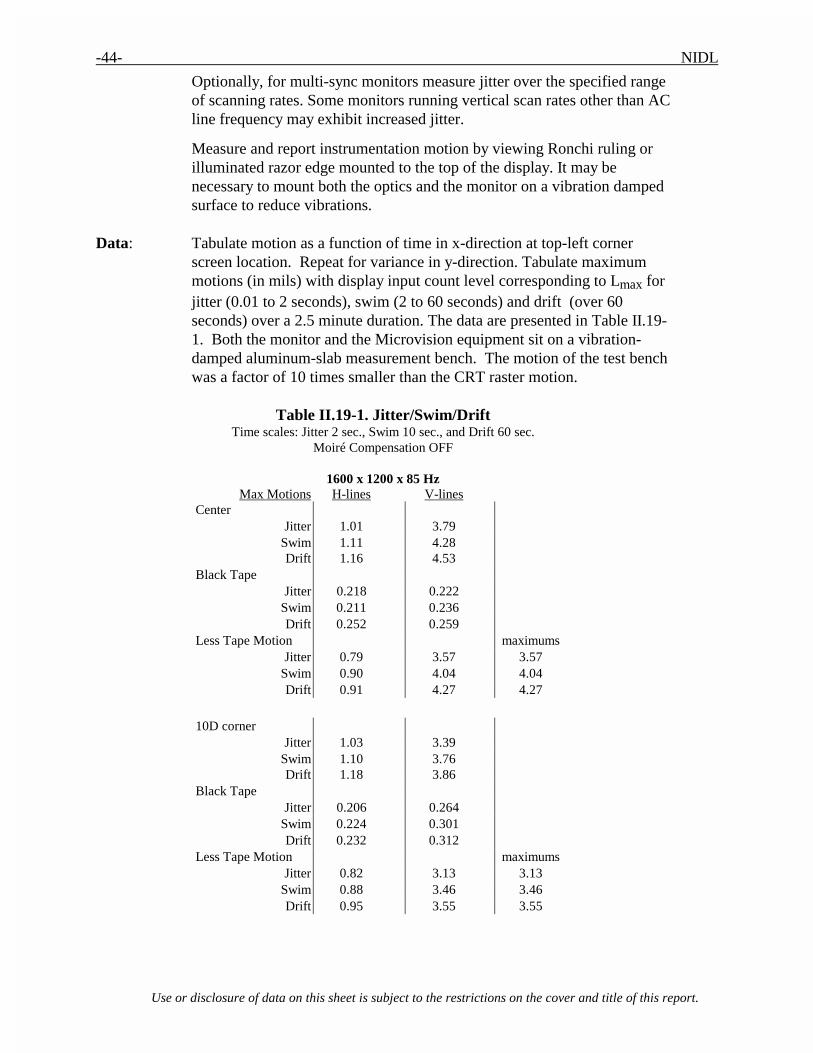
-44- NIDL
Use or disclosure of data on this sheet is subject to the restrictions on the cover and title of this report.
Optionally, for multi-sync monitors measure jitter over the specified range of scanning rates. Some monitors running vertical scan rates other than AC line frequency may exhibit increased jitter.
Measure and report instrumentation motion by viewing Ronchi ruling or illuminated razor edge mounted to the top of the display. It may be necessary to mount both the optics and the monitor on a vibration damped surface to reduce vibrations.
Data: Tabulate motion as a function of time in x-direction at top-left corner
screen location. Repeat for variance in y-direction. Tabulate maximum motions (in mils) with display input count level corresponding to Lmax for jitter (0.01 to 2 seconds), swim (2 to 60 seconds) and drift (over 60 seconds) over a 2.5 minute duration. The data are presented in Table II.19-1. Both the monitor and the Microvision equipment sit on a vibration-damped aluminum-slab measurement bench. The motion of the test bench was a factor of 10 times smaller than the CRT raster motion.
Table II.19-1. Jitter/Swim/Drift
Time scales: Jitter 2 sec., Swim 10 sec., and Drift 60 sec. Moiré Compensation OFF
1600 x 1200 x 85 Hz
Max Motions H-lines V-lines Center
Jitter 1.01 3.79 Swim 1.11 4.28 Drift 1.16 4.53
Black Tape Jitter 0.218 0.222 Swim 0.211 0.236 Drift 0.252 0.259
Less Tape Motion maximums Jitter 0.79 3.57 3.57 Swim 0.90 4.04 4.04 Drift 0.91 4.27 4.27
10D corner Jitter 1.03 3.39 Swim 1.10 3.76 Drift 1.18 3.86
Black Tape Jitter 0.206 0.264 Swim 0.224 0.301 Drift 0.232 0.312
Less Tape Motion maximums Jitter 0.82 3.13 3.13 Swim 0.88 3.46 3.46 Drift 0.95 3.55 3.55

Sony GDM-F520 21-inch Color CRT Monitor -45-
Use or disclosure of data on this sheet is subject to the restrictions on the cover and title of this report.
II.20. Warm-up Period
Reference: Request for Evaluation Monitors, NIDL Pub. 0201099-091, Section 5.20, p. 10. A 60-minute warm-up was necessary for Lmin to stabilize within 10% of its final value. Objective: Define warm-up period Equipment: Photometer, test target (full screen 0 count) Procedure: Turn monitor off for three-hour period. Turn monitor on and measure
center of screen luminance (Lmin as defined in Dynamic range measurement) at 1-minute intervals for first five minutes and five minute intervals thereafter. Discontinue when three successive measurements are ± 10% of Lmin.
Data: Pass if Lmin within ± 50% in 30 minutes and ±10% in 60 minutes.
The luminance of the screen (commanded to the minimum input level, 0 for Lmin) was monitored for 120 minutes after a cold start. Measurements were taken every minute. Figure II.20-1 shows the data for 1600 x 1200 format in graphical form. The luminance remains very stable after 60 minutes.
Sony GDM-F520 Warmup Characteristic for Lmin
0
0.05
0.1
0.15
0.2
0.25
0.3
0.35
0 10 20 30 40 50 60 70 80 90 100 110 120 130
Time after power ON, minutes
Lum
inan
ce, f
L .
60 minutes to +10% final Lmin
24 minutes to +50% final Lmin
Figure II.20-1. Luminance (fL) as a function of time (in minutes) from a cold start with
an input count of 0.

-46- NIDL
Use or disclosure of data on this sheet is subject to the restrictions on the cover and title of this report.
II. 21. Briggs Scores Reference: SofTrak User's Guidelines and Reference Manual version 3.0, NIDL,
Sept. 1994, p 3.
Briggs scores for the BTP #4 Delta-1, Delta-3, Delta-7 and Delta-15 contrast ratio targets sets averaged 8, 46, 57 and 61, respectively, for the GDM-F520 monitor. These scores were comparable to the FW900 monitor and are slightly better than the scores for the ViewSonic P815, the Cornerstone p1700 and the Cornerstone p1750 monitors. The reported values are base scores.
The Briggs series of test targets illustrated in Figures II.21-1 were developed to visually evaluate the image quality of grayscale monitors. Three NIDL observers selected the maximum scores for each target set shown in Figure II.21-2 displayed on the Sony F520 color CRT monitor driven using a Quantum Data 8701 400 MHz programmable test pattern generator. For comparison, Briggs scores are also shown for the Sony FW900 24-inch CRT color monitor and the ViewSonic P815 21-inch color CRT monitor. Magnifying devices were used when deemed by the observer to be advantageous in achieving higher scores.
10
1520
25
30 35 40
45
505560
65
70 75 80
8590
T-1
T-2
T-6
T-3
T-8
T-7
T-4
T-5
Figure II.21-1. Briggs BPT#4 Test Patterns comprised of 8 targets labeled T-1 through T-8. A series of 17 checkerboards are contained within each of the 8 targets. Each checkerboard is assigned a score value ranging from 10 to 90. Higher scores are assigned to smaller checkerboards.

Sony GDM-F520 21-inch Color CRT Monitor -47-
Use or disclosure of data on this sheet is subject to the restrictions on the cover and title of this report.
Figure II.21-2. 1024 x 1024 mosaic comprised of four 512 x 512 Briggs BPT#4 Test Patterns. The upper left quadrant contains the set of 8 Briggs targets with command contrast of delta 1. The upper right quadrant contains command contrast of delta 3. Delta 7 targets are in the lower left quadrant and delta 15 targets are in the lower right.

-48- NIDL
Use or disclosure of data on this sheet is subject to the restrictions on the cover and title of this report.
Briggs BTP#4 Delta 1
0
10
20
30
40
50
60
70
80
90
100
T-2 T-6 T-7 T-3 T-4 T-8 T-5 T-1Briggs Target
Bri
gg
s S
core
Sony GDM-F520 Avg. Score = 8
Viewsonic P815 Avg. Score = 9
Sony 24FW900 Avg. Score = 10
Briggs BTP#4 Delta 3
0
10
20
30
40
50
60
70
80
90
100
T-2 T-6 T-7 T-3 T-4 T-8 T-5 T-1Briggs Target
Bri
gg
s S
core
Sony GDM-F520 Avg. Score = 46
Viewsonic P815 Avg. Score = 39
Sony 24FW900 Avg. Score = 40
Briggs BTP#4 Delta 15
0
10
20
30
40
50
60
70
80
90
100
T-2 T-6 T-7 T-3 T-4 T-8 T-5 T-1Briggs Target
Bri
gg
s S
core
Sony GDM-F520 Avg. Score = 61
Viewsonic P815 Avg. Score = 57
Sony 24FW900 Avg. Score = 62
Briggs BTP#4 Delta 7
0
10
20
30
40
50
60
70
80
90
100
T-2 T-6 T-7 T-3 T-4 T-8 T-5 T-1Briggs Target
Bri
gg
s S
core
Sony GDM-F520 Avg. Score = 57
Viewsonic P815 Avg. Score = 52
Sony 24FW900 Avg. Score = 57
Figure II.21-3. Briggs Scores averaged for three NIDL observers for Delta-1, Delta-3, Delta-7 and Delta-15 contrast ratios on BPT#4 Test Patterns for the Sony GDM-F520 21-inch flat face CRT monitor compared to the Sony FW900 24-inch flat face CRT monitor and the ViewSonic P815 21-inch color CRT monitor.
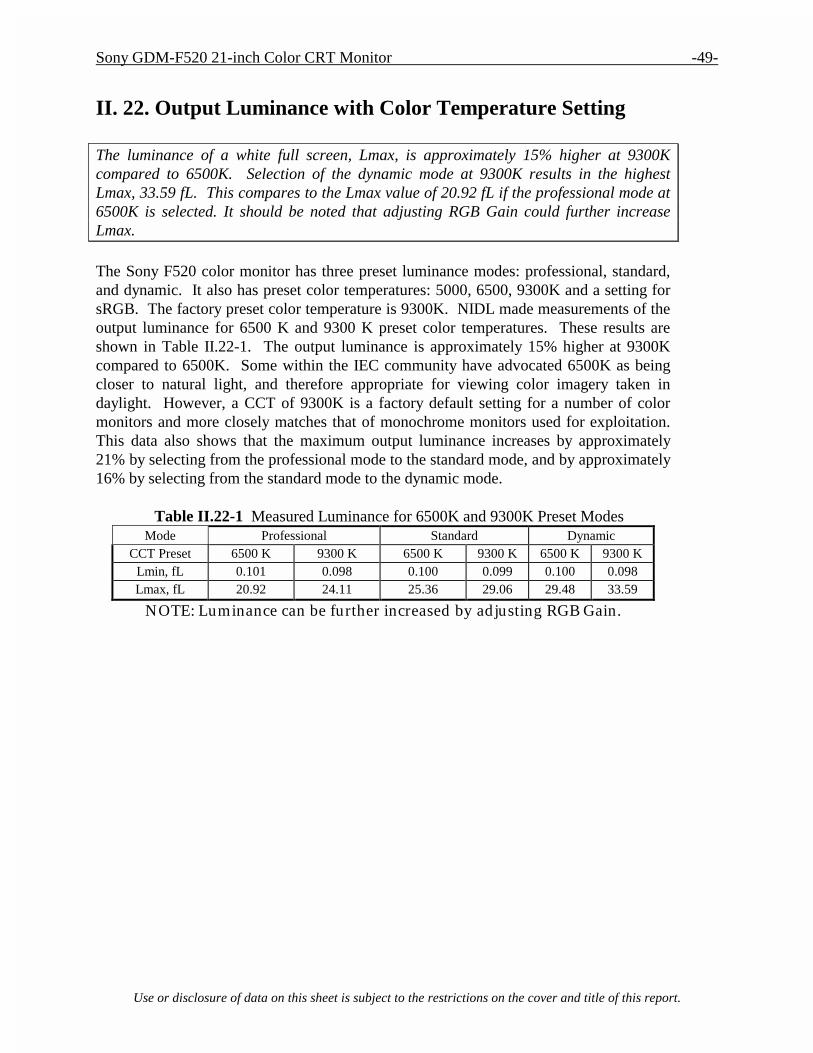
Sony GDM-F520 21-inch Color CRT Monitor -49-
Use or disclosure of data on this sheet is subject to the restrictions on the cover and title of this report.
II. 22. Output Luminance with Color Temperature Setting The luminance of a white full screen, Lmax, is approximately 15% higher at 9300K compared to 6500K. Selection of the dynamic mode at 9300K results in the highest Lmax, 33.59 fL. This compares to the Lmax value of 20.92 fL if the professional mode at 6500K is selected. It should be noted that adjusting RGB Gain could further increase Lmax. The Sony F520 color monitor has three preset luminance modes: professional, standard, and dynamic. It also has preset color temperatures: 5000, 6500, 9300K and a setting for sRGB. The factory preset color temperature is 9300K. NIDL made measurements of the output luminance for 6500 K and 9300 K preset color temperatures. These results are shown in Table II.22-1. The output luminance is approximately 15% higher at 9300K compared to 6500K. Some within the IEC community have advocated 6500K as being closer to natural light, and therefore appropriate for viewing color imagery taken in daylight. However, a CCT of 9300K is a factory default setting for a number of color monitors and more closely matches that of monochrome monitors used for exploitation. This data also shows that the maximum output luminance increases by approximately 21% by selecting from the professional mode to the standard mode, and by approximately 16% by selecting from the standard mode to the dynamic mode.
Table II.22-1 Measured Luminance for 6500K and 9300K Preset Modes
Mode Professional Standard Dynamic CCT Preset 6500 K 9300 K 6500 K 9300 K 6500 K 9300 K
Lmin, fL 0.101 0.098 0.100 0.099 0.100 0.098 Lmax, fL 20.92 24.11 25.36 29.06 29.48 33.59
NOTE: Luminance can be further increased by adjusting RGB Gain.
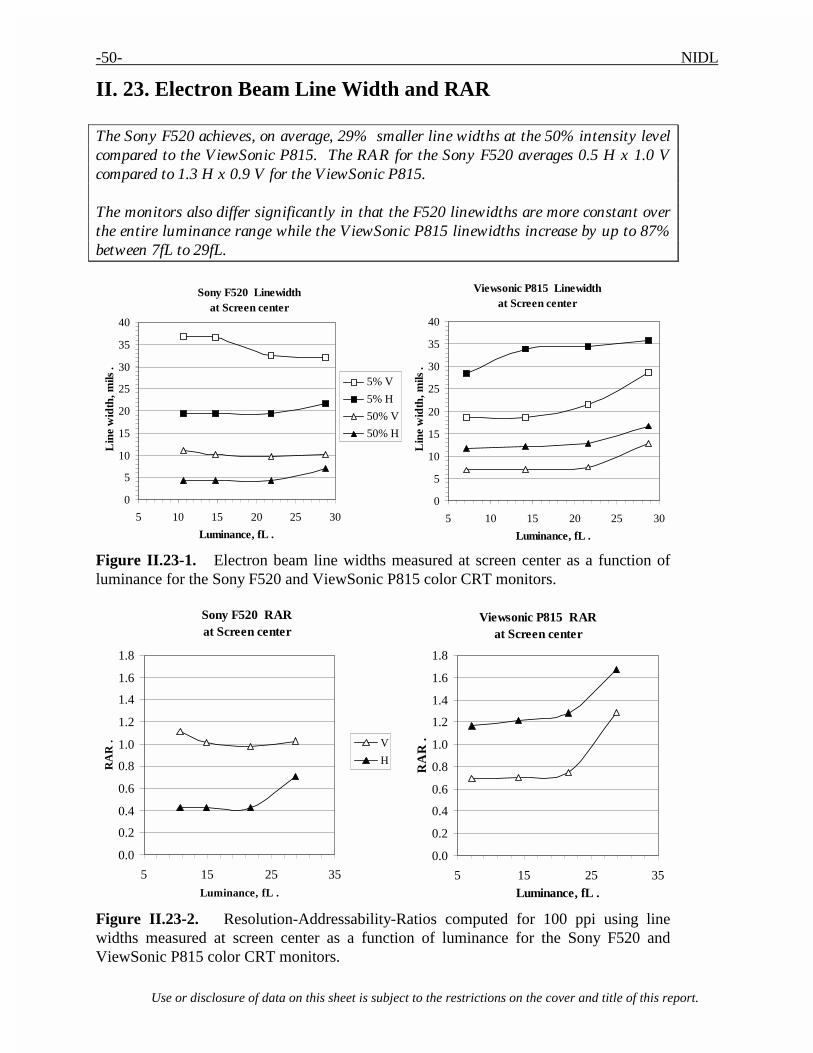
-50- NIDL
Use or disclosure of data on this sheet is subject to the restrictions on the cover and title of this report.
II. 23. Electron Beam Line Width and RAR The Sony F520 achieves, on average, 29% smaller line widths at the 50% intensity level compared to the ViewSonic P815. The RAR for the Sony F520 averages 0.5 H x 1.0 V compared to 1.3 H x 0.9 V for the ViewSonic P815. The monitors also differ significantly in that the F520 linewidths are more constant over the entire luminance range while the ViewSonic P815 linewidths increase by up to 87% between 7fL to 29fL.
Sony F520 Linewidth at Screen center
0
5
10
15
20
25
30
35
40
5 10 15 20 25 30
Luminance, fL .
Lin
e w
idth
, mils
.
5% V
5% H
50% V
50% H
Viewsonic P815 Linewidth at Screen center
0
5
10
15
20
25
30
35
40
5 10 15 20 25 30
Luminance, fL .
Lin
e w
idth
, mils
.
Figure II.23-1. Electron beam line widths measured at screen center as a function of luminance for the Sony F520 and ViewSonic P815 color CRT monitors.
Sony F520 RAR at Screen center
0.0
0.2
0.4
0.6
0.8
1.0
1.2
1.4
1.6
1.8
5 15 25 35
Luminance, fL .
RA
R . V
H
Viewsonic P815 RARat Screen center
0.0
0.2
0.4
0.6
0.8
1.0
1.2
1.4
1.6
1.8
5 15 25 35Luminance, fL .
RA
R .
Figure II.23-2. Resolution-Addressability-Ratios computed for 100 ppi using line widths measured at screen center as a function of luminance for the Sony F520 and ViewSonic P815 color CRT monitors.
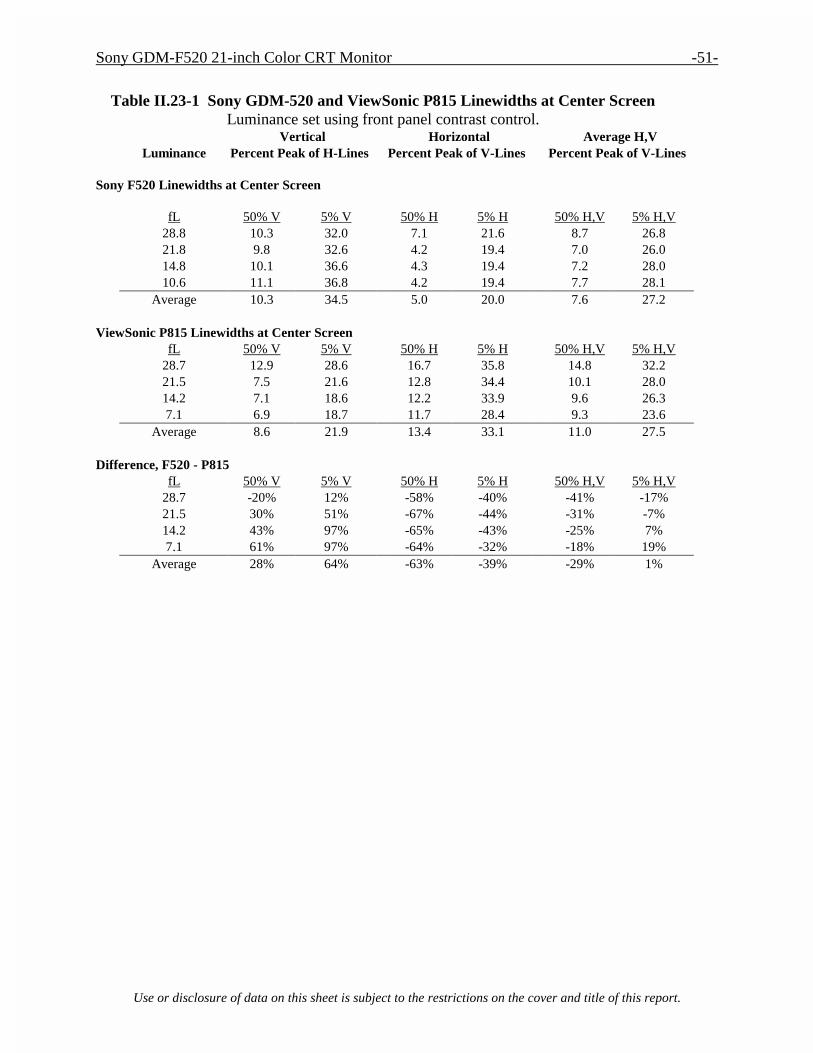
Sony GDM-F520 21-inch Color CRT Monitor -51-
Use or disclosure of data on this sheet is subject to the restrictions on the cover and title of this report.
Table II.23-1 Sony GDM-520 and ViewSonic P815 Linewidths at Center Screen
Luminance set using front panel contrast control. Vertical Horizontal Average H,V Luminance Percent Peak of H-Lines Percent Peak of V-Lines Percent Peak of V-Lines
Sony F520 Linewidths at Center Screen
fL 50% V 5% V 50% H 5% H 50% H,V 5% H,V
28.8 10.3 32.0 7.1 21.6 8.7 26.8 21.8 9.8 32.6 4.2 19.4 7.0 26.0 14.8 10.1 36.6 4.3 19.4 7.2 28.0 10.6 11.1 36.8 4.2 19.4 7.7 28.1 Average 10.3 34.5 5.0 20.0 7.6 27.2
ViewSonic P815 Linewidths at Center Screen fL 50% V 5% V 50% H 5% H 50% H,V 5% H,V
28.7 12.9 28.6 16.7 35.8 14.8 32.2 21.5 7.5 21.6 12.8 34.4 10.1 28.0 14.2 7.1 18.6 12.2 33.9 9.6 26.3 7.1 6.9 18.7 11.7 28.4 9.3 23.6 Average 8.6 21.9 13.4 33.1 11.0 27.5
Difference, F520 - P815 fL 50% V 5% V 50% H 5% H 50% H,V 5% H,V
28.7 -20% 12% -58% -40% -41% -17% 21.5 30% 51% -67% -44% -31% -7% 14.2 43% 97% -65% -43% -25% 7% 7.1 61% 97% -64% -32% -18% 19% Average 28% 64% -63% -39% -29% 1%

-52- NIDL
Use or disclosure of data on this sheet is subject to the restrictions on the cover and title of this report.
Sony GDM-520
Contrast Control
Horizontal Profile of Vertical Line
Vertical Profile of Horizontal Line
100%
28.8 fL
0
0.25
0.5
0.75
1
0 10 20 30 40 50 60 70 80 90 100
Linewidth (mils)
Nor
mal
ized
Lum
inan
ce
0
0.25
0.5
0.75
1
0 10 20 30 40 50 60 70 80 90 100
Linewidth (mils)
Nor
mal
ized
Lum
inan
ce
75% 21.8 fL
0
0.25
0.5
0.75
1
0 10 20 30 40 50 60 70 80 90 100
Linewidth (mils)
Nor
mal
ized
Lum
inan
ce
0
0.25
0.5
0.75
1
0 10 20 30 40 50 60 70 80 90 100
Linewidth (mils)
Nor
mal
ized
Lum
inan
ce
50% 14.8 fL
0
0.25
0.5
0.75
1
0 10 20 30 40 50 60 70 80 90 100
Linewidth (mils)
Nor
mal
ized
Lum
inan
ce
0
0.25
0.5
0.75
1
0 10 20 30 40 50 60 70 80 90 100
Linewidth (mils)
Nor
mal
ized
Lum
inan
ce
25% 10.6 fL
0
0.25
0.5
0.75
1
0 10 20 30 40 50 60 70 80 90 100
Linewidth (mils)
Nor
mal
ized
Lum
inan
ce
0
0.25
0.5
0.75
1
0 10 20 30 40 50 60 70 80 90 100
Linewidth (mils)
Nor
mal
ized
Lum
inan
ce
Figure II.23-3. Electron beam line widths measured at screen center for the Sony F520 color monitor with Trinitron CRT. The individual R, G, and B phosphor stripes are evident only along the horizontal line profiles.
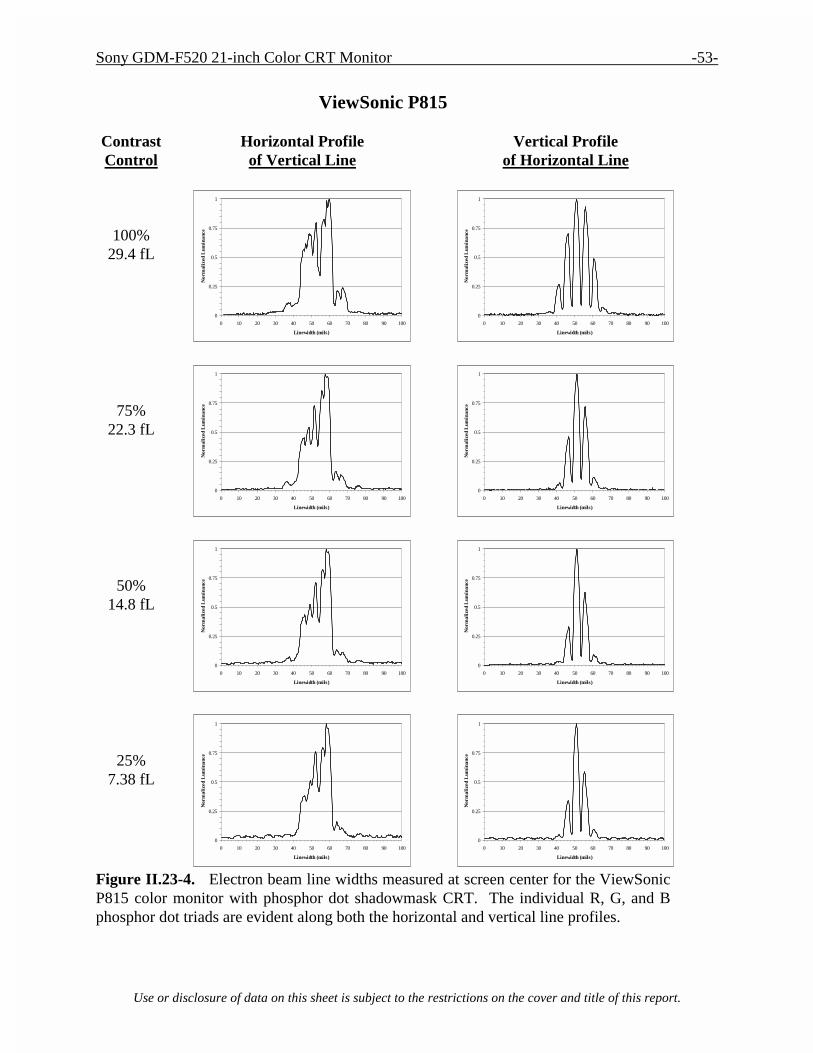
Sony GDM-F520 21-inch Color CRT Monitor -53-
Use or disclosure of data on this sheet is subject to the restrictions on the cover and title of this report.
ViewSonic P815
Contrast Control
Horizontal Profile of Vertical Line
Vertical Profile of Horizontal Line
100%
29.4 fL
0
0.25
0.5
0.75
1
0 10 20 30 40 50 60 70 80 90 100
Linewidth (mils)
Nor
mal
ized
Lum
inan
ce
0
0.25
0.5
0.75
1
0 10 20 30 40 50 60 70 80 90 100
Linewidth (mils)
Nor
mal
ized
Lum
inan
ce
75% 22.3 fL
0
0.25
0.5
0.75
1
0 10 20 30 40 50 60 70 80 90 100
Linewidth (mils)
Nor
mal
ized
Lum
inan
ce
0
0.25
0.5
0.75
1
0 10 20 30 40 50 60 70 80 90 100
Linewidth (mils)
Nor
mal
ized
Lum
inan
ce
50% 14.8 fL
0
0.25
0.5
0.75
1
0 10 20 30 40 50 60 70 80 90 100
Linewidth (mils)
Nor
mal
ized
Lum
inan
ce
0
0.25
0.5
0.75
1
0 10 20 30 40 50 60 70 80 90 100
Linewidth (mils)
Nor
mal
ized
Lum
inan
ce
25% 7.38 fL
0
0.25
0.5
0.75
1
0 10 20 30 40 50 60 70 80 90 100
Linewidth (mils)
Nor
mal
ized
Lum
inan
ce
0
0.25
0.5
0.75
1
0 10 20 30 40 50 60 70 80 90 100
Linewidth (mils)
Nor
mal
ized
Lum
inan
ce
Figure II.23-4. Electron beam line widths measured at screen center for the ViewSonic P815 color monitor with phosphor dot shadowmask CRT. The individual R, G, and B phosphor dot triads are evident along both the horizontal and vertical line profiles.
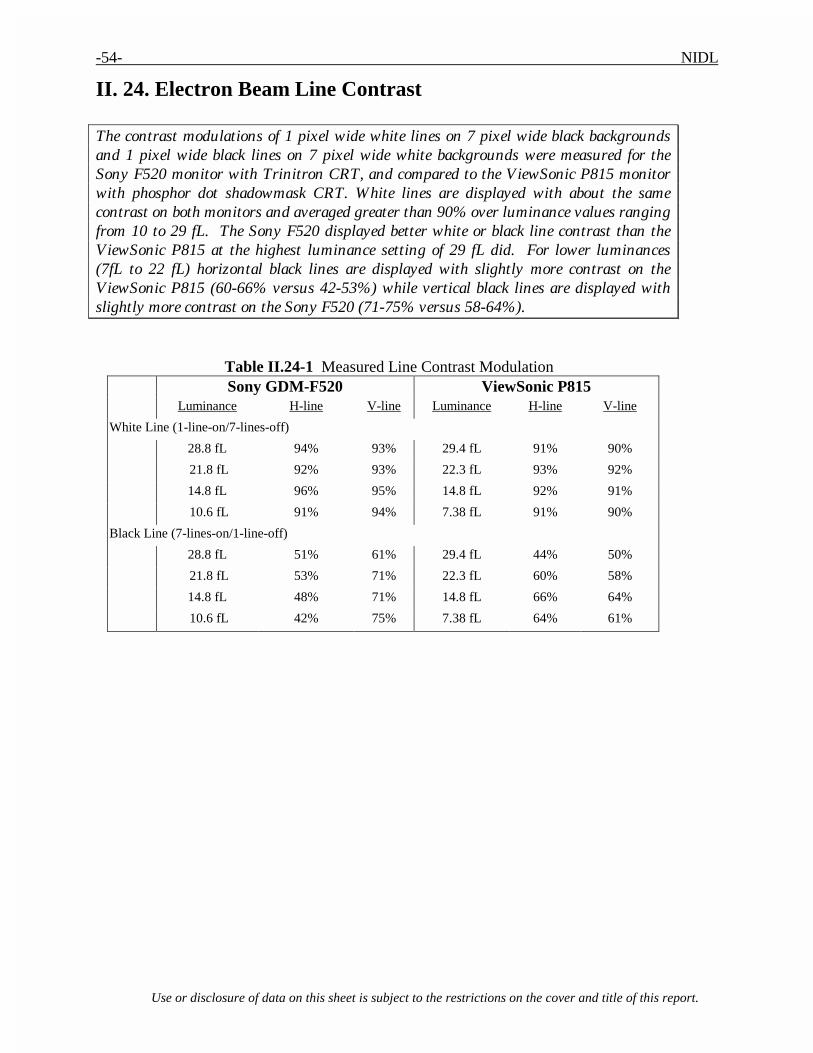
-54- NIDL
Use or disclosure of data on this sheet is subject to the restrictions on the cover and title of this report.
II. 24. Electron Beam Line Contrast The contrast modulations of 1 pixel wide white lines on 7 pixel wide black backgrounds and 1 pixel wide black lines on 7 pixel wide white backgrounds were measured for the Sony F520 monitor with Trinitron CRT, and compared to the ViewSonic P815 monitor with phosphor dot shadowmask CRT. White lines are displayed with about the same contrast on both monitors and averaged greater than 90% over luminance values ranging from 10 to 29 fL. The Sony F520 displayed better white or black line contrast than the ViewSonic P815 at the highest luminance setting of 29 fL did. For lower luminances (7fL to 22 fL) horizontal black lines are displayed with slightly more contrast on the ViewSonic P815 (60-66% versus 42-53%) while vertical black lines are displayed with slightly more contrast on the Sony F520 (71-75% versus 58-64%).
Table II.24-1 Measured Line Contrast Modulation Sony GDM-F520 ViewSonic P815 Luminance H-line V-line Luminance H-line V-line
White Line (1-line-on/7-lines-off)
28.8 fL 94% 93% 29.4 fL 91% 90%
21.8 fL 92% 93% 22.3 fL 93% 92%
14.8 fL 96% 95% 14.8 fL 92% 91%
10.6 fL 91% 94% 7.38 fL 91% 90%
Black Line (7-lines-on/1-line-off)
28.8 fL 51% 61% 29.4 fL 44% 50%
21.8 fL 53% 71% 22.3 fL 60% 58%
14.8 fL 48% 71% 14.8 fL 66% 64%
10.6 fL 42% 75% 7.38 fL 64% 61%

Sony GDM-F520 21-inch Color CRT Monitor -55-
Use or disclosure of data on this sheet is subject to the restrictions on the cover and title of this report.
II. 25. Electron Beam Spot Size The FWHM spot size in the vertical direction averages 9.03 +/-0.98 mils across the entire screen, and in the horizontal direction averages 11.84 +/-1.86 mils across the entire screen.
Table II.25-1 Measured Spot Size in Mils Full Width Half Maximum
Shown according to position on the screen. Horizontal
direction Vertical direction
Horizontal direction
Vertical direction
Horizontal direction
Vertical direction
15.5 9.0 10.7 10.5 10.9 8.2
10.5 8.6 10.5 9.5 14.5 7.8
11.1 9.0 12.0 10.5 10.9 8.2
Figure II.25-1. Spatial calibration for the CCD optic module used for the electron beam spot size measurements is shown above. The Ronchi ruling consists of 10-mil wide stripes spaced apart on 20-mil centers. Measurement accuracy is shown to be within 4%.

-56- NIDL
Use or disclosure of data on this sheet is subject to the restrictions on the cover and title of this report.
White Spot Contours at 6500K CCT
10:00 Corner
12:00
2:00 Corner
9:00
CENTER
3:00
8:00 Corner
6:00
4:00 Corner
Figure II.25-2. Measured spot contours are plotted for nine positions on the screen. The red, green and blue phosphor stripes of the Trinitron CRT are evident in the spot contours. Horizontal and vertical luminance profiles of the spots shown in the following figures are used to determine the H and V spot sizes.

Sony GDM-F520 21-inch Color CRT Monitor -57-
Use or disclosure of data on this sheet is subject to the restrictions on the cover and title of this report.
0
0.25
0.5
0.75
1
0 10 20 30 40 50
Mils
Nor
mal
ized
Lum
inan
ce
0
0.25
0.5
0.75
1
0 10 20 30 40 50
Mils
Nor
mal
ized
Lum
inan
ce
0
0.25
0.5
0.75
1
0 10 20 30 40 50
Mils
Nor
mal
ized
Lum
inan
ce
0
0.25
0.5
0.75
1
0 10 20 30 40 50
Mils
Nor
mal
ized
Lum
inan
ce
0
0.25
0.5
0.75
1
0 10 20 30 40 50
MilsN
orm
aliz
ed L
umin
ance
0
0.25
0.5
0.75
1
0 10 20 30 40 50
Mils
Nor
mal
ized
Lum
inan
ce
0
0.25
0.5
0.75
1
0 10 20 30 40 50
Mils
Nor
mal
ized
Lum
inan
ce
0
0.25
0.5
0.75
1
0 10 20 30 40 50
Mils
Nor
mal
ized
Lum
inan
ce
0
0.25
0.5
0.75
1
0 10 20 30 40 50
Mils
Nor
mal
ized
Lum
inan
ce
Sony GDM-F520, 30 fL, 1600 x 1200 x 85HzSpot Profiles along the Vertical Direction
Figure II.25-3. Vertical luminance profiles of single-pixel white electron beam spots are plotted for nine positions on the screen.
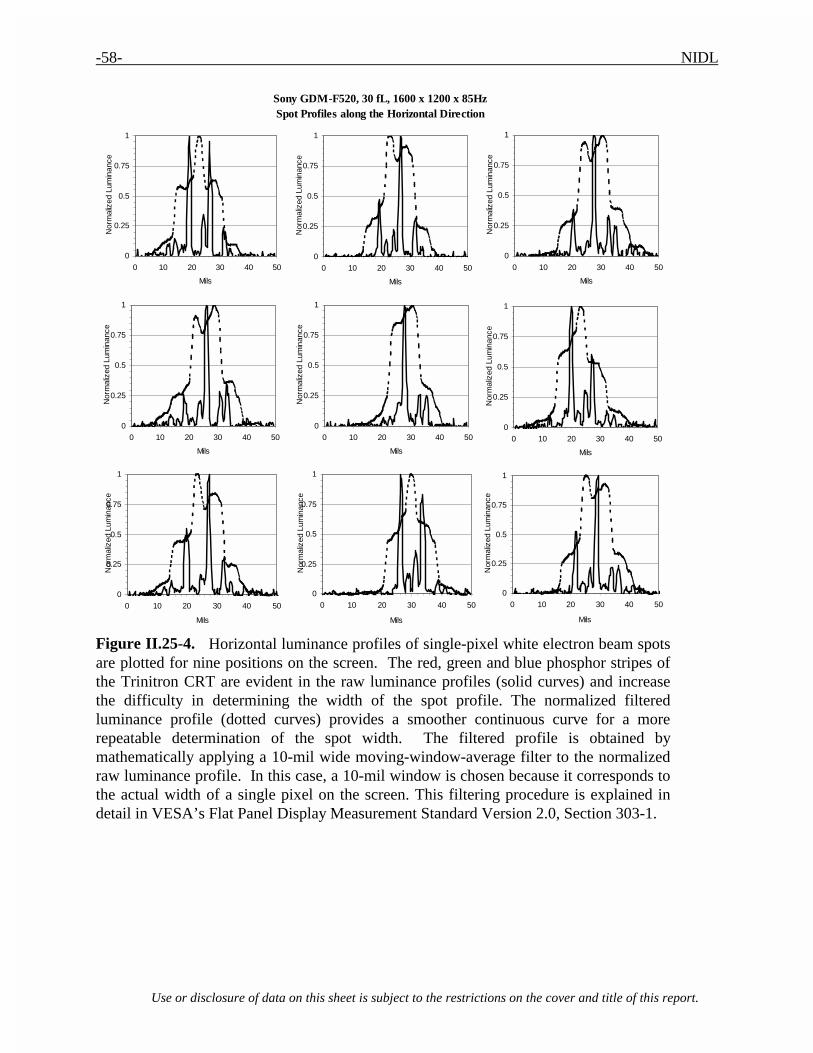
-58- NIDL
Use or disclosure of data on this sheet is subject to the restrictions on the cover and title of this report.
0
0.25
0.5
0.75
1
0 10 20 30 40 50
Mils
Nor
mal
ized
Lum
inan
ce
0
0.25
0.5
0.75
1
0 10 20 30 40 50
Mils
Nor
mal
ized
Lum
inan
ce
0
0.25
0.5
0.75
1
0 10 20 30 40 50
Mils
Nor
mal
ized
Lum
inan
ce
0
0.25
0.5
0.75
1
0 10 20 30 40 50
Mils
Nor
mal
ized
Lum
inan
ce
0
0.25
0.5
0.75
1
0 10 20 30 40 50
Mils
Nor
mal
ized
Lum
inan
ce
0
0.25
0.5
0.75
1
0 10 20 30 40 50
Mils
Nor
mal
ized
Lum
inan
ce
0
0.25
0.5
0.75
1
0 10 20 30 40 50
Mils
Nor
mal
ized
Lum
inan
ce
0
0.25
0.5
0.75
1
0 10 20 30 40 50
Mils
Nor
mal
ized
Lum
inan
ce
0
0.25
0.5
0.75
1
0 10 20 30 40 50
Mils
Nor
mal
ized
Lum
inan
ce
Sony GDM-F520, 30 fL, 1600 x 1200 x 85HzSpot Profiles along the Horizontal Direction
Figure II.25-4. Horizontal luminance profiles of single-pixel white electron beam spots are plotted for nine positions on the screen. The red, green and blue phosphor stripes of the Trinitron CRT are evident in the raw luminance profiles (solid curves) and increase the difficulty in determining the width of the spot profile. The normalized filtered luminance profile (dotted curves) provides a smoother continuous curve for a more repeatable determination of the spot width. The filtered profile is obtained by mathematically applying a 10-mil wide moving-window-average filter to the normalized raw luminance profile. In this case, a 10-mil window is chosen because it corresponds to the actual width of a single pixel on the screen. This filtering procedure is explained in detail in VESA’s Flat Panel Display Measurement Standard Version 2.0, Section 303-1.