evaluation of the t. boone pickens plan for united...
TRANSCRIPT
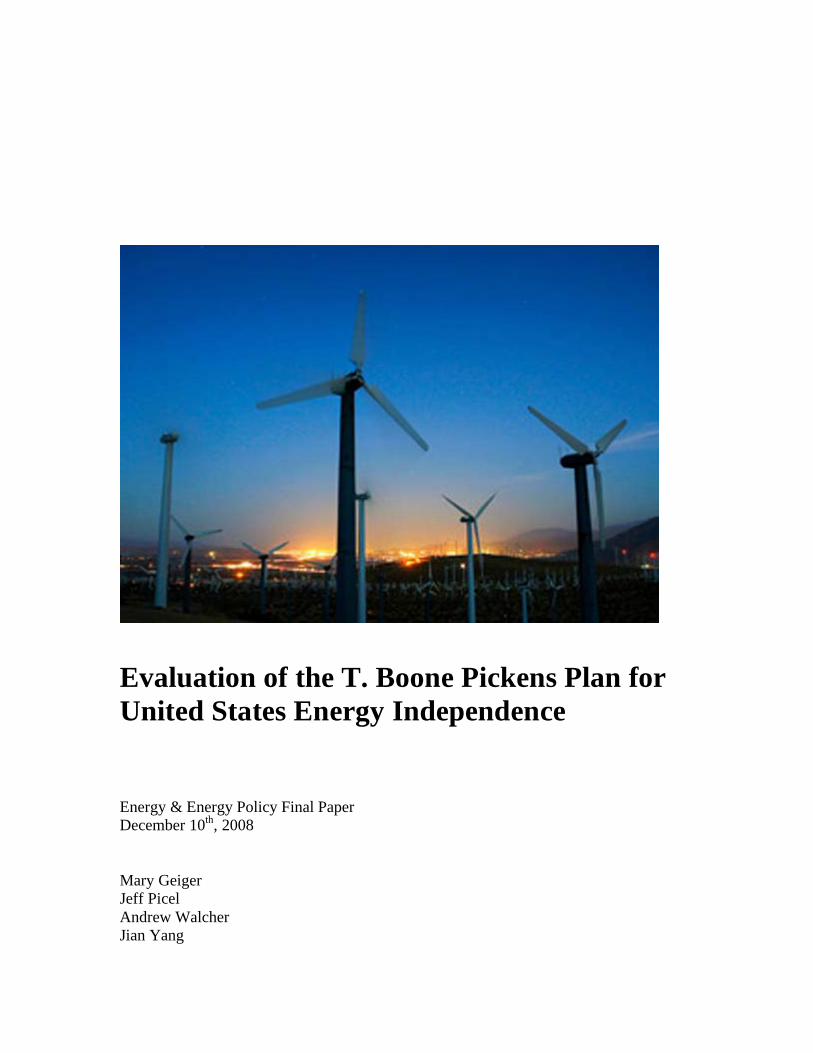
Evaluation of the T. Boone Pickens Plan for
United States Energy Independence
Energy & Energy Policy Final Paper December 10th, 2008 Mary Geiger Jeff Picel Andrew Walcher Jian Yang

1
Introduction: The T. Boone Pickens Plan On July 8, 2008, T. Boone Pickens proposed a National energy plan aimed at
reducing United States (U.S.) dependence on foreign oil imports. According to the United
States Energy Information Agency (EIA), the U.S. net imports about 58% of its petroleum
from a variety of foreign sources. However, the steady depletion of oil reserves in Mexico
and other regions friendly towards the U.S. may necessitate increased imports from the
Middle East and other less stable regions over the next decade. Dependence on foreign oil
from these regions poses a significant liability to U.S. economic interests. The Pickens
Plan aims to address this liability by creating greater energy independence within the U.S..
The plan calls for the construction of thousands of wind turbines in the American
Great Plains, which would allow for the transfer of natural gas from electricity production
to the transportation sector, specifically to heavy vehicles like trucks and buses. Pickens
claims that his plan could potentially reduce oil imports by “at least 30% within 10 years.”1
Using a combination of natural gas and wind power has the additional benefit of creating
jobs in the alternative energy industry while combating global warming by limiting
greenhouse emissions. Furthermore, he claims that all of plan's goals can be met with
existing technology.
The purpose of this paper is to assess the feasibility of the Pickens plan and explore
that potential of solar power to be a significant source of clean energy for the U.S.
economy. This analysis examines three main topics: the feasibility of using wind energy to
produce 20% of U.S. electricity needs by 2020, the prospect of using natural gas to power
transportation in the U.S., and an analysis of solar power as a possible alternative or
supplement for wind power in the Pickens Plan. The final section of this paper includes
2
possible changes to the Pickens Plan, areas for future study, and several policy
recommendations.
The T. Boone Pickens Plan
Successful implementation of the Pickens Plan requires two major shifts in current
U.S. energy consumption: the replacement of natural gas by wind power as a significant
source of electricity generation and the use of natural gas for transportation purposes
instead of imported oil. In 2006, 20% of total electrical power production came from
natural gas and only about 1% of total power came from wind. The Pickens Plan aims to
increase the fraction of power from wind to 20% over the next ten years (or by 2020)2 by
encouraging private industry to construct thousands of windmills ranging from Texas to
North Dakota. The plan estimates that the proposed project would require about $1 trillion
to construct the windmills and another $200 billion to connect the windmills to the power
grid. A major benefit of replacing natural gas with wind power is a significant reduction
in carbon emissions from power production.
Moreover, Pickens claims that the cost of the project may be partially offset by the
creation of jobs in the wind power industry especially in construction. Pickens indicated
that when a large wind power facility was built outside Sweetwater, Texas, the population
grew to 12,0003 due to the new high-skill jobs that were created. According to Pickens,
currently about a fourth of the jobs in Sweetwater are now related to the wind power
industry. He believes that the economic resuscitation of Sweetwater can be replicated in
America’s wind corridor where he plans to build wind power plants. Under the 20% Wind
Scenario outlined by the U.S. DOE, the domestic wind industry has the potential to create

3
3.3 million cumulative full-time equivalent jobs in direct, indirect, and other affected
industries between 2007-20304.
Increased use of wind power for electricity generation would also free-up natural
gas for use in the transportation sector, which enables the second part of the plan: the
transfer of natural gas from electric power production to the transportation sector. The
Pickens Plan emphasizes converting trucks and buses to natural gas (NG) because NG
engines are more effective for operating large vehicles than alternative battery-powered
technologies. Trucks and buses already use specialized refueling stations and some of this
fleet is controlled by public institutions such as city, state, and federal governments,
allowing for a swifter transition.
The Pickens Plan presents three main motivations for a potential switch to natural
gas. First, natural gas is the cleanest of all hydrocarbons used for transportation fuel,
releasing 29% fewer emissions than gasoline. This will yield further emission reductions
than those already gained by replacing NG with wind in power production. Second, natural
gas is cheaper than gasoline or diesel for the same amount of energy output. A gallon
equivalent of natural gas costs about $1.50 less than a gallon of gasoline. Finally, the vast
majority of current U.S. consumption of natural gas can be supplied by North American
sources that are friendly towards the United States.5 The Pickens Plan claims that
switching trucks, buses, and other vehicles to natural gas will yield a reduction of at least
33% in foreign oil imports.6 The technology for NG vehicles such as the Honda Civic GX
already exists and there are currently 7 million NG vehicles operating worldwide.

4
Section I: Wind Power
The United States’ energy demands are continually increasing. According to the
U.S. EIA, U.S. electricity demand is estimated to grow by 39% from 2005 to 2030.7 This
includes the implementation of energy efficiency and demand reduction programs.
Domestically produced wind power is a critical part of the Pickens Plan. The plan cites a
U.S. DOE report that estimates as much as 20% of America’s electricity can be produced
from domestic wind sources by 2030, however the Pickens Plan has a much more
aggressive goal of achieving 20% wind power by 2020. Although possible, a 2020 target
is not realistic given the challenges outlined in the DOE analysis. Therefore, this paper
will assess the feasibility of achieving 20% wind power by 2030 based on the DOE’s
study.
Wind power currently accounts for only about 1% of U.S. electricity demand (48
billion kWh per year or about 4.5 million households’ energy demand). To increase wind
power generation by 20 times its current level would cost $1 trillion plus an additional
investment of $200 billion to build the capacity to transmit that energy to cities and towns8.
To properly evaluate this plan one must understand the constraints, assumptions, and other
factors that will influence the outcome of such an effort.
Technology
Windmills have been in use for centuries, but modern wind-driven electricity generators
have only been used since the late 1970’s. The efficiency and design of wind energy
technology have improved dramatically since then. New, taller turbines take advantage of
higher wind speeds at higher elevation. A single 1.5 MW wind turbine can displace up to
2,700 metric tons of CO2 per year compared with the current U.S. average utility fuel mix.9
5
If the U.S. is able to generate 20% of its electricity from wind, natural gas consumption
could be reduced by 11%, which is equivalent to 60% of expected LNG imports in 2030.10
Concerns regarding the technical feasibility of using wind to generate large
amounts of electricity include: the availability and remote location of many wind
resources, wind variability, the transmission and integration of wind energy into the
existing power grid, wind turbine reliability, and the installation and structural integrity of
increasingly large blades and towers. There are enough land-based and offshore 100-m
altitude wind sites in the United States to generate electricity for the whole country; the
area from Texas to North Dakota in particular is very rich in wind energy resources.11
Although there are ample wind resources within the U.S., many of the sites are far
removed from major electricity demanding areas. Increased wind energy generation will
require capital investment in both trunk-line and backbone high-voltage transmission lines
to deliver energy from production areas to load centers.12 The amount of new lines
required varies with choice of sites and the location of the load centers being served, but
the 20% Wind Scenario assumes 30 million MW-miles of additional transmission lines
will be required to support wind energy delivery at a transmission loss rate of 0.236
kW/MW-miles and an average cost of $1,600/MW-mile, or a total of $48 billion.13 The
intermittent nature of wind will introduce additional variability and uncertainty into a
power grid that already handles a large amount of output and load variability. Reliance on
wind energy will require large back-up electricity generation capacity to smooth the
inherent variability of wind generation, however, assuming that wind generation and load
levels are independent, the “resultant variability [and need for back up capacity] is the
square root of the sum of the squares” of these two independent variables. As a result, the

6
larger the total system, the smaller the fraction of reserves needed to balance the load net
of wind.14 Since the net system load must be balanced, not the individual load or
generation sources, integrating wind energy into the grid is technically feasible for most of
the major grids in the U.S..
Economic Analysis
Profitability is the most significant hurdle to the rapid adoption of wind energy
generation. The cost-benefit analysis of wind farms is extremely sensitive to the price of
energy, interest rates, the availability of capital and financing, construction costs,
transmission installation costs, operations and maintenance costs, government incentives
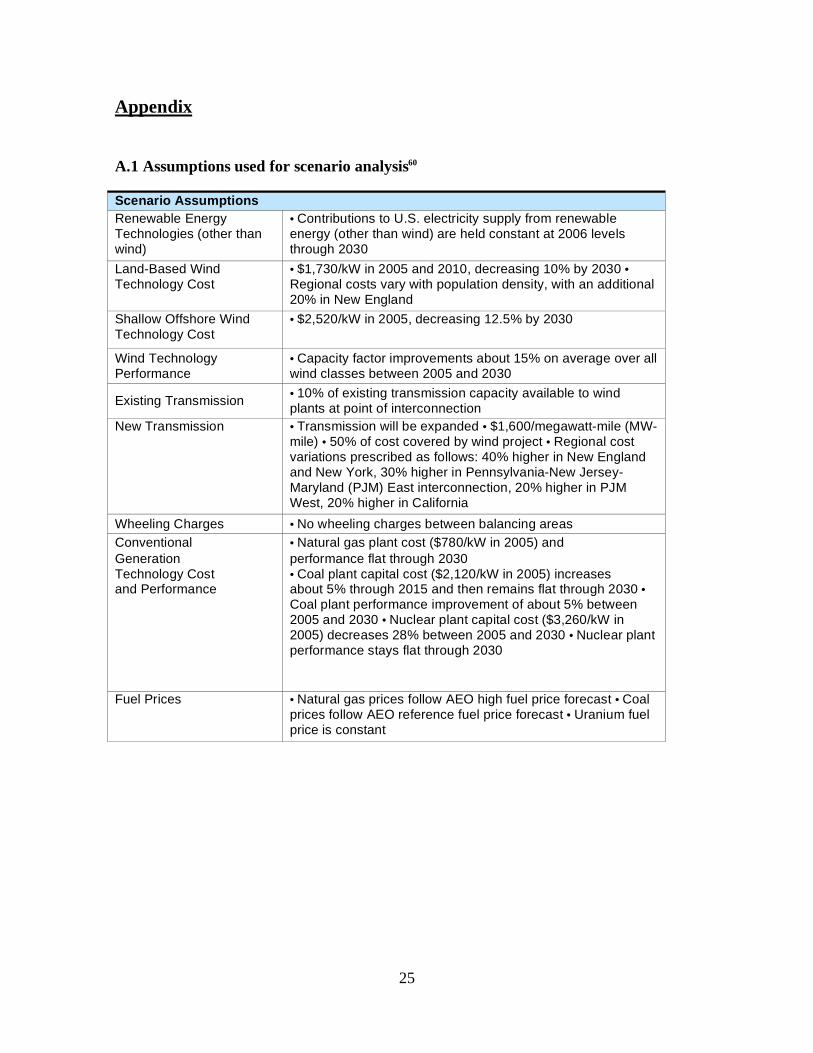
and subsidies, and the cost of material, components and human capital. Tables A.1-A.6 in
the Appendix summarize the most critical financial assumptions and cost estimates of the
DOE 20% wind scenario report.
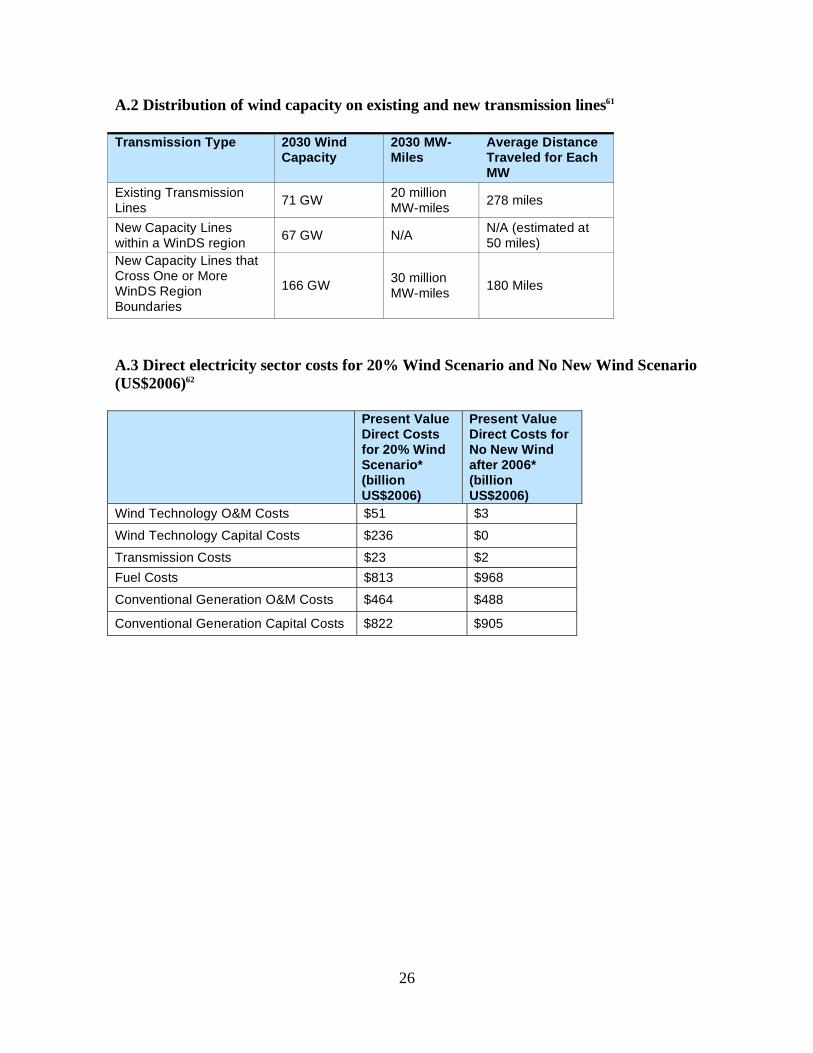
The cost of installing additional transmission lines required for the distribution of
wind energy is one of the most noted factors in the wind energy debate. Investment in
transmission infrastructure was on a general decline from 1980 to 2000. Since 2000,
investment has risen from $3.0 billion per year to $6.9 billion per year in 2006 and is
expected to rise to $8.4 billion in 2009.15 To meet rising electricity demand, new energy
generation facilities and new transmission lines must be built with or without 20% of U.S.
electricity being produced by wind. Under the No New Wind Scenario in the DOE report,
about $2,366 billion of investment is required whereas $2,409 billion is required for the
20% Wind Scenario.16 The present value of the difference between the direct costs of these
two scenarios is $43 billion (in 2006 US$).1 It should also be noted that there is a
considerable cost difference between land-based and offshore wind generation. The
1 See Table A.3 in appendix for list of assumptions including fuel, construction, operations, and maintenance

7
current installed capital cost of offshore wind generation is about $2,400 to $5,000 per
kW17 with a variable cost of about $18 per MWh, while land-based wind energy capital
and variable costs are about $1,650 per kW and $5.50 per MWh, respectively18. Although
offshore applications may be attractive to some, the capital cost required for offshore
installations make them less competitive than land-based sites.2 The 20% Wind Scenario
assumes that out of the 293 GW of wind energy that could be produced by 2030, only
about 50 GW of that would be produced offshore, “mostly along the northeastern and
southeastern seaboards.”19
Both the 20% Wind and No Wind scenarios account for “all currently enacted
federal and state emission standards, renewable portfolio standards (RPS) and tax credits”
at the time the report was published (2007).20 The 20% Wind Scenario analysis assumed
the federal renewable energy production tax credit would be allowed to expire at the end of
2008 and that no additional PTC would be implemented. 21 However, the Energy
Improvement and Extension Act of 2008, passed by Congress on October 3, 2008,
renewed these tax credits through the end of 2009.22 Although the applicable renewable
energy tax credit is worth $19/MWh23, since it is only extended for one year it will not
significantly affect the long-term cost analysis. Future production tax credits or other
incentives will likely affect wind energy investment since they provide financial incentives
to produce and use renewable energy technology. It should be noted that historic increases
in wind energy investment are strongly correlated with the renewal of renewable energy
production tax credits.24 The DOE analysis incorporates state energy incentive and
renewable portfolio standards in place as of 2007. The state level incentives have a
2 The 20% Wind Energy by 2030 report assumes a 12.5% reduction in future capital costs due to technology
developments and a maturing market

8
minimal impact on the final analysis. To incorporate various policies, including renewable
portfolio standards, a social discount rate of 7% in accordance with the OMB instead of the
utility’s 8.5% real weighted cost of capital discount rate was used in the DOE analysis.25
Aggregated across all domestic electricity consumption, the direct incremental cost
of the 20% wind scenario will increase electricity rates by an average of $0.6/MWh over
the 2007–2050 analysis period. This is equivalent to “raising average residential monthly
electricity bills by just $0.5/month over that same time period”. 26 Of course, the
incremental costs of the additional wind energy will not be borne by all Americans; most
of it will be paid for by those consuming energy from the affected grids. Regions or
utilities that choose to install wind generation facilities will pay an average incremental
levelized cost for installation and operation (cost per unit of energy) of $8.6/MWh for wind
energy compared to the conventional mix of electricity sources.27 Although this
incremental cost can be offset with the current production tax credit of $19/MWh, some
utilities may not invest in wind because of specific concerns regarding grid reliability, the
availability of reliable wind turbines, the availability of technically knowledgeable
maintenance resources, less expensive local energy resources, local special interest groups,
other local and state incentives, public opposition to preferred farm sites and other
potential challenges.
Social and Political Considerations
Even though a goal of 20% wind energy by 2030 is technically feasible and
economically viable given the right set of incentives, there are a number of social and
political hurdles. There has been much debate and public concern over the unsightliness
and noise of wind farms, the danger rotating blades pose to animals, radar interference, the
9
disruption the construction and operation of wind farms will cause in some communities,
the danger of constructing and operating a tower in deep water, and the disruption of water
flow (on and off land). These are valid concerns, however one could find faults of similar
magnitude with almost every form of electricity generation. Studies have shown noise and
bird deaths caused by wind generators are negligible compared to other sources.28 A
recently developed type of radar that can distinguish between aircraft and moving wind
turbine blades has been shown to alleviate some of the security concerns associated with
wind farms.29 Unfortunately, concerns over the unsightliness of wind farms, the
community disruption of constructing and operating a wind farm, and the potential
negative economic impact of reduced reliance on domestically produced coal and natural
gas (ie. the loss coal mining or natural gas related jobs) are less easy to address. These
concerns, in addition to the financial cost of adopting wind energy, are the biggest
challenges to successfully implementing the 20% wind by 2030 plan.
Section II: Natural Gas for Transportation
Since 2002, total U.S. consumption of natural gas has remained relatively flat.
While overall growth annual has been fairly small (0.4%), certain segments have grown at
much higher rates. Natural gas used for electricity generation in the U.S. has grown at
about 4% annually over this period and now accounts for 17% of electricity produced.
During this time, the price has risen by 15% annually.30, 3
The following data from the U.S. EIA will be the basis for the analysis of the
Pickens Plan’s assertion regarding natural gas use in electricity generation.
3 See Exhibits B.1 and B.2 for greater trend details

10
Electricity Generation Transportation
Year
Natural Gas
Consumption Price
Natural Gas
Consumption Price
(Quadrillion BTUs) (Trillions) (Quadrillion BTUs) (Trillions)
2007 7.1 $7.3 0.7 $14.3
2020 6.1 $6.3 0.8 $12.9
(1) Price is dollars per quadrillion BTUs (units are in trillions)
Source: US Energy Information Agency
These projections contradict some of the details Pickens has stated about his plan. Mainly,
natural gas use in electricity generation is projected to decline, starting in 2015 due to a
large price shock, while natural gas use in transportation is expected to grow just slightly.
The figures Pickens quotes in his plan assume that both of these quantities increase. On
the other hand, electricity consumption is expected to grow by 34% from 2007 to 2020,
with much of this growth coming from coal generated power. Based on EIA projections of
the future energy mix, natural gas will account for approximately 13% of the total
electricity generated in 2020. If wind energy is to replace this, then it should account for
13% rather than 20% of the total electricity generated as Pickens has stated.31, 4
From an energy security standpoint, it does appear that the U.S. is well positioned
to address its own natural gas needs for the immediate future. At the projected annual rate
of consumption in 2020, current U.S. natural gas reserves would last 121 years. However,
it is important to note that the U.S. only has 3% of the world’s natural gas reserves.30
Therefore, while substituting oil for natural gas consumption would move the U.S. closer
to energy independence, natural gas should at best be seen as an energy source that
facilitates this transition and not the final solution. If it simply substitutes one liquid fossil
fuel for another, the U.S. will end up in the same situation as it is in today.
4 Please reference Exhibit B.3 for additional information on potential forecasting issues
11
Total Energy Offset and Carbon Footprint Savings
If the Pickens plan is implemented, to what extent will it offset the U.S.’s
dependence on foreign oil? Based on the EIA’s natural gas projections, approximately 49
billion gallons of gasoline would be replaced. This is equal to 22% of oil used for
transportation in 2007 and 37% of U.S. current oil imports. However, based on projected
energy consumption in 2020, these figures fall to 20% of oil used in transportation and
22% of total imported oil.31, 32
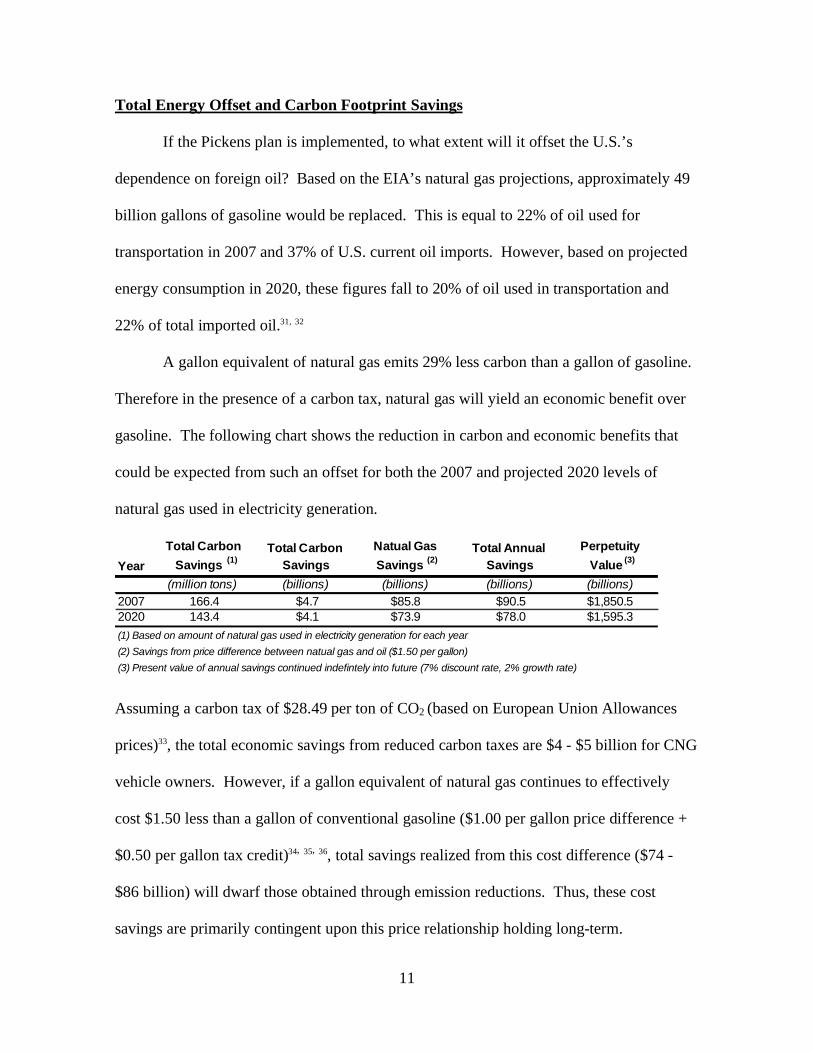
A gallon equivalent of natural gas emits 29% less carbon than a gallon of gasoline.
Therefore in the presence of a carbon tax, natural gas will yield an economic benefit over
gasoline. The following chart shows the reduction in carbon and economic benefits that
could be expected from such an offset for both the 2007 and projected 2020 levels of
natural gas used in electricity generation.
Year
Total Carbon
Savings(1)
Total Carbon
Savings
Natual Gas
Savings(2)
Total Annual
Savings
Perpetuity
Value(3)
(million tons) (billions) (billions) (billions) (billions)
2007 166.4 $4.7 $85.8 $90.5 $1,850.5
2020 143.4 $4.1 $73.9 $78.0 $1,595.3
(1) Based on amount of natural gas used in electricity generation for each year
(2) Savings from price difference between natual gas and oil ($1.50 per gallon)
(3) Present value of annual savings continued indefintely into future (7% discount rate, 2% growth rate)
Assuming a carbon tax of $28.49 per ton of CO2 (based on European Union Allowances
prices)33, the total economic savings from reduced carbon taxes are $4 - $5 billion for CNG
vehicle owners. However, if a gallon equivalent of natural gas continues to effectively
cost $1.50 less than a gallon of conventional gasoline ($1.00 per gallon price difference +
$0.50 per gallon tax credit)34, 35, 36, total savings realized from this cost difference ($74 -
$86 billion) will dwarf those obtained through emission reductions. Thus, these cost
savings are primarily contingent upon this price relationship holding long-term.

12
Additionally, natural gas provides other benefits, such as lower sulfur dioxide, nitrogen
oxide, total particulate matter (TPM), and mercury emissions, which if incorporated into
this analysis would further increase the social benefit of this plan.37
Natural Gas Transportation
In order to assess the feasibility of the Pickens Plan to shift natural gas from
electricity generation into transportation, a cost/benefit analysis was conducted on the two
main types of natural gas vehicles currently in use in the U.S.. While Pickens has stated
that natural gas would best be used in heavy duty trucks, there has been much discussion in
the press recently about utilizing compressed natural gas (CNG) cars as well. This section
analyzes the economic viability of both types of vehicles.
Compressed Natural Gas (CNG) Cars
The only natural gas car sold in the U.S. is the Honda Civic GX. Compared to a
Civic sedan, the GX sells for a premium of $9,685.38 Less than half of this premium is
offset by a $4,000 Qualified Alternative Fuel Motor Vehicle tax credit, while the rest is
made up over time through a $1.00 cost savings between a gallon equivalent of natural gas
and convention gas.38, 39 Additionally, owners of CNG vehicles are eligible for a $0.50 per
gallon equivalent tax credit and may realize additional benefits through local state
incentives (state incentives have been omitted in this analysis).36
Assuming a scenario where a CNG car owner fills up the gas tank once per week,
and another where he/she fills up twice per week, the payback period is as follows:

13
Fill Up Once per Week Fill Up Twice per Week
Packback Period
Type
Without a
Carbon Tax
With a Carbon
Tax(2)
Without a
Carbon Tax
With a Carbon
Tax(2)
(Years) (Years) (Years) (Years)
Undiscounted 7.3 6.9 3.6 3.5
Discounted(1) 10.5 9.8 4.4 4.1
(1) 7% discount rate applied to future benefits
(2) 29% reduction in carbon emissions. Carbon tax of $28.49 - European CCX 10/22/08 close price
(3) Based on performance specifications of Honda Civic GX
This table provides two important insights. First, under the scenario which more closely
resembles the annual fuel consumption of an average American (fill up once per week), the
true discounted payback period is between 9.5 – 10.5 years.40 Using the average term of a
car lease (5 years) as a proxy for the average ownership term of an automobile, in order to
fully recoup this premium, CNG car owners would have to own this vehicle for almost
twice as long as they would a typical car. Only owners who use twice the annual fuel of an
average American would recoup their investment in less than 5 years. Second, even if a
carbon tax is instituted, the cost savings realized by CNG car owners from such a policy
would be fairly minor. In order for significant savings to be obtained, these cars would
either have to emit much less carbon, or the carbon tax would have to be much higher than
the value used in this analysis ($28.49 per ton of CO2).
The other main step in analyzing the viability of CNG cars to effectively support
the goals of the Pickens Plan is to calculate the number of these vehicles that could be
powered by the 6.1 quadrillion BTUs (49B gasoline gallon equivalents) of natural gas that
would be shifted into the transportation sector. Assuming Americans maintain their
average transportation fuel consumption, this could power 95 million Civic GXs.
However, it is extremely unlikely that Honda could produce enough of these
vehicles to saturate the market by 2020 as it currently produces just 2,000 per year.41 In

14
order to have 95 million active GXs in the U.S. market by 2020, production would have to
grow at a rate of 135% per year. Furthermore, average annual production between now
and 2020 would have to be 7.5 million cars (about 45% of average annual new car sales in
the U.S. from 2003 – 2008).5 Even if it is assumed that people fuel up their CNG car twice
per week (necessitating half the number of cars) the annual growth rate only reduces to
121%. Thus, there are strong growth requirements over the near term regardless of the
assumptions used in this analysis. Moreover, while Ford, Mercedes, and Opel do produce
CNG cars for the European market, their combined global annual production is only
300,000 vehicles.42 The main takeaway from all of this is that it appears there will be a
major timing misalignment between when the natural gas currently used in electricity
generation is made available for transportation and when a large enough number of CNG
cars capable of fully utilizing this fuel would be available.
Other significant concerns with CNG vehicles include that of the limited number of
Civic GXs annually produced by Honda, these are only sold in California and New York.
Another major issue is that the Civic GX has about half the range of a typical automobile
(225 – 250 miles vs. 500 miles per tank). Also, there are very few CNG fueling stations
available in the U.S.. Of the 175,000 gas stations in the U.S., only 1,000 have CNG pumps
(.6% market penetration).42 Thus, the Civic GX has to be mainly used for city driving and
is not very practical for long trips across the country.
The Civic GX can be refueled at home, however the process can take up to 16 hrs if
the tank is near empty.38 The owner has to remember to plug car in at night to refuel,
which will be a lifestyle change for most Americans. Also, the CNG tank is larger than a
5 See exhibit B.4 for simulated market growth

15
conventional gas tank and reduces trunk space.42 Finally, CNG is still a fossil fuel and can
have a carbon footprint similar to coal if it needs to be liquefied in order to be
transported.43
CNG Heavy Trucks and Buses
Pickens has advocated for the natural gas freed up under his plan to be used
towards heavy trucks and buses and to let fuel efficiency in passenger cars and light trucks
be addressed through hybrid technology.44 This section analyzes two types of such
vehicles, CNG buses and garbage trucks.
A CNG bus typically costs $25,000 to $50,000 more than a comparable diesel bus
(for purposes of this analysis, a similar premium is assumed for garbage trucks).45 Under
the 2005 Highway and Energy bill, a tax credit of $32,000 is available for heavy duty CNG
vehicles over 26,000 lbs.46 Therefore much of this premium is immediately offset.
However, unlike CNG cars, these vehicles typically require their owners to build dedicated
fueling stations. The cost for a station capable of handling up to 200 vehicles is $2.7M,
however a tax credit of up to $30,000 or 30% of the station’s cost (whichever is lower),
can be applied toward this. 45, 47
The main difference between CNG buses and garbage trucks is the amount of fuel
consumed per year. CNG buses on average consume around 30,000 gallons per year,
while garbage trucks consume 8,928 gallons.48 Based on this data, the average payback for
each type of vehicle is as follows:

16
$25,000 Premium $50,000 Premium
Natural Gas
Vehicle Type
Packback Period
Type
Without a
Carbon Tax
With a Carbon
Tax (3)
Without a
Carbon Tax
With a Carbon
Tax (3)
(Years) (Years) (Years) (Years)
Undiscounted 0.1 0.1 0.7 0.7
Discounted(2) 0.2 0.1 0.7 0.7
Undiscounted 0.5 0.5 2.4 2.2
Discounted(2) 0.5 0.5 2.7 2.5
(1) Reflects performance specifications of natural gas garbage trucks
(2) 7% discount rate applied to future benefits
(3) 29% reduction in carbon emissions. Carbon tax of $28.49 - European CCX 10/22/08 close price
Truck(1)
Bus
Compared to CNG cars, these heavy duty vehicles have much shorter payback periods.
This is primarily due to their higher annual fuel consumption, which allows for the faster
accumulation of savings through both emission reductions and the $1.50 per gallon cost
differential between natural gas and conventional gas. While the savings due to reduced
carbon emission are greater for these types of vehicles, they still have a minor effect on the
length of the payback period. Based on this information, heavy duty vehicles (particularly
CNG buses) appear to be a better investment under the Pickens plan than CNG cars.
It should be noted that a 2002 study by the National Renewable Energy Lab found
that “CNG buses emitted 53% fewer nitrogen oxides, 85% lower TPM, and 89% lower
carbon monoxide than a conventional diesel bus.”49 Since a more conservative 29%
savings in carbon emissions was used in the analysis above, an even greater carbon
footprint reduction could be assumed. This would further reduce the CNG bus’ payback
period under the presence of a carbon tax.
Similar to CNG cars, the number of producers of heavy duty CNG trucks and buses
is very limited. There are currently only two producers of natural gas engines used in these
vehicles, Cummins Westport Inc. and John Deere.50 In 2000, there were approximately
3,500 CNG buses operating in the U.S. (8% market share), and CNG buses accounted for
17
18% of new bus orders.45 While these are a better investment than CNG cars for using the
natural gas freed up under the Pickens Plan, it would take 1.6 million CNG buses to
consume this fuel. This is 20 times the number of buses in the U.S. and approximately 470
times the number of U.S. natural gas buses in the year 2000.51
The market for CNG garbage trucks is also limited. There were 966 of these in
operation in 2004, and the population is projected to grow to 2,221 in 2010. However the
total garbage truck market is just 179,000 vehicles.48 Even if this entire population was
converted to CNG, it would only consume 3% of the natural gas freed up under the
Pickens Plan. However, these trucks account for just 2% of all heavy duty trucks in the
U.S..51 Thus, there are potentially many other types of heavy duty vehicles that may also
be superior investments to CNG cars for utilizing the freed up energy.
The general conclusion from this analysis is that heavy duty trucks and buses are a
more attractive vehicle segment to convert to natural gas due to their shorter payback
periods. However, because the population for each type of heavy duty vehicle is much
smaller than for passenger cars and light trucks, more than one type will need to be
switched over to CNG if the freed up natural gas is to be used effectively in transportation.
CNG cars may become a more attractive transportation option once heavy trucks, and other
vehicles yielding greater economic and environmental benefits from a CNG conversion,
have been changed over to run on natural gas. This section identifies two types of heavy
duty trucks that appear to be good candidates for conversion, however this is an area that
should be further explored in future studies to confirm the most suitable types for future
investment and expansion of production.

18
Section III: Supplemental Energy Source: Solar
Pickens’ Plan has the dual purpose of increasing U.S. energy security and reducing
U.S. carbon emissions. As part of the evaluation, this report assesses the potential for solar
energy to supplement wind energy as a source of domestic electricity generation.
Current Technologies
There are a host of technologies being developed in the solar energy sector. The
most popular is Photovoltaic (PV) technology, which works by converting solar energy
into electricity from sunlight. “A PV cell consists of two or more thin layers of semi-
conducting material, most commonly silicon. When the silicon is exposed to light,
electrical charges are generated and this can be conducted away by metal contacts as direct
current (DC).”52 PV equipment has very low maintenance cost due to few moving parts
and generates no greenhouse gases. Other solar technologies include solar heating and
solar towers. Currently, there are four main types of PV technologies: Monocrystalline
Silicon Cells, Multicrystalline Silicon Cells, Thick-film Silicon, and Amorphous Silicon.
These range from highly efficient (approximately 15%) and expensive to the less efficient
(6%) but cheaper to manufacture.53 New technologies under development will potentially
be less expensive and more efficient (approximately 30% efficient) than most of today’s
commercially available solar cells. The latest generation of solar heating technology,
consists of collectors (which are mirrors or parabolic dishes) that can track and gather
enough sunlight to transform water to steam. This steam is then used to move electricity
generating turbines. Solar towers consist of large-scale towers of mirrors that focus
sunlight and convert it into heat. Large solar heating towers may become commercially
viable in the next few years.54
19
Feasibility Analysis
While solar power promises to be another source of clean renewable energy, is it
feasible for this energy source to be a major factor in achieving U.S. energy security?
Currently, the U.S. uses 19 trillion kWh of electricity. This report investigates several
aspects of solar to see if it can be used to offset part of this usage. First, how much energy
can the U.S. realistically obtain using current or near current solar technologies? Second,
how much will this cost based on current prices and demand? Finally, what policies must
be in place to allow solar to be commercially viable?
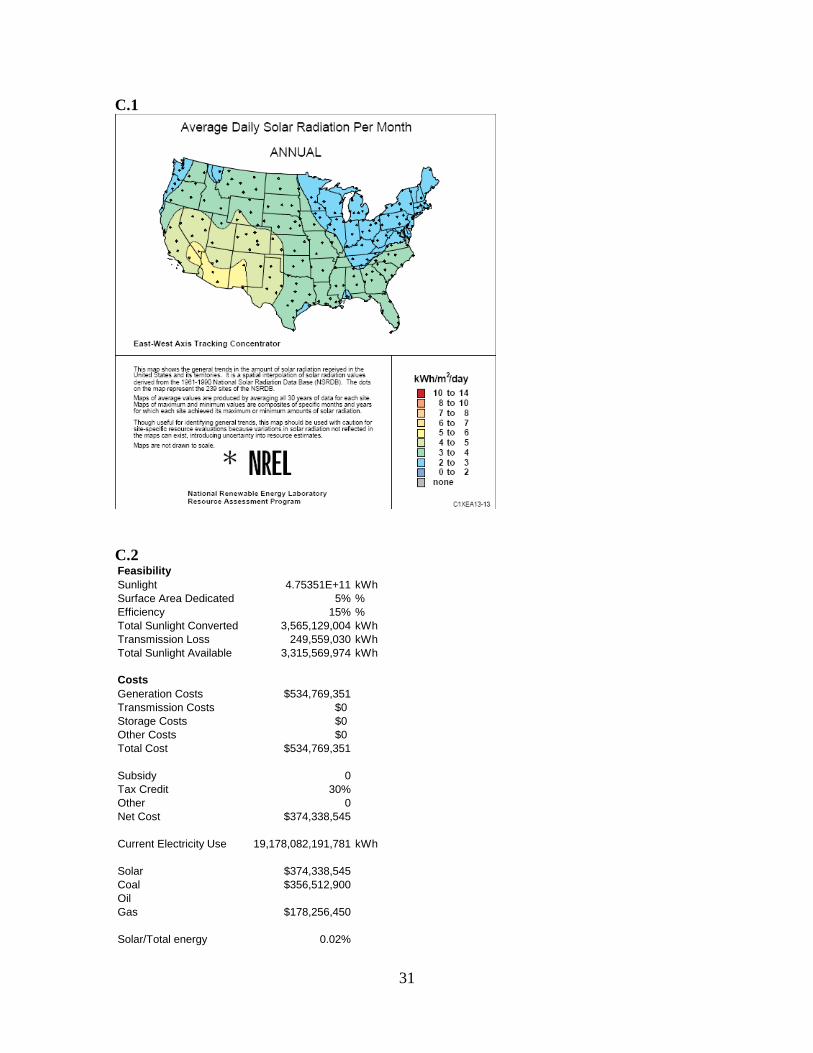
The analysis begins by calculating the amount of available sunlight. According to
the U.S. National Renewable Energy Lab, the West and Southwest of the United States are
exposed to the most sunlight on average6 and therefore it is expected that the majority of
solar power generation in the U.S. will take place in this area. The amount of convertible
solar energy available in the U.S. will be extrapolated from the amount of sunlight
available in this area. The analysis takes the combined surface areas of Texas, New
Mexico, Arizona, California, Nevada, Colorado, and Utah and calculates the total amount
of sunlight this area receives based on annual sunlight exposure. A 5% surface area
utilization rate and an average efficiency conversion rate of 15% from sunlight to
electricity are assumed. According to these calculations and even with the most optimistic
projections, only 3,565 gigawatt hours (without transmission loss which is generally about
7%) or about 0.02% of current United States electricity consumption can be satisfied by
solar energy conversion with current technologies across this area.7 In addition, even if
6 See Appendix C.1
7 See Appendix C.2 and C.3 for calculations
20
this plan was extended to the whole of the United States, solar energy using current
technologies would not provide a substantial supplement to current energy needs.
Current PV and solar technologies can generate electricity at a price range of $0.15
to $0.50 per kWh (kilowatt hour). At this price, the minimal cost to generate the full 3,565
gigawatt hours calculated would result in a price tag of $534 million. Based on current
prices, it would only cost $357 million to generate the same amount of energy with coal
(including carbon sequestration costs) and $178 million utilizing natural gas.55 Therefore,
without any government grants or incentive policies (even with carbon sequestration
requirements), solar energy is not economically feasible.
The last part of this analysis will investigate possible policies that will allow solar
to compete with carbon emitting energy sources in the marketplace. The Energy
Improvement and Extension Act of 2008 extended a 30% tax credit to solar energy
revenues that lowers the total cost of solar energy from $534 million to $374 million.56 At
this price, solar is more expensive that coal or natural gas but comes within range of coal
based electricity. An additional subsidy of 5% to 10% would lower the cost of solar to
approximately equal that of coal.
Section IV: Conclusion, Future Considerations, and Recommendations
This paper’s analysis of the Pickens Plan yields the following conclusions. First,
while wind power does represent a possible replacement for some natural gas electricity
production and 20% of U.S. electricity can realistically be generated using wind, major
challenges must be overcome to achieve this goal. Second, using natural gas as the main
fuel source for transportation represents significant manufacturing, infrastructure, and
21
economic challenges. While the benefits of transferring natural gas use from electricity
generation to the transportation sector are negative for passenger vehicles; positive
economic and environmental returns can be realized by using CNG to replace the gasoline
or diesel used in heavy vehicles. Finally, current technical and economic constraints do
not make solar power a viable replacement for a significant amount conventionally
generated electricity.
Future Considerations
One area not fully analyzed in this paper is whether it is an optimal strategy to
move natural gas from the electricity to transportation sector. While natural gas emits 29%
less carbon than oil, it creates 44% fewer carbon emissions than coal.37 Therefore, a
greater carbon footprint reduction (and economic savings) could be achieved by keeping
natural gas in the electricity sector and using wind power to offset the electricity produced
by coal. Furthermore, the intermittent nature of wind and solar energy requires significant
back up generation capacity. Since natural gas is the best energy source for short lead
time, intermittent power generation (as shown by its use in peaker plants), it would seem
that its continued use it the electrical sector would be a prerequisite for expanding the
capacity of wind and solar power.
However, if natural gas is not moved into the transportation sector the Pickens Plan
will not achieve one of its core goals of decreasing the U.S.’s dependence on foreign oil.
Instead it will be offsetting an abundant U.S. resource (coal) with another relatively
abundant one (natural gas). This decision is dependent upon three key issues. First, how
quickly can automotive hybrid technology improve so that heavy trucks can achieve a cost
savings equal to the fuel price and carbon emission reductions achieved by heavy trucks
22
powered by CNG? Second, if series (plug-in) hybrids turn out to be the optimal hybrid
technology, then is it environmentally and economically better to use this natural gas to
generate electricity to power these vehicles, or should it still be used to power CNG
vehicles? Third, and perhaps most important, what is the price of foreign energy
independence? Is it the cost of the Iraq war, a present value estimate of the cost of future
conflicts in the Middle East, or something else entirely larger?
These questions should be explored in future studies. While they are difficult areas
of analysis, the impact of the findings in these areas will extend beyond the Pickens Plan
and have significant implications for future U.S. energy policy.
Policy Insights
Several policy insights can be derived from this analysis of the Pickens plan.
Financial incentives or an increase in coal and/or natural gas prices are necessary to
encourage the active adoption of wind or solar energy as the preferable sources of
electricity generation. The turmoil in the financial markets and tight credit markets also
makes the immediate adoption of wind energy less likely. Pickens recently announced that
the construction of a large wind farm in Texas would be delayed, “due to the unexpected
fall in the price of fossil fuels and the sudden difficulty of borrowing money”57.
The introduction of more aggressive renewable portfolio standards, a carbon tax, a
federally mandated carbon market, reduced carbon emission limits, reduced water
consumption limits, renewable energy government purchase agreements, and renewable
energy subsidies have all been discussed as ways to increase the cost of conventional
electricity generation relative to the cost of wind and solar energy, making investment in
these types of energy generation facilities more attractive to public utilities. The potential

23
effectiveness of any of these policies varies greatly with market conditions and
implementation details. Most politicians advocate a cap and trade system to hasten the
adoption of low-carbon emitting electricity generation. This policy will raise the price of
conventional electricity generation, reduce general demand, and drive the adoption of
renewable generation.58
Cap-and-trade programs force producers to choose between purchasing
credits/allowances or reducing carbon emissions (whichever method is least expensive).
The European Union's Emissions Trading Scheme (EU ETS), which was implemented at
the beginning of 2005, shows this approach can be successful in achieving this goal.59
Although determining the appropriate cap levels (and subsequent reductions), allocating
emission allowances, monitoring emissions, monitoring the trading market and other
implementation details are critical to the overall success of such a system, a federally
mandated cap-and-trade program has the potential to efficiently reduce carbon emissions
in the U.S.. This may be one of the most efficient methods for driving change, but it is
also politically challenging since it will increase energy prices. Without significant public
support, any policy that results in an increase in energy prices will be extremely difficult to
pass into law.
If a cap-and-trade program is implemented in such a way as to affect the price of
retail transportation fuel, it would also encourage the replacement of gasoline with natural
gas in the transportation sector. Even though a carbon tax savings will probably not be the
major source of cost savings in the switch from gasoline to CNG in the transportation
sector, it will increase the benefits of such a transition. However, a price on carbon ties a
population’s environmental impact to their financial well being, giving them a stronger

24
incentive to change their lifestyle in a manner that further supports the goals of the Pickens
Plan (cleaner power and energy independence).
25
Appendix
A.1 Assumptions used for scenario analysis60
Scenario Assumptions
Renewable Energy Technologies (other than wind)
• Contributions to U.S. electricity supply from renewable energy (other than wind) are held constant at 2006 levels through 2030
Land-Based Wind Technology Cost
• $1,730/kW in 2005 and 2010, decreasing 10% by 2030 • Regional costs vary with population density, with an additional 20% in New England
Shallow Offshore Wind Technology Cost
• $2,520/kW in 2005, decreasing 12.5% by 2030
Wind Technology Performance
• Capacity factor improvements about 15% on average over all wind classes between 2005 and 2030
Existing Transmission • 10% of existing transmission capacity available to wind plants at point of interconnection
New Transmission • Transmission will be expanded • $1,600/megawatt-mile (MW-mile) • 50% of cost covered by wind project • Regional cost variations prescribed as follows: 40% higher in New England and New York, 30% higher in Pennsylvania-New Jersey-Maryland (PJM) East interconnection, 20% higher in PJM West, 20% higher in California
Wheeling Charges • No wheeling charges between balancing areas
Conventional • Natural gas plant cost ($780/kW in 2005) and
Generation performance flat through 2030 Technology Cost • Coal plant capital cost ($2,120/kW in 2005) increases and Performance about 5% through 2015 and then remains flat through 2030 •
Coal plant performance improvement of about 5% between 2005 and 2030 • Nuclear plant capital cost ($3,260/kW in 2005) decreases 28% between 2005 and 2030 • Nuclear plant performance stays flat through 2030
Fuel Prices • Natural gas prices follow AEO high fuel price forecast • Coal prices follow AEO reference fuel price forecast • Uranium fuel price is constant
26
A.2 Distribution of wind capacity on existing and new transmission lines61
Transmission Type 2030 Wind
Capacity 2030 MW-Miles
Average Distance Traveled for Each MW
Existing Transmission Lines
71 GW 20 million MW-miles
278 miles
New Capacity Lines within a WinDS region
67 GW N/A N/A (estimated at 50 miles)
New Capacity Lines that Cross One or More WinDS Region Boundaries
166 GW 30 million MW-miles
180 Miles
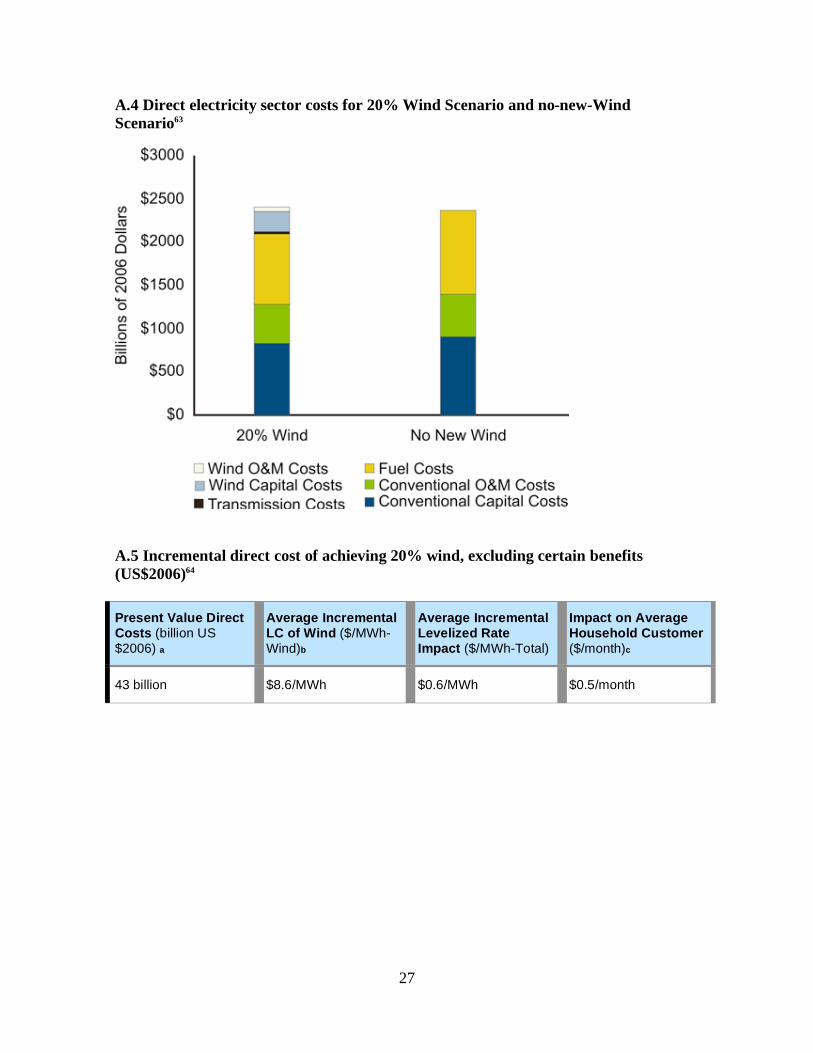
A.3 Direct electricity sector costs for 20% Wind Scenario and No New Wind Scenario
(US$2006)62
Present Value
Direct Costs for 20% Wind Scenario* (billion US$2006)
Present Value Direct Costs for No New Wind after 2006* (billion US$2006)
Wind Technology O&M Costs $51 $3
Wind Technology Capital Costs $236 $0
Transmission Costs $23 $2
Fuel Costs $813 $968
Conventional Generation O&M Costs $464 $488
Conventional Generation Capital Costs $822 $905
27
A.4 Direct electricity sector costs for 20% Wind Scenario and no-new-Wind
Scenario63
A.5 Incremental direct cost of achieving 20% wind, excluding certain benefits
(US$2006)64
Present Value Direct Costs (billion US $2006) a
Average Incremental LC of Wind ($/MWh-Wind)b
Average Incremental Levelized Rate Impact ($/MWh-Total)
Impact on Average Household Customer ($/month)c
43 billion $8.6/MWh $0.6/MWh $0.5/month

28
A.6 Baseline financial assumptions65 Name Value Notes and Source Inflation Rate 3% Based on recent historical inflation rates Real Discount Rate 8.5% Equivalent to weighted cost of capital. Based on EIA
assumptions (EIA 2006) Marginal Income Tax Rate
40% Combined federal/state corporate income tax rates
Evaluation Period 20 Years Base Case Assumption Depreciation Schedule Conventional Wind
15 Year 5 Year
MACRS (Modified Accelerated Cost Recovery Schedule) MACRS (Modified Accelerated Cost Recovery Schedule)
Nominal Interest Rate during Construction
10% Base Case Assumption
Dollar Year
2004 All costs are expressed in year 2004 dollars.
B.1. – Natural Gas Trends
US Natural Gas Used for Electric Power
Consumption and Price
0
200
400
600
800
1,000
1,200
Jan-2002 Jul-2003 Jan-2005 Jul-2006 Jan-2008
To
tal
Co
ns
um
pti
on
(B
illi
on
Cu
bic
Fe
et)
$0
$2
$4
$6
$8
$10
$12
$14
Pri
ce
(D
oll
ar
pe
r T
ho
us
an
d C
ub
ic F
ee
t)
Total ConsumptionPrice
Source: US Energy Information Agency – Annual Energy Outlook 2008

29
B.2. – Natural Gas Trends
Natural Gas Consumption by Sector
0
1
2
3
4
5
6
7
8
1990 1995 2000 2005 2010 2015 2020 2025 2030
Tri
llio
n C
ub
ic F
ee
t
Electricity generators
Transportation 2008
2020
Source: US. Energy Information Agency – Annual Energy Outlook 2008
B.3. – Forecast data Issues
It is difficult to say whether Pickens or the EIA will be more accurate in their projections.
The EIA is not allowed to utilize non-official government sources in determining its
forecasts (which poses significant problems when trying to predict the actions of China and
Iran) and has been negatively impacted by budget cuts over the past few years.66 Also, its
projections have come under recent criticism from Congress for failing to predict the
massive oil price shocks during the summer of 2008.67
Pickens has over 50 years of experience in the oil and gas industry and manages a hedge
fund (BP Capital) which has traded energy futures for over 11 years.68 Success with these
financial instruments is predicated on a fund’s ability to develop better assumptions and
forecasts than the market. However, Pickens has substantial natural gas holdings through

30
his company Mesa Petroleum (the largest U.S. producer of oil and gas) and therefore has a
vested interest to see this market grow.69
It appears though the figures Pickens has cited for his plan’s impact, and particularly for
U.S. energy independence, were calculated using current energy consumption levels.
Whether this was done because he believes conditions in 2020 will be similar to today, or
because these yield higher impact numbers that are more useful in gaining support among
the public, is unclear.
B.4. – Simulated CNG Car Production
CNG Annual Car Production to Achieve 2020 Market Saturation
Year
CNG Cars
Produced
CNG Cars
Decommisioned
CNG Cars
In Use
2008 2,000 0 2,000
2009 4,696 0 4,696
2010 11,024 0 11,024
2011 25,883 0 25,883
2012 60,767 0 60,767
2013 142,669 2,000 140,669
2014 334,958 4,696 330,262
2015 786,411 11,024 775,387
2016 1,846,332 25,883 1,820,449
2017 4,334,806 60,767 4,274,039
2018 10,177,231 142,669 10,034,562
2019 23,894,040 334,958 23,559,082
2020 56,098,280 786,411 55,311,869 Note: Shaded cells indicate amounts are greater than average
annual U.S. new car sales from 2002 - 2007
31
C.1
C.2 Feasibility
Sunlight 4.75351E+11 kWh
Surface Area Dedicated 5% %
Efficiency 15% %
Total Sunlight Converted 3,565,129,004 kWh
Transmission Loss 249,559,030 kWh
Total Sunlight Available 3,315,569,974 kWh
Costs
Generation Costs $534,769,351
Transmission Costs $0
Storage Costs $0
Other Costs $0
Total Cost $534,769,351
Subsidy 0
Tax Credit 30%
Other 0
Net Cost $374,338,545
Current Electricity Use 19,178,082,191,781 kWh
Solar $374,338,545
Coal $356,512,900
Oil
Gas $178,256,450
Solar/Total energy 0.02%

32
C.3 State Area (miles) Area (meters2) Average Light kWh/day Average Light kWh Total Sunlight
Texas 268581 6.95622E+11 4 0.166666667 1.15937E+11
Arizona 113998 2.95253E+11 5 0.208333333 61511135838
California 163696 4.23971E+11 4 0.166666667 70661779275
New Mexico 121589 3.14914E+11 5 0.208333333 65607093944
Nevada 110561 2.86352E+11 5 0.208333333 59656596514
Colorado 104094 2.69602E+11 5 0.208333333 56167127265
Utah 84899 2.19887E+11 5 0.208333333 45809873169
Total 4.75351E+11
source: http://www.statemaster.com/graph/geo_are_lan-geography-total-area
33
Endnotes
1 Pickens Plan, 2008, http://www.pickensplan.com/theplan
2 Pickens Plan, 2008, http://www.pickensplan.com/theplan
3Pickens Plan, 2008, http://www.pickensplan.com/theplan
4 U.S. DOE Report, 20% Wind Energy by 2030, p. 206
5 In August 2008, the U.S. received 89% of total imports via pipeline from Canada and Mexico according to DOE EIA.
http://tonto.eia.doe.gov/dnav/ng/ng_move_impc_s1_m.htm
6 Pickens Plan, 2008, http://www.pickensplan.com/theplan
7 U.S. Energy Information Administration’s Annual Energy Outlook 2007
8 Pickens Plan, 2008, http://www.pickensplan.com/theplan
9 AWEA 2007
10 Pickens Plan, 2008, http://www.pickensplan.com/theplan
11 U.S. DOE Report, 20% Wind Energy by 2030, p. 24
12 U.S. DOE Report, 20% Wind Energy by 2030, p. 95
13 U.S. DOE Report, 20% Wind Energy by 2030, p. 188
14 U.S. DOE Report, 20% Wind Energy by 2030, p. 79
15 U.S. DOE Report, 20% Wind Energy by 2030, p.94
16 U.S. DOE Report, 20% Wind Energy by 2030, p.162
17 U.S. DOE Report, 20% Wind Energy by 2030, p. 49
18 U.S. DOE Report, 20% Wind Energy by 2030, p. 203
19 U.S. DOE Report, 20% Wind Energy by 2030, p. 9
20 U.S. DOE Report, 20% Wind Energy by 2030, p. 191
21 U.S. DOE Report, 20% Wind Energy by 2030, p. 145
22 http://www1.eere.energy.gov/windandhydro/news_detail.html?news_id=12032
23 U.S. DOE Report, 20% Wind Energy by 2030, p.192
24 U.S. DOE Report, 20% Wind Energy by 2030, p.134
25 U.S. DOE Report, 20% Wind Energy by 2030, p.194
26 U.S. DOE Report, 20% Wind Energy by 2030, p.163
27 U.S. DOE Report, 20% Wind Energy by 2030, p.163
28 U.S. DOE Report, 20% Wind Energy by 2030, pp.112-117
29 http://www.newscientist.com/article/mg20026796.600-radar-can-finally-tell-a-wind-turbine-from-a-plane--.html
30 U.S. Energy Information Agency. Natural Gas Statistical Database.
http://www.eia.doe.gov/oil_gas/natural_gas/info_glance/natural_gas.html
31 U.S. Energy Information Agency. “EIA Annual Energy Outlook 2008”. June. 2008. http://www.eia.doe.gov/oiaf/aeo/index.html
32 Calculated figures based on data from EIA Annual Energy Outlook 2008 - http://www.eia.doe.gov/oiaf/aeo/index.html
33 Based on price of carbon on European Carbon Climate Exchange as of 10/22/2008.
http://www.europeanclimateexchange.com/default_flash.asp
34 Gasoline Price Infomation: Energy Information Agency Database of Average Gas Prices. October 22, 2008
http://www.eia.doe.gov/oil_gas/petroleum/data_publications/wrgp/mogas_home_page.html
35 Natural Gas Price Information: CNGPrices.com - http://www.cngprices.com/
34
36 Natural Gas Tax Credit Information: Natural Gas Vehicles for America Website. http://www.ngvc.org/incentives/federalTax.html
37 Energy Information Agency – Natural Gas Issues and Trends 1998. www.naturalgas.org/environment/naturalgas.asp
38 Honda Civic GX website - http://automobiles.honda.com/civic-gx/
39 McClure, Darin R. “Our Honda Civic GX”. October 31, 2007. http://hondacivicgx.blogspot.com/2008/02/qualified-alternative-
fuel-motor.html
40 U.S. Energy Information Agency. “Petroleum Basic Statistics”. September 2008. http://www.eia.doe.gov/basics/quickoil.html
41 O’Dell, John. “Toyota Jumps on Natural Gas Bandwagon With CNG Hybrid at LA Auto Show”. Green Car Advisor. September
24, 2008. http://blogs.edmunds.com/greencaradvisor/2008/09/toyota-jumps-on-natural-gas-bandwagon-with-cng-hybrid-for-la-auto-
show.html
42 Mitchell, Jacquelin. “The World’s Cleanest Cars?” www.Forbes.com. July 30, 2008
43 Odion-Esene, Brai. “Expert: Despite Boone Pickens, NatGas Expensive Oil Alternative”, Market News International. July 10,
2008
44 Pickens, T. Boone. Interview with John Stewart on the Daily Show. November 12, 2008
45 World Bank. Clean Air Initiative in Latin American Cities. March 10, 2008. http://www.cleanairnet.org/infopool/1411/article-
33906.html
46 Cummins Westport Inc. Website - http://www.cumminswestport.com/products/incentives.php
47 Blue Bird Inc. Website - http://www.blue-bird.com/product.aspx?category=cng&item=All%20American%20Rear%20Engine
48 Underwood, Joanna D. President, INFORM, “Presentation for U.S. Conference of Mayors”, www.informinc.org, March 23,
2005
49 Melendez, Margo. “Heavy-Duty Vehicle Emission Testing”. National Renewable Energy Lab. June 2003. http://www.nrel.gov/docs/fy03osti/33280.pdf
50 U.S. Department of Energy. “Alternative Fuels and Advanced Vehicles Data Center”. September 19, 2008.
http://www.afdc.energy.gov/afdc/fuels/natural_gas.html
51 U.S. Bureau of Transportation Statistics. “Number of U.S. Aircraft, Vehicles, Vessels, and Other Conveyances”.
http://www.bts.gov/publications/national_transportation_statistics/html/table_01_11.html
52 The Electricity Forum. “Solar Electricity Explained”. http://www.electricityforum.com/solar-electricity.html
53 Solar Energy Technologies http://greennature.com/article63.html
54 Solar Energy Technologies http://greennature.com/article2604.html
55 Professor Tolley’s Week 2 Class Presentation – “Economic Perspectives on Energy”. Slide 8
56 Environmental News Service http://www.ens-newswire.com/ens/oct2008/2008-10-03-02.asp
57 Clean technology in the downturn, Gathering clouds, Nov 6th 2008, The Economist print edition
58 Fighting for the planet, Nov 19th 2008, The Economist (The World in 2009), Edward McBride
59 Ellerman, A. Denny and Buchner, Barbara K., The European Union Emissions Trading Scheme: Origins, Allocation, and Early
Results, http://reep.oxfordjournals.org/cgi/content/full/1/1/66#SEC10
60 U.S. Department of Energy Report, 20% Wind Energy by 2030, p. 124
61 U.S. Department of Energy Report, 20% Wind Energy by 2030, p. 161
62 U.S. Department of Energy Report, 20% Wind Energy by 2030, p. 162
63 U.S. Department of Energy Report, 20% Wind Energy by 2030, p. 162
64 U.S. Department of Energy Report, 20% Wind Energy by 2030, p. 163
65 U.S. Department of Energy Report, 20% Wind Energy by 2030, p. 169
66 Dephills, Lydia. “DOE; Energy Information Chief – ‘the calmest person’ in a tempest –moves on” Greenwire, August 20, 2008
67 Loveless, Bill. “For EIA, changes in energy markets make gathering data harder: Caruso”, Inside Energy, September 1, 2008

35
68 BP Capital website - https://www.bpcap.net/
69 Flynn, Keli. “The Handbook of Texas Online”. http://www.tshaonline.org/handbook/online/articles/MM/dom4.html