evaluation of the trinity – tiger shoals complex: a potential … · · 2013-01-18evaluation of...
TRANSCRIPT

Evaluation of the Trinity – Tiger Shoals Complex: A Potential Sand Resource for Coastal Restoration
Clint H. Edrington1, Harry H. Roberts1, Syed M. Khalil2, & DeWitt Braud1
1 Coastal Studies Institute, Department of Oceanography and
Coastal Sciences, Louisiana State University
2 LACES Division, Louisiana Office of Coastal Protection and Restoration

Special Thanks
This project was undertaken by the Louisiana Office of Coastal Protection and Restoration (OPCR) and the Coastal Studies Institute at LSU with funding from Minerals Management Service (now BOEMRE)
• Roger Amato (Project Officer)
2

The State We Are In
From Barras et al. (2008)
Land loss since the 1930s: ~ 4,800 km2 (Britsch and Dunbar 1993)
Projections: ~ 1,300 km2 within 50 years (Barras et al. 2003) ~ 10,000 – 13,500 km2 by 2100 (Blum and Roberts 2009)
Factors that contribute to coastal land loss: • eustatic sea-level rise • subsidence • tropical storm impacts • “normal” wave energy • anthropogenic
3

Barrier Islands: The First Line of Defense
http://ngom.usgs.gov/phototours/ www.science.nationalgeographic.com/wallpaper
www.atchafalayarevisited.com
Act as a physical buffer against open marine processes Tropical storms + subsidence = net degradation
4
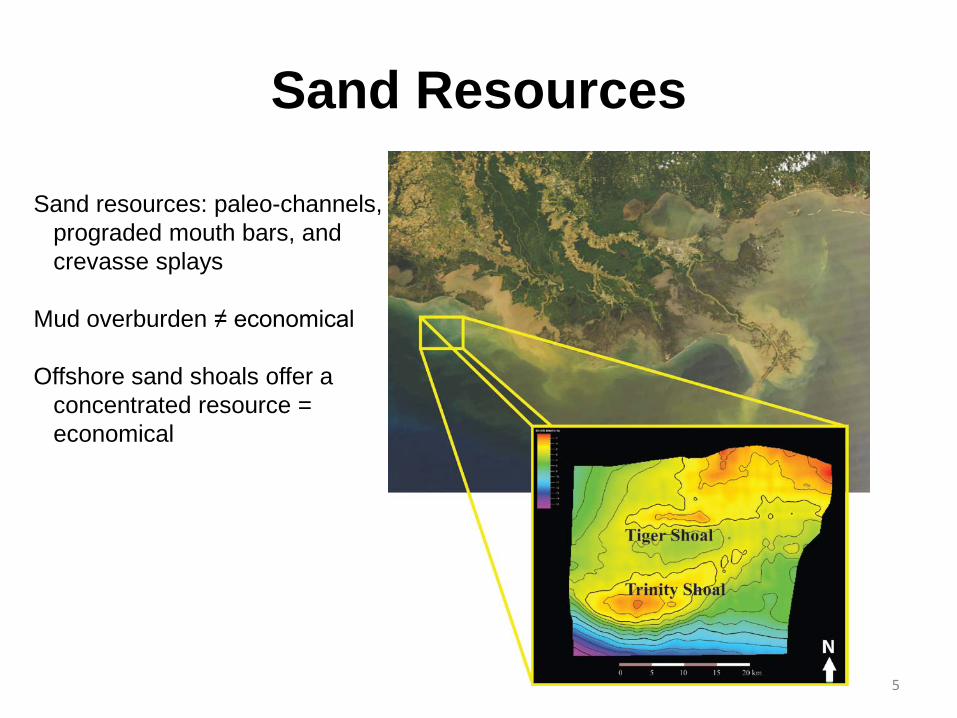
Sand Resources
Sand resources: paleo-channels, prograded mouth bars, and crevasse splays Mud overburden ≠ economical Offshore sand shoals offer a concentrated resource = economical
5
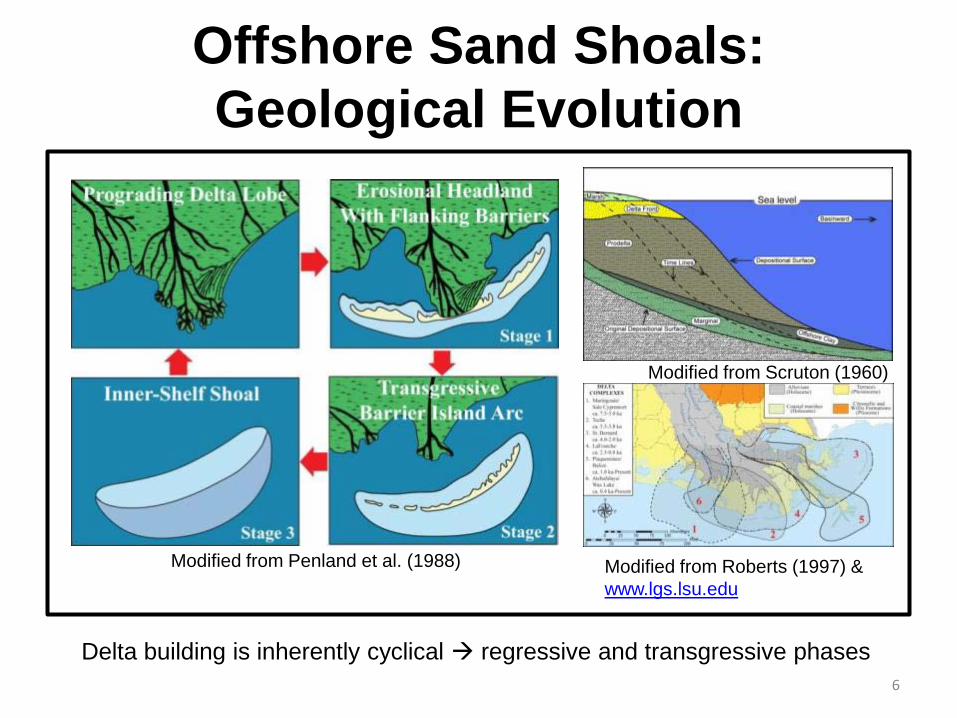
Offshore Sand Shoals: Geological Evolution
Modified from Penland et al. (1988) Modified from Roberts (1997) & www.lgs.lsu.edu
Modified from Scruton (1960)
Delta building is inherently cyclical regressive and transgressive phases 6
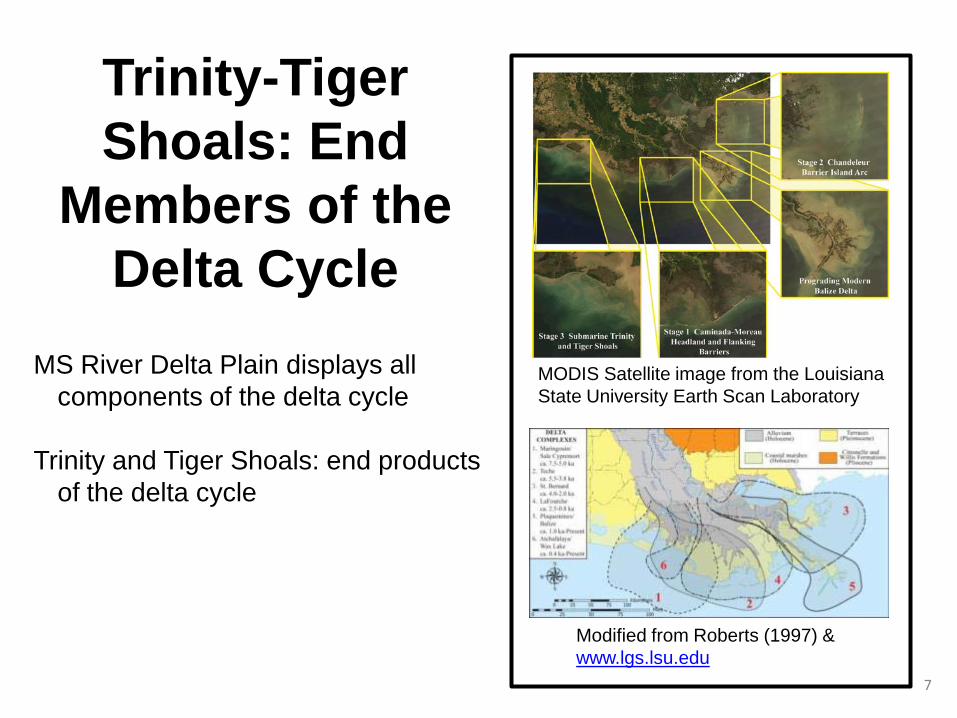
Modified from Roberts (1997) & www.lgs.lsu.edu
MODIS Satellite image from the Louisiana State University Earth Scan Laboratory
MS River Delta Plain displays all components of the delta cycle
Trinity and Tiger Shoals: end products
of the delta cycle
Trinity-Tiger Shoals: End
Members of the Delta Cycle
7
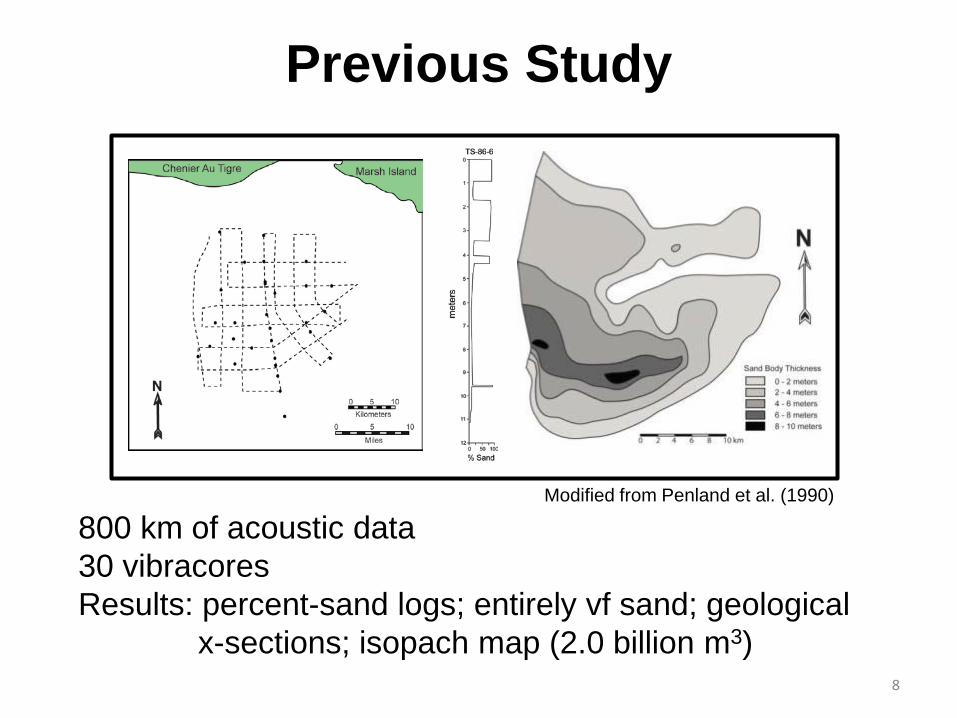
Previous Study
Modified from Penland et al. (1990)
800 km of acoustic data 30 vibracores Results: percent-sand logs; entirely vf sand; geological
x-sections; isopach map (2.0 billion m3) 8

Purpose
Develop a detailed model of the Trinity-Tiger Shoals Complex Objectives: 1) Evaluate quantity and quality of sand 2) Locate pipelines and other metallic hazards 3) Integrate objectives 1 and 2 to calculate total
sand volume available for extraction
9
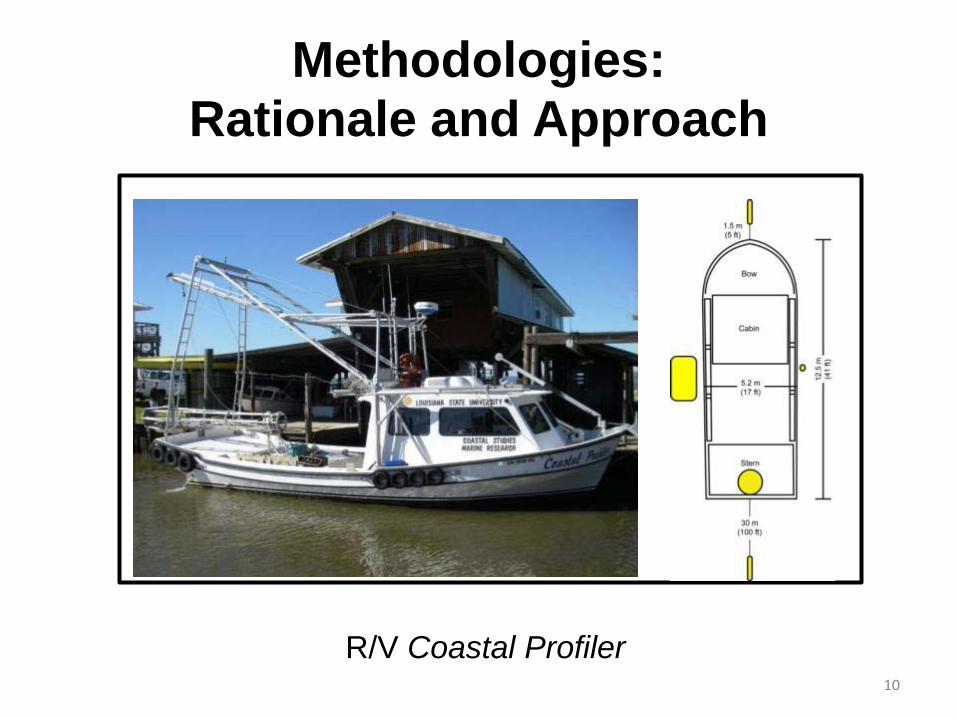
Methodologies: Rationale and Approach
R/V Coastal Profiler 10
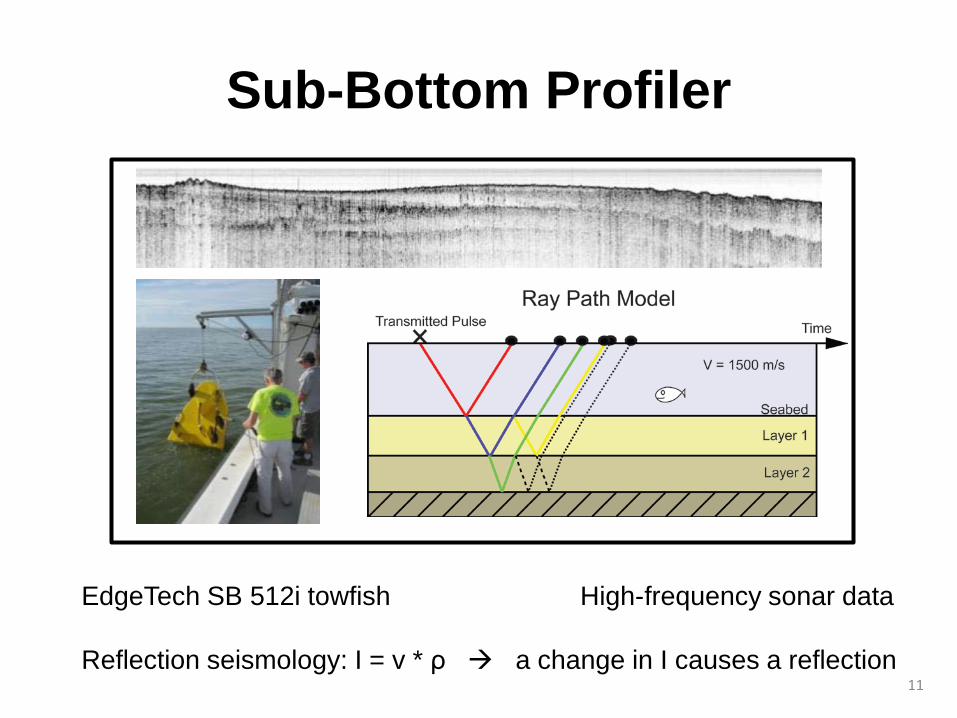
Sub-Bottom Profiler
EdgeTech SB 512i towfish High-frequency sonar data Reflection seismology: I = v * ρ a change in I causes a reflection
11

Survey Grid
2 separate surveys 1,350 line km Initial grid’s spacing interval is 0.9 km vs. 2.3 km 12

Picking Coring Sites
Motivation: (1) satisfy our BOEMRE objective, and (2) penetrate surfaces in as many locations as possible so as to extrapolate geological interpretations throughout the study area
13
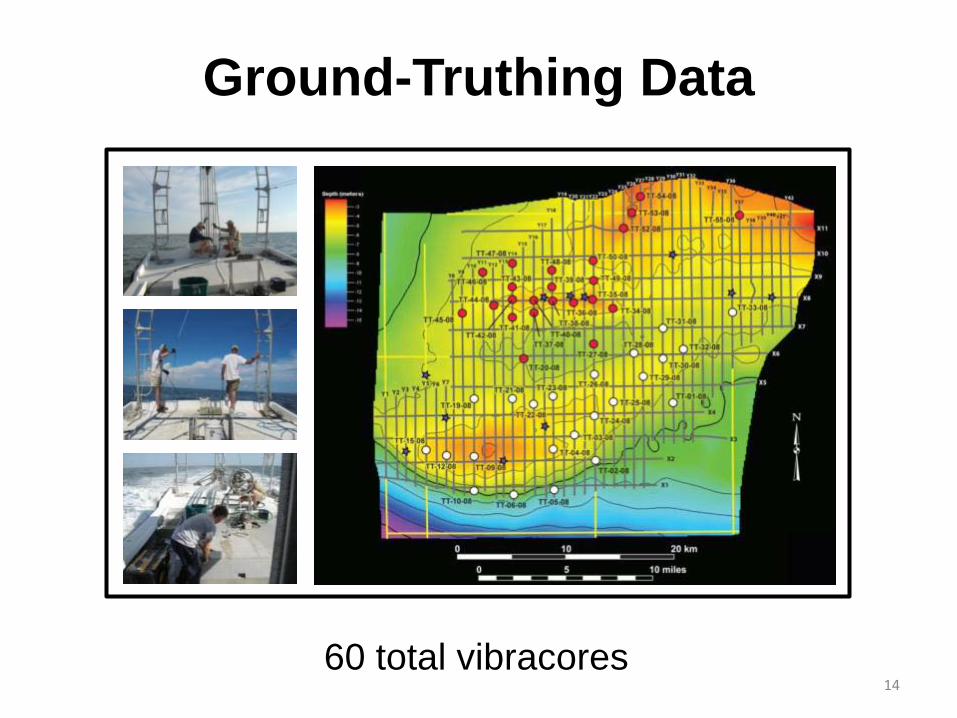
Ground-Truthing Data
60 total vibracores 14
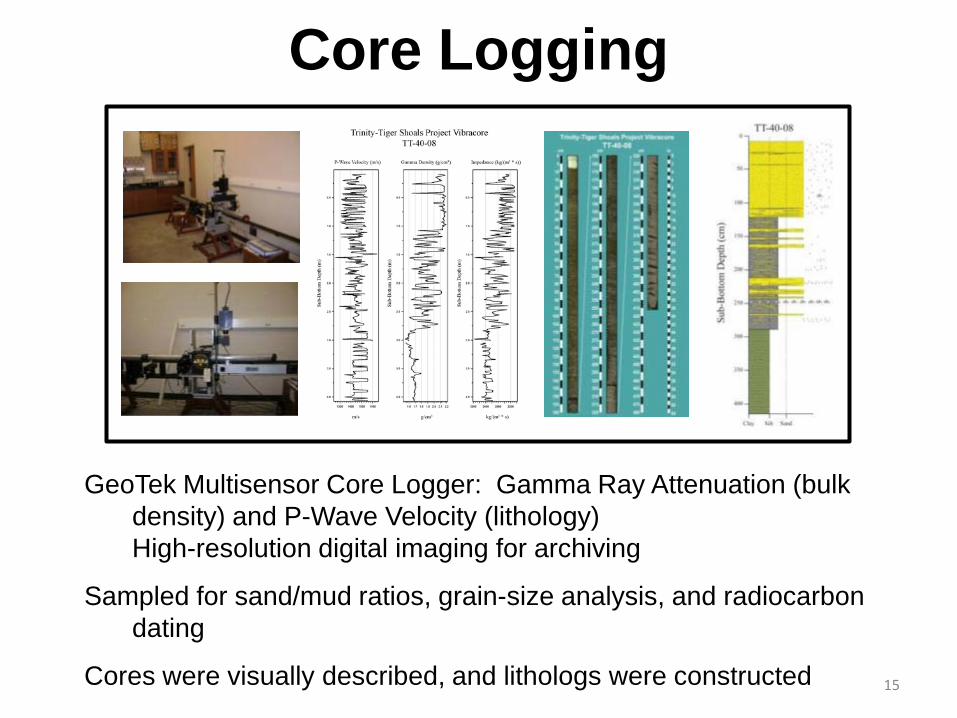
Core Logging
GeoTek Multisensor Core Logger: Gamma Ray Attenuation (bulk density) and P-Wave Velocity (lithology) High-resolution digital imaging for archiving
Sampled for sand/mud ratios, grain-size analysis, and radiocarbon dating
Cores were visually described, and lithologs were constructed 15
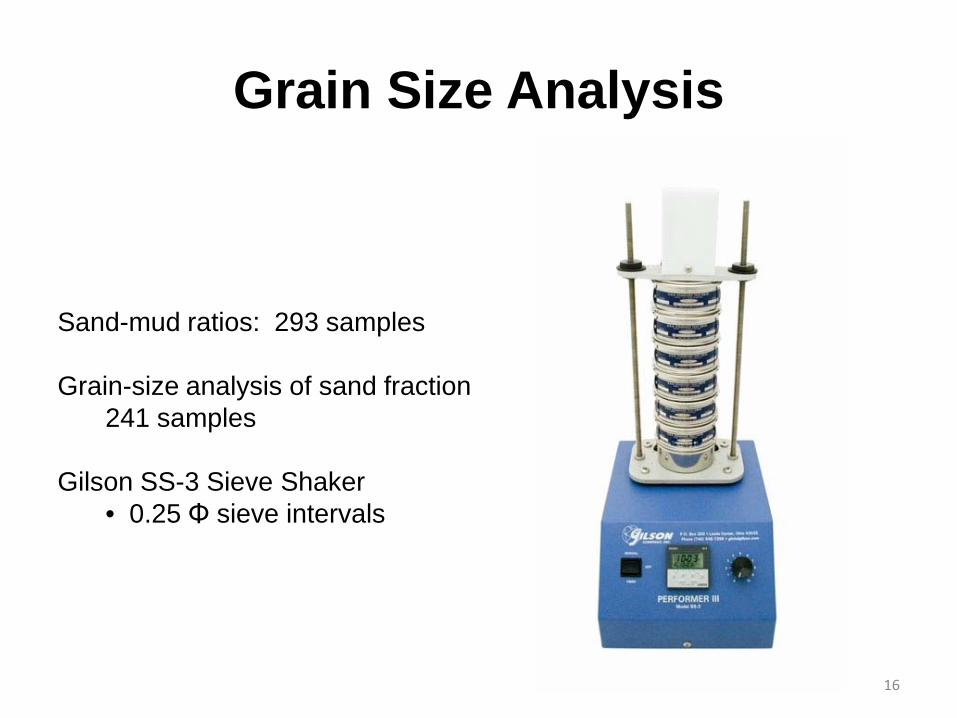
Grain Size Analysis
Sand-mud ratios: 293 samples Grain-size analysis of sand fraction
241 samples Gilson SS-3 Sieve Shaker
• 0.25 Φ sieve intervals
16

Stratigraphic Framework
17
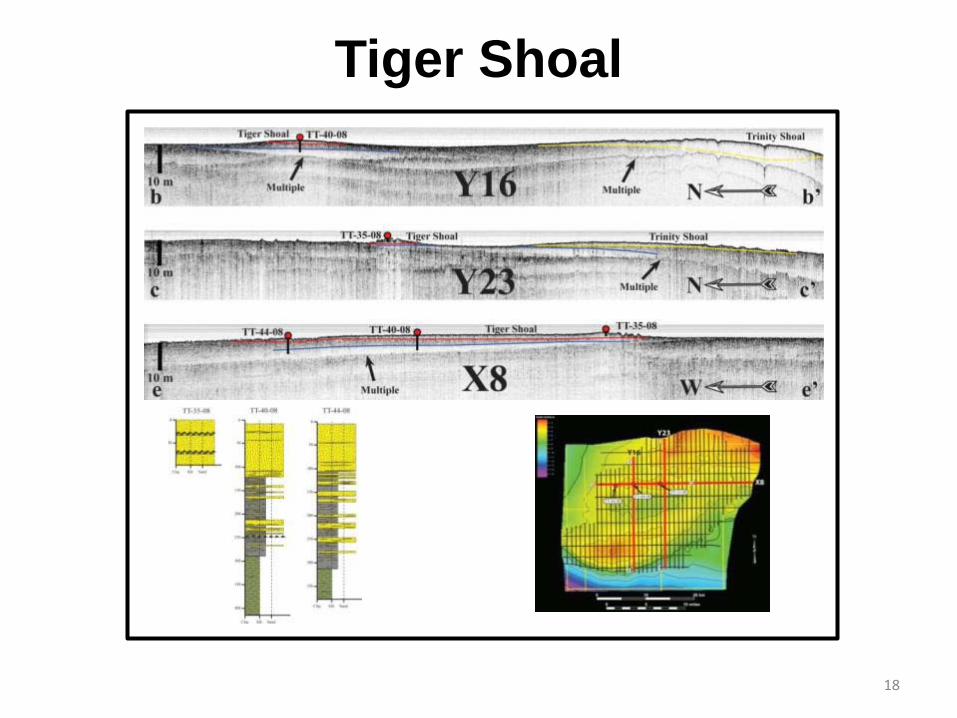
Tiger Shoal
18
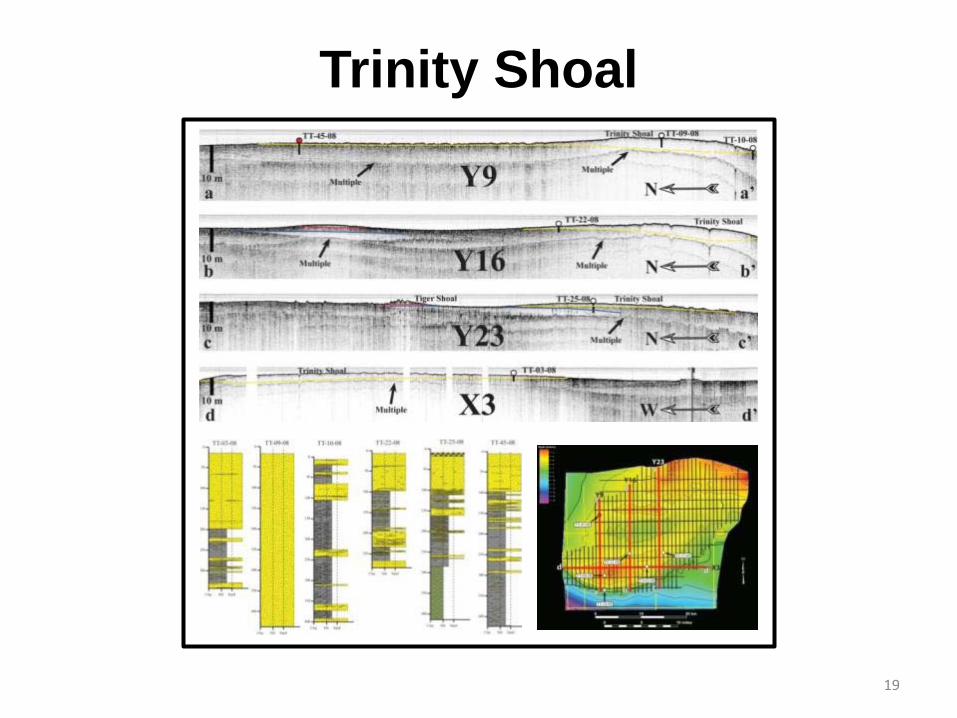
Trinity Shoal
19

Two Separate Depositional Bodies
20
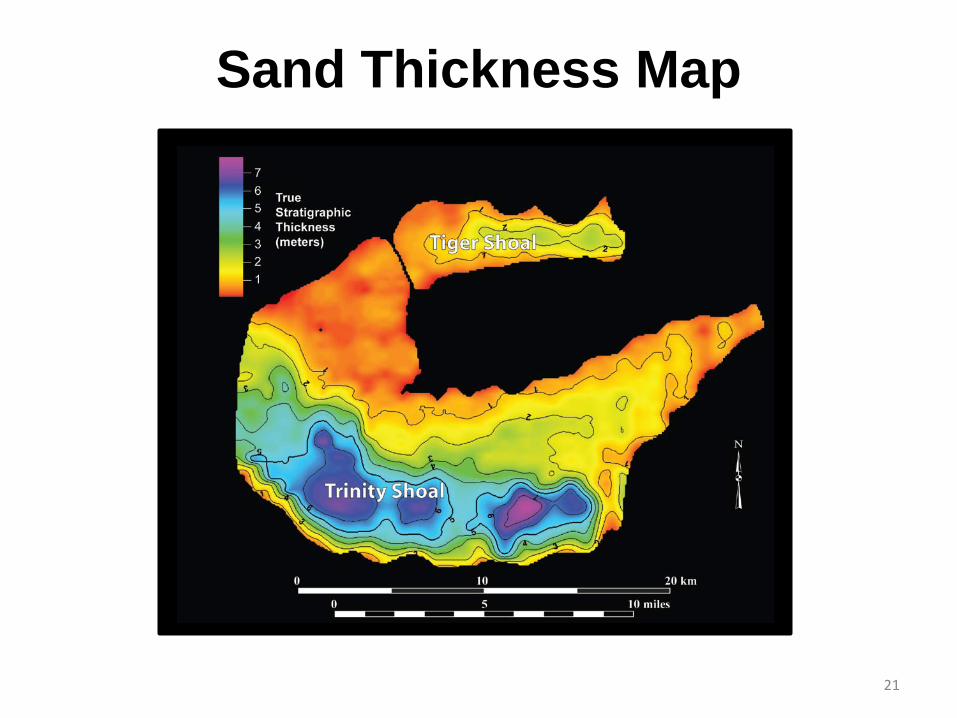
Sand Thickness Map
21
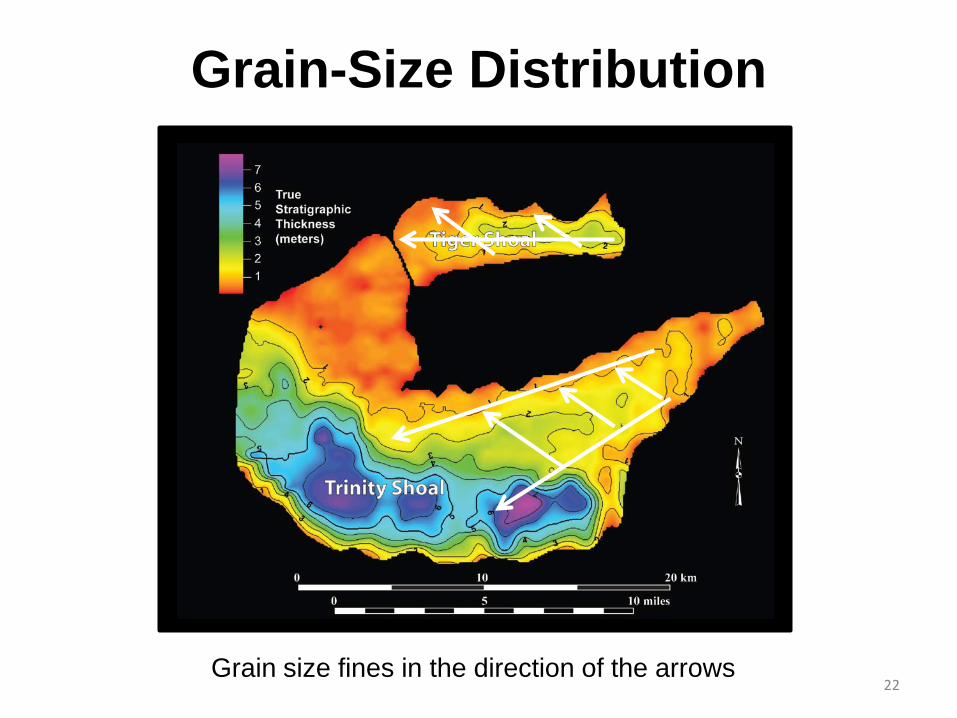
Grain-Size Distribution
Grain size fines in the direction of the arrows 22
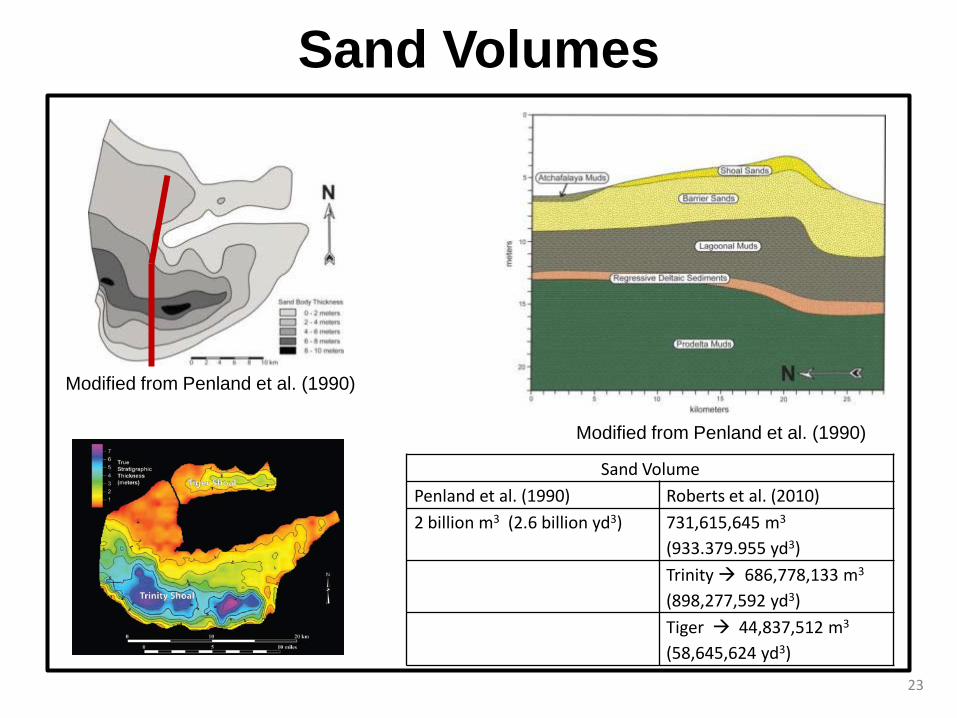
Sand Volumes
Modified from Penland et al. (1990)
Modified from Penland et al. (1990)
Sand Volume Penland et al. (1990) Roberts et al. (2010) 2 billion m3 (2.6 billion yd3) 731,615,645 m3
(933.379.955 yd3) Trinity 686,778,133 m3 (898,277,592 yd3) Tiger 44,837,512 m3 (58,645,624 yd3)
23
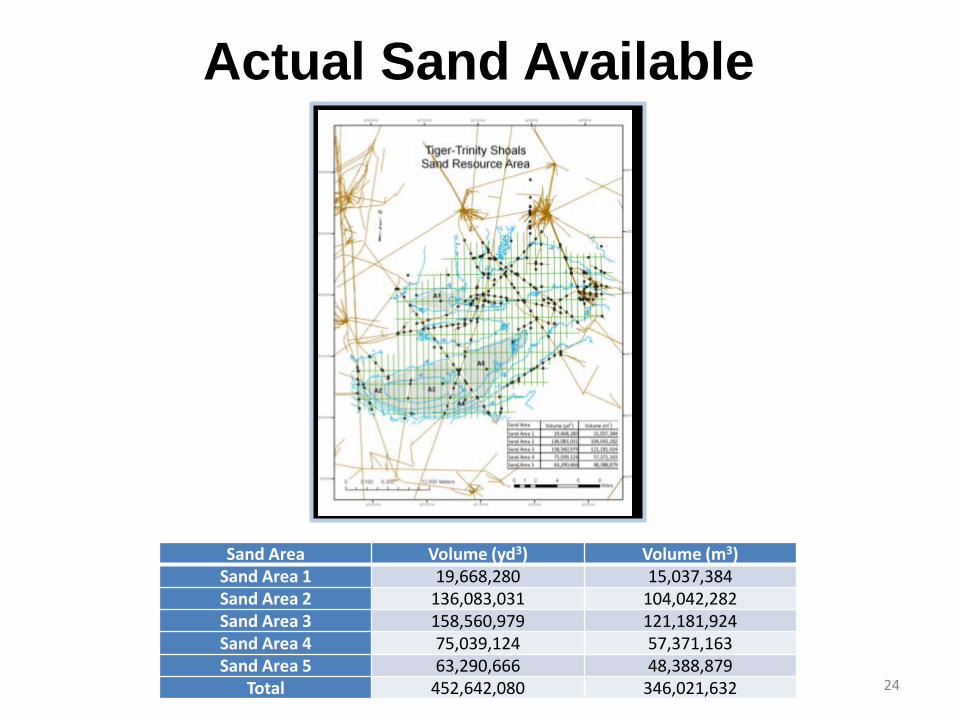
Actual Sand Available
Sand Area Volume (yd3) Volume (m3) Sand Area 1 19,668,280 15,037,384 Sand Area 2 136,083,031 104,042,282 Sand Area 3 158,560,979 121,181,924 Sand Area 4 75,039,124 57,371,163 Sand Area 5 63,290,666 48,388,879
Total 452,642,080 346,021,632 24
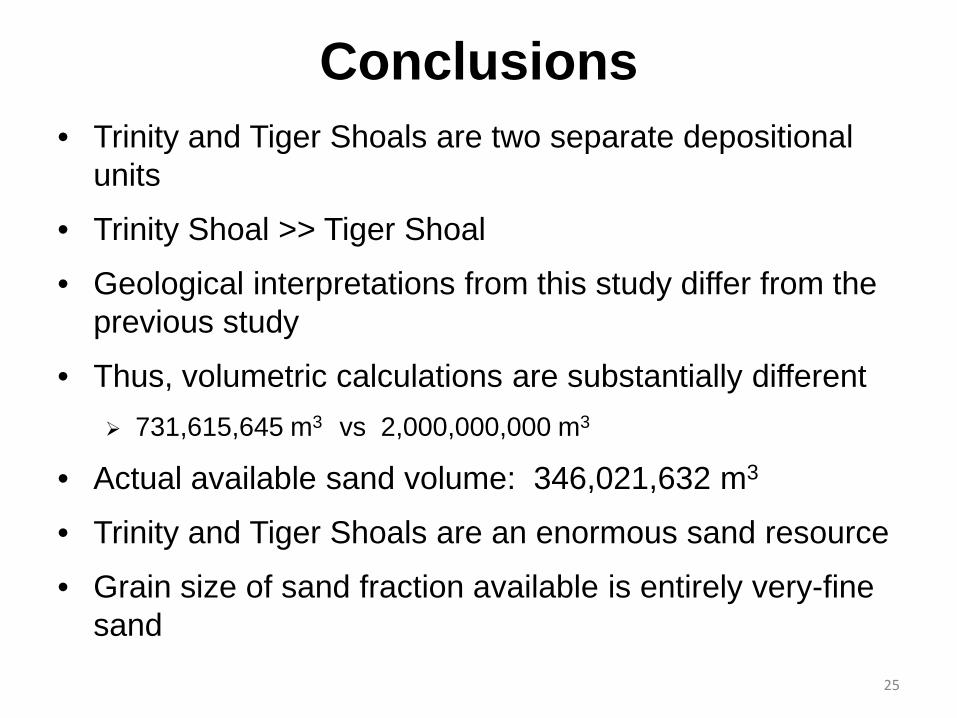
Conclusions • Trinity and Tiger Shoals are two separate depositional
units
• Trinity Shoal >> Tiger Shoal
• Geological interpretations from this study differ from the previous study
• Thus, volumetric calculations are substantially different 731,615,645 m3 vs 2,000,000,000 m3
• Actual available sand volume: 346,021,632 m3
• Trinity and Tiger Shoals are an enormous sand resource
• Grain size of sand fraction available is entirely very-fine sand
25
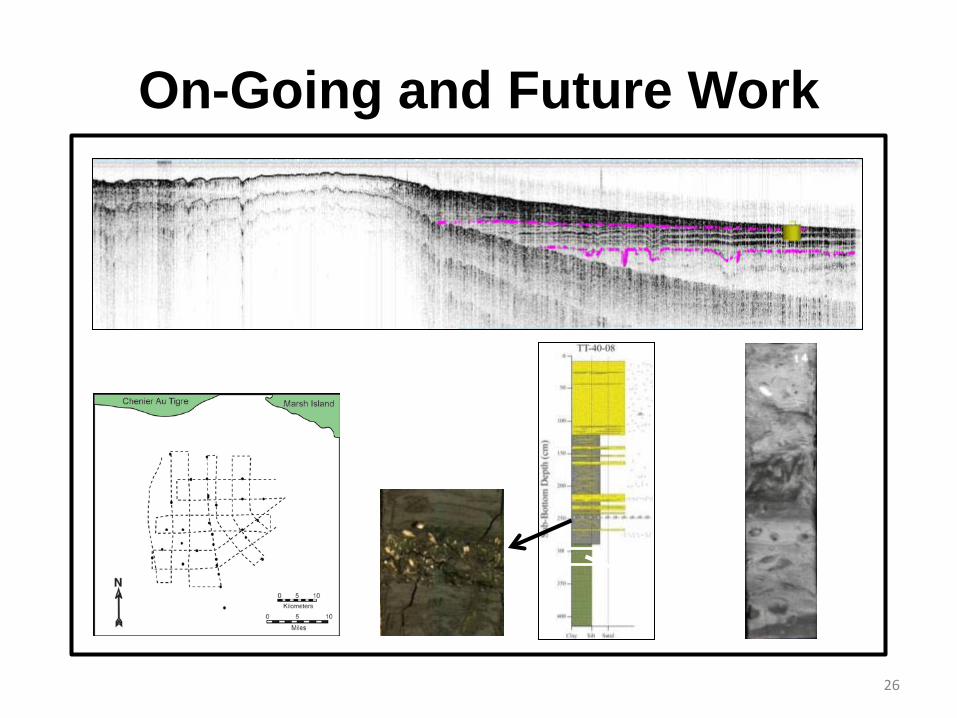
On-Going and Future Work
Forams
26
Acknowledgments • Bureau of Ocean Energy Management, Regulation & Enforcement • Louisiana Department of Natural Resources • Gulf Coast Association of Geological Societies, Geological Society
of America, ExxonMobil Corporation • Coastal Studies Institute Field Support Group
Chris Cleaver, Floyd De Mers, Darren Depew, Charlie Sibley, Eddie Weeks, Walker Winans
• Weeks Family for the use of their fishing camp • Mary Lee Eggart • Schlumberger • Department of Geology and Geophysics at LSU
Harrison Family Subsurface Laboratory • Drs. Fleix Jose and Baozhu Liu • Mark Kulp (University of New Orleans)
27

References Barras, J.A., D. Beville, S. Britsch, S. Hartley, J. Hawes, P. Johnston, Q. Kemp, A. Kinler, J. Martucci,
D. Porthouse, K. Reed, S. Roy, S. Sapkota, and J. Suhayda. 2003. Historical and projected coastal Louisiana land changes: 1978–2050. USGS Open File Report 03-334.
Barras, J.A., J.C. Bernier, and R.A. Morton. 2008, Land change in coastal Louisiana: A multidecadal perspective (from 1956 to 2006). U.S. Geological Survey Scientific Investigations Map 3019, Scale 1:250,000.
Blum, M.D. and H.H. Roberts. 2009. Drowning of the Mississippi Delta due to insufficient sediment supply and global sea-level rise. Nature Geoscience 2:488–491.
Britsch, L.D. and J.B. Dunbar. 1993. Land-loss rates—Louisiana coastal plain. Journal of Coastal Research 9:324–338.
Penland, S., R. Boyd, and J. R. Suter. 1988. Transgressive depositional systems of the Mississippi Delta Plain: A model for barrier shoreline and shelf sand development. Journal of Sedimentary Petrology 58:932–949.
Penland, S., D.L. Pope, R.A. McBride, J.R. Suter, and C.G. Groat. 1990. Assessment of sand resources in the Trinity Shoal area, Louisiana continental shelf. Louisiana Geological Survey, Cooperative Agreement Submitted to U.S. Minerals Management Service No. 14-12-0001-30387, 46 p.
Roberts, H.H. 1997. Dynamic changes of the Holocene Mississippi River Delta Plain: The delta cycle. Journal of Coastal Research 13:605–627.
Scruton, P.C. 1960. Delta building and the deltaic sequence. In: Trask, P.D., ed. Recent Sediments, Northwest Gulf of Mexico. Tulsa, Oklahoma: American Association of Petroleum Geologists. Pp. 82–102.
28