evaluation of the waterford early math - eric
TRANSCRIPT

1
EVALUATION OF THE
WATERFORD EARLY MATH & SCIENCE PROGRAM
FOR KINDERGARTEN:
First-Year Implementation in Five Urban
Low-Income Schools
STEPHEN POWERS, PH.D. and CONNIE PRICE-JOHNSON, M.A. CREATIVE RESEARCH ASSOCIATES
2030 E. BROADWAY, SUITE 221 TUCSON, ARIZONA 85719
(520) – 884-8667 [email protected]
MARCH 2007
2
ACKNOWLEDGEMENTS
We would like to express our appreciation to the Tucson Unified School District’s Office of Accountability and Research for their cooperation in retrieving relevant data from their database and for their expertise in merging and organizing the data for our analysis. This evaluation study would not be possible without their cooperation. Stephen Powers, Ph.D. and Connie Price-Johnson, M.A. Creative Research Associates, Inc.

3
ABSTRACT Evaluation of the Waterford Early Math & Science Program for Kindergarten: First-Year Implementation in Five Urban Low-Income Schools
Citation: Powers, P., & Price-Johnson, C. (2007). Evaluation of the Waterford Early Math & Science Program for Kindergarten: First-Year Implementation in Five Urban Low-Income Schools. Tucson, AZ: Creative Research Associates. Background: The Waterford Early Math & Science (WEMS) program is a comprehensive educational software program designed to build math and science skills and concepts in grades K-2, alone or to supplement existing curricula. The program’s capability to individualize lessons, assess and track student progress, and reteach lessons is aimed at keeping potentially “at risk” students at grade level. Purpose: The present evaluation of the Waterford Early Math & Science program is the first independent study of its effectiveness. Setting: The study was carried out in five low-income, largely Hispanic schools in the Tucson Unified School District during the 2005-06 school year. Study Sample: This report covers the 22 kindergartens (345 students) of a larger study of 59 K-2 classrooms (923 students) in the five schools. Intervention: Treatment classrooms were provided with four to six computers loaded with the Waterford Early Math & Science program. The teachers received initial and on-going training in its use and were instructed to give every student at least four 22-minute sessions on the program each week. Research Design: The study used an experimental design in which classrooms were assigned through a process of stratified random selection to the treatment (Waterford Math & Science program) or control group. Control or Comparison Condition: Control classrooms were to use the district curricula and any supplemental programs or educational software already in use, except for Waterford Early Math & Science. Data Collection and Analysis: Data collected included pretest data on student achievement in math and science in the fall, and posttest data on the same in the spring. The Stanford Achievement Test (SAT10 Form A, SESAT1 and SESAT2) provided the pre-post measures for math and the environment (science). Usage data stored in each computer provided the measure of exposure to the program. Usage was filtered at 1100 minutes corresponding to six months of 45 minutes a week in order to see program effects on student achievement. Statistical analyses included paired and independent sample t tests, analysis of covariance, and chi-square tests for non-parametric measures. Treatment and control groups were also analyzed by subgroups of gender, ethnicity, primary home language, English language learner (ELL) status, pretest achievement quartile, and by program dosage.

4
Classroom observations of a sample of treatment and control classrooms, focus groups of the treatment teachers, principal interviews and surveys of all treatment and control teachers provided data on the level of implementation of the program, equivalency of conditions, and attitudes toward various aspects of the program. Findings: The most significant findings were:
• Qualitative data showed the attitudes of the treatment classroom teachers and principals to be very favorable toward the program;
• The general level of implementation was as expected for first-year implementation, with moderately high use of the software and limited use of supplementary materials;
• WEMS students significantly outperformed the control students in math and the environment tests;
• Program effect sizes were moderate; • When compared with their counterparts in the control classes, the WEMS students made
significantly greater gains in math and the environment tests in the case of boys, girls, Hispanics, Spanish home language students, and ELL students;
• WEMS English home language students and English-proficient (non-ELL) students also made significantly higher gains in the environment test than their control counterparts;
• WEMS Spanish home language students and WEMS ELL students made greater gains than other WEMS and control students and scored above the national mean on both tests;
• Kindergartners at all levels of program usage made greater gains than the controls on both tests.
Native American, African American and white children showed greater gains in the WEMS classrooms than in the controls, but their samples were too small for results to be conclusive. Conclusion: The WEMS program appeared to benefit all children in kindergarten, particularly Hispanics, students whose primary home language was Spanish, and English language learners.

5
TABLE OF CONTENTS ACKNOWLEDGEMENTS............................................................................................................ 2 ABSTRACT.................................................................................................................................... 3 TABLE OF CONTENTS................................................................................................................ 5 TABLE OF TABLES ..................................................................................................................... 6 TABLE OF FIGURES.................................................................................................................... 7 I. BACKGROUND AND PURPOSE............................................................................................. 8
A. Background ............................................................................................................................ 8 B. Purpose of the study ............................................................................................................... 8
II. METHODS................................................................................................................................. 9 A. Study setting........................................................................................................................... 9 B. Description of the study population ....................................................................................... 9 C. Allocation to WEMS or control group................................................................................. 12 D. Description of the WEMS program ..................................................................................... 13 E. Outcome measures................................................................................................................ 16 F. Statistical methods ................................................................................................................ 19
III. RESULTS ............................................................................................................................... 19 A. Comparability of the WEMS and control groups ................................................................ 19 B. Fidelity of implementation of the WEMS program ............................................................. 23 C. Teacher and principal attitudes ............................................................................................ 25 D. Student achievement ............................................................................................................ 30
IV. DISCUSSION AND SUMMARY ......................................................................................... 52 A. Effectiveness of the WEMS program .................................................................................. 52 B. Generalizability of findings.................................................................................................. 54 C. Significance to educators ..................................................................................................... 54 D. Contributing factors to effectiveness ................................................................................... 56 E. Limitations of the study and suggestions for further research ............................................. 56
APPENDIX A TEACHER SURVEY .......................................................................................... 57 APPENDIX B COMMENTS FROM TEACHER SURVEYS .................................................... 61 REFERENCES ............................................................................................................................. 62

6
TABLE OF TABLES Table 1. School Demographics ..................................................................................................... 10 Table 2. School Ethnic Distribution 2004-05 ............................................................................... 11 Table 3. Distribution of WEMS and Control Classrooms ............................................................ 12 Table 4. Kindergarten Students in the WEMS Evaluation ........................................................... 13 Table 5. Distribution of Observed Classrooms............................................................................. 17 Table 6. Demographics of WEMS and Control Kindergarten Students....................................... 20 Table 7. Means for Kindergarten Teacher Experience and Instructional Hours .......................... 21 Table 8. Frequency of Key Instructional Methods in Math and Science...................................... 21 Table 9. Teacher Satisfaction with Student Progress and Engagement........................................ 22 Table 10. Level of WEMS Implementation in Kindergarten ....................................................... 25 Table 11. Usefulness of Various Components of the WEMS Program........................................ 27 Table 12. Teacher Satisfaction with the WEMS Program............................................................ 29 Table 13. Kindergarten Gains on the SAT10 Math Test by School ............................................. 31 Table 14. Kindergarten Gains on the SAT10 Environment Test by School................................. 32 Table 15. Kindergarten Gains on the SAT10 Math Test by School (Unfiltered) ......................... 34 Table 16. Kindergarten Gains on the SAT10 Environment Test by School (Unfiltered)............. 35 Table 17. ANCOVA and Effect Sizes on the SAT10 Math and Environment Tests (Filtered) ... 36 Table 18. Kindergartners on SAT10 Math and Environment Tests by Gender............................ 37 Table 19. Kindergartners on SAT10 Math and Environment Tests by Ethnic Group.................. 39 Table 20. Kindergartners on SAT10 Math Test by Ethnic Group................................................ 40 Table 21. Kindergartners on SAT10 Environment Test by Ethnic Group ................................... 41 Table 22. Kindergartners on SAT10 Math Test by Primary Home Language ............................. 42 Table 23. Kindergartners on SAT10 Environment Test by Primary Home Language................. 43 Table 24. Kindergartners on SAT10 Math and Environment Tests by ELL Status ..................... 46 Table 25. Kindergartners on the SAT10 Math Test by Achievement Quartile ............................ 48 Table 26. Kindergartners on the SAT10 Environment Test by Achievement Quartile................ 49 Table 27. Correlations of WEMS Usage and Achievement Gains............................................... 50 Table 28. Kindergarten Students on the SAT10 Math and Environment Tests by
WEMS Usage Quartile .................................................................................................. 51

7
TABLE OF FIGURES Figure 1. Percentages of ELL and Non-ELL (English-Proficient) Students by School ............... 11 Figure 2. Ethnic Composition of Schools 2004-05....................................................................... 11 Figure 3. Kindergarten SAT10 Math Gains.................................................................................. 32 Figure 4. Kindergarten SAT10 Environment Gains ..................................................................... 33 Figure 5. Kindergarten Program Effect Size................................................................................. 36 Figure 6. Kindergarten SAT10 Gains for Boys ............................................................................ 38 Figure 7. Kindergarten SAT10 Gains for Girls ............................................................................ 38 Figure 8. Kindergarten SAT10 Math Gains by Ethnicity ............................................................. 40 Figure 9. Kindergarten SAT10 Environment Gains by Ethnicity................................................. 41 Figure 10. Kindergarten SAT10 Math Gains by Primary Home Language ................................. 43 Figure 11. Kindergarten SAT10 Environment Gains by Primary Home Language..................... 44 Figure 12. Kindergarten SAT10 Math Pre-Posttest Scores by Primary Home Language............ 44 Figure 13. Kindergarten SAT10 Environment Pre-Posttest Scores by Primary Home
Language..................................................................................................................... 45 Figure 14. Kindergarten SAT10 Math Gains by ELL Status........................................................ 45 Figure 15. Kindergarten SAT10 Environment Gains by ELL Status ........................................... 46 Figure 16. Kindergarten SAT10 Math Pre-Posttest Scores by ELL Status .................................. 47 Figure 17. Kindergarten SAT10 Environment Pre-Posttest Scores by ELL Status...................... 47 Figure 18. Kindergarten SAT10 Math Scores by Usage Level .................................................... 50 Figure 19. Kindergarten SAT10 Environment Scores by Usage Level........................................ 51

8
I. BACKGROUND AND PURPOSE A. Background 1. Description of the Waterford Early Math & Science program The non-profit Waterford Institute developed Waterford Early Math & Science (WEMS) as a sequential, comprehensive educational software program designed to build a strong base in math and science in the earliest school years by taking advantage of the unique qualities of technology. Three levels, each containing a year’s worth of content, are to be used in kindergarten through Grade 2. The WEMS program was specifically designed for intervention with potentially “at risk” students in the years before the achievement gap widens to leave them behind. Key concepts behind its development are that technology can engage students in a non-threatening way, individualize instruction to meet each student’s pace and needs, track student progress, assess student skills, integrate math and science, and balance the practice of basic skills with math and science concepts. In addition to a student’s daily sessions on the computer, WEMS provides teachers with supplementary materials for classroom use and to send home with the students in order to integrate classroom and home learning.
2. Rationale The Waterford Institute sought to combine best practices in elementary math and science education with software advances and recent research in order to construct a program that was educationally sound, interesting to children, easy for teachers to manage, and aligned with state and national standards. The developers consulted national texts, national and state standards, experienced educators and software engineers, and the standards espoused by the National Council of Teachers of Mathematics (NCTM) and other professional organizations. 3. History of the WEMS Program WEMS was built on the general model of the Waterford Early Reading Program (WERP), a sequential reading software program in use since 1995 and now utilized in over 10,000 sites nationally. Level 1 of WEMS for kindergarten was launched in 2001. 4. Previous related studies The present study is the first major evaluation of the WEMS program. Studies of WERP, a similar educational software product, by Tracey (2000), Walberg (2001), Cope and Cummings (2001), Hecht and Close (2002) and Cassady and Smith (2005) found positive gains in achievement with the greatest gains for the lowest-achieving third of students and students of limited English proficiency. A study of the WERP in 27 Tucson kindergartens by Powers and Price-Johnson (2006) showed consistently positive gains in reading achievement for all subgoups. These gains increased as usage increased. B. Purpose of the study 1. Research questions The goal of the study was to evaluate the effectiveness of the WEMS program on achievement of children in kindergarten in five low-income area schools of the Tucson Unified School District (TUSD). The principal research questions were:

9
1. What are the attitudes of teachers and principals using the WEMS program toward various aspects of the program? 2. What are the effects of the WEMS program on academic achievement of students in kindergarten?
The study was conducted during the school year of 2005-2006.
2. Importance to educators The WEMS program proposes to raise student achievement in math and science in the early grades and build a foundation for later learning by harnessing the capabilities of computer technology. This has very important implications for schools in low-income areas that have historically lagged academically, especially as schools are called upon to be accountable for student progress as they meet the challenge of a diverse student population with limited English skills. At the same time, schools that are considering incorporating WEMS into their curriculum may be hesitant to spend money on the program with no independent evaluation of what students, under what conditions, might benefit from its use. This study proposes to address these questions.
II. METHODS A. Study setting The study was carried out during the 2005-06 school year in 22 kindergarten classrooms in five Tucson low-income schools located in the southwestern quadrant of the city. This evaluation was part of a larger study involving grades K-2 in the same schools. B. Description of the study population 1. Selection of the study group The Tucson Unified School District was chosen as the study site because it represented a large school district in an urban area with a large Hispanic and non-English speaking population. The study grew out of an initiative on the part of three Tucson elementary principals to use educational technology to help raise student achievement and meet the requirements of their School Improvement Plans (SIPs). Contact with representatives of Pearson Digital Learning led to the installation of the Waterford Early Reading Program (WERP) in 14 district schools and the WEMS program in six schools. In five of the schools with the WEMS program, the principals were willing for a random selection of about half their kindergarten classes to have the WEMS program with the remaining classes serving as controls in order to better evaluate the effectiveness of the program. The process of allocation to the treatment and control groups is discussed below (see the Allocation to WEMS or Control Group section). 2. Number of classrooms and participants Twenty-two kindergartens (13 WEMS and 9 controls) were included in the study. Enrollment in the kindergarten treatment and control classes was 394 in September of 2005. During the course of the school year, a total of 441 kindergarten students participated (see Table 6 for descriptive statistics of the sample), including transfers in and out. Statistical analyses of student achievement scores were conducted on 345 kindergarteners (204 WEMS and 141 controls) who

10
had paired pre and posttests for math and 338 kindergarteners (199 WEMS and 139 controls) who completed both tests for the environment. 3. Description of the schools The five schools in the study were among the 15 schools with the highest number of students on free/reduced lunch status and were in the largely Hispanic southwestern quadrant of the city. All the schools had higher than district-wide rates of students on free or reduced lunch (66.2%) and English language learners (11.2%; see Table 1 and Figure 1).
• School A is built on a hill with magnificent views and serves the New Pascua Yaqui village on the far southwest side of town. This school has the fewest English language learners (16.0%; several students speak Yoeme, the Yaqui language), the lowest percentage of students receiving free or reduced lunches (88.5%), the lowest percentage of Hispanic students (44%) and the highest of Native Americans (50.3%).
• School B, built in 1940, is one of the older elementary schools in the district. It is situated in a fairly stable Hispanic neighborhood near downtown. It has the smallest number of kindergartners and the highest percentage of Hispanic students (94.1%).
• School C is located in one of the first planned neighborhoods in the country, established in the early 1950s. It has the highest number of Asian American students (4.2%) and the highest rate of students receiving free or reduced lunches (98.3%).
• School D is the largest school and has the lowest stability rate (81.4%), highest mobility rate (49.1%), and highest rate of English language learners (49.0%). Most of the students live in low-rent apartments. The student population is 14.3% African American, which includes about 40 refugee Somali students.
• School E is located in a traditionally Hispanic neighborhood and has the highest stability (86.9%) and lowest mobility (39.1%) rates of the five schools. A new building was constructed in 1994 on the same site as an older school.
Table 1 presents the total enrollment of each school at the end of the previous school year, the enrollment of the kindergarten classes in the study as of September 2005, the school-wide percentage of students receiving free or reduced-price lunches, and the school-wide percentage of English language learner (ELL) students.
Table 1. School Demographics
School enrollment May 2005
Kindergarten enrollment 2005-06
Students with free/reduced
lunch*
English language learners*
School A 388 109 88.5% 16.0% School B 321 57 90.6% 39.2% School C 353 70 98.3% 22.5% School D 596 106 97.5% 49.0% School E 520 99 92.6% 29.1% District 66.2% 11.2%
Note. *From Tucson Unified School District Department of Accountability & Research School Profiles and ELL Count and Percentage (n.d.b).

11
Figure 1. Percentages of ELL and Non-ELL (English-Proficient) Students by School
16.0%39.2%
22.5%
49.0%29.1%
84.0%60.8%
77.5%
51.0%70.9%
88.8%
11.2%0%
25%
50%
75%
100%
School A School B School C School D School E District
Non-ELLELL
Ethnicity Table 2 presents the ethnic distribution of the general student population at each school. Of note is the Native American population at School A, the Asian American population at School C, and the African American population at School D (which included a number of immigrant students). Table 2. School Ethnic Distribution 2004-05 African
American (n) %
Asian American
(n) %
Hispanic
(n) %
Native American
(n) %
White (n) %
School A (4) 1.0% (1) 0.3% (172) 44.3% (195) 50.3% (16) 4.1% School B (0) 0% (1) 0.3% (302) 94.1% (13) 4.0% (5) 1.6% School C (30) 8.5% (15) 4.2% (278) 78.8% (16) 4.5% (14) 4.0% School D (85) 14.3% (6) 1.0% (476) 79.9% (3) 0.5% (26) 4.4% School E (2) 0.4% (1) 0.2% (488) 93.8% (19) 3.6% (10) 5.2% District (2025) 6.7% (772) 2.5% (17,074) 56.2% (1368) 4.5% (9124) 30.0%
Note. From Tucson Unified School District Office of Accountability & Research School Profiles. Figure 2. Ethnic Composition of Schools 2004-05
0% 20% 40% 60% 80% 100%
Dist. Average
School E
School D
School C
School B
School A
African Am.AsianHispanicNative Am.White

12
Academic achievement The five schools in the study historically scored below the district, state and national means on standardized tests. However, a School Quality Survey in 2004-05 (TUSD, n.d.b) of certified and classified staff on various topics of school climate and instruction indicated that teachers at the five schools studied generally felt that the existing math program was strong (87.6%), as was student access to computer technology (87.6%), but their satisfaction with the science program was somewhat weaker (61.4%). Teachers were generally very satisfied with their school. Overall, the examination of demographic data indicated that the schools in the study had more in common with each other than with the district average. C. Allocation to WEMS or control group 1. Process of allocation Classrooms at each of the five schools were assigned to the treatment or control group through a public process of stratified random selection during the week before classes started (August 2005) and after students had been assigned to their classes. The Pearson representative took a black plastic top hat to each school and placed in it the names of all the kindergarten teachers. As the representative held the hat high, someone from the school, usually the principal, reached in and randomly pulled out half of the teachers’ names one by one. If there were an uneven number of kindergarten classrooms, the principal would pull half of the number of classrooms plus one additional name (e.g., if there were five kindergarten teachers, three names would be selected from the hat to be the WEMS teachers). Thirteen kindergarten classes were selected to implement the WEMS program. The nine teachers whose names were not selected became the control group teachers. Table 3 presents the distribution of the WEMS and control classes at each school. Table 3. Distribution of WEMS and Control Classrooms
WEMS Classrooms
Control Classrooms
Total
School A 3 2 5 School B 2 1 3 School C 2 1 3 School D 3 3 6 School E 3 2 5 Total 13 9 22
2. Attrition and changes in allocation Kindergarten enrollment in the five schools was 441 for all students enrolled at any time during the school year. In October, 384 students took the SAT10 pretest, and 417 took the posttest in May. Only students for whom both pre and posttest scores were available were included in the study. Thus, the final sample was composed of 345 students (204 WEMS and 141 controls) for the math test and 338 students (199 WEMS and 139 controls) for the environment test. The discrepancy in sample sizes across the two tests occurred because Harcourt instructions allow for the tests to be given in sections or on different days if required by the school schedule.

13
3. Intent-to-treat (Unfiltered) Researchers have advocated analyzing the entire sample of randomized subjects, regardless of the amount of exposure to the intervention (Ellenberg, 1996; Lachin, 2000; Torgerson & Torgerson, 2003; Little & Yau, 1996) called an intent-to-treat (ITT) design. These individuals have cautioned against analyzing a subset of a sample because of the risk of introducing potential bias or confounds. In addition, they argue that the ITT analysis has greater power than the subset analyses. Based on these recommendations, the present study analyzed the ITT group (unfiltered) and a subset of those students with 1100 minutes of more of program usage (filtered). The ITT group for the present study was composed of all students with both a pretest and posttest. 4. Filtering by attendance The gains of all of the WEMS and control students with 90 days or more of attendance were compared. This criterion eliminated students from both groups who had poor attendance. However, only three students in the WEMS group and four students in the control group were excluded due to limited attendance (see Table 4). Accordingly, results were nearly identical to those obtained under the intent-to-treat conditions, (i.e., all students with both a pretest and posttest). Thus, tables of these results are not presented. 5. Filtering by usage level Filtering of usage of the WEMS program at 1100 minutes reduced the size of the treatment group from a total of 204 students to 150. The filtering procedure was used in order to provide a clearer examination of the effects of the program on student achievement, based on a minimal exposure of 15 minutes a day three times a week over a period of six months (1080 minutes) rounded to 1100. This filtered level of product use was below the dosage of 22 minutes a day four days a week for nine months that the teachers were asked to schedule for the purpose of the study. Table 4 summarizes the effect of filtering on the study population. Table 4. Kindergarten Students in the WEMS Evaluation
Group Total
Enrolled Pre-Posttest (Unfiltered)
Filtered for 90 Days Attendance
Filtered for 1100 Minutes
WEMS 261 204 201 150 Control 180 141 137 141 Total 441 345 338 291
Note. Students in the control group did not use WEMS and could not be filtered by product usage. D. Description of the WEMS program 1. Purpose and components Waterford Early Math & Science program for K-2 is a comprehensive, sequential educational software program that covers a year’s curriculum in each of three levels. The non-profit Waterford Institute developed the program to improve education through the use of technology; Pearson Digital Learning markets it and provides training and technical support. Level 1 for kindergarten was published in 2001.

14
Objectives at each of the three levels address number concepts, whole number operations, problem solving, patterns and comparison, geometry and spatial sense, measurement/ time/money, and fractions. Science objectives cover scientists, science skills, life skills, earth science, physical science and health. In each session the student participates in several activities which vary by length and sequence. For example, in kindergarten, students may see a daily number song, math warm-up, calendar activity, skill for the day, science show, number lesson, and session of play and practice. If a student does not pass the assessment with an 80%, the concept is reintroduced after several days in a review until the child masters the skill. Music and multi-media reinforce the learning by engaging audio and visual parts of the brain to form stronger and more retrievable memories (Fagan, Prigot, Carroll, Pioli, Stein & Franco, 1997, as cited in Waterford, n.d.b) Supplemental materials included student take-home materials: sets of 29-43 books (depending on the level) about numbers, math concepts and science, and three to four videos including at least one math music video, one science music video and a science experiment video. The purpose of these materials was to involve parents in math and science activities with their children. The supplemental materials also included teacher materials: a teacher’s guide and songbook, teacher copies of the student books and take-home videos, worksheet masters, performance assessments, song CDs and cassettes, and an online tutorial. 2. Research basis for the WEMS program In developing the program, Waterford educators and software professionals reviewed research regarding theories in child development, the cognitive capabilities of young children, national and state standards including those set by NCTM and National Science Education Standards (NSES), and a review of current math and science texts. The following research findings laid the basis for the WEMS program: • Children are ready to learn number skills and concepts by kindergarten (Osborne & Lindsey,
1967; Meyers & Dingman, 1960, as cited in Waterford, n.d.b), and this early instruction can have an impact on math achievement in later years (Horton, 1996; Clay, 1980, as cited in Waterford, n.d.b).
• Good technology is integrated with classroom activities. The NCTM states that, “Technology
is essential in the teaching and learning of mathematics; it influences the mathematics that is taught and enhances student learning” (NCTM, 2000 cited in Waterford, n.d.a). Software provides individualization, remediation and tracking of student progress effortlessly. It gives students immediate feedback on correct/incorrect answers, allows them to explore number relationships with an orientation toward discovery, and is endlessly patient with repeated practice.
• Sessions for each student should be individualized, short, and frequent over the course of the
school year. Waterford authors cite Geary (1994) that practice “should occur in small doses (about 20 minutes a day) and over an extended period of time” (Waterford, n.d.a).
• Varied presentation and modalities, student interest, and frequent review and assessment are
all necessary for students to learn new concepts and move memories from short-term to long-

15
term (Rollee-Cover, 1995; National Academy of Sciences, 1995; Charlesworth & Lind, 1999; Harlan & Rivkin, 1996, as cited in Waterford, n.d.b). In the WEMS program, a sequencer manages daily instruction and assessment and includes an automated review to counteract decay of students’ short-term memory and ensure that the newly acquired knowledge and skills are encoded into their long-term memory. The sequencer also provides remediation by presenting easier, related material as a review before proceeding with the new objective. Songs introduce another modality in the learning process and aid long-term memory.
• Family involvement plays an important role in math achievement. Waterford authors cite
Campbell (1996) and Henderson and Berla (1994) to the effect that family involvement is closely related to academic achievement including math (Waterford, n.d.a). The WEMS program uses math and science videotapes, books, newsletters of student progress, and worksheets to extend instruction to the home.
• Math instruction should combine math concepts and drill. Conceptual math emphasizes the
meaning of operations, calculators, mental computation, estimation and thinking strategies; also geometric relationships, measurement and spatial sense (Haugland, 1992, as cited in Waterford, n.d.b). At the same time, basic skills must be practiced until they are memorized (Briars & Seigler, 1994, as cited in Waterford, n.d.b).
• Complementing math with science allows the students to enrich their math skills in real-life
science situations (Tolman & Hardy, 1995, as cited in Waterford, n.d.b). Science is best learned through active manipulation and observation, but a full science program also gives students background information and guidance to interpret what they have seen and done. Science also teaches scientific inquiry and significant people from history such as Jane Goodall, George Washington Carver, and the Wright brothers.
Additional information on the Waterford Institute and the WEMS program is available at www.waterford.org and www.pearsondigital.com. 3. Implementation of the WEMS program Training Four to six computers in each of the experimental classrooms were loaded with the WEMS program. Teachers received six hours of initial training from Pearson staff and one or two additional two hour sessions during the school year. Usually teachers were trained as a group, except at School B, where they were trained individually in the classroom after the computers were installed. Training covered the history and purpose of the WEMS program, an overview of content, setting up the class and group lists for rotations, setting the length of time for each session, managing the rotations, and taking student pictures. Follow-up sessions covered printing class summary reports, assigning activities to align with the local curriculum, and other topics of interest to the teachers. During the year Pearson staff maintained constant communication with the schools and the district and were able to solve many technical issues and answer teachers’ questions.

16
Exposure to the program Teachers were asked to ensure that their students rotated using the computer throughout the school day in order for each student to receive at least four weekly sessions of 22 minutes each. The WEMS program was to be used to supplement the regularly scheduled math and science lessons using the district curriculum and materials. Monitoring fidelity of implementation Teachers were not monitored directly in their use of the WEMS program. Midyear observations carried out as part of this study offered a snapshot of use at that point and confirmed that teachers were using the program. Teachers self-reported their use of supplemental materials. Time spent on the program was extracted from the WEMS software at the end of the year and provided total minutes for each child. This gave a measure of exposure to the program. Control group Both WEMS and control classroom teachers taught the required district curriculum in math and science. Control teachers used any supplemental programs or materials already in use by the district, including any computer-based programs. E. Outcome measures Standardized national and district tests were used to determine student achievement. For kindergarten, the Stanford Achievement Tests (SAT10 Form A) was administered in the fall and the spring in order to provide a measure of student progress with a widely-used standardized test. In addition to tests, the researchers observed a sample of WEMS and control classrooms mid-year and surveyed WEMS and control teachers in the spring to observe the level of implementation of the program. Focus groups of the WEMS teachers and interviews with each of the principals at the five schools in the study were held in order to learn teachers’ and principals’ attitudes toward the program and learn of obstacles, challenges and successes. The observation checklist, survey, focus group questions and principal interview questions had been previously approved by Pearson Digital Learning and the Tucson Unified School District. 1. Stanford Achievement Test (SAT10) Stanford Achievement Test series, tenth edition (SAT10 Form A) is one of the oldest and most respected student achievement tests. This norm-referenced test typically reports scores in Normal Curve Equivalents (NCEs), national stanines and percentiles, expanded standard scores, and grade equivalents. This study used NCEs for analyses. One year of student progress typically results in a zero NCE gain. Students with NCE gains greater than zero are progressing at an accelerated rate. The SAT10 includes content that is closely aligned to standards-based national curricula, including the NCTM’s Principles and Standards for School Mathematics, National Research Council’s National Science Education Standards, American Association for the Advancement of Science’s Benchmarks for Science Literacy, and state academic standards. For the purposes of this study, the math and science (environment) tests were administered to the students in both the WEMS and control classrooms as a pretest (October 5-13, 2005) and posttest (May 1-12, 2006) by their classroom teachers. The versions administered were the Stanford

17
Early School Achievement Test (SESAT1 and SESAT2) for kindergarten as recommended by Harcourt Assessment for fall and spring assessments. The SESAT 1 and SESAT 2 tests have a multiple-choice format with 40 items per subtest (Harcourt, 2002). Students marked their answer directly in the testing booklet for the two subtests used (math and environment). In all cases, the children’s teacher or a familiar proctor administered the test in the classroom, and was instructed to give the posttest under the same conditions as the pretest was given. Forms are equated so that a score of 640 on one grade level indicates the same achievement as a score of 640 at another grade level (Harcourt, 2004). Validity and reliability Harcourt Assessment has conducted numerous tests to assess the validity and reliability of the SAT10 test. It has been evaluated for validity of test content, response processes, internal structure, relationships to other variables, convergent and discriminant analysis, test criterion relationships and consequences of testing. Reliability was tested for internal consistency using the KR20 test. KR20 reliability coefficients were 0.89 for math and 0.77 for environment for the SESAT 2 (Harcourt, 2004). Special populations The SAT10 was tested using students with disabilities and limited English proficiency students among the special populations. All versions and levels were reviewed by a panel to eliminate bias. Vertical scaling was carried out, in which students completed adjacent forms of the tests (for example, SESAT1 and SESAT2), with Pearson product correlations between adjacent tests in math and science (environment) ranging between 0.52 and 0.84. 2. Classroom observations Six WEMS and four control kindergarten classrooms were observed between November 2005 and January 2006 in order to identify potential differences between the two groups that might affect student achievement and also to observe how teachers were implementing the WEMS program. Seeing treatment and control classrooms firsthand was also essential to understanding the teachers’ opportunities and limitations in teaching math and science. The classes to be observed were selected by a modified process of stratified random selection: the names of all kindergarten teachers at a school were written on pieces of paper, and half of these were selected at random. A few changes were made to visit a balance of both treatment and control classrooms at each school. Table 5 shows the distribution of the kindergarten classrooms observed.
Table 5. Distribution of Observed Classrooms WEMS Control Total School A 2 1 3 School B 1 1 2 School C 1 0 1 School D 1 1 2 School E 1 1 2 Total 6 4 10

18
The Waterford Teachers Observation Checklist and Control Classroom Teachers Observation Checklist used during the classroom observations were designed largely on implementation checklists available from Pearson Digital Learning, including the Waterford Material Survey, Technology Beliefs and Competencies Survey, Waterford Classroom Observation Instrument, and Observation Checklist. The main issue that guided the development of the checklist involved assessing any potential differences, aside from the WEMS program, that may have existed between the treatment and control classrooms. Items addressed teaching methods, classroom organization and management, technology observable in the classroom, and teacher and student attitudes. Two open-ended questions were included in order to get general feedback from the teacher about the programs in use, to establish a friendly relationship with the teacher and to convey that the study concerned the WEMS program and not the quality of the teacher’s methods. The researcher usually observed the classrooms in the afternoon when most of the classes had math. Most observations lasted approximately 30 minutes. The quantitative results of the checklists were entered into a database in order to compare the treatment and control classrooms. 3. Teacher focus groups Focus groups with the teachers using the WEMS program were conducted to find out their attitudes and opinions about the program after using it for a year. Questions concerned: • Technical issues • Training and support • Implementation • Quality and effectiveness of the program • Student responses. Focus groups were held between April 5 and May 18, 2006. A focus group guide was created that used a structured format with open-ended questions. It was anticipated that broad, general questions would elicit the most comprehensive replies. In the five schools, 11 of the 13 WEMS kindergarten teachers attended the focus groups, in addition to a kindergarten resource teacher at one school. Participation for the kindergarten WEMS teachers was 84.6%. 4. Principal interviews All five principals were interviewed to find out their attitudes towards the WEMS program. The research questions and areas covered were generally the same as in the teacher focus groups and were conducted during the same time period (April 5-May 18, 2006). In addition, separate interviews were held with the instructional technology liaisons at Schools D and E. All focus groups and interviews were carried out on-site. 5. Teacher surveys The teacher survey addressed the research questions concerning implementation of the WEMS program and teachers’ attitudes toward the program. The survey also was intended to identify any differences between WEMS and control classrooms that might confound statistical analyses regarding the impact of the WEMS program on student achievement in the treatment and the control classrooms. In addition, the survey collected data on teachers’ experience, teaching practices and attitudes.
19
The survey was based on the Waterford Implementation Matrix of best practices and other surveys provided by Pearson Digital Learning such as the Observation Checklist, Classroom Management/Support, Teacher Survey, WERP Materials Survey, Technology Beliefs and Competencies Survey, Waterford Usage Survey and Waterford Classroom Observation Instrument. The first part of the survey (28 items) was completed by both WEMS and control teachers. It concerned teacher experience, teaching practices and classroom time dedicated to math and science, attitudes toward educational technology, teacher perceptions of student progress and engagement in math and science, and classroom support from teaching assistants and parents. The second part (38 items) was only completed by WEMS teachers and concerned the usefulness of the different elements of the program, the degree of implementation and teacher satisfaction. Each part of the survey asked for teacher comments about math and science in their classroom. All 22 kindergarten teachers completed the survey between April 3 and June 7, 2006. F. Statistical methods Quantitative data came from the teacher surveys and tests of student achievement. Survey data was analyzed using independent samples t tests to identify any statistically significant differences between the WEMS and control group teachers regarding their professional preparation, experience, teaching methods, and familiarity and use of educational technology. Normal curve equivalents (NCEs) were used for the analyses of the SAT10. NCEs are obtained by converting percentiles to normalized z-scores. They provide an equal-interval scale as opposed to percentile ranks and can therefore be averaged. They also allow for easy comparison with the national mean NCE score (50.0, standard deviation 21.06). The student achievement tests were analyzed with paired and independent samples t tests to determine if student gains pre to posttest were statistically significant, and if the WEMS and control students differed in their gains. Where the groups differed significantly on the pretest scores, their posttest scores were adjusted using an analysis of covariance (ANCOVA). Various subgroups were also analyzed to see if program effects differed by gender, ethnicity, primary home language, English language learner (ELL) status, achievement on the pretest, and exposure to the program.
III. RESULTS
A. Comparability of the WEMS and control groups The student populations and teacher conditions and attitudes in the WEMS and control classes were compared to determine if differences between the groups other than the WEMS program might account for changes in student achievement. 1. Similarity of student demographics As the selection of WEMS and control classrooms at each school was random, it was expected that students in the WEMS and control classes would be similar. The chi-square tests of independence presented in Table 6, which presents a summary of the demographics of the WEMS and control kindergarten groups, support this hypothesis.

20
Table 6. Demographics of WEMS and Control Kindergarten Students WEMS Control
n % n % p Gender Male 124 47.5 93 51.7 Female 137 52.5 87 48.3 .223
Ethnicity African American 8 3.1 9 5.0 Asian 7 2.7 1 0.6 Hispanic 189 72.4 128 71.1 .088 Native American 47 18.0 27 15.0 White 10 3.8 15 8.3 ELL ELL 111 42.5 67 37.2 Not ELL 150 57.5 113 62.8 .154
Primary Home Language English 137 52.5 107 59.4 Spanish 116 44.4 69 38.3 .340 Other 8 3.1 4 2.2
Note. p = probability of a chi-square test of independence of the WEMS and control groups. N = 441. 2. Comparison of the WEMS and control classrooms Researchers observed classrooms and surveyed WEMS and control teachers to determine if any discrepancies in attitudes or methods might lead to differences in student achievement apart from the WEMS program. With only 13 WEMS teachers and 10 control teachers (one control class had two teachers), this group was too small to analyze in terms of statistical significance. Curricula All classrooms in the observation sample adhered to district math and science curricula, which were based on the state standards. Teachers used a Scott Foresman math text, but skipped around in order to teach to the local curriculum. For science, schools used FOSS Kits, experiential kits of materials that explore a given topic. The uniformity in curricula was confirmed by teacher statements during the focus groups and in the surveys, and by the principals. Teacher education, experience and teaching methods The survey of WEMS and control teacher indicated that the WEMS kindergarten teachers had a somewhat higher educational level than the control kindergarten teachers. Forty-eight percent of WEMS teachers had a Master’s degree or higher, as compared to 40.9% of the control teachers. WEMS teachers also had, on average, 3.5 years more experience than control teachers. The number of classroom hours that teachers devoted to math and science instruction and activities differed little between the two groups. Control teachers reported that they spent somewhat more time on math activities than WEMS teachers, but about an hour less on science. Table 7 shows the mean values of teacher experience and the number of instructional hours students spent in all math and science activities.

21
Table 7. Means for Kindergarten Teacher Experience and Instructional Hours Item WEMS Control Years teaching 15.85 12.33 Year teaching present grade 10.10 6.50 Hours math activities weekly 5.08 5.80 Hours science activities weekly 4.00 3.04 The WEMS and control teachers were compared with respect to a variety of instructional strategies for math and science and the frequency with which they used them. These strategies included giving math or science homework, sending home materials for parents to use with their children, assigning individualized tasks, evaluating progress, and using songs, hands-on activities (e.g., science experiments or manipulatives), and cooperative learning. Both WEMS and control group kindergarten teachers showed a clear preference for on hands-on activities and cooperative learning, with a lesser emphasis on integrating music into the math or science lesson. Numbers were too small to permit analysis for statistical significance. Table 8 shows the responses of most interest regarding instructional strategies. Table 8. Frequency of Key Instructional Methods in Math and Science
Item WEMS Control Hands-on math or science activities 3-5 times a week 61.5% 60.0% Cooperative learning in math or science activities 3-5 times a week 53.8% 60.0% Music or songs with math or science lesson 3-5 times a week 30.8% 50.0% All classrooms had four to six computers for student use loaded with the Waterford Early Reading Program (WERP) and other educational software, so both WEMS and control teachers rotated students through computer sessions throughout the day. Classroom observations during math showed that teachers organized computer rotations in various ways: In some classes, students were working on the either the reading or the math program during the math lesson, in others they started on the computers when they went to their tables for independent work, and in others students did not use the computers at all during the math lesson. There did not seem to be any difference between the WEMS and control classes in how the teacher managed the rotations. Attitudes toward technology Teacher attitudes toward educational technology were investigated to see if differences between the WEMS and control teachers might explain differences in student achievement. Surveys and observations showed that both WEMS and control teachers regarded educational technology favorably and commonly had computers, electronic audiovisual equipment and an overhead projector in the classroom. The two groups answered survey questions about their attitudes toward technology using a Likert scale from 1 (“Strongly disagree”) to 5 (“Strongly agree”). Items concerned how useful computers were for motivating students, maximizing teacher instructional time, individualizing instruction, keeping records, finding resources, and developing student materials. Other items concerned how comfortable teachers felt dealing with classroom computer problems and assigning computer-based math and science lessons. Two items (“Content knowledge is more important in this grade than computer skills” and “Using computers for instruction creates an

22
additional burden for teachers”) were recoded so that a positive response represented an attitude favorable to computer use. An overall measure of attitude toward technology was calculated with the WEMS teachers’ (M = 3.29) reporting slight more favorable attitudes towards technology than control teachers (M = 3.51). Although it is possible that this difference reflects a pre-existing attitude more favorable to technology on the part of the WEMS teachers, it is also possible that it reflects teachers’ current experience with the software at hand. Support in the classroom Support for the kindergarten teachers was examined for the two groups to determine if one group had more support from a teaching assistant (TA) or parent volunteers than the other. Sixty-nine percent of the WEMS and 80.0% of the control teachers had a TA, with hours per week ranging from 1 to 30, with a mean of 13.7 hours per week for the WEMS classrooms and 11.29 hours for the control classrooms. Satisfaction with student progress Both groups of teachers were largely satisfied with their students’ progress in math and science, and felt that their students were engaged when participating in math and science activities. Table 9 indicates their mean responses to survey items 23-26 on a 5-point scale (1 = very dissatisfied/disengaged, 5 = very satisfied/engaged).
Table 9. Teacher Satisfaction with Student Progress and Engagement Item WEMS Control Mean satisfaction with student progress in math 3.69 3.70 Mean satisfaction with student progress in science 3.38 3.11 Mean estimate of student engagement in math 4.15 4.20 Mean estimate of student engagement in science 4.00 4.00
Note. WEMS K teachers n = 13; control K teachers n = 10 (one control classroom had two team teachers). In summary, survey results indicated that student characteristics, curriculum and instructional methods were similar in the WEMS and control kindergarten classes. WEMS kindergarten teachers had somewhat more education, more experience and more favorable attitudes toward classroom technology than control teachers. They also taught about an hour more science each week and had more TA hours. On the other hand, the control teachers taught more math each week. Because of the small sample of kindergarten teachers, these differences could not be analyzed for statistical significance. 3. Confounding factors All teachers using the WEMS and the Waterford Early Reading Program (WERP) received joint initial training of six hours, in which they had some exposure to both programs. Therefore control kindergarten teachers had brief exposure to the WEMS program at this time, but children in their classrooms did not use the computers. A few teachers sent home student books and videos with students. There was no way to guarantee that any siblings or friends in control classrooms did not see these materials.

23
B. Fidelity of implementation of the WEMS program 1. Completeness of implementation Fidelity of implementation in this evaluation concerned the degree of exposure to the computer software and the use of the various components of the program, including those involving parents. The classroom observations, teacher focus groups, principal interviews and teacher surveys all addressed this question. The degree of exposure to the program was affected by technical issues and the ability of the teacher to complete the rotations within the class schedule. The extent to which other components of the program were used depended on their availability to the teachers and teacher confidence in using them. The WEMS teachers were asked to put all of their students on the WEMS Level 1 program for 22 minutes a session and four sessions a week. Technical issues Predictably, problems were more common at start-up and then declined sharply, but some technical issues continued to plague certain schools throughout the year. These included server malfunctions, power outages, problems logging on, screens blacking out, problems with sound, and student sessions ending abruptly. • Schools that had a technical person on-site who was present at the first training session
(Schools D and E) were able to solve technical problems more speedily than the other schools.
• At School D several teachers had yearlong problems with starting up each day, printing,
permanently deleting students and sporadic problems with image resolution. • At School C the initial set up went well, but later problems came up with the headphones and
with computers not recognizing the master. Four computers were stolen during the school year, reducing the number of computers available to students and hindering the rotations.
• School B came on late after school started, complicating both technical and implementation
issues, especially in kindergarten. Some problems teachers faced included lice in the headphones, inadequate computer memory, and problems with the sound cards. Kindergarten students would eat the headsets and nibble the wires.
• At School A teachers had to wait two weeks for the program to be installed, and then
teachers had problems starting up each day and getting the children’s pictures on. The school had repeated power outages and computer crashes, and the server was down for about two months in March and April. When the server came back on they had to input the student information all over again and start students back at the beginning of the year. One or two teachers had problems with garbled sound toward the beginning of the program, and screens that blacked out.
In spite of these problems, the instructional technology liaisons and principals considered the technical issues were to be well within what they expected with a new program and with problems previously experienced in their computer labs.

24
Rotations Principals reported that the teachers assigned the WEMS program came on board easily, although teachers who had already started their class routines before the program was set up in their classrooms took one or two weeks to start using it. In the observed WEMS classrooms, class lists and children’s photos were loaded. Children went readily to the computer when called, generally stayed on task at the station, and tapped the following student in an orderly and unobtrusive way. Almost all teachers found it hard to get through the WEMS rotations each day. All the kindergarten teachers were also doing rotations of the Waterford Early Reading Program, and other classes had other computer-based supplementary programs. Because of the high priority given to reading, teachers finished any computer reading rotations before beginning with math. The teachers who were able to get through the rotations of both programs started the children on the computers at the beginning of the day regardless of school policy and rotated them even through outdoor time. The question of putting students on the computers during whole-class reading time prompted lively discussion. One teacher put the high-functioning students on the computers at the beginning of this time. Another teacher said, “With the interventions and other things, the whole group is never with me anyway, so I may as well have them on the computers.” Teachers modified the implementation design according to their students’ needs. Several of the kindergarten teachers reported to the researcher that they cut session time from 22 to 15 minutes. Supplementary materials A best practice model for implementation included assigning activities to individualize a student’s computer time, using lessons from the teacher guide, printing class summary reports weekly, using worksheets, and sending home books and videos with the students in addition to the class rotations. However, no party involved with the study expected this level of implementation in the first year of a new program. The supplementary materials including the teacher resource crate were used at some schools to a limited degree. These materials were delivered to the teachers in late November and early December. Teachers reported mid-year that many homes had DVD players, not VCRs. One teacher sent home the books with students on a library check-out system; another teacher arranged the books on a shelf under each child’s name. The other teachers either had the books on shelves or still in the boxes when classes were observed between November and January. Some teachers showed the videos and had the books available to the students to read in class. At Schools A and D they were not used at all but saved for use in 2006-07. The survey of the WEMS teachers concerned the usefulness of the WEMS program, level of implementation of the supplementary materials, degree of support, use of the student take-home materials, and how teachers were using the materials to meet individual needs and to involve parents. It also assessed how satisfied they were with the program. In the survey, teachers were asked how often they used the various supplementary elements of the program. It was not expected that they would be able to use all of the supplementary

25
materials in the first year as they learned how to manage the program. Table 10 summarizes these responses.
Table 10. Level of WEMS Implementation in Kindergarten
How often do you . . . . .?
Not yet
As needed
1-2 times a month
1-2 times a week
3-5 times a week
Print class summary reports 0 6 3 3 0 Print individual reports 2 9 1 0 0 Assign activities to correlate w/ curriculum 5 5 2 0 0 Use take-home student materials in class 6 4 1 0 1 Use the supplemental teacher resource crate 6 4 1 1 0 Play WEMS videos/DVDs in class 5 5 1 1 0 Demonstrate WEMS activities on the computer 5 7 0 0 0 Refer to the overview booklet 7 5 0 0 0 Refer to the getting started guide 8 3 1 0 0 Print and send home certificates 3 5 1 1 2 Sing WEMS songs/play music in class 4 4 2 2 0
Note. n = 12; One WEMS teacher did not complete this section of the survey. These survey items addressed the use of the WEMS materials to determine the level of: 1) parental involvement, particularly through the use of the student take-home materials, and 2) individualization of instruction, particularly though the use of summary reports. Half of the kindergarten teachers indicated they had sent some of the materials home. In general, teachers appeared to utilize the supplementary materials as needed. 2. Other non-intervention services used in the WEMS and control classrooms In two of the schools (School E and School D), a supplementary math software (SuccessMaker) was used in the control classrooms. At School D they also used Fast Math, a computer-based program for drill. Other educational software programs in use were the Waterford Early Reading Program (all kindergartens), KnowledgeBox, Leapfrog, and Starfall. At School A, a new highly-structured math implementation was started in the 2005-06 school year, in which teachers determined exactly when, how and how long each objective in the district curriculum would be taught. Thus all kindergarten classrooms on a given day were doing the same math lesson. C. Teacher and principal attitudes Focus groups, interviews, conversations with the teachers during class observations, and surveys were used to determine the attitudes of teachers and principals toward various aspects of the WEMS program. The attitudes investigated concerned WEMS training and support, technical issues, implementation, the quality and content of the program, and student response and achievement. 1. Attitudes toward the training and support Principals reported that Waterford trainers were very responsive and flexible about meeting school scheduling needs. Several teachers mentioned the importance of scheduling the training.

26
For example, if training took place too early (i.e., before the program was installed) teachers worried they would forget the training. If training occurred too late, teachers would have to spend time trying to figure the program out on their own. In the surveys and focus groups WEMS teachers frequently commented that it was hard to assimilate everything in the initial training, even though the trainers were well prepared and responsive. They reported that it was simply too much information, especially if the school was initiating other new programs at the same time. Teachers agreed that hands-on practice, preferably with their class list in hand, was much more valuable than a demonstration. Besides information on starting up, setting up the class and groups and registering students, information that teachers said would be useful early on was determining the right level for a student, varying the time of the session and assigning activities and benchmarking progress. Teachers expressed mixed reactions to the usefulness of the Getting Started guide and the training in reading the reports. In regard to problems that came up in the course of the year, teachers and principals reported that Pearson Digital representatives were very communicative and responsive, often calling the district office or going to the school personally to troubleshoot problems. “This is a good company to work with,” said one principal. TUSD was supportive as well, but administratively was slower to get things done, from procurement to setting up the computers and working out glitches. At the school level, teachers in the focus groups reported good support from their principals. The survey also asked about the degree and type of support that teachers received for the WEMS program. All of the respondents said they received technical support for computer issues, followed by 53.8% who received support from grade-level meetings with other WEMS teachers, active involvement on the part of the principal, and informal exchanges with other teachers using the program. 2. Attitudes toward technology, technical aspects Teachers appreciated how easy the program was to use and how little direct maintenance it required once it was running. They especially liked that the children could manage the rotations themselves. The teachers noted that the kids seemed to really love the program. One principal noted, “It’s like having four other teachers in the room who never lose their patience.” While generally optimistic about improved technical implementation for next year, some teachers expressed concern about the capacity of the existing computers and the school power system to have many computers running at the same time. Teachers reported that the difference in formats for printing in WEMS and the Waterford Early Reading Program was confusing. 3. Attitudes toward implementation Most of the teachers settled into a routine of computer rotations within a couple of weeks of getting the program. Some teachers in the focus groups expressed frustration at not being able to get to math and science every day because of time constraints and students being pulled for tutoring or other classes. Survey items 29-41 concerned the usefulness of the various components of the WEMS program. As mentioned above, the teacher resource crates, including the student take-home materials and videos, were delivered mid-year. No attempt was made to use them at Schools A and D, and

27
several teachers at the other schools were hesitant to use them without prior training. This probably accounts for the high percentages in the “Did not use” column in Table 11. The components that were most commonly judged to be helpful or very helpful were the class summary reports, technical support, and songs. The more helpful that teachers regarded the various components, the more they used them. The correlation between the total score of items 29-41 regarding usefulness of the materials and the total for items 43-53 regarding level of implementation was .63. Nevertheless, Table 10 indicates a lower level of implementation than does Table 11. Perhaps some teachers were unsure what the supplemental materials were or confused the WEMS with the WERP materials.
Table 11. Usefulness of Various Components of the WEMS Program
How helpful were these elements in supporting your math and science classes?
Did not use
Detrimental/ distracting or not helpful
Helpful or very
helpful Initial training in the WEMS program 1 2 9 Ongoing technical support from WEMS 1 0 11 WEMS overview 4 0 8 Getting started guide 5 1 6 Take-home student materials 4 0 8 Teacher resource crate materials 4 1 7 Masters and worksheets 5 1 6 Class summary reports 0 0 12 Individual reportsa 1 0 9 Songs 2 0 10 Videos/DVDs 3 0 9 Student books 4 0 8
Note. n = 12; One WEMS teacher did not complete this section of the survey. aTwo teachers did not respond to this item. 4. Attitudes toward the quality and content of the program Teachers and principals agreed on the high quality of the WEMS program. Technology was seen as one more opportunity to meet the diverse needs of the students. Teachers and principals specifically mentioned the comprehensive nature of the program, the quality of the graphics and sound, the ability to track student progress, and the variety of activities in different modalities such as music. They liked that it was self-paced, had different levels, could print reports, and engaged the students extremely well. They also mentioned its usefulness for vocabulary development and listening skills. The movies and science lessons were judged to be especially good. According to the teachers and principals, the testing, diagnostic assessments and tracking of student progress put it above other computer-based and internet instructional resources. Teachers especially appreciated the integration of math and science. Many teachers welcomed the additional exposure and expressed their frustration at not being able to do more science activities in the classroom because of time constraints. While the WEMS program allowed teachers to assign students activities to reinforce specific class activities, teachers were not shown how to do this at the initial training. Instead, only the established WEMS scope and sequence with its capability to individualize instruction was used

28
in order to demonstrate how the program “as is” affects student achievement. Teachers in the focus groups and surveys had mixed responses regarding how closely the WEMS program aligned with state standards and the TUSD curriculum. In general teachers’ perceptions were that the math content in WEMS corresponded more closely with the curriculum than did the science. When teachers were shown mid-year how to assign WEMS activities to correlate with lessons in class, they said the program supported the curriculum to a greater extent. One teacher commented “I didn’t [assign activities] the first quarter, but I did it in the second and third, and their math scores definitely improved.” In the focus groups, teachers expressed mixed opinions on the usefulness of the WEMS program for special populations. In general they observed that the ELL students were very slow to catch on to the program but the visuals, songs, self-pacing, use of earphones, repeated practice and oral language were big pluses for their progress and students responded enthusiastically. Some behaviors they noted from the ELL students signaled overload and tuning out of oral language – students hanging the earphones around their neck, failing to report sound problems, and switching headphones. Science seemed to be especially difficult for ELL students. Opinions were also mixed about the usefulness of the program for special education students – some felt it was an excellent resource, whereas others thought that one-on-one instruction was generally more effective. The surveys, however, indicated a more positive response toward using WEMS for ELL, special education and gifted or talented children (see Table 12). 5. Attitudes toward student engagement with WEMS All teachers and principals in the surveys, observations, focus groups and interviews noted the enthusiastic response of the children to the program. Students picked up how to use the computer quickly and motivation remained high, even at the end of the year, in contrast to other computer-based instructional programs. The program engaged students who were not usually engaged. Students would ask, “Why haven’t I gone yet?” “This is interesting.” “When is it my turn?” Because of the high level of interest, teachers found WEMS a good motivational tool as well as an instructional program. Students from other classes sometimes came in and wanted to use the program but were denied. Specific items that teachers observed the children responded to were the calendar, significant events that occurred on the same date, and songs. Sometimes all the students spontaneously started singing songs from WEMS. For example, one teacher was teaching the days of the week with a song, when all the students started singing a different song about the days that they had learned on the computer. As for the games, they seemed too easy for some students and too hard for others. Teachers reported that students responded to the accountability for learning inherent in the program. For example, when a student worked hard and was able to start the next level, others noticed. At the same time, teachers reported that some students found out they had to know the material to do it on the computer when they had gotten away with faking it in class or had forgotten it. When students understood they had to improve their score to move on, they did so. The program made the students do some things that teachers found it hard to get them to do with the whole class, such as counting money. In that sense the computer helped students feel personally responsible for their knowledge. Even so, some teachers reported that about 20% of students wasted their computer time.

29
6. Satisfaction with the program Finally, items 58-66 concerned various aspects of teacher satisfaction with the program, including parent response, method of sending home the student materials, reinforcement of class curriculum, value to special populations, teacher confidence in using the program, and inclination to continue using it. Responses were generally very positive. Of special note is the response to item 66 “I would like to use the WEMS program next year” with two teachers responding “Agree” and nine responding “Strongly agree.” Satisfaction was weakest concerning confidence in using the teacher resource crate, of which the take-home student materials are part. Table 12 presents these responses.
Table 12. Teacher Satisfaction with the WEMS Program
Item
Disagree or
strongly disagree
No opinion
Agree or strongly
agree Parents have reacted positively to the take-home student materials.
0 8 4
The system I use for sending home the take-home materials is working well.
0 7 5
The WEMS program reinforces what I teach in class. 0 1 11
The WEMS program is a valuable resource for my special education students.
0 2 10
The WEMS program is a valuable resource for my ELL students.
0 1 11
The WEMS program is a valuable resource for my gifted/ talented students.
0 1 11
I feel confident and comfortable with the WEMS computer rotations.
0 1 11
I feel confident and comfortable using the teacher resource crate.
1 6 5
I would like to use the WEMS program next year. 0 1 11
Note. n = 12. One WEMS teacher did not respond to this section. Teachers whose classes were observed responded to the open-ended questions “What is going well in the WEMS/math/science program?” and “What is not going well in the WEMS/math/science program?” with answers favorable to the programs they were using. The teachers expressed appreciation for the extra practice that computers provided, and said the children liked the computer instruction. Areas of concern to the WEMS teachers were their limited understanding of how the WEMS lessons correlated with the district curriculum, how to manage the student materials to use at home, lack of time, class interruptions and some technical issues. Areas of concern to the control teachers were the lack of time, especially for science, and the need for manipulative materials. 7. Other issues Expense was seen as a disadvantage by some principals, who nevertheless believed the program was worth it. They noted that the site license was charged per child and other expenses such as

30
purchasing compatible computers drove up the cost. One principal noted that it seemed expensive because of the licenses involved, but upgrades were free and involved no on-going costs such as workbooks or hiring TAs. The WEMS expenses should be compared to alternate strategies over the long run. Teachers as well as principals said they would definitely recommend the program for all classes and schools, but it depended on the availability of computers and how many children could log on at one time given the capacity of the server. D. Student achievement Determining the effect of the WEMS program on student achievement was the main purpose of this evaluation. Qualitative data was collected from teachers and principals from focus groups, interviews, conversations, and surveys. In general, findings suggested that the effect of the program was positive, with teachers who scheduled heavy use of WEMS responding more positively. Toward the end of the year, some teachers felt that the WEMS program had boosted student achievement, while others had a “wait and see” attitude. The kindergarten teacher at School C felt the students were definitely stronger with number knowledge. Some teachers reported that the program appeared to have increased the children’s technological skills and that girls in particular seemed to be more comfortable using the computers than in past years. Quantitative data relating to program effects consisted of results from the Stanford Achievement Tests in math and the environment and records of usage of the WEMS program for each student. Achievement scores were compared across the treatment and control groups and by subgroups. Results are first presented for all kindergartners in the study with the WEMS group filtered for dosage at 1100 minutes of program usage, followed by the results for the ITT (unfiltered) WEMS group. As mentioned in the Methods section, an analysis of the WEMS and control groups filtered for 90 days’ attendance was found to be almost identical to the unfiltered group and is not presented. An analysis of covariance shows adjusted posttest scores for differences on the pretest. In addition, achievement scores were compared across the subgroups of gender, ethnicity, primary home language, ELL status and quartile score on the pretest. In all of these analyses the WEMS group is filtered for 1100 minutes of usage in order to determine any program effects. Finally, the effect of program dosage or exposure to the WEMS program is considered.
Because the math and environment tests were given on different days in some classes, the number of students tested varied slightly. 1. Group analyses WEMS group filtered for 1100 minutes of program usage In math, kindergarteners in WEMS classes made greater gains than controls at all five schools, and this difference was significant at School B and when all kindergartens were aggregated together. Posttest scores were also higher for WEMS students at four of the five schools, and WEMS students had significant pre to posttest gains at all schools (see Table 13). On the environment test, results were similar. Students in the WEMS classes made greater gains than controls at all schools, and these differences were significant at two schools and when all

31
kindergartners were aggregated. WEMS students scored higher on the posttest than controls in four of the five schools. Pre to posttest gains were significant for the WEMS classes at four of the five schools and for all kindergartners. These gains were significant for controls only at School D (see Table 14). Table 13. Kindergarten Gains on the SAT10 Math Test by School
Pretest Posttest Measures n M SD M SD Gain t p School A WEMS 18 24.39 7.59 39.43 20.20 15.04 2.93 .009 Control 32 30.71 14.06 37.08 18.77 6.37 1.52 .139 8.67 School B WEMS 26 29.96 18.00 53.62 20.73 23.66 4.49 .000 Control 15 40.00 15.85 38.00 13.15 -2.00 0.39 .700 25.66** School C WEMS 29 36.97 11.42 54.40 20.87 17.43 3.40 .002 Control 20 52.75 16.32 55.54 22.49 2.79 0.51 .617 14.64 School D WEMS 35 40.86 18.79 55.89 20.96 15.03 4.29 .000 Control 42 41.39 20.85 52.36 17.90 10.97 2.47 .018 4.06 School E WEMS 42 41.45 13.72 52.22 22.26 10.77 2.90 .006 Control 32 47.44 24.10 49.58 18.79 2.14 0.42 .676 8.63 Total WEMS 150 36.41 15.95 52.20 21.48 15.79 7.93 .000 Control 141 41.80 20.34 47.19 19.69 5.39 2.43 .016 10.40***
Note. WEMS students were filtered at 1100 minutes (6 months) or more of program usage. Pretest was SESAT1 and posttest was SESAT2. NCEs used for analysis. ** p < .01, *** p < .001 from independent t tests comparing gains.

32
Table 14. Kindergarten Gains on the SAT10 Environment Test by School Pretest Posttest Measures n M SD M SD Gain t p School A WEMS 17 24.53 11.43 39.41 20.83 14.88 2.40 .029 Control 32 29.03 16.40 30.46 19.25 1.43 0.32 .750 13.45 School B WEMS 27 30.07 17.55 53.22 19.91 23.15 4.61 .000 Control 16 39.06 18.10 39.31 16.77 0.25 0.04 .970 22.90** School C WEMS 30 40.30 14.14 49.19 24.53 8.89 1.59 .122 Control 19 50.84 17.64 43.47 19.64 -7.37 1.32 .205 16.26 School D WEMS 33 42.03 17.29 56.70 23.15 14.67 3.22 .003 Control 42 47.00 19.36 57.98 17.57 10.98 2.91 .006 3.69 School E WEMS 41 42.88 14.73 55.11 24.93 12.23 2.96 .005 Control 30 52.60 25.65 44.00 19.84 -8.60 1.55 .132 20.83** Total WEMS 148 37.72 16.61 52.12 23.44 14.40 6.45 .000 Control 139 43.68 21.59 44.49 21.04 0.81 0.36 .723 13.59***
Note. WEMS students were filtered for 1100 minutes (6 months) or more of program usage. Pretest was SESAT1 and posttest was SESAT2. Math and environment tests were given on different days in some classes, so some students did not take both tests. NCEs used for analysis. ** p < .01, from independent t tests comparing gains.
Figure 3. Kindergarten SAT10 Math Gains
15.04
23.66
17.4315.03
10.77
15.79
2.14
10.97
-2.002.79
6.37 5.39
-10
0
10
20
30
School A
School B
School C
School D
School E
Averag
e
Mea
n N
CE
Gai
n
WEMSControl

33
Figure 4. Kindergarten SAT10 Environment Gains
14.88
23.15
8.89
14.6712.23
1.43 0.25
10.98
0.81
14.40
-7.37 -8.60
-10
0
10
20
30
School A
School B
School C
School D
School E
Average
Mea
n N
CE
Gai
n
WEMS Control
WEMS group unfiltered The ITT or unfiltered WEMS group included all students with both pre and posttests regardless of the number of minutes they used the program. This included one class in School A for which no usage data was available, although usage was suspected to be high because the teacher strongly supported the program. Math results for the ITT group were similar to but slightly lower than those of the group filtered for 1100 minutes of program usage. Specifically, WEMS students had greater gains than controls at all five schools, and the difference was significant at one school and when all kindergartners were aggregated (see Table 15 above). On the environment test the ITT or unfiltered WEMS group showed higher gains than controls at all schools, gains that were significantly greater than controls at four of the five schools and for all kindergartners aggregated. These gains were higher than those of the WEMS filtered group at three schools and for all WEMS kindergartens (see Table 16).

34
Table 15. Kindergarten Gains on the SAT10 Math Test by School (Unfiltered) Pretest Posttest Measures n M SD M SD Gain t p School A WEMS 47 30.17 14.04 43.26 23.62 13.09 3.24 .002 Control 32 30.71 14.06 37.08 18.77 6.37 1.52 .139 6.72 School B WEMS 31 29.83 17.69 52.51 21.30 22.68 4.61 .000 Control 15 40.00 15.85 38.00 13.15 -2.00 0.39 .700 24.68** School C WEMS 37 34.26 13.31 51.26 21.32 17.00 3.79 .001 Control 20 52.75 16.32 55.54 22.49 2.79 0.51 .617 14.21 School D WEMS 40 38.58 18.97 53.88 20.90 15.30 4.65 .000 Control 42 41.39 20.85 52.36 17.90 10.97 2.47 .018 4.33 School E WEMS 49 41.10 13.76 50.17 21.80 9.07 2.70 .010 Control 32 47.44 24.10 49.58 18.79 2.14 0.42 .676 6.93 Total WEMS 204 35.13 16.04 49.86 22.02 14.73 8.25 .000 Control 141 41.80 20.34 47.19 19.69 5.39 2.43 .016 9.34***
Note. All WEMS students were selected, regardless of the number of minutes using the WEMS program. Pretest was SESAT1 and posttest was SESAT2. NCEs used for analysis. ** p < .01, *** p < .001 from independent t tests comparing gains.

35
Table 16. Kindergarten Gains on the SAT10 Environment Test by School (Unfiltered) Pretest Posttest Measures n M SD M SD Gain t p School A WEMS 46 25.52 12.80 46.22 22.99 20.70 4.94 .000 Control 32 29.03 16.40 30.46 19.25 1.43 0.32 .750 19.27** School B WEMS 32 29.56 17.11 53.03 21.57 23.47 4.82 .000 Control 16 39.06 18.10 39.31 16.77 0.25 0.04 .970 23.22** School C WEMS 38 36.05 15.42 46.20 24.45 10.15 2.20 .034 Control 19 50.84 17.64 43.47 19.64 -7.37 1.32 .205 17.52* School D WEMS 36 42.19 17.36 55.94 22.48 13.75 3.11 .004 Control 42 47.00 19.36 57.98 17.57 10.98 2.91 .006 2.77 School E WEMS 47 41.87 14.29 53.01 26.03 11.14 2.80 .008 Control 30 52.60 25.65 44.00 19.84 -8.60 1.55 .132 19.74** Total WEMS 199 35.06 16.58 50.68 23.81 15.62 7.90 .000 Control 139 43.68 21.59 44.49 21.04 0.81 0.36 .723
14.81*** Note. All WEMS students were selected regardless of the number of minutes using the WEMS program. Pretest was SESAT1 and posttest was SESAT2. Math and environment tests were given on different days in some classes, so some students did not take both tests. NCEs used for analysis. ** p < .01, *** p < .001 from independent t tests comparing gains.

36
ANCOVA and effect sizes An independent samples t test on the SAT10 math and environment pretest scores revealed significant differences (math p = .006, environment p = .007) between the WEMS (filtered at 1100 minutes) group and the control group. Therefore, an analysis of covariance (ANCOVA) was conducted to adjust the posttest scores to account for the difference between the WEMS and control groups on the pretests. Because the pretest scores of the WEMS students were lower than controls, the adjusted posttest scores for the WEMS group were slightly higher and for the controls slightly lower than the posttest scores presented in Tables 14 and 15. Program effect sizes were also calculated. Effect sizes comparing the WEMS posttest achievement on the SAT10 math and environment tests with that of the controls favored the WEMS kindergartners. The difference in scores between the WEMS and control groups was significant in math (F = 6.07, p = .014) and the environment (F = 10.92, p = .001; see Table 17).
Table 17. ANCOVA and Effect Sizes on the SAT10 Math and Environment Tests (Filtered) Covariate Adj. Posttest Measures N M SD M SD ES F p Math WEMS 150 36.41 15.95 52.66 21.48 .29 6.07 .014 Control 141 41.80 20.34 46.70 19.69
Environment WEMS 148 37.72 16.61 52.65 23.44 .40 10.92 .001 Control 139 43.68 21.59 43.93 21.04
Note. WEMS students filtered for 1100 minutes (6 months) or more of usage. Math and environment tests were given on different days in some classes, so some students did not take both tests. The effect size is the adjusted mean posttest difference divided by the square root of the ANCOVA mean squared residual. NCEs used for analysis. Pretest was SESAT1 and posttest was SESAT2. ES = Effect size. Figure 5. Kindergarten Program Effect Size
0.29
0.40
00.10.20.30.40.5
Math Environment
2. Kindergarten subgroups Kindergarten students were divided into subgroups to assess any differential program effects by: • gender • ethnic group • primary home language • English language learner status, and

37
• achievement quartile on the SAT10 math and environment pretests. The gap between academically high-performing and low-performing students is often described along the lines of these subgroups. All of these analyses were carried out with the WEMS group filtered to have at least 1100 minutes or more of program usage. Gender Kindergarten boys in the WEMS and control groups had similar scores on the math and environment SAT10 pretests, but the WEMS boys outperformed the control boys in the posttest. This difference was significant for both tests. Kindergarten girls in the WEMS group scored lower in both the math and environment pretests than the control group girls, but outperformed them in the posttest. As with the boys, the difference was significant for both the math and environment tests. Both genders in the WEMS classes made significant progress pretest to posttest in math and environment, as did the control group boys in math (see Table 18 and Figures 6 and 7).
Table 18. Kindergartners on SAT10 Math and Environment Tests by Gender Pretest Posttest Group n M SD M SD Gain t p Math Boys WEMS 68 37.38 16.58 55.36 19.86 17.98 6.63 .000 Control 73 37.39 18.93 47.42 18.51 10.03 3.60 .001 WEMS vs. Control 7.95*
Girls WEMS 82 35.60 15.46 49.58 22.51 13.98 4.88 .000 Control 68 46.54 20.87 46.93 21.01 0.39 0.12 .907
WEMS vs. Control 13.59**
Environment Boys WEMS 68 37.94 13.42 53.71 21.09 15.77 5.35 .000 Control 72 39.35 21.29 43.67 21.37 4.32 1.31 .194
WEMS vs. Control 11.45*
Girls WEMS 80 37.54 19.00 50.77 25.33 13.23 4.02 .000 Control 67 48.34 21.09 45.38 20.81 -2.96 0.95 .343
WEMS vs. Control 10.27** Note. WEMS students were filtered for 1100 minutes (6 months) or more of usage. Pretest was SESAT1 and posttest was SESAT2. Math and environment tests were given on different days in some classes, so some students did not take both tests. NCEs used for analysis. * p < .05, ** p < .01, from independent t tests comparing gains.

38
Figure 6. Kindergarten SAT10 Gains for Boys
1 7 .9 8
1 5 .7 7
1 0 .0 3
4 .3 2
-5
0
5
1 0
1 5
2 0
M a th E n v iro n m e n t
Mea
n N
CE
Gai
n
W E M SC o n tro l
Figure 7. Kindergarten SAT10 Gains for Girls
13.98 13.23
0.39 -2.96
-5
0
5
10
15
Math Environment
Mea
n N
CE
Gai
n
WEMS
Control

39
Ethnicity Hispanic WEMS kindergartners outperformed the controls in math and the environment. African Americans, Native Americans and white WEMS kindergartens made greater gains than the controls, although these were not statistically significant. The small numbers of African Americans, Asians and whites made attaining statistical significance problematic (see Table 19).
Table 19. Kindergartners on SAT10 Math and Environment Tests by Ethnic Group Pretest Posttest Group n M SD M SD Gain t p Math WEMS African American 5 31.40 26.84 53.40 11.41 22.00 2.65 .057 Asian 6 39.67 21.04 38.62 28.98 -1.05 0.05 .960 Hispanic 118 37.26 15.20 54.21 20.40 16.95 8.16 .000 Native American 16 28.81 15.48 44.42 26.03 15.61 2.37 .032 White 5 41.60 14.66 44.80 24.05 3.20 0.27 .800
Control African American 6 34.95 23.83 46.50 26.57 11.55 0.73 .497 Asian 1 17.00 - 61.00 - 44.00 - - Hispanic 103 43.53 20.36 48.63 19.06 5.10 1.99 .050 Native American 21 34.33 18.72 41.94 18.79 7.61 1.37 .186 White 10 46.27 18.91 42.37 24.52 -3.90 0.57 .586
Environment WEMS African American 5 33.80 9.23 57.80 19.36 24.00 3.78 .019 Asian 6 44.67 19.10 43.83 35.08 -0.84 0.04 .968 Hispanic 117 38.66 17.04 53.10 22.61 14.44 6.04 .000 Native American 15 27.33 11.70 46.33 26.67 19.00 2.42 .030 White 5 42.60 12.54 50.80 25.85 8.20 0.63 .562
Control African American 5 41.80 17.75 49.34 27.22 7.54 0.57 .597 Asian 1 32.00 - 51.00 - 19.00 - - Hispanic 103 45.89 22.12 46.89 20.53 1.00 0.38 .709 Native American 21 29.71 15.25 34.86 20.07 5.15 0.91 .372 White 9 53.33 19.14 36.11 21.68 -17.22 2.21 .058
Note. WEMS students were filtered for 1100 minutes (6 months) or more of usage. Pretest was SESAT1 and posttest was SESAT2. Math and environment tests were given on different days in some classes, so some students did not take both tests. NCEs used for analysis. On the math test, Hispanic WEMS kindergartners made significantly greater gains than the Hispanic controls. Hispanic and Native Americans in the WEMS group made significant progress pre to posttest. The small numbers of African Americans, Asians and whites made attaining statistical significance problematic; for example, the Asian control group consisted of one student (see Table 20 and Figure 8).

40
Table 20. Kindergartners on SAT10 Math Test by Ethnic Group Pretest Posttest Group n M SD M SD Gain t p African American WEMS 5 31.40 26.84 53.40 11.41 22.00 2.65 .057 Control 6 34.95 23.83 46.50 26.57 11.55 0.73 .497 WEMS vs. Control 10.45
Asian WEMS 6 39.67 21.04 38.62 28.98 -1.05 0.05 .960 Control 1 17.00 - 61.00 - 44.00 - - WEMS vs. Control 45.05
Hispanic WEMS 118 37.26 15.20 54.21 20.40 16.95 8.16 .000 Control 103 43.53 20.36 48.63 19.06 5.10 1.99 .050 WEMS vs. Control 11.85***
Native American WEMS 16 28.81 15.48 44.42 26.03 15.61 2.37 .032 Control 21 34.33 18.72 41.94 18.79 7.61 1.37 .186 WEMS vs. Control 8.00
White WEMS 5 41.60 14.66 44.80 24.05 3.20 0.27 .800 Control 10 46.27 18.91 42.37 24.52 -3.90 0.57 .586 WEMS vs. Control 7.10
Note. WEMS students were filtered for 1100 minutes (6 months) or more of usage. Pretest was SESAT1 and posttest was SESAT2. NCEs used for analysis. *** p < .001 from independent t tests comparing gains.
On the environment test, Hispanic WEMS kindergartners made significantly higher gains than the Hispanic controls. There were too few kindergartners of white, African American and Asian ethnicity to adequately analyze their performance. Hispanic and Native Americans in the WEMS group made significant progress pre to posttest (see Table 21 and Figure 9).
Figure 8. Kindergarten SAT10 Math Gains by Ethnicity
16.9515.61
-1.05
22.00
3.20
11.557.61
-3.90
44.00
5.10
-20
-10
0
10
20
30
40
50
Asian
African
Am.
Hispan
ic
Native
Am.
White
Mea
n N
CE
Gai
n
WEMSControl

41
Table 21. Kindergartners on SAT10 Environment Test by Ethnic Group Pretest Posttest Group n M SD M SD Gain t p African American WEMS 5 33.80 9.23 57.80 19.36 24.00 3.78 .019 Control 5 41.80 17.75 49.34 27.22 7.54 0.57 .597 WEMS vs. Control 16.46
Asian WEMS 6 44.67 19.10 43.83 35.08 -0.84 0.04 .968 Control 1 32.00 - 51.00 - 19.00 - - WEMS vs. Control -19.84
Hispanic WEMS 117 38.66 17.04 53.10 22.61 14.44 6.04 .000 Control 103 45.89 22.12 46.89 20.53 1.00 0.38 .709 WEMS vs. Control 13.44***
Native American WEMS 15 27.33 11.70 46.33 26.67 19.00 2.42 .030 Control 21 29.71 15.25 34.86 20.07 5.15 0.91 .372 WEMS vs. Control 13.85
White WEMS 5 42.60 12.54 50.80 25.85 8.20 0.63 .562 Control 9 53.33 19.14 36.11 21.68 -17.22 2.21 .058 WEMS vs. Control 25.42
Note. WEMS students were filtered for 1100 minutes (6 months) or more of usage. Pretest was SESAT1 and posttest was SESAT2. Math and environment tests were given on different days in some classes, so some students did not take both tests. NCEs used for analysis *** p < .001 from independent t tests comparing gains. Figure 9. Kindergarten SAT10 Environment Gains by Ethnicity
14.4419.00
8.20
24.00
-0.84
7.545.15
1.00
19.00
-17.22
-20
-10
0
10
20
30
40
50
Asian
African
Am.
Hispan
ic
Native
Am.
White
Mea
n N
CE
Gai
n
WEMSControl

42
Primary home language WEMS students whose primary home language was Spanish made significantly greater gains in math than the controls (see Table 22 and Figure 10). Significant pre to posttest gains on the SAT10 math test were made by WEMS English home language students and both WEMS and control Spanish home language students. The small number of kindergartners with another home language makes analysis of their gains difficult.
Table 22. Kindergartners on SAT10 Math Test by Primary Home Language Pretest Posttest Math n M SD M SD Gain t p WEMS English 74 38.19 16.03 46.60 20.01 8.41 3.13 .002 Spanish 69 34.80 14.78 58.46 21.15 23.66 9.09 .000 Other 7 33.43 25.17 49.81 25.94 16.38 1.08 .321
Control English 82 42.91 20.41 45.83 20.36 2.92 1.02 .313 Spanish 55 41.31 20.44 48.69 18.81 7.38 2.11 .040 Other 4 25.93 13.13 54.25 19.38 28.32 2.04 .134
English WEMS 74 38.19 16.03 46.60 20.01 8.41 3.13 .002 Control 82 42.91 20.41 45.83 20.36 2.92 1.02 .313 WEMS vs. Control 5.49
Spanish WEMS 69 34.80 14.78 58.46 21.15 23.66 9.09 .000 Control 55 41.31 20.44 48.69 18.81 7.38 2.11 .040 WEMS vs. Control 16.28***
Other WEMS 7 33.43 25.17 49.81 25.94 16.38 1.08 .321 Control 4 25.93 13.13 54.25 19.38 28.32 2.04 .134 WEMS vs. Control -11.94
Note. WEMS students filtered for 1100 minutes (6 months) or more usage. Other languages are Af-Mayma, Cambodian, Laotian, Marshallese, Somali, Vietnamese and Yaqui. Pretest was SESAT1, posttest was SESAT2. *** p < .001 from independent t test comparing gains. On the environment test, the difference in gains between the WEMS and control groups was significant for both English and Spanish home language students (see Table 23 and Figure 11). WEMS students made significant pre to posttest gains whether their primary home language was English or Spanish. Control students who spoke another primary home language also made significant pre to posttest gains, although the number of these students was small.

43
Table 23. Kindergartners on SAT10 Environment Test by Primary Home Language Pretest Posttest Environment n M SD M SD Gain t p WEMS English 75 38.99 15.59 47.89 22.33 8.90 2.90 .005 Spanish 66 36.55 18.07 56.81 23.65 20.26 6.27 .000 Other 7 35.29 13.66 53.14 28.12 17.85 1.44 .200
Control English 77 44.79 21.02 41.35 20.91 -3.44 1.17 .245 Spanish 58 42.66 23.07 46.98 20.60 4.32 1.20 .236 Other 4 37.25 5.38 69.00 7.12 31.75 5.78 .010
English WEMS 75 38.99 15.59 47.89 22.33 8.90 2.90 .005 Control 77 44.79 21.02 41.35 20.91 -3.44 1.17 .245 WEMS vs. Control 12.34**
Spanish WEMS 66 36.55 18.07 56.81 23.65 20.26 6.27 .000 Control 58 42.66 23.07 46.98 20.60 4.32 1.20 .236 WEMS vs. Control 15.94***
Other WEMS 7 35.29 13.66 53.14 28.12 17.85 1.44 .200 Control 4 37.25 5.38 69.00 7.12 31.75 5.78 .010 WEMS vs. Control -13.90
Note. WEMS students were filtered for 1100 minutes (6 months) or more of usage. Pretest was SESAT1 and posttest was SESAT2. Math and environment tests were given on different days in some classes, so some students did not take both tests. NCEs used for analysis. ** p < .01, *** p < .001 from independent t tests comparing gains. Figure 10. Kindergarten SAT10 Math Gains by Primary Home Language
8.41
23.66
16.38
2.92
7.38
28.32
-10
0
10
20
30
40
English Spanish Other
Mea
n N
CE
Gai
n
WEMSControl

44
Figure 11. Kindergarten SAT10 Environment Gains by Primary Home Language
8.90
20.2617.85
4.32
31.75
-3.44
-10
0
10
20
30
40
EnglishSpanish
Other
Mea
n N
CE
Gai
n
WEMSControl
It is of note that the WEMS Spanish home language students, who scored lowest on the pretest, outperformed all other groups on the posttest and scored above the national mean. Other groups made more modest gains. This disordinal interaction is presented in Figure 12.
Figure 12. Kindergarten SAT10 Math Pre-Posttest Scores by Primary Home Language
58.46
46.6
38.19
45.8342.91
34.80
48.69
41.31
20
40
60
Pretest Posttest
Mea
n N
CE
Gai
n
Eng. WEMSEng. ControlSpan. WEMSSpan. Control
As in math, the WEMS Spanish home language students, who scored lowest on the pretest, outscored all other groups on the posttest and scored above the national mean. Other groups (except for the control English home language students) made more modest gains. This disordinal interaction is presented in Figure 13.

45
Figure 13. Kindergarten SAT10 Environment Pre-Posttest Scores by Primary Home Language
41.35
56.81
47.89
38.99
44.79
36.55
46.98
42.66
20
40
60
Pretest Posttest
Mea
n N
CE
Gai
n
Eng. WEMSEng. ControlSpan. WEMSSpan. Control
English Language Learner status WEMS ELL students made significantly greater gains than control ELL students on the math and environment tests (see Table 24 and Figures 14 ad 15). WEMS English-proficient (non-ELL) students also significantly outperformed control English-proficient students on the environment test. ELL students made significant pre to posttest gains on the math and environment SAT10 tests in both the WEMS and control groups. In addition, the WEMS non-ELL students made significant pre to posttest gains in math and the environment. Figure 14. Kindergarten SAT10 Math Gains by ELL Status
24.84
7.679.01
3.00
-10
0
10
20
30
ELL students Non-ELL students
Mea
n N
CE
Gai
n
WEMSControl

46
Table 24. Kindergartners on SAT10 Math and Environment Tests by ELL Status Pretest Posttest Measures n M SD M SD Gain t p Math ELL students WEMS 71 33.06 16.01 57.90 20.84 24.84 9.45 .000 Control 56 39.42 19.26 48.43 18.64 9.01 2.67 .010 WEMS vs. Control 15.83***
Non-ELL students WEMS 79 39.42 15.37 47.09 20.87 7.67 2.89 .005 Control 85 43.37 20.99 46.37 20.42 3.00 1.03 .305 WEMS vs. Control 4.67
Environment ELL students WEMS 68 35.38 18.11 57.48 23.55 22.10 7.03 .000 Control 59 41.12 21.72 49.56 19.68 8.44 2.37 .021 WEMS vs. Control 13.66**
Non-ELL students WEMS 80 39.71 15.06 47.56 22.51 7.85 2.64 .010 Control 80 45.58 21.43 40.76 21.35 -4.82 1.70 .093 WEMS vs. Control 12.67**
Note. WEMS students filtered for 1100 minutes (6 months) or more of usage. Pretest was SESAT1, posttest was SESAT2. Math and environment tests were given on different days in some classes, so some students did not take both tests. NCEs used for analysis. ** p < .01, *** p < .001 from independent t tests comparing gains.
Figure 15. Kindergarten SAT10 Environment Gains by ELL Status
22.1
7.858.44
-4.82
-10
0
10
20
30
ELL students
Non-ELL students
Mea
n N
CE
Gai
n
WEMSControl

47
As was the case with findings regarding students’ primary home languages, WEMS ELL students had the lowest pretest scores in math, yet received the highest posttest scores, which were above the national mean. Other groups made more modest gains (see Figure 16).
Figure 16. Kindergarten SAT10 Math Pre-Posttest Scores by ELL Status
57.90
33.06
48.43
39.42
47.09
39.42 46.3743.37
20
40
60
Pretest Posttest
Mea
n N
CE
Gai
n
ELL WEMSELL ControlNon-ELL WEMSNon-ELL Control
On the environment test, WEMS ELL students scored lowest on the pretest but outperformed all other groups on the posttest, again scoring above the national mean. Control ELL and WEMS non-ELL students made more modest gains (see Figure 17). Figure 17. Kindergarten SAT10 Environment Pre-Posttest Scores by ELL Status
57.48
35.38
49.56
41.12
47.56
39.71 40.76
45.58
20
40
60
Pretest Posttest
Mea
n N
CE
Gai
n
ELL WEMSELL ControlNon-ELL WEMSNon-ELL Control
Pretest achievement quartile Students were divided into quartiles according to their achievement on the math and environment SAT10 pretests, and their gains on the posttest were analyzed to determine any differential effects of the WEMS program (see Tables 25 and 26).

48
On the math test, the WEMS students in Quartiles 1 and 2 made greater gains than the control students, but these were not statistically significant. Quartile 3 WEMS and control students were very similar in achievement. Quartile 4 showed the only significant difference between the groups: the control students’ scores declined in NCE score from the pretest, while the WEMS students’ NCE scores remained steady. As NCE scores were used in these analyses, the nonsignificant gain for the WEMS students in the 4th Quartile actually represents one year of growth (i.e., zero net gain is equivalent to one year of growth).
Table 25. Kindergartners on the SAT10 Math Test by Achievement Quartile Pretest Posttest Measures n M SD M SD Gain t p 1st Quartile WEMS 35 16.06 6.97 49.66 21.13 33.60 9.12 .000 Control 28 14.29 8.52 44.63 19.35 30.34 6.72 .000 WEMS vs. Control 3.26
2nd Quartile WEMS 46 31.59 3.51 50.11 20.62 18.52 6.02 .000 Control 35 31.80 3.36 43.06 15.70 11.26 4.27 .000
WEMS vs. Control 7.26
3rd Quartile WEMS 34 41.82 3.09 49.46 21.51 7.64 1.98 .056 Control 27 42.33 2.96 49.62 23.22 7.29 1.64 .113
WEMS vs. Control 0.35
4th Quartile WEMS 35 57.83 9.00 60.16 21.87 2.33 0.63 .530 Control 51 63.49 11.55 50.13 20.19 -13.36 4.51 .000
WEMS vs. Control 15.69** Note. WEMS students were filtered for 1100 minutes (6 months) or more of usage. Pretest was SESAT1 and posttest was SESAT2. NCEs used for analysis. ** p < .01, from independent t tests comparing gains.
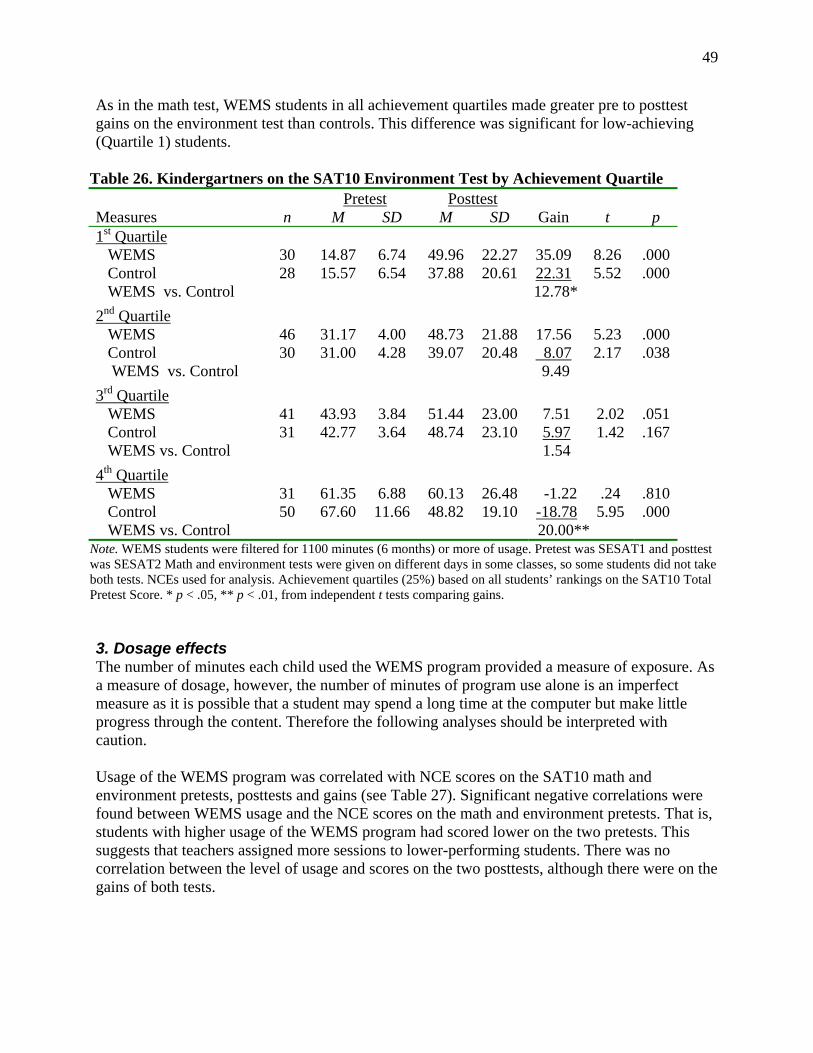
49
As in the math test, WEMS students in all achievement quartiles made greater pre to posttest gains on the environment test than controls. This difference was significant for low-achieving (Quartile 1) students.
Table 26. Kindergartners on the SAT10 Environment Test by Achievement Quartile Pretest Posttest Measures n M SD M SD Gain t p 1st Quartile WEMS 30 14.87 6.74 49.96 22.27 35.09 8.26 .000 Control 28 15.57 6.54 37.88 20.61 22.31 5.52 .000 WEMS vs. Control 12.78*
2nd Quartile WEMS 46 31.17 4.00 48.73 21.88 17.56 5.23 .000 Control 30 31.00 4.28 39.07 20.48 8.07 2.17 .038
WEMS vs. Control 9.49
3rd Quartile WEMS 41 43.93 3.84 51.44 23.00 7.51 2.02 .051 Control 31 42.77 3.64 48.74 23.10 5.97 1.42 .167
WEMS vs. Control 1.54
4th Quartile WEMS 31 61.35 6.88 60.13 26.48 -1.22 .24 .810 Control 50 67.60 11.66 48.82 19.10 -18.78 5.95 .000
WEMS vs. Control 20.00** Note. WEMS students were filtered for 1100 minutes (6 months) or more of usage. Pretest was SESAT1 and posttest was SESAT2 Math and environment tests were given on different days in some classes, so some students did not take both tests. NCEs used for analysis. Achievement quartiles (25%) based on all students’ rankings on the SAT10 Total Pretest Score. * p < .05, ** p < .01, from independent t tests comparing gains. 3. Dosage effects The number of minutes each child used the WEMS program provided a measure of exposure. As a measure of dosage, however, the number of minutes of program use alone is an imperfect measure as it is possible that a student may spend a long time at the computer but make little progress through the content. Therefore the following analyses should be interpreted with caution. Usage of the WEMS program was correlated with NCE scores on the SAT10 math and environment pretests, posttests and gains (see Table 27). Significant negative correlations were found between WEMS usage and the NCE scores on the math and environment pretests. That is, students with higher usage of the WEMS program had scored lower on the two pretests. This suggests that teachers assigned more sessions to lower-performing students. There was no correlation between the level of usage and scores on the two posttests, although there were on the gains of both tests.

50
Table 27. Correlations of WEMS Usage and Achievement Gains Measures Usage SAT10 Math NCE pretest -.243** SAT10 Math NCE posttest -.009
SAT10 Environment NCE pretest -.210** SAT10 Environment NCE posttest .004
Gain SAT10 Math NCE .170** Gain SAT10 Environment NCE .148*
Note. All usage levels of the WEMS program are included. Pretest was SESAT1, Posttest SESAT2. Pearson correlation. * p < .05, ** p < . 01. Usage for all WEMS students in the three grades was divided into quartiles: 0-519 minutes, 520-1246 minutes, 1247-1931 minutes, and 1932-3025 minutes (see Table 28). Pre to posttest scores and gains were analyzed for each quartile and compared to the controls. The highest number of students (78) was in the 3rd quartile, indicating a moderately high level of usage. In math, all WEMS and control classes had significant pre to posttest gains (see Figure 18). The highest gain was by students in the 2nd quartile (520-1246 minutes) of WEMS usage. On the environment test, the WEMS group had significant pretest-to-posttest gains, but the controls did not (see Figure 19). Here the highest gain was made by the students in the 1st quartile (0-519 minutes).
Figure 18. Kindergarten SAT10 Math Scores by Usage Level
47.1944.61
50.80 52.3948.23
33.9337.88
33.60
41.80
32.59
0
10
20
30
40
50
60
Control 0-519 520-1246 1247-1931 1932-3025
Minutes of WEMS Usage
Mea
n N
CE
PretestPosttest

51
Table 28.Kindergarten Students on the SAT10 Math and Environment Tests by WEMS Usage Quartile
Pretest Posttest Minutes of WEMS Usage n M SD M SD Gain t p Math
Control 141 41.80 20.34 47.19 19.69 5.39 2.43 .0160-519 34 32.59 16.14 44.61 23.87 12.02 2.36 .024520-1246 51 33.60 16.81 50.80 20.82 17.20 5.33 .0001247-1931 78 37.88 16.28 52.39 21.98 14.51 5.23 .000 1932-3025 41 33.93 14.24 48.23 21.90 14.30 3.36 .002
Environment Control 139 43.68 21.59 44.49 21.04 .81 .36 .7230-519 32 27.20 12.69 48.91 24.23 21.71 4.18 .000520-1246 51 33.88 16.93 52.76 24.40 18.88 5.08 .0001247-1931 75 38.08 17.11 52.10 23.58 14.02 4.39 .000 1932-3025 41 37.15 16.19 46.85 23.52 9.70 2.19 .034
Figure 19. Kindergarten SAT10 Environment Scores by Usage Level
48.9152.76 52.10
46.85
37.1538.0833.88
27.20
43.6844.49
0
10
20
30
40
50
60
Control 0-519 520-1246 1247-1931 1932-3025
Minutes of WEMS Usage
Mea
n N
CE
PretestPosttest
4. Summary of Kindergarten results Kindergarten WEMS classes showed a moderately high level of program implementation and strong results for the WEMS program. WEMS students significantly outperformed the control students in math and the environment tests. Program effect size was moderate for both tests. When compared with their counterparts in the control classes, the WEMS students made significantly greater gains in math in the case of boys, girls, Hispanics, Spanish home language students, and ELL students. Results on the environment test were generally similar, with the addition of WEMS English home language and English-proficient (non-ELL) students making significantly greater gains than controls on the environment test. Students at all levels of WEMS program usage made greater pre to posttest gains than controls.

52
IV. DISCUSSION AND SUMMARY A. Effectiveness of the WEMS program The present study is the first independent study of the effectiveness of the WEMS program. As such, it adds to the general knowledge regarding the effectiveness of educational software by: a) using an experimental design with the control sample taken from the same population of schools as the treatment sample, b) reporting the level of implementation and degree of satisfaction of the teachers involved, c) assessing academic gains using a widely-used standardized test, and d) determining the level of exposure to the program as measured by minutes of product use. This investigation concerned fidelity of implementation, attitudes of teachers and principals toward various aspects of the program, and the effects of the WEMS program on academic and achievement. 1. Interpretation of results regarding implementation Implementation of the WEMS program was as expected for the first year. As the observations, focus groups and teacher surveys indicated, product use was generally limited to the classroom rotations or computer lab time. Teachers were requested to have all students use the WEMS software for 22 minutes a day. However, several kindergarten teachers reduced the session length to 15 minutes. A few kindergartners finished Level 1 of the WEMS program and started Level 2. These discrepancies in use were not considered threats to the study because 1) student usage was logged directly by the computer, providing a more accurate measure than the teacher estimate, and 2) adaptation to individual needs is an intrinsic capability of the program. Control classrooms already had a number of supplemental materials in place, including educational software as noted in the Methods section. It was outside the researchers’ authority to remove these materials. In any case, the effectiveness of the WEMS program should be evaluated in comparison to existing programs and strategies. Therefore, all the classes in the study had the same supplemental materials with the exception of the WEMS program. The classroom observations and surveys supported the general equivalency of conditions between the WEMS and control kindergarten classrooms as would be expected given the random assignment. However, WEMS kindergarten teachers were found to have more education, experience, and TA hours than the control teachers. It is not clear to what extent this may have contributed to posttest achievement. 2. Interpretation of results regarding teacher and principal attitudes Principal interviews and teacher focus groups indicated very positive attitudes toward the WEMS program, with reports of high student interest. Other favorable features of the program identified by teachers were its high quality, comprehensive nature, variety of modalities, and adaptability to the needs of individual students including tracking progress and reteaching. Teachers liked the WEMS program more than other educational software they had used in the classroom, with 11 of the 12 respondents saying they would like to use it the following year (one teacher had a neutral response).

53
It is of note that the teachers and principals seemed to consider the technical difficulties that arose during WEMS use to fall well within what is considered normal for implementing a new technology. Teachers also reported appreciating the WEMS training, but noted that they would like to see more training occur throughout the year. Both teachers and principals said they looked forward to expanding the WEMS program to all K-2 classrooms in the coming year and implementing it more fully. 3. Interpretation of results regarding achievement In spite of being the first year of implementation of the WEMS program, results in student achievement were impressive. Significant differences over the controls in both math and environment were evident for WEMS boys and girls, Hispanic students, Spanish speakers and ELL students. English-proficient WEMS students also made significantly higher gains on the environment test than English-proficient control students. Ethnicity, primary home language and ELL status Converging results from the subgroup analyses by ethnicity, primary home language and ELL status suggest that Hispanic students in particular benefited from the WEMS program. WEMS Spanish home language and ELL students not only made significantly greater gains than controls, but outperformed both their control counterparts (the English-proficient and English home language students) on the math and environment posttests, scoring above the national norm. This does not mean that other ethnicities did not benefit as much from the program, but that their sample sizes were too small to draw definitive conclusions. Dosage The effect of program dosage on student achievement was not made clear by the present evaluation. The highest gains in the WEMS group were with the children with the lower 50% of usage. One class had no record of usage and was scored as 0 although usage was suspected to be high. It is possible that teachers assigned additional sessions to struggling students, so their modest gains correlate with high usage, while in other cases higher usage resulted in higher gains. An analysis of how achievement gains relate to the WEMS content covered rather than to minutes of usage may shed light on this issue. Summary of notable findings The most important findings for the kindergarten classes were:
• Qualitative data showed the attitudes of the treatment classroom teachers and principals to be very favorable toward the program;
• The general level of implementation was as expected for the first-year of use; • WEMS students significantly outperformed control students on the math and
environment tests; • WEMS boys significantly outperformed control boys, and WEMS girls significantly
outperformed control girls on the math and environment tests;

54
• WEMS Hispanic students significantly outperformed controls on the math and
environment tests;
• WEMS Spanish primary home language students significantly outperformed controls on the math and environment tests;
• WEMS Spanish home language students also outperformed English home language
controls on both tests and scored higher than the national mean in math and the environment;
• WEMS English home language and English-proficient students significantly
outperformed controls on the environment test;
• WEMS ELL students significantly outperformed the ELL controls on the math and environment tests; and
• WEMS ELL students outperformed English-proficient controls and scored above the
national mean on both tests. African American, Native American, and white children showed greater gains in the WEMS classrooms than in the controls. However, these groups were too small for results to be conclusive. B. Generalizability of findings Similar positive findings for the effectiveness of the WEMS program in raising math achievement might be expected in other urban low-income schools with a large Hispanic population and a high proportion of ELL students. Although the number of students with a home language other than English or Spanish was small, the high posttest scores of the ELL students suggest that this group also would benefit from the WEMS program. It should also be noted that almost all subgroups in the WEMS classes performed better than controls, including English-proficient and English primary home language children. Because the English-proficient children generally scored higher on the pretest, their gains were not as large but remained significantly higher than the controls’. C. Significance to educators 1. Testing School districts that use the SAT10 as a measure of student achievement will note the consistent gain in scores pretest to posttest of students in the WEMS classes compared to controls, as well as the difference between the two groups in those gains. 2. Closing the gap The strong performance of WEMS students with Spanish or another primary home language and WEMS ELL students suggests that the WEMS program may be an effective strategy in closing the academic gap between these students and English-proficient students.

55
The WEMS Spanish home language students made greater gains and outperformed their control counterparts and the WEMS and control groups of English home language students. They surpassed the national mean with a posttest score of 58.46 in math and 56.81 in the environment. Similarly, the WEMS ELL students made greater gains and outperformed both WEMS and control groups of non-ELL (English-proficient) students. Although they scored the lowest on the pretest, this group scored the highest on the posttest in math (57.90) and the environment (57.48). These results suggest that the WEMS program helps both English speakers and ELL students, but may help ELL students more. The WEMS program aims to provide a degree of individualized instruction and tracking of progress that a teacher or aide can only provide during one-on-one interactions. While teachers noted that some students continued to need one-on-one help, the WEMS program efficiently provided enough individualization to suit the majority of students’ needs. Several teachers commented that their ELL students were slow to catch on to the program but over time these students became more comfortable and were able to effectively interact with the software. Some teachers found that sitting with a child for a session or two to provide instruction and guidance in their primary language improved the student’s understanding of the program. It would seem that once ELL students learned the mechanics of the program and acquired some basic instructional language they were able to take advantage of the features of the program (consistency of language, repetition, and visuals) to experience success. It is also possible that ELL students received extra academic help, and that this accounted for their strong showing in comparison with the non-ELL controls. However, each WEMS category (ELL, non-ELL, English primary home language, and Spanish primary home language) significantly outperformed its control counterpart. Therefore the difference in performance would seem to be due to the WEMS program. 3. Technology in education The role of technology in education is two-fold: to harness the capabilities of technology to further educational goals, and to train students in the use of technology as a tool to apply to different endeavors. The WEMS program meets these roles as it tracks student progress, delivers reports to the teacher, and adapts to the needs of the students, essentially serving as a supplementary classroom teacher. The WEMS technology also provides a different modality to help children learn. In addition, simply using the program familiarizes children with technology. For example, some teachers commented that their girls seemed more comfortable with the computers than girls had been in the past. These results from a first-year implementation (with only partial use of the supporting materials) coupled with the enthusiastic response of teachers and principals to the program suggest that the WEMS program could be expanded to all kindergarten classrooms in these schools and in similar schools and districts across the country, particularly those with high Hispanic and ELL populations. In general, findings from this evaluation suggest that implementation of the WEMS program in early childhood classrooms could be an effective strategy to help close the achievement gap for at-risk children, particularly for ELL and Spanish primary home language students.

56
D. Contributing factors to effectiveness Factors affecting the effectiveness of the program appeared to include the quality of the program itself, teacher and principal buy-in, and the support received from Pearson Digital Learning. The fact that the WEMS program resulted from five years of study by a team of educators and software developers and was based on best practices in early childhood education ensured that the program had a practical base and was founded on scholarly expertise. By building it on national and state standards, the developers at the Waterford Institute tried to align the content with that of school districts around the nation and well-accepted national assessments that measure achievement. Furthermore, the developers designed the software to provide individualized instruction, assessment and reteaching in a varied and attractive presentation with feedback and summaries available to the teacher. Teachers noted the high quality of the graphics, a feature that adults and children have generally come to expect in non-educational products. Another factor in the effective implementation of the program was that the principals were eager to use the program and were the first to approach the district and Pearson Digital Learning. Teachers had a favorable view toward using computers and other technology in the classroom and were willing to try the program. Furthermore, the dedication and enthusiasm of the teachers for their work was evident in the class visits. A third factor was the support teachers received from the school technology personnel and Pearson Digital Learning. This support included training and trouble-shooting. Correlations between WEMS usage and the math pretest score were negative, suggesting that children with low math achievement were assigned extra sessions. The correlation between WEMS usage and math gains was positive, which suggests an increased rate of mastery of skills and concepts was achieved through product use. The correlation between WEMS usage and the environment posttest was weaker than math but still positive. It is possible that the content of the WEMS program and the environment test were not as strongly aligned as compared to the math. E. Limitations of the study and suggestions for further research One WEMS Kindergarten used the program but had no record of usage. Students in this class were assigned a usage of zero, even though their usage was suspected to be high. This class was included in the ITT group but excluded from the subgroup analyses. Low numbers of white, African American, Native American and Asian students meant that the program’s effectiveness with these ethnic groups could not be adequately evaluated. Further areas of research regarding the effectiveness of the WEMS program could include:
• Evaluating program effectiveness with larger samples of white, African American, Native American and Asian students;
• Analyzing student achievement with relation to the number of WEMS skills actually mastered by a student rather than the minutes of usage;
• Following the same cohort over time to determine the long-term effectiveness of the WEMS program;
• Studying the effectiveness of the program after two or three years of use, when implementation could be considered more complete.

57
APPENDIX A TEACHER SURVEY Waterford Early Math & Science (WEMS) Study
Part 1—for all K-2 teachers
Name ______________________ School _________________ Grade _____________ Date ______________________ Educational level: BA BA+ MA/MS MA/MS + PhD Certifications _____________________________________________________ Years of teaching experience _______ Years teaching this grade ________ What supplementary math program(s) do you use in addition to the TUSD curriculum? ______________________ What supplementary science program(s) do you use in addition to the TUSD curriculum? ____________________ TEACHING MATH AND SCIENCE 1. How much time does each student spend on all math activities (computers, instruction, experiments, math games, etc.) in class weekly? _________________ 2. How much time does each student spend on all science activities (computers, instruction, experiments, math games, etc.) in class weekly? _________________
How often do you . . . . .?
Not yet
As needed
1-2 times a month
1-2 times a week
3-5 times a week
3. Send home student math or science materials with instructions for parents to use with their children
4. Give math or science homework 5. Assign activities to individualize math or science instruction
6. Evaluate or check student progress in math or science 7. Use hands-on math or science activities in the class (experiments, manipulatives, etc.)
8. Use cooperative learning in math and/or science activities in class
9. Use music or songs with math or science lessons TECHNOLOGY ATTITUDES AND USE
Do you agree or disagree with the statement?
Strongly disagree
Disagree No opinion
Agree Strongly agree
10. Content knowledge is more important in this grade than computer skills.
11. Using computers motivates my students. 12. Computers help me maximize the time and effort devoted to instruction.
13. Computers help me individualize instruction. 14. Using computers can help me teach math and/or science better.
15. Using computers for instruction creates an additional burden for teachers.
16. A computer helps me keep records such as grades and attendance.
17. A computer is useful for finding resources for my classes.
18. A computer is useful for developing student materials. 19. I feel confident in dealing with computer problems my students might have with classroom computers.
20. I feel comfortable assigning my students computer-based lessons in math and/or science.

58
21. How many computers (in good working order) are there in your classroom? ___________ 22. What other technology do you use in your classroom? Smartboard Electronic AV (music CD, DVD) Other______________________________ GENERAL SATISFACTION 23. How satisfied are you with your students’ progress in math at this point? Very dissatisfied Dissatisfied Neutral Satisfied Very satisfied 24. How satisfied are you with your students’ progress in science at this point? Very dissatisfied Dissatisfied Neutral Satisfied Very satisfied 25. How engaged are the students in the math lessons in general? Very disengaged Disengaged Neutral Engaged Very engaged 26. How engaged are the students in the science lessons in general? Very disengaged Disengaged Neutral Engaged Very engaged SUPPORT 27. Do you have a teaching assistant in your classroom? ___________ How many hours a week? ________ 28. What activities do parents regularly participate in? Please check:
Volunteer in classroom Volunteer elsewhere in school Use the take-home materials Help their child with homework Other ______________________
Comments about the math and/or science programs:
Thank you very much for your input!

59
Part 2 – for teachers using Waterford Early Math & Science program only
IMPLEMENTATION OF THE WEMS PROGRAM Name ____________________________ Grade ___________________ WEMS Level _____________ USEFULNESS AND SUPPORT How helpful were these elements in supporting your math and science classes?
Did not use Detrimental/ Distracting
Not helpful
Helpful
Very helpful
29. WEMS program 30. Initial training in the WEMS program 31. Ongoing technical support from Waterford 32. WEMS Overview 33. Getting Started Guide 34. Take-home student materials 35. Teacher Resource Crate supplementary materials 36. Masters and Worksheets 37. Class Summary Reports 38. Individual Reports 39. Songs 40. Videos/DVDs 41. Student books 42. What support is there in your school for the WEMS program? Check any/all:
Meetings with all the teachers using the WEMS program (aside from training sessions) Grade-level meetings of teachers using the WEMS program Informal exchanges among teachers using WEMS Active involvement of principal in supporting the WEMS program and solving difficulties Technical support for computer issues Other ____________________________
LEVEL OF IMPLEMENTATION
How often do you . . . . .?
Not yet As needed
1-2 times a month
1-2 times a week
3-5 times a week
43. Print Class Summary Reports 44. Print Individual Reports 45. Assign specific activities to correlate with TUSD curriculum
46. Use the take-home student materials in the class 47. Use the supplemental Teacher Resource Crate 48. Play the WEMS videos/DVDs in class 49. Demonstrate WEMS activities on the computer 50. Refer to the Overview booklet 51. Refer to the Getting Started Guide 52. Print and send home certificates 53. Sing the WEMS songs/ play the music in class 54. When did you send home the videos/cassettes? __________________________________________________ 55. How do you send home the take-home materials? Please check:
All at once According to their progress on the computer Send home the same materials to the whole class Check out “library” system Have not used them yet
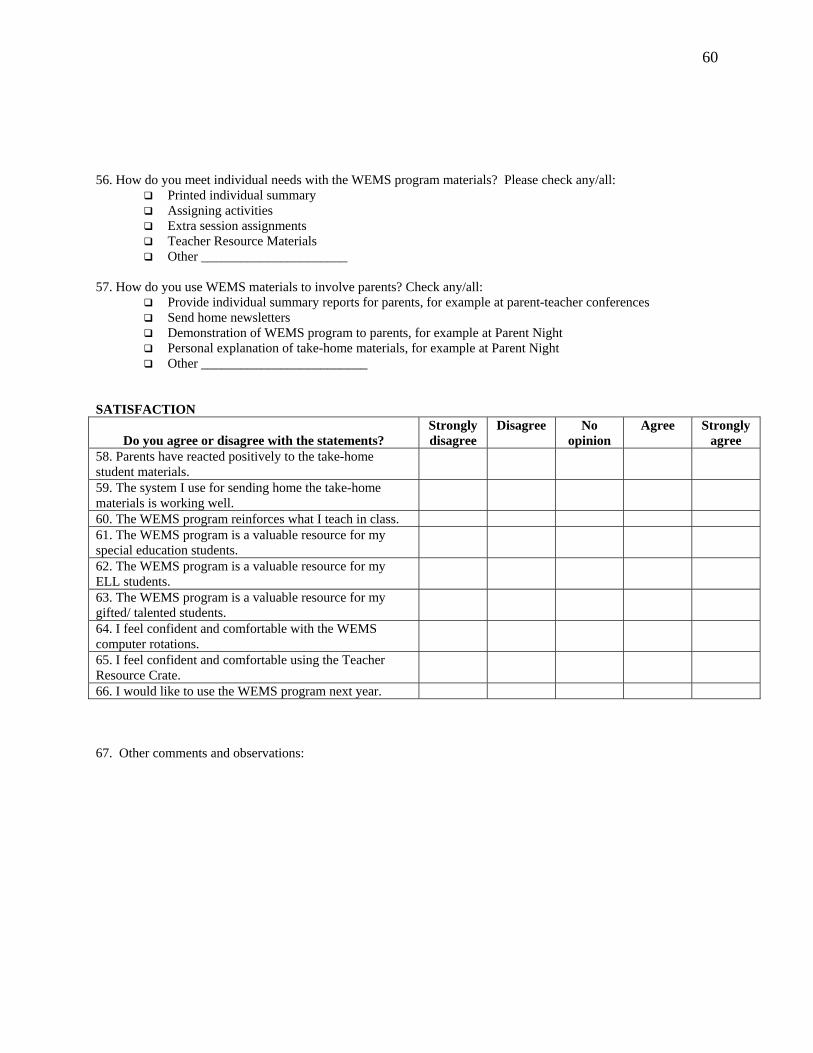
60
56. How do you meet individual needs with the WEMS program materials? Please check any/all:
Printed individual summary Assigning activities Extra session assignments Teacher Resource Materials Other ______________________
57. How do you use WEMS materials to involve parents? Check any/all:
Provide individual summary reports for parents, for example at parent-teacher conferences Send home newsletters Demonstration of WEMS program to parents, for example at Parent Night Personal explanation of take-home materials, for example at Parent Night Other _________________________
SATISFACTION
Do you agree or disagree with the statements?
Strongly disagree
Disagree No opinion
Agree Strongly agree
58. Parents have reacted positively to the take-home student materials.
59. The system I use for sending home the take-home materials is working well.
60. The WEMS program reinforces what I teach in class. 61. The WEMS program is a valuable resource for my special education students.
62. The WEMS program is a valuable resource for my ELL students.
63. The WEMS program is a valuable resource for my gifted/ talented students.
64. I feel confident and comfortable with the WEMS computer rotations.
65. I feel confident and comfortable using the Teacher Resource Crate.
66. I would like to use the WEMS program next year. 67. Other comments and observations:

61
APPENDIX B COMMENTS FROM TEACHER SURVEYS Experimental
• I feel that students really like using the computers. They feel risk-free and yet they feel that they know how to use them.
• Excellent program! It has helped my students learn concepts & skills much quicker. • Everyone got one session every day. • I only delved into using the computers this year, if we continue to use this program next
year I would like to try using some of the other materials. It would be nice to have some training to cover those materials and time to look through with ideas how to best use them.
• The math and science programs were excellent. • I would like more training in assigning specific activities to correlate with TUSD
curriculum. • I think the Waterford program is helpful. We rarely do science outside of Waterford.
I’m a long-term substitute so I don’t know how my lessons vary from their normal teacher’s. I’ve only been working with this class for a few months.
• I was only a substitute. I did not even know that all of these resources (the teacher guide, take home materials, etc.) even existed. For this reason I answered unknown to the majority of the questions. The only thing I know is that the students worked on Waterford everyday (though much more often with literacy than math). The students enjoyed working on the computer. They seemed to retain the information. They loved the songs. I used the print outs (individual and class reports) once at the end of the year to help decide their math grades.
• I loved using the WEMS program with my students. At this point in the year, I feel that I am becoming more knowledgeable and flexible incorporating the WEMs resource materials into my classroom routines. I wish that I had received more training early in the school year.
• I have really enjoyed having this program in my classroom. I feel the students especially enjoy the science.
• It reinforces lessons that I also do. Control
• Not enough time to plan. No enough people to re-teach/individualize. • I don’t have the math/science Waterford computer program, just Successmaker. I would
rather have WF math & science.

62
REFERENCES Cassady, J. C., & Smith, L. L. (2005). The impact of a structured integrated learning system on
first-grade students; reading gains. Reading & Writing Quarterly 21, 361-376. Cope, R., & Cummings, J. (2001). Evaluation of the Waterford Early Reading Program in
Madisonville Consolidated Independent School District. Retrieved June 2, 2006 from www.shsu.edu
Ellenberg, J. H. (1996). Intent-to-treat analysis versus as-treated analysis. Drug Information
Journal, 30, 535-544. Harcourt Assessment, Inc. (2004). Stanford Achievement Test series, Tenth Edition technical
data report. San Antonio: Author. Harcourt Educational Measurement. (2002). Stanford Achievement Test series, Tenth Edition
compendium of instructional standards. San Antonio: Author. Hecht, S. A., & Close, L. (2002, January). Emergent literacy skill and training time uniquely
predict variability in responses to phonemic awareness training in disadvantaged kindergarteners. Journal of Experimental Child Psychology, 82, 93-115.
Lachin, J. M. (2000). Statistical consideration in the intent-to-treat principle. Control Clinical
Trials, 21(3), 167-86. Little, R., & Yau, L. (1996). Intent-to-treat analysis for longitudinal studies with drop-outs.
Biometrics, 52(4), 1324-1333. Pearson Digital Learning. (2005). Waterford Early Math & Science. Retrieved April 26, 2005
from www.pearsondigital.com Powers, S., & Price-Johnson, C. (2006). Evaluation of the Waterford Early Reading Program in
kindergarten 2005-06. Tucson, AZ: Creative Research Associates. Torgerson, D. J., & Torgerson, C. J. (2003). Avoiding bias in randomized controlled trials in
educational research. British Journal of Educational Studies, 51(1), 36-45. Tracey, D. H. (2000, October). The Waterford Early Reading Program: Research orientation,
studies and findings. Available from www.waterford.org Tucson Unified School District. (n.d.b) TUSDStats: School Profile. Retrieved November 15,
2005 from www.tusd.az.us Tucson Unified School District. (n.d.c) TUSDStats: School Quality Survey. Retrieved January
10, 2006 from www.tusd.az.us

63
Walberg, H. J. (2001, December). Final evaluation of the Reading Initiative: Report to the J.A. & Kathryn Albertson Foundation Board of Directors. Available from www.waterford.org
Waterford Institute (n.d.a). Background research. [Website]. Retrieved August 20, 2005 from
www.waterford.org Waterford Institute (n.d.b). Waterford Early Math & Science research summary. Scottsdale, AZ:
Pearson Digital Learning.