evaluation of transportation projects in northern … · evaluation of transportation projects in...
TRANSCRIPT

Evaluation of Transportation Projects in
Northern Virginia Transportation District
HB 599 Study Overview
Kanti Srikanth And David Roden
NVTA Technical Committee
February 19, 2014

Presentation Outline
Genesis and Context
Statutory Framework
Goals and Objectives
Study Team and Coordination
Tasks and Process
Study Schedule
Selecting Projects to Evaluate
Evaluating Selected Projects (Performance Measures, Ratings)
Overall Modeling Approach
Travel Demand And TRANSIMS Simulation
Next Steps 2

3
Study Genesis and Context
2012 VA-GA: HB 599 / SB 531 §33.1-13.03:1
Publish Project Ratings
Governs
allocations (Non-transit
capacity adding
projects)
Informs
allocations
CTB / Others
Evaluating and Rating at
Least 25 Significant Projects 2013 VA-GA: HB 2313
various sections§15.2.4838.1
NVTA Fund Statewide H R
30%
Local
70%
Regional
Statutory Framework For Study
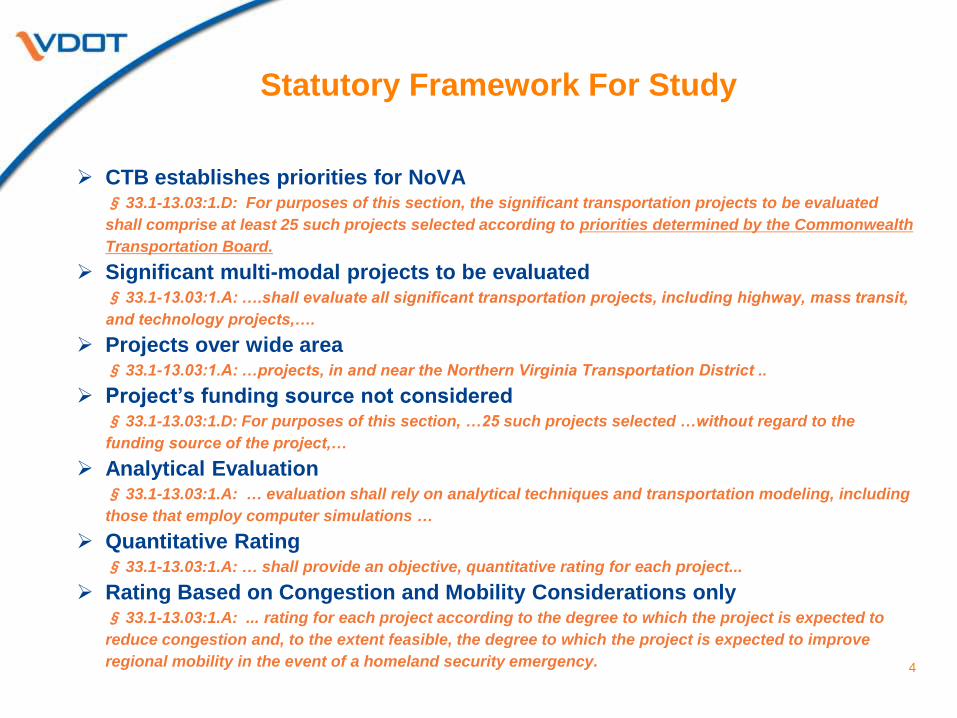
CTB establishes priorities for NoVA § 33.1-13.03:1.D: For purposes of this section, the significant transportation projects to be evaluated
shall comprise at least 25 such projects selected according to priorities determined by the Commonwealth
Transportation Board.
Significant multi-modal projects to be evaluated § 33.1-13.03:1.A: ….shall evaluate all significant transportation projects, including highway, mass transit,
and technology projects,….
Projects over wide area § 33.1-13.03:1.A: …projects, in and near the Northern Virginia Transportation District ..
Project’s funding source not considered § 33.1-13.03:1.D: For purposes of this section, …25 such projects selected …without regard to the
funding source of the project,…
Analytical Evaluation § 33.1-13.03:1.A: … evaluation shall rely on analytical techniques and transportation modeling, including
those that employ computer simulations …
Quantitative Rating § 33.1-13.03:1.A: … shall provide an objective, quantitative rating for each project...
Rating Based on Congestion and Mobility Considerations only § 33.1-13.03:1.A: ... rating for each project according to the degree to which the project is expected to
reduce congestion and, to the extent feasible, the degree to which the project is expected to improve
regional mobility in the event of a homeland security emergency. 4
Study Goals And Objectives
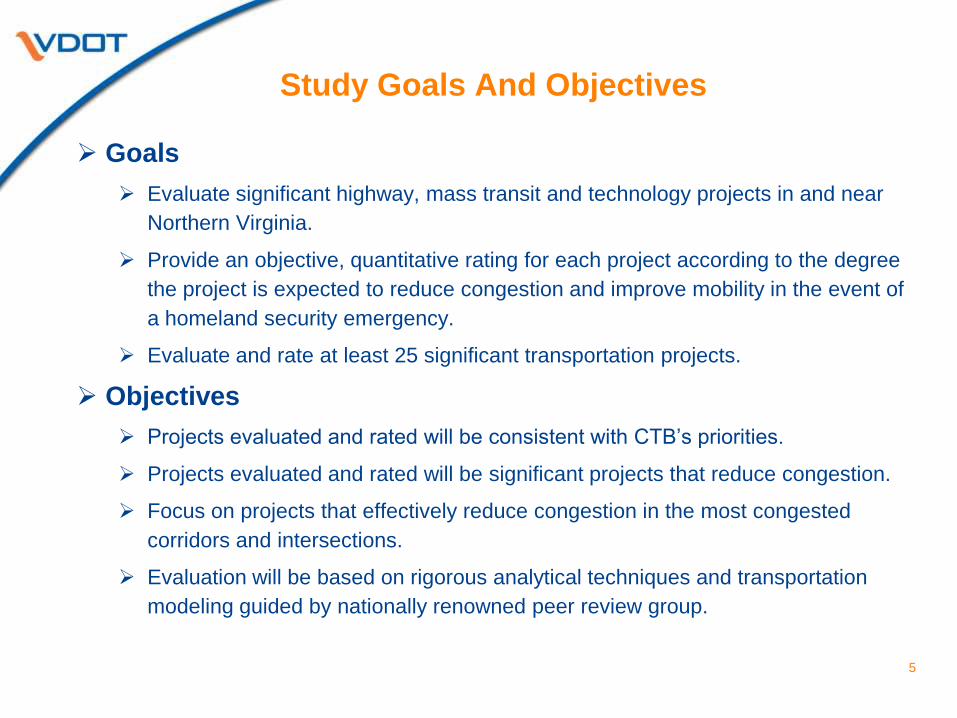
Goals
Evaluate significant highway, mass transit and technology projects in and near
Northern Virginia.
Provide an objective, quantitative rating for each project according to the degree
the project is expected to reduce congestion and improve mobility in the event of
a homeland security emergency.
Evaluate and rate at least 25 significant transportation projects.
Objectives
Projects evaluated and rated will be consistent with CTB’s priorities.
Projects evaluated and rated will be significant projects that reduce congestion.
Focus on projects that effectively reduce congestion in the most congested
corridors and intersections.
Evaluation will be based on rigorous analytical techniques and transportation
modeling guided by nationally renowned peer review group.
5

6
Co-ordination
Overall Aspects
CTB
CTB NoVA Representatives
NVTA Board
Co-ordination
Technical Aspects
NVTA Member Jurisdictions
Other NoVA localities
Transit Commissions
Peer Review Group
• Texas Transportation
Institute (TTI)
• Center for Urban
Transportation
Research (CUTR)
Study Team
Agencies
VDOT/DRPT
Consultants AECOM
Decision Lens
Travesky & Associates
Belcher Consultants
Study Team And Coordination

7
Study Tasks and Process
Study Priorities
From CTB (10/17/201)
Consistent with
CTB priorities?
Is it regionally
significant?
Will it Reduce
Congestion?
Select 40 Eligible Projects (Project Package)
NVTA – Coordination
CTB - Approval
Technical Analysis
Transportation Modeling
Travel Demand Forecasting
Traffic Operational Analysis
Project Nominations (Hwy./Tran./Tech.)
CTB & NVTA
Project Ratings (Performance Measures)
Congestion Reduction
Emergency Mobility
Project Evaluation (MOEs):
Multimodal Congestion & Emergency Mobility
Defined in coordination with
NoVA CTB members and NVTA
Select Projects to Evaluate:
Are Significant and will Reduce Congestion
Defined in coordination with
NoVA CTB members and NVTA

Study Schedule
8
Identify Existing and Future
Congestion Problems
Project
Selection
Analyze and Evaluate Projects
Detailed ^
Project Rating
9 10 11 12 1 2 3 4 5 6 7 8 9 10 11 12
2013 2014
Materials for public outreach
Project
Selection
Method
Project
Evaluation
Measures
Project
Rating *
* Basic modeling (Like TA2040) ^ Demand And Operational modeling

Project Selection Model
Designed to screen projects that are not significant or do not have
congestion reduction potential from the detailed analysis
Tier One Screening: Six CTB Priority Principles (Yes / No)
Tier Two Screening: Three categories of criteria (Quantitative)
A. Project Significance
5 Attributes – project type, designated corridors, high travel volume,
connects activity centers, connects major facilities
B. Congestion Reduction Potential
5 Attributes – congestion severity, congestion duration, person
hours of delay, adds capacity, reduces vehicle trip
C. Homeland Security Mobility
1 Attribute – facility and operational improvements
9

Project Selection - Tier One Screening
CTB Priorities
Assessment = project consistent with at least one of the following
priorities (Yes / No)
Preserve and Enhance Statewide Mobility through the Region
Increase Coordinated Safety and Security Planning
Improve the Interconnectivity of Regions and Activity Centers
Reduce the Cost of Congestion to Virginia Residents and Businesses
Increase System Performance by Making Operational Improvements
Increase Travel Choices to Improve Quality of Life for Virginians
10
Project Selection - Tier Two Screening
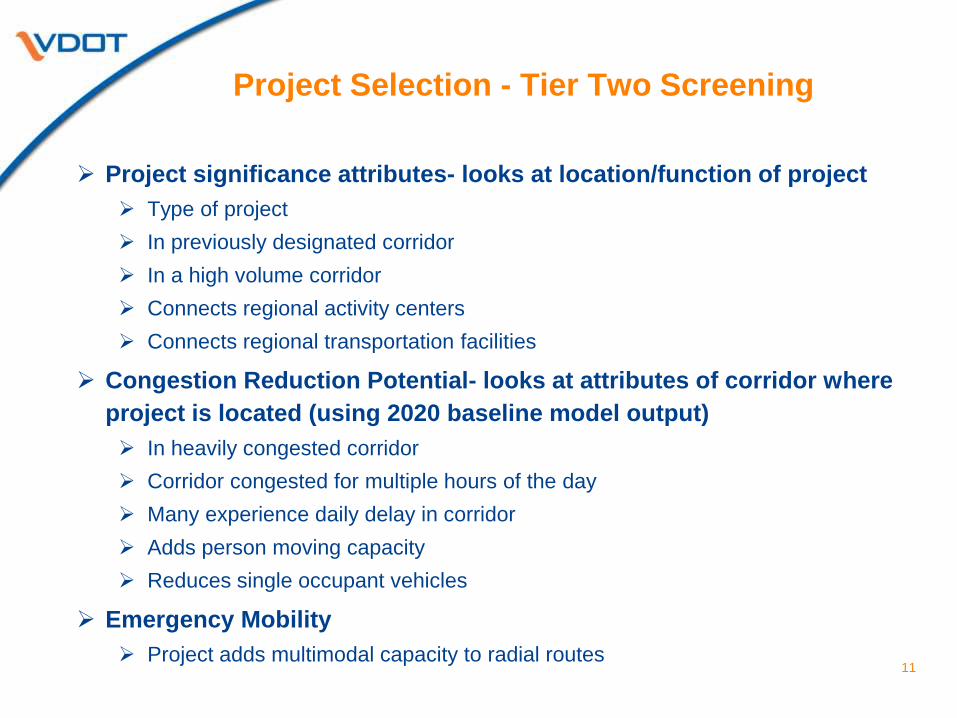
Project significance attributes- looks at location/function of project
Type of project
In previously designated corridor
In a high volume corridor
Connects regional activity centers
Connects regional transportation facilities
Congestion Reduction Potential- looks at attributes of corridor where
project is located (using 2020 baseline model output)
In heavily congested corridor
Corridor congested for multiple hours of the day
Many experience daily delay in corridor
Adds person moving capacity
Reduces single occupant vehicles
Emergency Mobility
Project adds multimodal capacity to radial routes 11

Project Selection - Tier Two Screening:
Project Attributes & Stakeholder Weights
12
Number Project AttributeScore
Range
Stakeholder
Weights
Max.
Score
55.5% 55.5
1 Type of Project (Highway/Transit/Technology) 0 or 100 3.1% 3.1
2 In a Designated Corridor 0 or 100 12.9% 12.9
3 In a High Volume Corridor 0 to 100 15.2% 15.2
4 Connects Regional Activity Centers 25 to 100 16.3% 16.3
5 Connects Regional Transportation Facilities 0 / 50 / 100 8.0% 8.0
36.5% 36.6
6 In a Heavily Congested Corridor 0 to 100 5.7% 5.7
7 Corridor is Congested for Multiple Hours in a Day 25 / 50 / 100 9.3% 9.3
8 Many People Experience Delay Daily 25 / 75 / 100 8.1% 8.1
9 Adds Person Moving Capacity 0 / 50 / 100 8.9% 8.9
10 Reduces Single Occupant Vehicles 25 / 75 / 100 4.6% 4.6
8.0% 8.0
11 Improves Movement / Adds Capacity on Radial Routes 0 / 50 / 100 8.0% 8.0
100.0% 100.0
Is the Project Significant?
Does the Project have the Potential to Reduce Congestion?
Does the Project have the Potential to Improve Emergency Mobility?
Total Project Selection Score
Project Evaluation
13
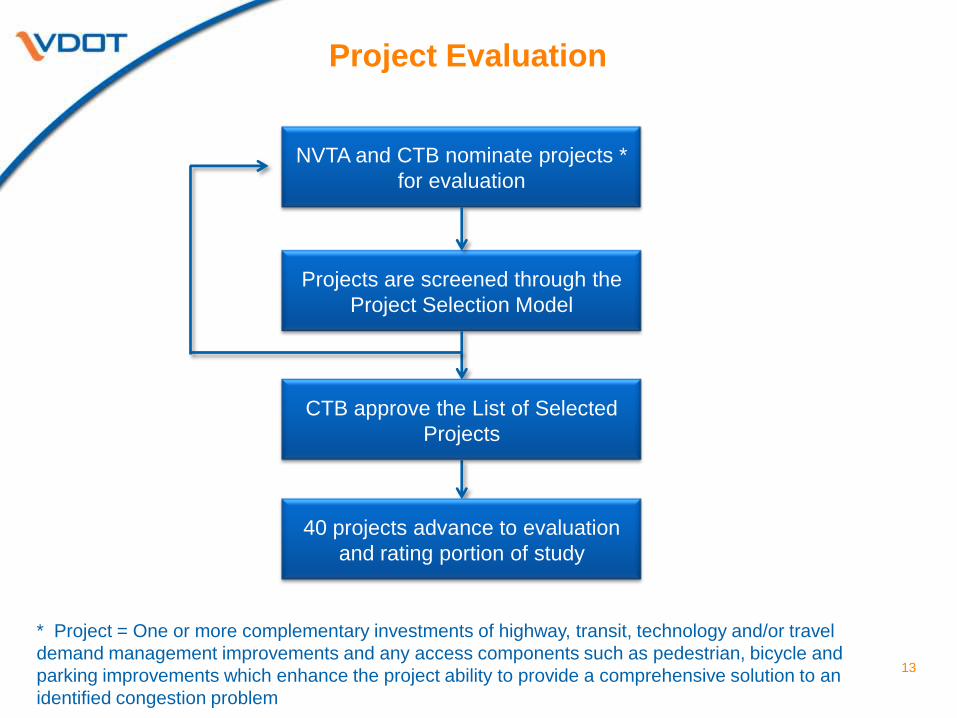
NVTA and CTB nominate projects *
for evaluation
Projects are screened through the
Project Selection Model
40 projects advance to evaluation
and rating portion of study
CTB approve the List of Selected
Projects
* Project = One or more complementary investments of highway, transit, technology and/or travel
demand management improvements and any access components such as pedestrian, bicycle and
parking improvements which enhance the project ability to provide a comprehensive solution to an
identified congestion problem

Project Evaluation Framework
Projects will be evaluated and rated based on how well they reduce
congestion and improve mobility during emergencies
The change in performance measures will be calculated for each project
using the TPB regional demand model and TRANSIMS simulation software
The performance measure weights developed through the stakeholder
engagement process will determine the relative importance of each
performance measure
A weighted congestion reduction or mobility improvement score will
be assigned to each performance measure for each project
The sum of the weighted score of all of the performance measures will
constitute the project’s congestion reduction / mobility improvement
rating
14

Project Evaluation Performance Measures
Congestion Duration – Reduction in the number of hours of the day auto and transit
passengers experience heavily congested travel conditions
Person Hours of Delay – Reduction in the number of person hours of travel time above free
flow travel time
Person Hours of Congested Travel in Automobiles – Reduction in the number of
person hours of travel in automobiles and trucks on heavily congested facilities
Person Hours of Congested Travel in Transit Vehicles – Reduction in the number of
person hours of travel in buses and trains on heavily congested facilities or in crowded vehicles
Transit Crowding – Reduction in the number of transit route miles experiencing crowded
conditions
Accessibility to Jobs – Increase in the number of jobs that can be reached from each
household based on a 45 minute travel time by automobile and a 60 minute travel time by transit
Emergency Mobility – Increase in the person hours of travel time resulting from a 10 percent
increase in peak hour trip making
15

Evaluation and Rating Process
16
Absolute Change in each
Performance Measure
(MOE) for each Project
Travel Demand and
Simulation Models
Assign a Score (0-100) to
each MOE
Apply Blended Weights to
the MOE Scores
Sum Weighted MOE Scores
= Project Rating
Stakeholder Input
Based on 100 points for
the greatest absolute
change in each MOE (with and without the project)

Project Rating Using Performance Measures
17
1 Congestion Duration 0 to 100 27.9% 27.9% * S21 27.9% * S41
2 Person Hours of Delay 0 to 100 20.3% 20.3% * S22 20.3% * S42
3 Person Hours of Congested Travel in Automobiles 0 to 100 15.4% 15.4% * S23 15.4% * S43
4 Person Hours of Congested Travel in Transit Vehicles 0 to 100 11.8% 11.8% * S24 11.8% * S44
5 Transit Crowding 0 to 100 11.5% 11.5% * S25 11.5% * S45
6 Accessibility to Jobs 0 to 100 9.5% 9.5% * S26 9.5% * S46
7 Emergency Mobility 0 to 100 3.6% 3.6% * S27 3.6% * S47
100% 2020 Rating 2040 Rating
1. Attribute weights determined through the stakeholder consensus building process
2. S21-S47 represent the project performance score from the modeling process
MOE
Impact on Congestion
Impact on Mobility
Project Rating
Stakeholder
Weights1
Score (S)
RangePerformance Measure
Evaluation Score
20202 20402

Overall Modeling Approach
Authorizing Legislation
Use transportation models and computer simulations to provide an
objective, quantitative rating of significant transportation projects…
Projects will be evaluated and rated based on how well they reduce
congestion and improve mobility during emergencies
The proposed analytical process combines the TPB regional model
with a dynamic travel simulation
TPB regional model generates zone-to-zone demand in four time periods
TRANSIMS distributes demand to activity locations and seconds of the day
Dynamic user equilibrium routing and simulation estimates the congestion
impact and calculates performance measures
18

TPB Travel Model Travel Demand
19
TPB Travel Model (Version 2.3.52)
2020 and/or 2040 Round 8.2 Land Use
Proposed Project
Trips by Purpose/Mode for Four Time Periods
2020 and/or 2040 CLRP Network
2020 and/or 2040 Project Network
4 Speed Feedback
Loops
Intermediate Outputs Input to TRANSIMS

TRANSIMS Simulation Convergence
20
Trip Time and Location Details
Time-dependent Network
Router
Travel Plans for each Traveler
Simulator
Performance Measures
15 minute Link Flows and Travel Times

Next Steps (Planned)
January 31 NoVA Localities Submit Projects to NVTA for Funding and HB 599 Study
February 7 2020 Baseline Congestion Estimates Distributed to Stakeholders
February 20 NVTA Meeting
NVTA initial list of project nominations submitted to VDOT/DRPT
NVTA review of performance measures and rating system
March ?? NVTA Meeting / Workshop
Concurrence / approve projects selected for analysis and rating
March 19 CTB Meeting
Concurrence / approve projects selected for analysis and rating
March 21 –
June 20 Technical Analysis / Transportation Modeling
June 30 Project Ratings
July 1 –
October 30 Detailed Technical Analysis / Simulation Modeling
December Final / Detailed Project Ratings and Study Report
21

THANKS!
Evaluation of Transportation Projects in Northern Virginia Transportation District
NVTA Technical Committee
February 19, 2014
Questions / Comments