evaluation of user satisfaction with olap recommender ...negre/fichiers_joints/ijbis14.pdf ·...
TRANSCRIPT

Evaluation of user satisfaction with OLAPrecommender systems: an application to RecoOLAP ona agricultural energetic consumption datawarehouse
Sandro BimonteIRSTEA, UR TSCF, Campus des Cézeaux,63173 Aubiere, France**Corresponding author
Elsa Negre
LAMSADE, CNRS UMR 7243, Paris-Dauphine University, Place duMaréchal de Lattre de Tassigny, 75016 Paris, France
Abstract: OLAP and Datawarehouse (DW) systems are technologies intendedto support the decision-making process, enabling the analysis of a substantialvolume of data. Decision makers explore warehoused data using OLAP operatorsto discover new trends and/or confirm business hypotheses. In the era of BigData, the size of warehoused data has increased substantially, and the data havebecome increasingly difficult to use. One of the goals of recommender systemsis to help users navigate large amounts of data. OLAP recommender systemshave recently been proposed in the literature because the multidimensionalanalysis process is often tedious because the user may not know what theforthcoming query should be. However, user satisfaction with these systemshas not yet been investigated. Indeed, only time and space performances andclassical information retrieval metrics (e.g., accuracy) have been studied onfictive DWs and users. Thus, this work is the first study of the usefulness ofOLAP recommender systems from the decision maker’s point of view. Indeed,to the best of our knowledge, although several works have proposed OLAPrecommender systems, they did not evaluate them against real-world data andusers. With our experiments on a spatial DW concerning agricultural energeticconsummation issued from the Energetic French Project, we prove that OLAPrecommendation is useful via a real-world case study and confirm the importanceof these academic tools.
Keywords: OLAP, Datawarehouses, Recommender Systems, Evaluation
Reference to this paper should be made as follows: S. Bimonte and E.Negre (2014) ‘Evaluation of user satisfaction with OLAP recommendersystems: an application to RecoOLAP on a agricultural energetic consumptiondatawarehouse’, Internation Journal of Business Information Systems, Vol. x,No. x, pp.xxx–xxx.
Biographical notes:Sandro Bimonte is born in 1978, he is researcher at Irstea, and more exactlyhe is at TSCF. He obtained his PhD at INSA-Lyon, France (2004-2007). From2007-2008, he carried out researches at IMAG, France. He is Editorial Boardmember of International Journal of Decision Support System Technology, andInternational Journal of Data Mining, Modelling and Management and memberof the Commission on GeoVisualization of the International Cartographic

2 S. Bimonte and E. Negre
Association. His research activities concern Spatial Data Warehouses and SpatialOLAP, Visual Languages, Geographic Information Systems, Spatio-temporalDatabases and GeoVisualization.
Elsa Negre received her Ph.D. in Computer Sciences in 2009 from François-Rabelais University of Tours, France. She was a postdoctoral fellow atUniversité du Québec en Outaouais (UQO), Canada in 2010-2011, then atLaboratoire d’Informatique Nantes-Atlantique (LINA), France in 2011. She iscurrently an Assistant Professor at Paris-Dauphine University (since september2011), France. Her research interests include recommender systems, similaritymeasures, information systems and knowledge management, data warehousing,social network analysis, early warning systems and smart cities. Dr. Negreauthored and co-authored more than 20 publications in refereed journals andconferences.
1 Introduction
One of the goals of recommender systems is to help users navigate large amounts of data.The existing recommender systems are usually categorized into content-based methods andcollaborative filtering methods (Adomavicius and Tuzhilin, 2005). Content-based methodsrecommend to the user items similar to the ones that interested him in the past, whereascollaborative filtering methods recommend to the user items that interested similar users.Recommender systems, regardless of the used method, are used in many different domains(e.g., Salehi (2013); Salehi et al. (2013); Sharma and Suman (2013, 2014)).
Traditional OLAP users interactively explore a cube by launching a sequence ofqueries over a datawarehouse (DW), which we call an analysis session (or session forshort) in the following. Applying recommendation technology to databases, particularly forrecommending queries, is an interesting topic (Chatzopoulou et al., 2009; Khoussainovaet al., 2009). It is of particular relevance to the domain of multidimensional databases,where OLAP analysis is inherently tedious because the user must navigate large data cubesto find valuable information, often not knowing what his/her forthcoming queries shouldbe (Cariou et al., 2008; Jerbi et al., 2009a; Negre, 2009).
The evaluation of recommender systems is a challenging task due to the many possiblescenarios in which such systems may be deployed. Traditional evaluation metrics (e.g.,Mean Absolute Error - MAE and Root-Mean Squared Error - RMSE (Willmott et al.,1985), Recall and Precision) for recommenders are biased toward the particular techniquesused to select the items to be shown, and they do not consider the main goal of anyrecommender: to guide the user towards useful/interesting objects (Herlocker et al., 2004;Hernández del Olmo and Gaudioso, 2008; Mortensen, 2007; Palanisamy and Sha, 2014;Tabaei and Fathian, 2014).
In DW and OLAP, some works address the usability of these types of systems (Chenet al., 2000; Golfarelli and Rizzi, 2011) by proposing a set of quantitative parameters, suchas the number of dimensions and facts, and user-oriented satisfaction parameters. However,these oriented parameters are not adequate for establishing a framework for evaluatingOLAP recommender systems for three reasons: (i) they concern the overall DW systemwithout a special focus on querying process; (ii) they do not define user guidelines forquantifying the correctness of the recommended query; and (iii) they do not propose theparameters for conducting experiments.

Evaluation of OLAP recommender systems 3
(a) Temporal dimension (b) Spatial dimension
Figure 1: Temporal and Spatial dimensions
Thus, the contributions of this paper are twofold. First, we define a framework forquantitatively evaluating user satisfaction, by defining how users can affirm whethera recommended query is interesting, and by defining the parameters for conductingexperiments (users and query categories). Second, this work is the first study of theusefulness of OLAP recommender systems (e.g., Jerbi et al. (2009a), Negre (2009)).Indeed, to the best of our knowledge, although several works have proposed OLAPrecommender systems, they did not evaluate them against real-world data and users. Withour experiments, we prove that OLAP recommendation is useful in real-world case studies.
This paper is organized as follows. The next section explains some of the mainconcepts. Section 3 details the main components of our case study: the used datawarehouseand the evaluated recommender system. Section 4 gives our experimental protocol. Section5 discusses some experiments and provides an interpretation of their results. Section 6presents some related works. We conclude and draw perspectives in Section 7.
2 Main concepts
In this section, we present the main datawarehouse and OLAP and the recommendersystem concepts.
2.1 Datawarehouse and OLAP
Datawarehouses and OLAP systems enable the analysis of huge amount of data thathave been modeled according to the multidimensional model (Kimball and Ross, 2002).Warehoused data are stored as dimensions and facts. Dimensions represent the analysisaxes, and they are organized in hierarchies with several levels. Instances of levels are calledmembers. Facts are the analysis subjects, and they are described by numerical indicators(i.e., measures). These measures are aggregated using classical SQL functions (e.g., SUM,MIN, MAX) when moving from detailed to coarser levels using OLAP operators (Inmon,1992). Indeed, OLAP operators allow users to explore warehoused data by climbing anddescending the hierarchies using the Roll-Up and Drill-Down operators, respectively, orselecting a subset of the warehoused data using the Slice operator.
Let us consider a retail application. The application’s multidimensional model iscomposed of three dimensions: a temporal dimension with day, month and year levels(whose members are shown in Figure 1a); a spatial dimension composed of stores,cities, departments and regions (whose members are shown in Figure 1b); and a thematicdimension representing the products. The measure is the sales, and it is aggregated using

4 S. Bimonte and E. Negre
the SUM function. Using this multidimensional model, the decision makers can ask forqueries combining all the dimensions levels, such as “What is the total sales per month,product and city?” or “What is the total sales per day, product and region?”. Let n be thenumber of levels of all dimensions. Then, decision makers are provided with 2n possibleOLAP queries. Moreover, each level can contain several members, increasing the possiblewarehoused data views that are needed/useful for the decision makers. Specifically, moredata is stored in the DW, and more analysis possibilities are provided to the decision makersbut at the same time, the DW becomes difficult to explore.
DW and OLAP systems are usually implemented using a multi-tier relationalarchitecture. The first tier is the datawarehouse tier, which handles the complex datastructures used to represent measures and dimensions (Kimball and Ross, 2002). It isusually implemented using a Data Base Management System (DBMS) (e.g., PostgreSQLor Oracle). The second tier is the OLAP server (e.g., Mondrian or MS Analysis Services),which implements the multidimensional model and the OLAP operators. The third tier isthe OLAP client (e.g., JPivot), which visualizes OLAP queries using the pivot table andother graphical displays.
The de-facto standard language for OLAP servers is MDX (Microsoft, 1998). MDX isa language used to define OLAP queries and to provide advanced calculations.
2.2 Recommender Systems and Recommendations for OLAP
Recommender systems are a particular form of information filtering designed to presentinformation items (e.g., movies, music, books, images, web pages) that may interest theuser. Here, in our multi-user context, the goal is to present MDX queries that may beinteresting for a user session of queries. To define the recommended queries, we use ananalogy with Web search, where it has been shown that what is seen at the end of a sessioncan be used to enhance further searches. Indeed, even in our case, it makes sense to considerthat if the session ended on this particular query, it is because the user found something ofinterest. We adopt this point of view and simply define a recommended query to be the lastquery of a candidate session. The best recommendations are the recommended queries thatare the closest to the last query of the current session in the sense of a distance betweenqueries.
We consider the retail application of the previous subsection and suppose that eachyear, the same queries concerning the total sales per month, product and city; per trimester,product and department; and finally, per year, product and region are launched. If a userlaunches for a new year a new query, such as the total sales per month, product and city, therecommender system could, for example, recommend as a recommended query the queryof the total sales per year, product and region. This recommendation can be very usefulto the new user, especially if the user does not know what an appropriate query might be,what data compose the datawarehouse, or if there is too much data and the user does notknow where to start his/her analysis.
3 Case study
In this section, we introduce the DW application and the recommender system used in ourevaluation.

Evaluation of OLAP recommender systems 5
Figure 2: Energy-use spatial datawarehouse conceptual model
3.1 Energetic datawarehouse
The utilized DW was conceived in the context of a French national project, Energetic.This project aims to integrate energetic data about agricultural farm activities to producereferential Life Cycle Assessment values and to manage energetic consummations(Bimonte S., 2014). Figure 2 presents the conceptual schema of the spatial DW. Themeasures used are the area worked (surface_w), the amount of product (input representedwith “intrant”, and output denoted with “extrant”) used during work or no work (denotedwith “w” and “nw”, respectively), the duration in hours, and the distance traveled(distance_w and distance_nw). The measures are aggregated using the sum and averageover all dimensions.
The eight dimensions are as follows: Campaign - production cycles expressed in years(e.g., wheat produced in 2009); Time - classical temporal dimension, in which days aregrouped by month and year; and Products - the input and output (intrant and extrant)products (the products are grouped recursively into larger classes of products); Operators- people who perform the operation; Equipment - machines and tools used; Location - thespatial dimension that groups plots by farm, department, and region; Productions - type ofproduction (e.g., wheat); and Technical Operations - the technical operations performed,which are grouped by functions.
Using this spatio-multidimensional model, it is possible to represent and aggregateenergetic values according to different analysis axes, such as the fuel consumption per plot,technical operation, year, and production.
The data are collected by means of manual files and sensors and are stored in the SpatialDBMS PostGIS, which provides native support for storing and querying spatial data.
The SOLAP Server used in our approach is GeoMondrian. GeoMondrian is afull-featured SOLAP server that defines spatio-multidimensional concepts using anXML mapping file with a relational schema and that supports MDX, which is the

6 S. Bimonte and E. Negre
de-facto standard query language for OLAP servers. We visualize queries using theSOLAP client MAP4DECISION with the XMLA web services on top of GeoMondrian.MAP4DECISION allows one to explore aggregated views of information, interactivelydrill down to obtain more detailed views, dynamically intersect different themes of interest,and instantaneously obtain statistical charts, diagrams, and thematic maps.
For example, the MDX query corresponding to the crosstab displayed in Figure 5 isSELECT Crossjoin( Crossjoin( Crossjoin( Crossjoin( Crossjoin(Crossjoin([Attelage].[All Attelages], [Campagne].[All Campagnes]),[Localisation].[All Localisations]), [Operateur].[All Operateurs]),[Operation_technique].[All Operation_techniques].[all].[Fertilisation]),[Produits].[All Produitss].[all].[energie indirecte]), [Temps].[All Tempss])ON COLUMNS,[Measures].[intrant_quantite_w] ON ROWSFROM [Energetic]
3.2 RecoOLAP
The goal of the utilized recommender system, RecoOLAP (Giacometti et al., 2008, 2009;Negre, 2009), is to help the user navigate the data cube. As an answer, RecoOLAP exploitswhat the other users did during their previous navigations as a basis to recommend tothe current user what his/her next query could be. Thus, it is a generic framework thatrecommends MDX queries and that uses the server log, i.e., the set of previous sessionslaunched to navigate the data cube and the sequence of queries of the current session.
The principle, as illustrated Figure 3, consists of the following: (1) Pre-treating the log;(2) Generating candidate recommendations by searching the log for sessions matching thecurrent session, and subsequently predicting what could be the next query; and (3) Rankingthe candidate recommendations in an pertinent manner for the user.
This framework is generic because each of these steps is parameterized with one ofmore functions. By changing these parameters, the way recommendations are computedchanges. For example, according to Negre (2009), the possible parameters are (but are notlimited to) (i) Two pre-treating functions, one using the k-medoid algorithm, and the otherone being the identity; (ii) Two matching functions, one allowing for sessions matchingthe current session and the corresponding position in the log session (i.e., subsequences)and the other one returning the most similar session(s) (using the Levenshtein distance(Levenshtein, 1966) between sessions) and, five session representatives: successor, last,union, intersection or medoid; (iii) Two ranking methods for candidate queries, one basedon the proximity between the query to be recommended and the query representing thecurrent session (using the distance between queries1 dγqueries), and the other one based onthe user profile.
Four combinations/types of recommendations have previously been validated from anobjective point of view (according to Negre (2009)): ClusterH, ClusterSP, EdH and EdSP.Table 1 summarizes these recommendations.
4 Experimental protocol
The traditional frameworks for the evaluation of recommender systems focus onalgorithmic performance. In this paper, we focus on user satisfaction; specifically, we

Evaluation of OLAP recommender systems 7
Figure 3: Recommender framework
Distance Log Matching Session Rankingbetween members pretreating function representative
ClusterH Hamming distance K-medoid Subsequences Medoid Proximityalgorithm
ClusterSP Shortest path K-medoid Subsequences Medoid Proximityalgorithm
EdH Hamming distance Identity Levenshtein distance Successor ProximityEdSP Shortest path Identity Levenshtein distance Successor Proximity
Table 1 Summary of recommendation combinations

8 S. Bimonte and E. Negre
focus on the way users can determine if the recommended query is useful.
According to Chen et al. (2000), we have identified two main questions that reflect theuser satisfaction based on the system behavior:
Question 1. Does the recommended OLAP query represent information similar to thatin one of the current analytical session and with good precision, i.e., pertinent information?
Question 2. Is the response time of the recommendation system tolerable ?
The proposed evaluation framework is based on these two main questions and isperformed by diverse users on different OLAP queries, as described in Section 4.1.
Question 1 is used to evaluate whether the recommendation is associated to similarityand to evaluate the recommendation semantic performance of the system.
Question 2 (response time) is important because OLAP queries should be resolved ina short time to enable an interactive analysis. Question 2 is a Boolean question, where 1indicates a time lower than the tolerable response and 0 indicates otherwise.
OLAP is an explorative process; thus, the response time must be less than 10 secondsfor an OLAP query.
In Table 2, our evaluation framework for OLAP recommendation systems is presented.The two main questions are evaluated for each combination of users and OLAP querytypes as defined in the following sections. Then, the evaluated global value is: Question 1* Question 2 (where Question 1’s answer ∈ [[0; 3]], and Question 2’s answer ∈ [[0; 1]]).
4.1 Users and queries
The DW developed in the Energetic project can provide answers to questions from twotypes of users: Farm managers and Life Cycle Assessment (LFC) practitioners. Thesetwo categories of users have different Information Technology skills and decision-makingneeds. Because recommendations are addressed to users with different profiles (Chen et al.,2000), it is mandatory to evaluate our proposal against different types of decision makersto determine whether the quality of the recommended queries depends on user skills. Then,in our framework, we identify two types of users: Skilled and Unskilled. Skilled users aredecision makers with OLAP and/or information system knowledge.
Moreover, OLAP analysis on DW can be performed in different ways. For example,from the perspective of farm managers, a useful OLAP (i.e., (aggregated) indicators) querywould be the number of interventions by culture. For LFC practitioners, questions aboutlife cycle assessment inventories are important. For example, it may be interesting to knowhow much is required to weed a plot of wheat and the average consumption of fuel requiredto weed the entire farm per year. In particular, LFC experts use the DW to compare LFCreference values for some technical operations (e.g. plowing) with warehoused data. Thesequeries are characterized using only a subset of DW dimensions because LFC referencevalues are not available, for example, per operator, equipment, month and plot. Thosequeries require aggregate queries along some dimensions. An example is shown on Figure4 where the LFC expert is interested in the fertilization technical operations. We call thistype of queries “LFC queries”.
The other two types of queries are defined by farm managers to improve their energeticconsummations. The first type of queries concerns the analysis of energies used for the

Evaluation of OLAP recommender systems 9
User × Query Skilled UnskilledAggregated queries
Detailed queries
Table 2 Evaluation framework
Session type Query UserLFC technical operation Aggregated Skilled
Farm time Detailed UnskilledSkilled
Farm technical operation Detailed UnskilledAggregated
Table 3 Analytical sessions
Figure 4: Aggregated query: LFC query example
Figure 5: Detailed query: Farm time query exampleFigure 6: Lowestrecommendation rank evaluation (0)example
different technical operations (intrant measure), and the second type of queries are used toanalyze the performances of operators (“duree” measure) (Figure 5). We call these typesof queries “Farm Intrant queries” and “Farm time queries”, respectively. These queries aredefined using two particular measures and using all dimensions of the DW because detaileddimension levels are needed. Let us note that “LFC queries” and “Farm Intrant queries”are defined on the same measure (intrant_measure), but the dimension levels are different.In summary, OLAP analysis can be performed in two ways: Aggregated queries (e.g.,LFC queries) and Detailed queries (e.g. “Farm Intrant queries” and “Farm time queries”).Testing our recommendation framework against these three types of queries is necessaryto evaluate the generic character of our proposal.
4.2 Semantic ranking evaluation system
To quantify the semantic goodness of the recommended query2 we have defined fourcategories of values from 0 to 3. A value of 0 is assigned by users to recommendedqueries that they consider to be completely useless, and a value of 3 is associated withqueries that are well suited to the decision makers’ needs. Because users provide their

10 S. Bimonte and E. Negre
Figure 7: Highest recommendation rank evaluation (3) example
evaluation without any quantitative parameter, to keep the ranking evaluation system usableby decision makers, we have decided to only use 4 classes because in this way, the rankingtask can be easily performed by our users.
Let us now show some examples of user evaluation scores. Figure 6 shows an examplefor a score of 0. In this scenario, the farmer is analyzing the performances of operatorslooking for “duree” measure and the recommended query uses the intrant measure, whichis not interesting for him.
In contrast, in the same analysis scenario, a score of 3 is associated with queries with the“duree” measure and with detailed dimension levels (especially the operator dimension),as shown in Figure 7.Finally, it is important to note that we have asked users to evaluate recommended queriesby only considering dimension levels involved in the queries because our framework doesnot consider measure values. For this reason, the query in Figure 7 is ranked with the bestvalue even if the measure value does not present any value.
5 Experiments and results
In this section, we detail the data used in our study and the system architecture that wetested. Then, we interpret the results of the pertinence analysis that we conducted on theinstantiations on the given data with our system.
5.1 Log and current sessions
The used recommender system, RecoOLAP, requires a data cube and a set of sessions overthis cube as input. The used cube is the one corresponding to the Energetic DW presentedin Section 3.
The log containing a set of (previous) sessions was obtained by logging sessions ofqueries launched on our cube by some users (these users are presented in Section 4.1). Ourlog is composed of 7 sessions, where each session contains between 7 and 23 queries.
Each current session is launched by a current user (which has the same expertise as theusers presented in Section 4.1). We have 10 current sessions (2 sessions for each of the5 possibilities) navigating different parts of the cube, where each current session containsbetween 1 and 3 queries. Table 3 lists the 5 analytical sessions that we have evaluated.

Evaluation of OLAP recommender systems 11
Figure 8: Architecture of the system
5.2 System
The log and current sessions are launched, logged and treated using RecoOLAP.First, each query launched by a user on the data cube is logged into the DBMS Postgres(PostgreSQL, 2013) via the OLAP server Mondrian (Pentaho, 2013), which obtains ananswer. Then, the query sessions of the previous users are logged in a log of sessionsof queries. The session of queries of the current user, called the current session, and thesessions in the log are loaded into the application that generates the recommendations:RecoOLAP . During the recommendation process, RecoOLAP accesses the OLAPserver Mondrian. Finally, the system outputs to the current user the ordered set ofrecommendations. Queries are launched and displayed by the user through JPivot. Thisapplication is developed in Java using JRE 1.6.0-27, Postgres 9.1.10 and Mondrian3.3.0.14703. All tests are conducted with a core i5-2520M (2.5 Ghz × 4) with 8 GB ofRAM using Linux Ubuntu 12.04.
5.3 Pertinence analysis
What we want to test is the pertinence for the user of the recommended query. In thissection, we focus only on Question 1 because Question 2 (response time) has already beenevaluated as being good in Negre (2009) using a quantitative variable measured in seconds.Thus, given the data cube and the log presented in Section 5.1, the system recommendsa query per current session (also presented in Section 5.1) launched by one of the currentusers. Then, the user gives a score between 0 and 3 to the recommended query outputted bythe system. We test each current session with each instantiation presented in Section 3.2:ClusterH, ClusterSP, EdH and EdSP, with 3 possible γ values (γ = 0, γ = 0.5 and γ = 1)that are used in the distance between queries (dγqueries).
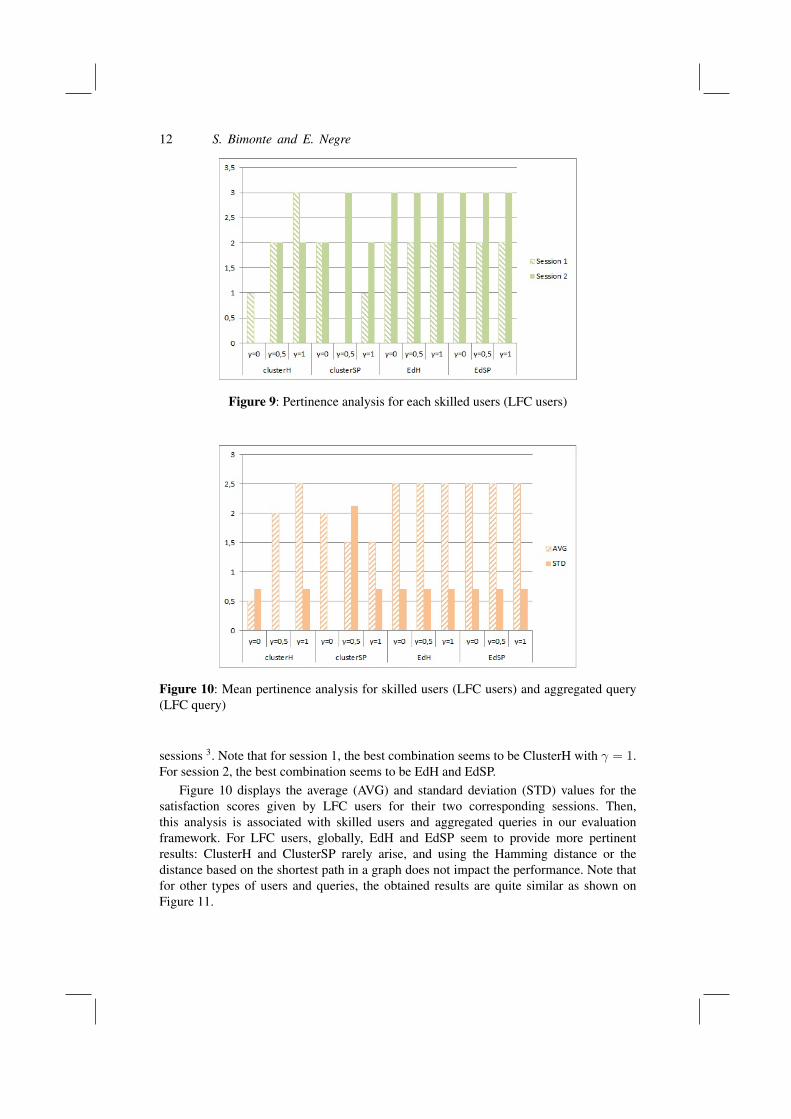
The analysis was conducted for each type of query and for each type of user (cf. Table3). Figure 9 displays the satisfaction scores given by LFC users for their two corresponding
12 S. Bimonte and E. Negre
Figure 9: Pertinence analysis for each skilled users (LFC users)
Figure 10: Mean pertinence analysis for skilled users (LFC users) and aggregated query(LFC query)
sessions 3. Note that for session 1, the best combination seems to be ClusterH with γ = 1.For session 2, the best combination seems to be EdH and EdSP.
Figure 10 displays the average (AVG) and standard deviation (STD) values for thesatisfaction scores given by LFC users for their two corresponding sessions. Then,this analysis is associated with skilled users and aggregated queries in our evaluationframework. For LFC users, globally, EdH and EdSP seem to provide more pertinentresults: ClusterH and ClusterSP rarely arise, and using the Hamming distance or thedistance based on the shortest path in a graph does not impact the performance. Note thatfor other types of users and queries, the obtained results are quite similar as shown onFigure 11.

Evaluation of OLAP recommender systems 13
Figure 11: Pertinence analysis
Indeed, Figure 11 displays the average (AVG) and standard deviation (STD) valuesof the scores given to the set of current sessions for each instantiation and for each γ.We remark that for instantiations using a clustering algorithm (ClusterH and ClusterSP),the AVG is better when γ = 0. Similarly, for instantiations using the Levenshtein distance(EdH and EdSP), the AVG is worst when γ = 1 and equivalent when γ = 0.5. Therefore,we can conclude that, on average, the more relevant results are obtained when γ = 0 andthat the Hausdorff distance allows, alone, one to obtain the best relevance (the distancebased on the dimensions contributes negatively to the distance between queries).
We also remark that for instantiations using a clustering algorithm (ClusterH andClusterSP), on average, the results of ClusterH are quite similar to those of ClusterSP. Thisalso holds true for the instantiations using the Levenshtein distance: the results of EdH arequite similar to the ones of EdSP. Therefore, we can conclude that using a distance betweenmembers based on the shortest path, or on the Hamming distance, does not seem to impactthe relevance of the recommendations. This conclusion which is quite unexpected (becausethe distance based on the shortest path considers some specific characteristics of OLAP,such as the hierarchies), can be explained by the fact that the hierarchies of our DW areparent-child relations.
Finally, with all current sessions merged, the best AVG is obtained with EdH (γ = 0or γ = 0.5), then with EdSP (γ = 0 or γ = 0.5). Furthermore, the lowest STD is obtainedwith EdH (γ = 0 or γ = 0.5), then with EdSP (γ = 0 or γ = 0.5). We consider that wehave a good relevance when the AVG is high and when the STD is low. Therefore, we canconclude that the instantiations using the Levenshtein distance (EdH and EdSP) proposethe more relevant recommendations. This conclusion based on real-world data are inaccordance with that of Negre (2009) on synthetic data.
In our experimental protocol, we have only asked decision makers to rankrecommended queries using four values to grant an easy evaluation of their satisfaction,because no research has defined what a useful recommended OLAP query is. Thus, inthis paper, by analyzing the score defined by the users of the OLAP queries provided by

14 S. Bimonte and E. Negre
the system, we have been able to define a generic framework to represent the level ofsatisfaction for an OLAP query.
We have remarked that most of the time, the lowest value of 0 is assigned whenthe recommended query does not contain the wanted measure. This means that therecommended query is not at all similar to the current analytical session. A value of 3is given when measures and dimension members are present in the recommended query;specifically, the recommended query achieves a “good precision” or level of detail. Avalue of 1 is provided when the measure is present but when no interesting dimensions areproposed. Finally, a value of 2 is assigned when the measure is present and when interestinglevels are also found in the recommended query. It is important to note that the precisionof the recommended query is defined by the involved dimensions, levels and members.Therefore, we can conclude that a good recommended query is a query that is very similarto previous ones.
In light of these conclusions, we can claim that EdH with γ = 0 seems to be theinstantiation that returns the more relevant recommendations.
6 Related Work
Recommender systems are a particular form of information filtering designed to presentinformation items (e.g., movies, music, books, images, web pages) that may interest theuser.
Recommender systems have been studied in many fields, including cognitive science,information retrieval (Baeza-Yates and Ribeiro-Neto, 1999; Salton, 1983), web (Baeza-Yates et al., 2004; White et al., 2007), e-commerce (Schafer et al., 2001), and web usagemining (Baeza-yates et al., 2005; Srivastava et al., 2000). The problem of recommendationcan be summarized as the problem of estimating scores for items that have not been seenby a user. Indeed, the number of items and the number of users of the system can bevery important; therefore, it is difficult for each user to see all items or that each item isevaluated by all users. It is thus necessary to estimate scores for items that have not yetbeen evaluated.
Intuitively, this valuation is usually based on the scores given by a user to other itemsand on other information that is formally described below. When it is possible to estimatethe scores for items that have yet to be evaluated, the items with the highest scores may berecommended to the user.
However, some works have focused on recommendations in the field of databases(Chatzopoulou et al., 2009; Khoussainova et al., 2009; Stefanidis et al., 2009) andproposed methods and algorithms to assist the user. There is also research in the field ofdatawarehouses analyzed by OLAP queries. Among these (see (Marcel and Negre, 2011)and (Negre, 2009) for a detailed study), some focused on exploiting user profiles andpreferences (Bellatreche et al., 2005; Golfarelli et al., 2011; Jerbi et al., 2009b), and othersfocused on the discoveries made during analyses (Cariou et al., 2008; Sarawagi, 2000) aswell as on exploiting logs containing sequences of queries previously run by other userson the same cube (Chatzopoulou et al., 2009; Giacometti et al., 2008, 2009, 2011; Sapia,1999; Yang et al., 2009). More recently, Romero et al. (2011) proposed a multidimensionalalgebra for describing analytical sessions.
In the literature, some work has been performed on evaluating several aspects of DWand OLAP systems. For example, Serrano et al. (2007) defined metrics for the analysis of

Evaluation of OLAP recommender systems 15
the understandability of multidimensional schema. Nagpal et al. (2013) and Golfarelli andRizzi (2011) defined some more general metrics for testing warehousing phases, from ETLto multidimensional schema. Finally, Aligon et al. (2014) studied similarity measures forOLAP sessions. This work is very close to our proposal because the authors provided anexperimental comparison of different similarity measures from decision maker’s point ofview and used quantitative metrics. However, this evaluation was not conducted on a real-world DW and by real decision makers, and it did not clearly explain why recommendationand similarity are related. Specifically, this study did not explain why a recommendedquery is pertinent if it is similar to previously defined OLAP queries.
In our work, we have addressed with these two limitations using the Energetic projectfor our evaluation by proving that the pertinence of a recommended OLAP query isessentially defined by its similarities as discussed in Section 5.3.
7 Conclusion and future work
In this paper, we define a framework for evaluating user satisfaction with OLAPrecommender systems , and we present an application of this framework to theOLAP recommender system RecoOLAP, which has previously proven its performanceon synthetic data, on an agricultural energetic consumption datawarehouse, Energetic.With our experiments on a spatial datawarehouse concerning agricultural energeticconsummation with different types of users and queries, we prove that OLAPrecommendation is useful via a real-world case study and confirm the importance of theseacademic tools.
To the best of our knowledge, this is the first paper to address the evaluation of usersatisfaction for OLAP recommender systems.
We are aware that this preliminary work can be improved, upon, particularly via theapproach to work on Goal Question Metric (GQM), to more precisely define (and withoutambiguities) the questions upon which the evaluation of user satisfaction is based.
In the future, we will apply our framework to others OLAP recommender systemsand datawarehouses. For example, recommender systems using user profiles could inferdifferent feedbacks. This can help us improve our framework to better take into accountthe user expectations.
References
Adomavicius, G. and Tuzhilin, A. (2005). Toward the next generation of recommendersystems: A survey of the state-of-the-art and possible extensions. IEEE Transactions onKnowledge and Data Engineering, 17(6):734–749.
Aligon, J., Golfarelli, M., Marcel, P., Rizzi, S., and Turricchia, E. (2014). Similaritymeasures for olap sessions. Knowl. Inf. Syst., 39(2):463–489.
Baeza-yates, R., Hurtado, C., Mendoza, M., and Dupret, G. (2005). Modeling user searchbehavior. In In LA-WEB 05: Proceedings of the Third Latin American Web Congress,page 242. IEEE Computer Society.
Baeza-Yates, R. A., Hurtado, C. A., and Mendoza, M. (2004). Query RecommendationUsing Query Logs in Search Engines. In Lindner, W., Mesiti, M., Turker, C., Tzitzikas,

16 S. Bimonte and E. Negre
Y., and Vakali, A., editors, EDBT Workshops, volume 3268 of Lecture Notes in ComputerScience, pages 588–596. Springer.
Baeza-Yates, R. A. and Ribeiro-Neto, B. A. (1999). Modern Information Retrieval. ACMPress / Addison-Wesley.
Bellatreche, L., Giacometti, A., Marcel, P., Mouloudi, H., and Laurent, D. (2005). Apersonalization framework for olap queries. In DOLAP, pages 9–18.
Bimonte S., Boulil K., C. J. P. M. (2014). A new sensors-based spatial olap architecturecentered on a agricultural farm energetic diagnosis tool. International Journal ofDecision Support System Technology. to appear.
Cariou, V., Cubillé, J., Derquenne, C., Goutier, S., Guisnel, F., and Klajnmic, H. (2008).Built-in indicators to discover interesting drill paths in a cube. In Song, I.-Y., Eder, J.,and Nguyen, T., editors, Data Warehousing and Knowledge Discovery, volume 5182 ofLecture Notes in Computer Science, pages 33–44. Springer Berlin Heidelberg.
Chatzopoulou, G., Eirinaki, M., and Polyzotis, N. (2009). Query recommendations forinteractive database exploration. In Proceedings of the 21st International Conferenceon Scientific and Statistical Database Management, SSDBM 2009, pages 3–18, Berlin,Heidelberg. Springer-Verlag.
Chen, L.-d., Soliman, K. S., Mao, E., and Frolick, M. N. (2000). Measuring usersatisfaction with data warehouses: An exploratory study. Inf. Manage., 37(3):103–110.
Giacometti, A., Marcel, P., and Negre, E. (2008). A framework for recommending olapqueries. In DOLAP, pages 73–80.
Giacometti, A., Marcel, P., and Negre, E. (2009). Recommending multidimensionalqueries. In DaWaK, pages 453–466.
Giacometti, A., Marcel, P., Negre, E., and Soulet, A. (2011). Query recommendations forolap discovery-driven analysis. IJDWM, 7(2):1–25.
Golfarelli, M. and Rizzi, S. (2011). Data warehouse testing: A prototype-basedmethodology. Information & Software Technology, 53(11):1183–1198.
Golfarelli, M., Rizzi, S., and Biondi, P. (2011). myolap: An approach to express andevaluate olap preferences. IEEE Trans. Knowl. Data Eng., 23(7):1050–1064.
Herlocker, J. L., Konstan, J. A., Terveen, L. G., John, and Riedl, T. (2004). Evaluatingcollaborative filtering recommender systems. ACM Transactions on InformationSystems, 22:5–53.
Hernández del Olmo, F. and Gaudioso, E. (2008). Evaluation of recommender systems: Anew approach. Expert Syst. Appl., 35(3):790–804.
Inmon, W. H. (1992). Building the Data Warehouse. John Wiley & Sons, Inc., New York,NY, USA.
Jerbi, H., Ravat, F., Teste, O., and Zurfluh, G. (2009a). Applying recommendationtechnology in olap systems. In Enterprise Information Systems, volume 24 of LectureNotes in Business Information Processing, pages 220–233. Springer Berlin Heidelberg.

Evaluation of OLAP recommender systems 17
Jerbi, H., Ravat, F., Teste, O., and Zurfluh, G. (2009b). Preference-based recommendationsfor olap analysis. In DaWaK, pages 467–478.
Khoussainova, N., Balazinska, M., Gatterbauer, W., Kwon, Y., and Suciu, D. (2009). Acase for a collaborative query management system. CoRR, abs/0909.1778.
Kimball, R. and Ross, M. (2002). The Data Warehouse Toolkit: The Complete Guide toDimensional Modeling. John Wiley & Sons, Inc., New York, NY, USA, 2nd edition.
Levenshtein, V. (1966). Binary Codes Capable of Correcting Deletions, Insertions andReversals. Soviet Physics Doklady, 10:707.
Marcel, P. and Negre, E. (2011). A survey of query recommendation techniques fordatawarehouse exploration. In EDA.
Microsoft (1998). Multidimensional expressions (mdx) reference. Available athttp://msdn.microsoft.com/en-us/library/ms145506.aspx.
Mortensen, M. (2007). Design and evaluation of a recommender system. Master’s thesis,University of Tromsø.
Nagpal, S., Gosain, A., and Sabharwal, S. (2013). Theoretical and empirical validation ofcomprehensive complexity metric for multidimensional models for data warehouse. Int.J. Systems Assurance Engineering and Management, 4(2):193–204.
Negre, E. (2009). Collaborative exploration of data cubes. PhD thesis, University of Tours(France).
Palanisamy, R. and Sha, W. (2014). An empirical analysis of user evaluation factors onattitude and intention of using a search engine. Int. J. Bus. Inf. Syst., 15(3):261–290.
Pentaho (2013). Mondrian open source olap engine. Available athttp://mondrian.pentaho.org.
PostgreSQL (2013). Postgresql open source object-relational database system. Availableat http://www.postgresql.org/.
Romero, O., Marcel, P., Abelló, A., Peralta, V., and Bellatreche, L. (2011). Describinganalytical sessions using a multidimensional algebra. In Proceedings of the 13thinternational conference on Data warehousing and knowledge discovery, DaWaK’11,pages 224–239, Berlin, Heidelberg. Springer-Verlag.
Salehi, M. (2013). An effective recommendation based on user behaviour: A hybrid ofsequential pattern of user and attributes of product. Int. J. Bus. Inf. Syst., 14(4):480–496.
Salehi, M., Kamalabadi, I. N., and Ghoushchi, M. B. G. (2013). Attribute-basedcollaborative filtering using genetic algorithm and weighted c-means algorithm. IJBIS,13(3):265–283.
Salton, G. (1983). Introduction to Modern Information Retrieval (McGraw-Hill ComputerScience Series). McGraw-Hill Companies.
Sapia, C. (1999). On modeling and predicting query behavior in olap systems. In DMDW,page 2.

18 S. Bimonte and E. Negre
Sarawagi, S. (2000). User-adaptive exploration of multidimensional data. In VLDB, pages307–316.
Schafer, J. B., Konstan, J. A., and Riedl, J. (2001). E-commerce RecommendationApplications. Data Mining and Knowledge Discovery, 5(1/2):115–153.
Serrano, M., Trujillo, J., Calero, C., and Piattini, M. (2007). Metrics for data warehouseconceptual models understandability. Inf. Softw. Technol., 49(8):851–870.
Sharma, S. K. and Suman, U. (2013). A framework of hybrid recommender system forweb personalisation. Int. J. Bus. Inf. Syst., 13(3):284–316.
Sharma, S. K. and Suman, U. (2014). A trust-based architectural framework forcollaborative filtering recommender system. Int. J. Bus. Inf. Syst., 16(2):134–153.
Srivastava, J., Cooley, R., Deshpande, M., and Tan, P.-N. (2000). Web Usage Mining:Discovery and Applications of Usage Patterns from Web data. SIGKDD Explorations,1(2):12–23.
Stefanidis, K., Drosou, M., and Pitoura, E. (2009). "you may also like" results in relationaldatabases. In Proc. of the 3nd International Workshop on Personalized Access, ProfileManagement and Context Awareness: Databases (PersDB 2009), in conjunction withthe VLDB 2009 Conference.
Tabaei, Z. and Fathian, M. (2014). Measuring and analysing customer satisfaction withmulti-criteria satisfaction analysis musa model: An electronic retailing case study. Int.J. Bus. Inf. Syst., 15(2):189–204.
White, R. W., Bilenko, M., and Cucerzan, S. (2007). Studying the use of populardestinations to enhance web search interaction. In SIGIR, pages 159–166.
Willmott, C. J., Ackleson, S. G., Davis, R. E., Feddema, J. J., Klink, K. M., Legates, D. R.,O’Donnell, J., and Rowe, C. M. (1985). Statistics for the evaluation and comparison ofmodels. J. Geophys. Res., 90(C5):8995–9005.
Yang, X., Procopiuc, C. M., and Srivastava, D. (2009). Recommending join queries viaquery log analysis. In ICDE, pages 964–975.