evaluation of variants of 3m peltor comtac tactical ... · pdf fileevaluation of variants of...
TRANSCRIPT

Evaluation of Variants of 3M Peltor ComTAC Tactical
Communication and Protection System (TCAPS) Headsets:
Measures of Hearing Protection and Auditory Performance
by Angelique A. Scharine and Rachel A. Weatherless
ARL-TR-6667 September 2013
Approved for public release; distribution unlimited.

NOTICES
Disclaimers
The findings in this report are not to be construed as an official Department of the Army position unless
so designated by other authorized documents.
Citation of manufacturer’s or trade names does not constitute an official endorsement or approval of the
use thereof.
Destroy this report when it is no longer needed. Do not return it to the originator.

Army Research Laboratory Aberdeen Proving Ground, MD 21005-5425
ARL-TR-6667 September 2013
Evaluation of Variants of 3M Peltor ComTAC Tactical
Communication and Protection System (TCAPS) Headsets:
Measures of Hearing Protection and Auditory Performance
Angelique A. Scharine and Rachel A. Weatherless Human Research and Engineering Directorate, ARL
Approved for public release; distribution unlimited.

ii
REPORT DOCUMENTATION PAGE Form Approved
OMB No. 0704-0188 Public reporting burden for this collection of information is estimated to average 1 hour per response, including the time for reviewing instructions, searching existing data sources, gathering and maintaining the
data needed, and completing and reviewing the collection information. Send comments regarding this burden estimate or any other aspect of this collection of information, including suggestions for reducing the
burden, to Department of Defense, Washington Headquarters Services, Directorate for Information Operations and Reports (0704-0188), 1215 Jefferson Davis Highway, Suite 1204, Arlington, VA 22202-4302.
Respondents should be aware that notwithstanding any other provision of law, no person shall be subject to any penalty for failing to comply with a collection of information if it does not display a currently
valid OMB control number.
PLEASE DO NOT RETURN YOUR FORM TO THE ABOVE ADDRESS.
1. REPORT DATE (DD-MM-YYYY)
September 2013
2. REPORT TYPE
Final
3. DATES COVERED (From - To)
February 2013
4. TITLE AND SUBTITLE
Evaluation of Variants of 3M Peltor ComTAC Tactical Communication and
Protection System (TCAPS) Headsets: Measures of Hearing Protection and
Auditory Performance
5a. CONTRACT NUMBER
5b. GRANT NUMBER
5c. PROGRAM ELEMENT NUMBER
6. AUTHOR(S)
Angelique A. Scharine and Rachel A. Weatherless
5d. PROJECT NUMBER
5e. TASK NUMBER
5f. WORK UNIT NUMBER
7. PERFORMING ORGANIZATION NAME(S) AND ADDRESS(ES)
U.S. Army Research Laboratory
ATTN: RDRL-HRS-D
Aberdeen Proving Ground, MD 21005-5425
8. PERFORMING ORGANIZATION REPORT NUMBER
ARL-TR-6667
9. SPONSORING/MONITORING AGENCY NAME(S) AND ADDRESS(ES)
10. SPONSOR/MONITOR'S ACRONYM(S)
11. SPONSOR/MONITOR'S REPORT NUMBER(S)
12. DISTRIBUTION/AVAILABILITY STATEMENT
Approved for public release; distribution unlimited.
13. SUPPLEMENTARY NOTES
14. ABSTRACT
The auditory effects of the 3M Peltor ComTAC III Accessory Rail Connector (ARC) and the 3M Peltor ComTAC IV Hybrid
headsets were compared to the 3M Peltor ComTAC III. Passive and active attenuation were measured in two steady-state
noise levels (85 and 105 dB A) and three microphone settings (off, low, and high). When the noise level was 85 dB A, and the
microphones were set to high, the systems provided approximately 20 dB of amplification. However, at 105 dB A, and the
microphones off, attenuation was equivalent to that of passive attenuation. The devices provided attenuation of impulsive
noise (154 dB peak) exceeding 25 dB for all measured settings. Of the three types of eartips available for the ComTAC IV, the
“skull screw” style eartips provided the most impulsive noise attenuation. Auditory localization performance was measured
for 12 listeners while wearing the ComTAC systems in combination with two Ops-Core FAST helmets (ballistic and
lightweight carbon). There were fewer front-to-back localization errors when wearing the lightweight carbon helmet than
when wearing the ballistic helmet but there was no significant difference between the ComTAC systems in their effect on
localization performance.
15. SUBJECT TERMS
auditory localization, hearing protection, TCAPS
16. SECURITY CLASSIFICATION OF:
17. LIMITATION OF
ABSTRACT
UU
18. NUMBER OF
PAGES
38
19a. NAME OF RESPONSIBLE PERSON
Angelique A. Scharine a. REPORT
Unclassified
b. ABSTRACT
Unclassified
c. THIS PAGE
Unclassified
19b. TELEPHONE NUMBER (Include area code)
(410) 278-5957
Standard Form 298 (Rev. 8/98)
Prescribed by ANSI Std. Z39.18

iii
Contents
List of Figures v
List of Tables vii
1. Introduction 1
2. Steady-State Noise Attenuation 3
2.1 Facilities and Instrumentation .........................................................................................3
2.1.1 Loudspeaker Array and Test Signal ....................................................................3
2.1.2 Auditory Test Fixture ..........................................................................................6
2.2 Independent Variables .....................................................................................................6
2.3 Dependent Variable .........................................................................................................7
2.4 Procedures .......................................................................................................................7
2.5 Data Analysis, Results, and Discussion ..........................................................................7
3. Impulsive Noise Attenuation Testing 13
3.1 Facilities and Instrumentation .......................................................................................13
3.2 Calibration .....................................................................................................................14
3.3 Testing Procedure ..........................................................................................................15
3.4 Data Analysis, Results, and Discussion ........................................................................15
4. Localization Testing 17
4.1 Participants ....................................................................................................................17
4.2 Facilities and Instrumentation .......................................................................................18
4.2.1 Loudspeaker Array ............................................................................................18
4.2.2 Rotating Chair ...................................................................................................18
4.3 Independent Variables ...................................................................................................19
4.4 Dependent Variables .....................................................................................................19
4.5 Procedures .....................................................................................................................19
4.6 Data Analysis, Results, and Discussion ........................................................................19
5. Summary and Conclusions 24

iv
6. References 25
List of Symbols, Abbreviations, and Acronyms 26
Distribution List 27
v
List of Figures
Figure 1. TCAPS devices tested: (a) 3M Peltor ComTAC IV, (b) 3M Peltor ComTAC III ARC (shown with Ops-Core FAST helmet), and (c) 3M Peltor ComTAC. ..............................1
Figure 2. Earplug types used when measuring the impulsive noise attenuation provided by the ComTAC IV TCAPS headset. (a) 3M E∙A∙R Classic foam, (b) 3M UltraFIT triple flange, and (c) 3M Skull Screws. ...............................................................................................2
Figure 3. The two Ops-Core FAST helmets (a) ballistic and (b) lightweight carbon used during the auditory localization measures. ................................................................................2
Figure 4. Schematic depicting the Listening Laboratory and the configuration of the loudspeakers and the ATF during the measurement of steady-state noise attenuation. ............4
Figure 5. (a) Waveform and (b) spectrogram of the noise recorded through the left ear of the ATF when the white noise was presented at 85 dB A. ..............................................................5
Figure 6. G.R.A.S. Acoustic Test Fixture Type 45CA (shown here with Moldex BattlePlugs inserted)......................................................................................................................................6
Figure 7. Average overall continuous noise attenuation values for each TCAPS, grouped by SA microphone setting and noise level. Error bars represent ±1 standard deviation. ...............8
Figure 8. Average overall continuous noise attenuation values for each TCAPS as a function of microphone setting. Error bars represent ±1 standard deviation. ..........................................8
Figure 9. One-third octave attenuation measured for the TCAPS devices as a function of SA microphone settings when presented noise at 85 dB A. .........................................................11
Figure 10. One-third octave attenuation measured for the TCAPS devices as a function of SA microphone settings when presented noise at 105 dB A. .................................................12
Figure 11. The measurement set up for impulse noise measurement: (a) PINS shock tube used to generate impulsive noises, (b) G.R.A.S. 40BH reference microphone, and (c) G.R.A.S. 45CA auditory test fixture used to record noise levels. ...........................................14
Figure 12. (a) Average impulsive noise attenuation measured for each TCAPS device as a function of SA microphone setting and (b) average impulsive noise attenuation measured for the ComTAC IV TCAPS device as a function of SA microphone setting and earplug type. Error bars represent ±1 standard deviation. ....................................................................16
Figure 13. Testing setup used for the localization test (subject shown here is wearing the Advanced Combat Helmet [ACH]). ........................................................................................18
Figure 14. Polar plot showing signed azimuth error as a function of TCAPS/helmet condition and azimuth. Labels indicate degree azimuth. Concentric rings indicate error. Bare indicates the bare head, without any TCAPS...........................................................................21
Figure 15. Average unsigned azimuth error as a function of head condition. Error bars represent ±1 standard deviation. ..............................................................................................22

vi
Figure 16. Polar plot showing unsigned azimuth error as a function of TCAPS/helmet condition and azimuth. .............................................................................................................23
Figure 17. Unsigned azimuth error as a function of TCAPS/helmet condition and lateral azimuth (collapsed across hemispheres). Error bars represent ±1 standard deviation. ...........23
vii
List of Tables
Table 1. Significant ANOVA results for steady-state noise attenuation (α < 0.05). .......................9
Table 2. Significant ANCOVA results for signed azimuth error (α < 0.05)..................................20
Table 3. Significant ANCOVA results for unsigned azimuth error (α < 0.05)..............................20

viii
INTENTIONALLY LEFT BLANK.

1
1. Introduction
This effort was funded by Special Operations Forces Survival, Support & Equipment Systems
(SOF-SSES) to measure the attenuation performance characteristics of three variants of the 3M
ComTAC tactical and communications protective system (TCAPS) devices in impulsive and
steady-state noise environments. Auditory localization performance was also measured to
document any effects of the TCAPS or helmets on situational awareness (SA). Three TCAPS
devices were evaluated: the 3M Peltor ComTAC III Accessory Rail Connector (ARC) headset
(ComTAC III ARC), the 3M Peltor ComTAC IV Hybrid Communication headset (ComTAC
IV), and the standard (baseline) 3M Peltor ComTAC III headset (ComTAC III) (figure 1). The
ComTAC III ARC headset attaches to the accessory rail of a helmet, and the Ops-Core Future
Assault Shell Technology (FAST)* helmet was used for all tests using the ComTAC III ARC
headset. The ComTAC IV device consists of earmuffs shaped like an inverted “U” that clamp
around the ear, but leaves the ear uncovered. It delivers communications through attached eartips
available in three types (E∙A∙R Classic foam, UltraFIT triple flange, and Skull Screws)† (see
figure 2). The Ops-Core FAST helmet comes in several forms; the standard ballistic style and the
lightweight carbon style were used in the study (see figure 3). During auditory localization
testing, the participants wore the Ops-Core FAST ballistic style helmet in combination with all
three of the TCAPS devices. Both the ballistic and the lightweight carbon helmets were worn in
combination with the ComTAC III ARC headset to measure the difference in their effect on
auditory localization ability.
Figure 1. TCAPS devices tested: (a) 3M Peltor ComTAC IV, (b) 3M Peltor ComTAC III ARC (shown with Ops-
Core FAST helmet), and (c) 3M Peltor ComTAC.
*The FAST helmet is a trademark of Ops-Core, owned by Gentex (maker of the Advance Combat Helmet) and is specifically
designed to allow the attachment of a number of components.
† The E∙A∙R Classic foam, UltraFIT, and Skull Screws are all trademarks of 3M.

2
Figure 2. Earplug types used when measuring the impulsive noise attenuation provided by
the ComTAC IV TCAPS headset. (a) 3M E∙A∙R Classic foam, (b) 3M UltraFIT
triple flange, and (c) 3M Skull Screws.
Figure 3. The two Ops-Core FAST helmets (a) ballistic
and (b) lightweight carbon used during the auditory
localization measures.
3
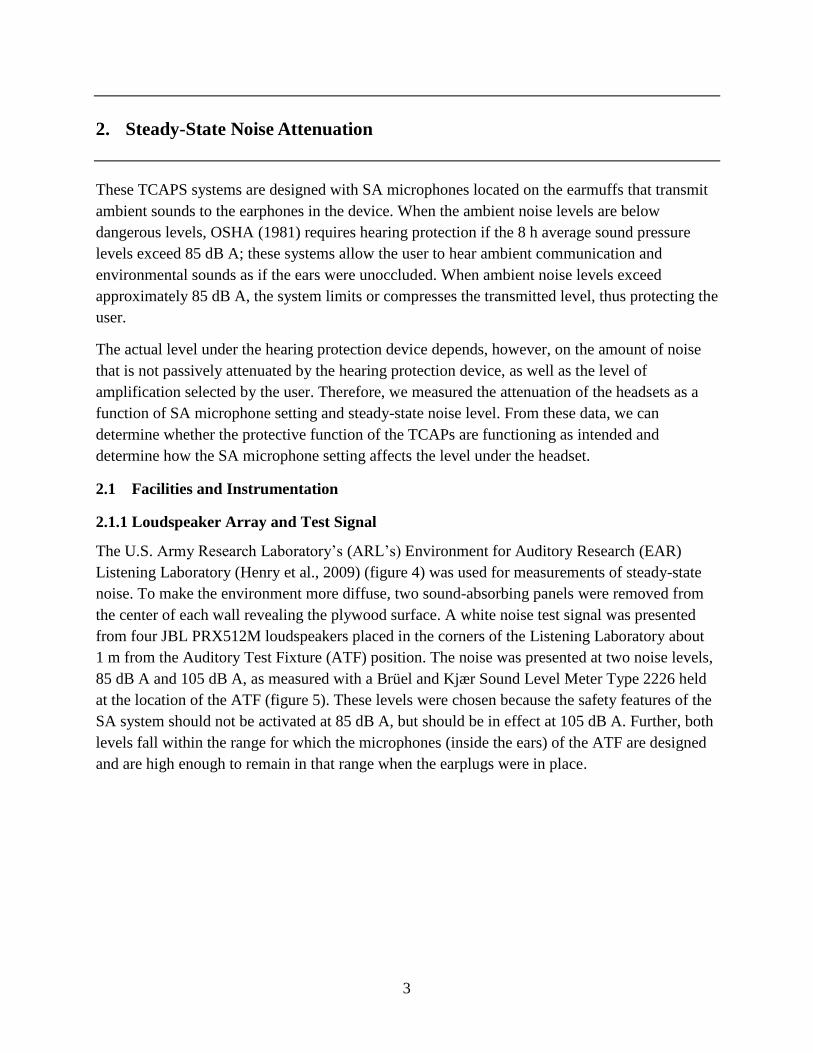
2. Steady-State Noise Attenuation
These TCAPS systems are designed with SA microphones located on the earmuffs that transmit
ambient sounds to the earphones in the device. When the ambient noise levels are below
dangerous levels, OSHA (1981) requires hearing protection if the 8 h average sound pressure
levels exceed 85 dB A; these systems allow the user to hear ambient communication and
environmental sounds as if the ears were unoccluded. When ambient noise levels exceed
approximately 85 dB A, the system limits or compresses the transmitted level, thus protecting the
user.
The actual level under the hearing protection device depends, however, on the amount of noise
that is not passively attenuated by the hearing protection device, as well as the level of
amplification selected by the user. Therefore, we measured the attenuation of the headsets as a
function of SA microphone setting and steady-state noise level. From these data, we can
determine whether the protective function of the TCAPs are functioning as intended and
determine how the SA microphone setting affects the level under the headset.
2.1 Facilities and Instrumentation
2.1.1 Loudspeaker Array and Test Signal
The U.S. Army Research Laboratory’s (ARL’s) Environment for Auditory Research (EAR)
Listening Laboratory (Henry et al., 2009) (figure 4) was used for measurements of steady-state
noise. To make the environment more diffuse, two sound-absorbing panels were removed from
the center of each wall revealing the plywood surface. A white noise test signal was presented
from four JBL PRX512M loudspeakers placed in the corners of the Listening Laboratory about
1 m from the Auditory Test Fixture (ATF) position. The noise was presented at two noise levels,
85 dB A and 105 dB A, as measured with a Brüel and Kjær Sound Level Meter Type 2226 held
at the location of the ATF (figure 5). These levels were chosen because the safety features of the
SA system should not be activated at 85 dB A, but should be in effect at 105 dB A. Further, both
levels fall within the range for which the microphones (inside the ears) of the ATF are designed
and are high enough to remain in that range when the earplugs were in place.

4
Figure 4. Schematic depicting the Listening Laboratory and the configuration of the loudspeakers and the
ATF during the measurement of steady-state noise attenuation.

5
Figure 5. (a) Waveform and (b) spectrogram of the noise recorded through the left ear of
the ATF when the white noise was presented at 85 dB A.

6
2.1.2 Auditory Test Fixture
A G.R.A.S.* Hearing-Protector ATF Type 45CA (figure 6), fitted with IEC 60711 ear simulators
and molded pinnae, was positioned in the center of the loudspeaker array and used to record the
test signals. An Echo AudioFire 12 recording interface set at a sampling rate of 192 kHz was
used to convert the analog signal to a digital format and transmit it to a laptop computer where it
was recorded using Adobe Audition 3.0.
Figure 6. G.R.A.S. Acoustic Test Fixture Type 45CA (shown here with Moldex BattlePlugs inserted).
2.2 Independent Variables
The TCAPS, noise levels, and SA microphone settings were the independent variables
investigated in the study. Three TCAPS were evaluated: the ComTAC III ARC, the ComTAC
IV, and the ComTAC III. Each system was tested for three SA microphone settings (off, low,
and high) and for two steady-state noise levels (85 and 105 dB A). Each SA microphone
setting/steady-state noise level combination was measured twice with the system removed from
the ATF and refit between measurements.
* G.R.A.S. Sound and Vibration is a Danish company that manufactures high-quality microphones.

7
2.3 Dependent Variable
The dependent variable of interest was attenuation, defined as the difference between the signals
with and without the TCAPS, as measured by the ATF.
2.4 Procedures
A G.R.A.S. 42AA sound calibrator with an adapter that allows it to be coupled to the ATF was
used to generate a signal of 250 Hz at 114 dB. The signal was recorded through each channel
(left/right ear) of the testing system for reference. The white noise test signal was then played
continuously from the loudspeakers at one of the two noise levels. A reference measurement was
made by recording the test signal with no TCAPS in place. The TCAPS device under test was
fitted to the ATF and a 5 s recording was made from both ATF ears (left−right channels)
simultaneously. The TCAPS device was then removed and reinstalled and the recording process
repeated. This procedure was repeated for each of the devices under test for each of the noise
levels (85 and 105 dB A). It should be noted that in order to ensure that the ComTAC IV 3M
E∙A∙R Classic foam earplugs (FP) were inserted correctly, the molded pinnae were removed
from the ATF, the earplugs were inserted, and then the pinnae were replaced. Similarly, to
ensure a proper seal of the ComTAC III and ComTAC III ARC earmuffs, the pinnae were
removed* during testing. These procedures were used for both the steady-state and impulsive
noise testing.
2.5 Data Analysis, Results, and Discussion
Each recording was processed using a custom MATLAB® algorithm to compute the levels for
each component octave and one-third octave band. A-weighting was then applied and the A-
weighted one-third octave, octave, and overall levels were obtained. A-weighted values were
used for all analyses reported here. For each TCAPS, overall attenuation was calculated by
computing the difference in the overall A-weighted signal level when the device was in place
compared to the level in the bare fixture. Attenuation, as a function of one-third octave and
octave band frequency was then calculated in the same manner (figures 7 and 8).
*The GRAS 45CA is advertised as a test fixture for measuring hearing protection devices and is sold with optional “molded
pinnae” for the testing of ear plugs.

8
Figure 7. Average overall continuous noise attenuation values for each TCAPS, grouped by SA microphone
setting and noise level. Error bars represent ±1 standard deviation.
Figure 8. Average overall continuous noise attenuation values for each TCAPS as a function of microphone
setting. Error bars represent ±1 standard deviation.
A three factor analysis of variance (ANOVA) was conducted on the overall attenuation values
with the independent variables being TCAPS, SA microphone setting, and presentation level

9
(table 1). There is a significant main effect of TCAPS,F(2,152) = 64.7, p < 0.01. The ComTAC
III and the ComTAC III ARC provided significantly less attenuation than the ComTAC IV.
dComTAC IV – ComTAC III = 11.0dB and dComTAC IV – ComTAC III ARC = 9.0 dB, p < 0.01.
Table 1. Significant ANOVA results for steady-state noise attenuation (α < 0.05).
Source of Variance df F ρ
TCAPS 2 64.7 0.000
SA mic setting 2 181.5 0.000
Presentation Level 1 72.4 0.000
TCAPS SA mic setting 4 41.1 0.000
TCAPS Presentation Level 2 29.3 0.000
SA mic setting Presentation Level 2 12.6 0.000
Error 152 30.3 —
The ComTAC IV system, used with the 3M E•A•R Classic tips advertises a higher noise
reduction rating ([NRR]=30) than the ComTAC III system (NRR=21), and this difference is
typical of the difference between the attenuation provided by earplugs and earmuffs. Although
well-fit foam earplugs typically attenuate more than earmuffs, it is significantly more difficult to
achieve proper insertion of ear plugs, meaning that the average user may not achieve levels as
high as that of the earmuffs. There is also a significant main effect of SA microphone setting,
F(2,152) = 181.5, p < 0.01, presentation level, F(1,152) = 72.4, p < 0.01, and an interaction of
SA microphone setting and presentation level, F(2, 152) = 12.5, p < 0.01. The interaction of SA
microphone setting and presentation level appears to be driven by the difference in attenuation
when the noise level is 85 dB A, and the SA microphones are on high as compared to when the
SA microphones are off or on low, doff - on-high = 18.1 dB and don-low - high =15.9 dB, p < 0.01.
When the SA microphones are on but the amplification is set to the lowest setting, the
attenuation is not significantly different from passive attenuation for any of the systems and at
any presentation level. However, if the SA microphones are set to their highest amplification
setting, there is less attenuation for 85 dB A than for 105 dB A. At 85 dB A, the system is not yet
attenuating sounds. It appears that when the SA microphones are set on the highest amplification
setting, this amplification is not curtailed at 85 dB A, making the actual level under the earmuff
exceed 85 dB A. Although the level exceeds 85 dB A, it should be noted that in quiet conditions,
amplification can allow a hearing-impaired listener to better hear speech than when unamplified.
In noisy conditions, amplification will not aid speech recognition for a normal-hearing user, and
will make it worse for a hearing-impaired user, because both the speech and the noise will be
amplified (Moore, 2012). Therefore, the standard procedure for SA microphone use should be
that they should be turned off when in noisy environments when steady-state noise (such as
vehicle or generator noise) exceeding 85 dB A is present as the SA microphones will cease to aid
communication.
The one-third octave attenuation levels achieved for each of the SA microphone settings are
shown for noise presented at 85 dB A (figure 9) and 105 dB A (figure 10). These data are

10
included for descriptive purposes only with no statistical analyses are reported. They are of
interest because the monaural cues used for auditory localization are in the frequency range
above 4000 Hz. Understanding the changes to spectral information that occur as a result of
passive attenuation and, additionally, the spectral profile of the sound transmitted by the SA
microphones, can provide potential causes of changes to the user’s ability to localize sounds. In
the bottom panel of figure 9, where the SA microphones are on and the amplification is set to the
highest setting, there is little attenuation below 4000 Hz, suggesting that the headsets are
amplifying frequencies below 4000 Hz, but not those above it. The attenuation above 4000 Hz is
similar to that of the passive measurements (with microphones off). This may affect auditory
spatial orientation because of the loss of spectral information above 4000 Hz.

11
Figure 9. One-third octave attenuation measured for the TCAPS devices
as a function of SA microphone settings when presented noise
at 85 dB A.

12
Figure 10. One-third octave attenuation measured for the TCAPS devices
as a function of SA microphone settings when presented noise
at 105 dB A.

13
3. Impulsive Noise Attenuation Testing
We tested all three TCAPS (ComTAC III, ComTAC III ARC, and ComTAC IV) for their
attenuation of impulsive noise with the SA microphones on low and off. It was assumed, because
both levels were above the 140 dB peak, that the shutoff function would perform similarly,
regardless of the SA microphone amplification setting. Because the ComTAC IV can be used
with three types of earplugs (figure 2), impulsive noise attenuation was also measured for each of
the earplug types.
3.1 Facilities and Instrumentation
Recordings were made using the same ATF, and Echo AudioFire system described in section
2.1.2. In addition, a G.R.A.S. 40 BH reference microphone (powered by a G.R.A.S. Power
Module Type 12AK) was used to estimate the transfer function of the ATF and to record the
signal level of each trial. A pneumatic impulse noise source (PINS) was used to present
impulsive noises for measurement (figure 11). The average impulsive noise level presented from
the PINS as measured with the reference microphone was a 154 dB peak and the standard
deviation of impulsive noises was 0.7 dB. Both the ATF and the reference microphone were
placed at 1 m from the PINS and 1 m from each other.

14
Figure 11. The measurement set up for impulse noise measurement: (a) PINS shock tube used to generate
impulsive noises, (b) G.R.A.S. 40BH reference microphone, and (c) G.R.A.S. 45CA auditory test
fixture used to record noise levels.
3.2 Calibration
A 114 dB, 250 Hz calibration signal was recorded with each microphone as the reference signal
level. Simultaneous recordings were made of two instances of impulsive noise using the
microphones of the ATF (unoccluded ears), and the reference microphone. These recordings
were used to estimate the transfer function of the ear canal. From these recordings, it was
determined that the left and right ears of the ATF contribute amplifications of 9.65 and 7.77 dB,
respectively, due to resonance in the ear canal (Shaw, 1974). Attenuation was computed as the
difference between the peak level measured by the ATF (the left and right ear each contributed

15
separate data points) and the peak level measured by the reference microphone, minus the
transfer function for that ear.
3.3 Testing Procedure
Each TCAPS was positioned on the ATF and three recordings of a PINS-generated impulsive
noise were obtained from the microphones of the ATF and the reference microphone. The
TCAPS device was then removed and replaced on the ATF and this process was repeated for
each of three samples of the ComTAC III ARC and ComTAC IV headsets with the 3M E∙A∙R
Classic foam earplugs. Two samples* were used for the ComTAC III headsets and the remaining
two ComTAC IV earplug types (3M UltraFIT triple flange and 3M Skull Screws).
3.4 Data Analysis, Results, and Discussion
Three impulsive noise signals were presented for each hearing protection device, resulting in six
attenuation values for each TCAPS device and SA microphone setting. Averages and standard
deviations were determined (figure 12a) along with the average attenuation values measured for
the different earplug types (figure 12b). The dotted line in figure 12 represents the expected cap
on actual protection due to the attenuation limits on bone conducted sound transmission.
*All of the earplugs styles should all have been tested an equal number of times; however, the alternative styles were added in
during the testing process. We made two measurements simply to show that they provided similar attenuation. In retrospect, they
did not.

16
Figure 12. (a) Average impulsive noise attenuation measured for each TCAPS device as a function of SA
microphone setting and (b) average impulsive noise attenuation measured for the ComTAC
IV TCAPS device as a function of SA microphone setting and earplug type. Error bars
represent ±1 standard deviation.

17
All TCAPS devices provided at least 25 dB of attenuation for impulsive noise. An independent
sample t-test confirmed that the difference between the amount of attenuation achieved for the
ComTAC III and ComTAC III ARC (earmuff style) as compared to the ComTAC IV (earplug
style) was significant, t(101) = –29.0, p < 0.01. ANOVA was used to evaluate the significance of
the observed differences in attenuation measured for the different ComTAC IV earplug types
(table 1). There was a main effect of earplug type, F(2, 52) = 40.0, p < 0.01. A Scheffé post hoc
test shows that the main effect of earplug type is due to the significantly greater attenuation of
the Skull Screw style earplugs (dSS-TF=7.6 dB and dSS-FP = 10.3 dB, p < 0.01) as compared to the
other two earplug types. The experimenters also noted that it seemed to be the easiest of the
earplug types to insert into the test fixture correctly.
4. Localization Testing
The ability to localize sounds was evaluated for the ComTAC III, ComTAC III ARC, and the
ComTAC IV TCAPS and compared to the bare head. Because the ComTAC III ARC TCAPS is
designed to mount on the Ops-Core FAST helmet accessory rail connector system, all TCAPS
were evaluated in combination with a helmet. To evaluate the differences in auditory spatial
perception resulting from use of the ballistic helmet versus the carbon helmet, the ComTAC III
ARC TCAPS was also evaluated in combination with the carbon helmet. For labeling purposes,
these conditions were labeled ARC-ballistic and ARC-carbon.
4.1 Participants
Twelve listeners participated in this study. Listeners were recruited from the population of
volunteers aged 18–40 years. Listeners were screened to ensure normal hearing by an
experimenter (and under the guidance of an audiologist). Listeners’ ears were inspected using an
otoscope to ensure that their ear canals were unobstructed and that there would be no
interference with the use of earplugs. Their pure tone thresholds were measured for octave
frequencies from 250–8000 Hz using calibrated audiometric equipment in a sound-treated room.
All 12 participants had pure tone thresholds no higher than 20 dB hearing level (HL) for all
frequencies screened and, thus, met the Army’s H1 hearing classification, defined in the Army
Hearing Conservation Program (DA PAM 40-501, 1998) as an average threshold level at 500,
1000, and 2000 Hz that does not exceed 25 dB HL and with no individual threshold greater than
30 dB HL, and the threshold at 4000 Hz no greater than 45 dB HL. The investigators adhered to
the policies for protection of human subjects as prescribed in AR 70-25 (1990).

18
4.2 Facilities and Instrumentation
4.2.1 Loudspeaker Array
Target stimuli were presented from a spherical loudspeaker array consisting of 57 Meyer Sound
MM-4XP miniature loudspeakers housed in the Sphere Room of the EAR (Henry et al., 2009).
Target sounds were presented from the 16 loudspeakers on the horizontal ring at 0° elevation; the
loudspeakers are located at equal intervals of 22.5° separation and the radius is approximately 2
m (figure 13).
Figure 13. Testing setup used for the localization test (subject shown here
is wearing the Advanced Combat Helmet [ACH]).
4.2.2 Rotating Chair
Each participant sat in a rotating chair at the center of the loudspeaker array on a raised platform
that placed their ears at the same elevation as the 0° loudspeaker ring. The chair was free to
rotate 360° and was equipped with an optical shaft encoder (digital compass), and a laser tracker
on the center of a horizontal bar attached to the chair in front of the participant. Although the bar
is free to rotate ±90° in pitch, it was fixed in place to allow for responses only from the
horizontal plane during this study. Participants began each trial facing 0° azimuth and then
responded by rotating the chair to point the laser in the direction from which they believed a
stimulus came, pushing a button to register their response. A computer recorded the direction of

19
the response based on the outputs of the laser tracker and the optical shaft encoder, providing
redundant positional information. During this study, the optical shaft data was used in the
analyses.
4.3 Independent Variables
There were two independent variables investigated in the study: (1) head condition and (2) sound
source azimuth. With the exception of the bare head condition, a helmet was always worn, and
with the exception of the ComTAC III ARC-carbon condition, that helmet was the Ops-Core
FAST-ballistic style helmet. Five head conditions were evaluated: Bare head, ComTAC III,
ComTAC III ARC-ballistic, ComTAC III ARC-carbon, and ComTAC IV. During testing, the SA
microphones were turned on and set to the lowest amplification setting.
There were 16 azimuth locations (0°, ±22.5°, ±45°, ±67.5°, ±90°, ±112.5°, ±135°, ±157.5°, and
180°). A 250 ms burst (with 5 ms ramps) of white noise at 70 dB A was presented from each of
the loudspeakers eight times, for a total of 144 trials per block. The order of presentation location
was varied randomly within the block. A single block of trials was presented for each of the head
conditions.
4.4 Dependent Variables
The dependent variable of interest was azimuth error, defined, as the difference in degrees
between the perceived stimulus source location azimuth (as identified by the listener) and that of
the actual stimulus source azimuth.
4.5 Procedures
After the initial audiometric screening, all participants were familiarized with the listening task
prior to initiation of their first block. Each participant was then fitted properly with the
appropriate TCAPS/Helmet system. Participants listened to blocks of stimuli that consisted of all
trials for a particular head condition. Each block lasted approximately 25 min. Participants were
given breaks between blocks to reduce the effects of fatigue. Additionally, each trial was
initiated by the participant, so additional breaks could be taken if needed.
4.6 Data Analysis, Results, and Discussion
Our objective was to measure the effects of the new helmet/TCAPS on auditory localization
ability relative to that with the bare head as a measure of SA. Localization errors made in this
study were calculated as both signed (constant) and unsigned azimuth errors. Signed error
contains information about both the magnitude and the direction of an error. Average signed
error can reveal underlying distortions of the auditory space stemming from the acoustics of the
equipment or the test space itself. However, when taken as an average, signed data
underestimates overall localization errors, because errors in opposite directions cancel each other
out. Thus, the average signed errors do not allow us to evaluate judgment precision (random
error), which is reflected by the standard deviation of localization responses (Hartmann, 1983).

20
Average unsigned error gives a better estimate of the magnitude of error and precision; therefore,
both types of error will be discussed.
Two-factor analyses of covariance (ANCOVA) were conducted for the signed (table 2) and
unsigned azimuth (table 3) error with the independent variables being head condition and sound
source azimuth. Subject ID was included as a covariate in order to account for individual
differences. Polar plots of the signed errors as a function of the TCAPS/helmet worn and the
sound source azimuth were also calculated (figure 14). In the signed error data, negative errors
indicate the subject estimated the sound source estimate was closer to the front (0°), than the
actual target location. Positive errors mean that the estimate was farther to the rear than the
actual target location. If localization errors are driven by lack of precision, estimates will fall on
either side of the target location and on average cancel out. Using average signed data will
obscure any real differences in the magnitude of errors occurring for the various helmets. This is
not to suggest that all errors are likely to be cancelled out. Differences due to an increase in
front-back confusions will result in an increase in positive errors near 0° and an increase in
negative errors near 180°. Even with no TCAPS present, it is normal to observe some differences
in error as a function of azimuth, due to front-back confusions.
Table 2. Significant ANCOVA results for signed azimuth error (α < 0.05).
Source of Variance df F ρ
TCAPS/Helmet Condition 4 65.8 0.000
Azimuth 15 521.1 0.000
TCAPS/Helmet Cond Azimuth 60 26.4 0.000
Error 8409 1560.1 —
Table 3. Significant ANCOVA results for unsigned azimuth error (α < 0.05).
Source of Variance df F ρ
TCAPS/Helmet Condition 4 277.5 0.000
Azimuth 15 197.2 0.000
TCAPS/Helmet Cond Azimuth 60 12.1 0.000
Error 8409 1522.9 —

21
Figure 14. Polar plot showing signed azimuth error as a function of TCAPS/helmet condition and azimuth.
Labels indicate degree azimuth. Concentric rings indicate error. Bare indicates the bare head,
without any TCAPS.
Wearing the TCAPS and helmet altered one’s ability to localize sounds. There was a significant
main effect for TCAPS/helmet condition for the signed azimuth error data, F(4, 8409) = 65.8, p
< 0.01. The contrast of localization with a bare head versus any TCAPS/helmet combination was
significant, F(4,8409) = 65.8, p < 0.01. The difference between localization performances with
the two helmet types ComTAC III ARC-ballistic and ComTAC III ARC-carbon, was also
significant, F(1, 3420) = 10.0, p < 0.01. As expected, there was a main effect for sound source
azimuth, F(15, 8409) = 521.1, p < 0.01, as well as an interaction between TCAPS/helmet
condition and sound source azimuth, F(60, 8409) = 26.4, p < 0.01. Larger errors were observed
when wearing TCAPS/helmet (figure 14); specifically there were increased positive errors in the
front near 0°, and increased negative errors in the rear near 180°. The differences between the
different TCAPS/helmet conditions were not significant (p > 0.5).
The signed error data allows us to detect any biases that would signal problems with the
measurement method or acoustics of the facility. The data shown here are symmetric relative to
the midline and include some small differences between the left and right hemispheres,
suggesting the errors are idiosyncratic and not of practical importance.
There were significant main effects of TCAPS/helmet condition and sound source azimuth [F(4,
8409) = 277.5, p < 0.01; F(15, 8409) = 197.2, p < 0.01] (figures 15, 16, and 17). The interaction
of TCAPS/helmet condition and azimuth was also significant [F(60, 8409) = 12.1, p < 0.01]. As

22
before, the differences between the bare head and all of the TCAPS/helmet conditions were
significant (α < 0.05) and the difference in unsigned localization error for the two helmet types is
also significant [F(4, 8409) = 277.5, p < 0.01]. The pattern of error values, larger near 0° and
180°, is consistent with what would be expected if TCAPS/helmet use were causing front−back
confusions. The carbon helmet seems to reduce the average size of errors near 0°, but this
difference is small. The practical impact of this difference may not be significant due to the fact
that visual feedback may reduce these errors.
Figure 15. Average unsigned azimuth error as a function of head condition. Error bars represent ±1 standard
deviation.

23
Figure 16. Polar plot showing unsigned azimuth error as a function of TCAPS/helmet condition and
azimuth.
Figure 17. Unsigned azimuth error as a function of TCAPS/helmet condition and lateral azimuth (collapsed
across hemispheres). Error bars represent ±1 standard deviation.

24
5. Summary and Conclusions
Three variants of the 3M Peltor ComTAC TCAPS were evaluated for their attenuation of steady-
state and impulse noise and their effect on auditory localization as a measure of SA.
Measurements of attenuation of steady-state noise show that when the devices’ SA microphones
were set at the highest amplification levels, ambient noise presented at 85 dB A was amplified
and exceeded the 85 dB A level at the ear. However, when the noise level was 105 dB A, the SA
microphones shut off transmission to the ear, regardless of the amplification setting.
Measurements of impulsive noise attenuation show that all the TCAPS provided at least 25 dB of
attenuation when impulsive noise of approximately 154 dB peak was recorded with the SA
microphones off and at the lowest amplification setting. When the SA microphones were active
and in their lowest setting, transmission of impulse noise was not measurable, providing
attenuation equivalent to that of passive attenuation. Of the three types of earplug types tested for
the ComTAC IV, the Skull Screw style provided the greatest attenuation.
Measures of the effect of TCAPS on auditory localization suggest that there was little difference
between the devices effects on localization performance. The devices were worn in combination
with two Ops-Core FAST helmets (ballistic and carbon), and of these two, the carbon helmet
produced fewer front to back reversals. The lighter weight carbon helmet had ventilation holes in
its surface and this may have reduced the disruption of monaural cues as compared to the
ballistic helmet.
Overall, performance of the ComTAC III ARC was equivalent to the ComTAC III. The
ComTAC IV (earplug style) TCAPS provided greater passive attenuation of noise as compared
to the ComTAC III and ComTAC III ARC (earmuff style) TCAPS. This is consistent with the
typical laboratory-obtained NRR values advertised for earplug style hearing protection as
compared to earmuff style hearing protection (Williams, 2008). However, the ComTAC IV did
not have the advantage in terms of auditory localization that has been found for earplugs in
previous studies (Scharine, 2005), most likely because the earmuff-like platform was similar to
normal earmuffs.
25
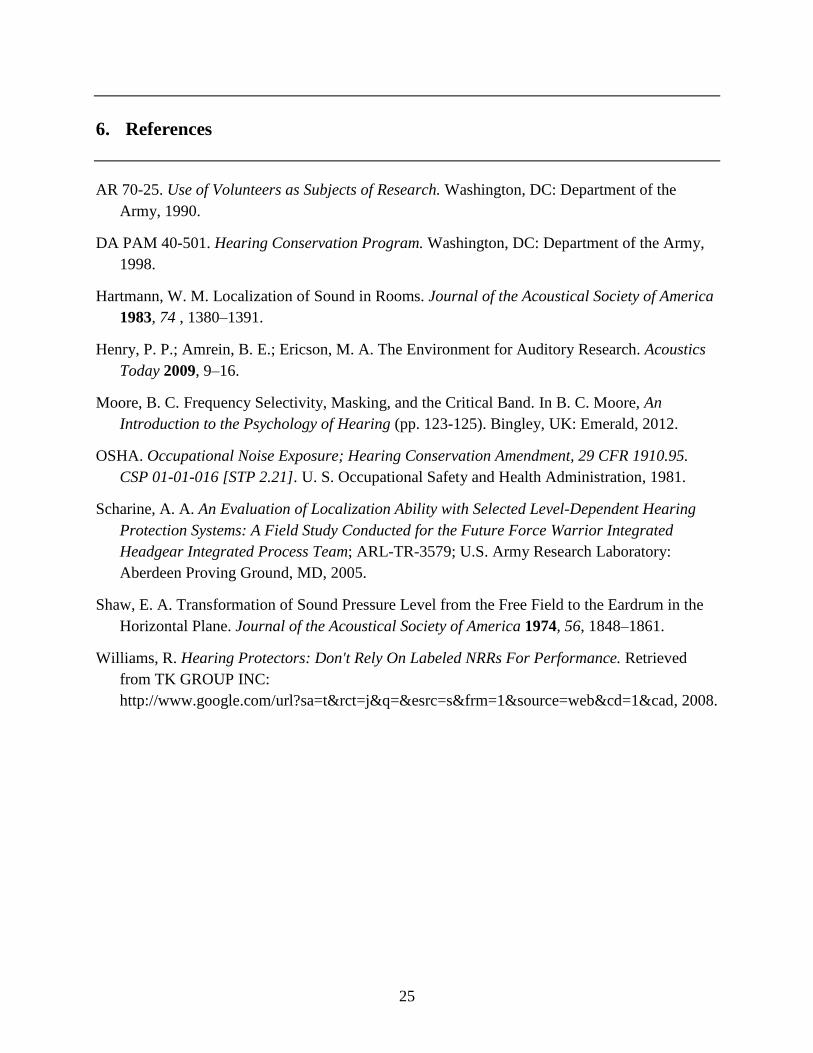
6. References
AR 70-25. Use of Volunteers as Subjects of Research. Washington, DC: Department of the
Army, 1990.
DA PAM 40-501. Hearing Conservation Program. Washington, DC: Department of the Army,
1998.
Hartmann, W. M. Localization of Sound in Rooms. Journal of the Acoustical Society of America
1983, 74 , 1380–1391.
Henry, P. P.; Amrein, B. E.; Ericson, M. A. The Environment for Auditory Research. Acoustics
Today 2009, 9–16.
Moore, B. C. Frequency Selectivity, Masking, and the Critical Band. In B. C. Moore, An
Introduction to the Psychology of Hearing (pp. 123-125). Bingley, UK: Emerald, 2012.
OSHA. Occupational Noise Exposure; Hearing Conservation Amendment, 29 CFR 1910.95.
CSP 01-01-016 [STP 2.21]. U. S. Occupational Safety and Health Administration, 1981.
Scharine, A. A. An Evaluation of Localization Ability with Selected Level-Dependent Hearing
Protection Systems: A Field Study Conducted for the Future Force Warrior Integrated
Headgear Integrated Process Team; ARL-TR-3579; U.S. Army Research Laboratory:
Aberdeen Proving Ground, MD, 2005.
Shaw, E. A. Transformation of Sound Pressure Level from the Free Field to the Eardrum in the
Horizontal Plane. Journal of the Acoustical Society of America 1974, 56, 1848–1861.
Williams, R. Hearing Protectors: Don't Rely On Labeled NRRs For Performance. Retrieved
from TK GROUP INC:
http://www.google.com/url?sa=t&rct=j&q=&esrc=s&frm=1&source=web&cd=1&cad, 2008.

26
List of Symbols, Abbreviations, and Acronyms
ACH Advanced Combat Helmet
ANCOVA analyses of covariance
ANOVA analysis of variance
ARC Accessory Rail Connector
ARL U.S. Army Research Laboratory
ATF Auditory Test Fixture
EAR Environment for Auditory Research
FAST Future Assault Shell Technology
FP foam earplugs
HL hearing level
NRR noise reduction rating
PINS pneumatic impulse noise source
SA situational awareness
TCAPS Tactical Communication and Protection System

NO. OF NO. OF
COPIES ORGANIZATION COPIES ORGANIZATION
27
1 DEFENSE TECHNICAL
(PDF) INFORMATION CTR
DTIC OCA
1 DIRECTOR
(PDF) US ARMY RESEARCH LAB
IMAL HRA
1 DIRECTOR
(PDF) US ARMY RESEARCH LAB
RDRL CIO LL
1 GOVT PRINTG OFC
(PDF) A MALHOTRA
1 ARMY RSCH LABORATORY – HRED
(PDF) RDRL HRM C A DAVISON
320 MANSCEN LOOP STE 115
FORT LEONARD WOOD MO 65473
1 ARMY RSCH LABORATORY – HRED
(PDF) RDRL HRM D
T DAVIS
BLDG 5400 RM C242
REDSTONE ARSENAL AL 35898-7290
1 ARMY RSCH LABORATORY – HRED
(PDF) RDRL HRS EA DR V J RICE
BLDG 4011 RM 217
1750 GREELEY RD
FORT SAM HOUSTON TX 78234-5002
1 ARMY RSCH LABORATORY – HRED
(PDF) RDRL HRM DG J RUBINSTEIN
BLDG 333
PICATINNY ARSENAL NJ 07806-5000
1 ARMY RSCH LABORATORY – HRED
(PDF) ARMC FIELD ELEMENT
RDRL HRM CH C BURNS
THIRD AVE BLDG 1467B RM 336
FORT KNOX KY 40121
1 ARMY RSCH LABORATORY – HRED
(PDF) AWC FIELD ELEMENT
RDRL HRM DJ D DURBIN
BLDG 4506 (DCD) RM 107
FORT RUCKER AL 36362-5000
1 ARMY RSCH LABORATORY – HRED
(PDF) RDRL HRM CK J REINHART
10125 KINGMAN RD BLDG 317
FORT BELVOIR VA 22060-5828
1 ARMY RSCH LABORATORY – HRED
(PDF) RDRL HRM AY M BARNES
2520 HEALY AVE
STE 1172 BLDG 51005
FORT HUACHUCA AZ 85613-7069
1 ARMY RSCH LABORATORY – HRED
(PDF) RDRL HRM AP D UNGVARSKY
POPE HALL BLDG 470
BCBL 806 HARRISON DR
FORT LEAVENWORTH KS 66027-2302
1 ARMY RSCH LABORATORY – HRED
(PDF) RDRL HRM AT J CHEN
12423 RESEARCH PKWY
ORLANDO FL 32826-3276
1 ARMY RSCH LABORATORY – HRED
(PDF) RDRL HRM AT C KORTENHAUS
12350 RESEARCH PKWY
ORLANDO FL 32826-3276
1 ARMY RSCH LABORATORY – HRED
(PDF) RDRL HRM CU B LUTAS-SPENCER
6501 E 11 MILE RD MS 284
BLDG 200A 2ND FL RM 2104
WARREN MI 48397-5000
1 ARMY RSCH LABORATORY – HRED
(PDF) FIRES CTR OF EXCELLENCE
FIELD ELEMENT
RDRL HRM AF C HERNANDEZ
3040 NW AUSTIN RD RM 221
FORT SILL OK 73503-9043
1 ARMY RSCH LABORATORY – HRED
(PDF) RDRL HRM AV W CULBERTSON
91012 STATION AVE
FORT HOOD TX 76544-5073
1 ARMY RSCH LABORATORY – HRED
(PDF) HUMAN RSRCH AND ENGRNG
DIRCTRT MCOE FIELD ELEMENT
RDRL HRM DW C CARSTENS
6450 WAY ST
BLDG 2839 RM 310
FORT BENNING GA 31905-5400
1 ARMY RSCH LABORATORY – HRED
(PDF) RDRL HRM DE A MARES
1733 PLEASONTON RD BOX 3
FORT BLISS TX 79916-6816

NO. OF NO. OF
COPIES ORGANIZATION COPIES ORGANIZATION
28
8 ARMY RSCH LABORATORY – HRED
(PDF) SIMULATION & TRAINING
TECHNOLOGY CENTER
RDRL HRT COL M CLARKE
RDRL HRT I MARTINEZ
RDRL HRT T R SOTTILARE
RDRL HRT B N FINKELSTEIN
RDRL HRT G A RODRIGUEZ
RDRL HRT I J HART
RDRL HRT M C METEVIER
RDRL HRT S B PETTIT
12423 RESEARCH PARKWAY
ORLANDO FL 32826
1 ARMY RSCH LABORATORY – HRED
(PDF) HQ USASOC
RDRL HRM CN R SPENCER
BLDG E2929 DESERT STORM DRIVE
FORT BRAGG NC 28310
1 ARMY G1
(PDF) DAPE MR B KNAPP
300 ARMY PENTAGON RM 2C489
WASHINGTON DC 20310-0300
4 US ARMY - NATICK SOLDIER
(PDF) RESEARCH & DEVELOPMENT
CENTER
D LEE
A CHISHOLM
S GERMAIN
J KRUSZEWSKI
1 US ARMYAEROMEDICAL
(PDF) RESEARCH LABORATORY
W AHROON
1 AIR FORCE RESEARCH LABORATORY
(PDF) R MCKINLEY
1 ARMY RSCH LABORATORY
(PDF) (EMERITUS STATUS)
T LETOWSKI
1 VIRGINIA TECH
(PDF) J CASALI
ABERDEEN PROVING GROUND
32 DIR USARL
(12 PDF RDRL HR
20 HC) L ALLENDER
P FRANASZCZUK
C COSENZO
RDRL HRM
P SAVAGE-KNEPSHIELD
RDRL HRM AL
C PAULILLO
RDRL HRM B
C SAMMS
RDRL HRM C
L GARRETT
RDRL HRS
J LOCKETT
RDRL HRS B
M LAFIANDRA
RDRL HRS C
K MCDOWELL
RDRL HRS D
B AMREIN
A SCHARINE (20 HCs)
RDRL HRS E
D HEADLEY