evaluation of workload estimation techniques in …\evaluation of workload estimation techniques in...
TRANSCRIPT

\EVALUATION OF WORKLOAD ESTIMATION TECHNIQUES IN SIMULATED PILOTING TASKS EMPHASIZING MEDIATIONAL ACTIVITY!
by
Mansour\\ Rahimi 11
Dissertation submitted to the Faculty of the
Virginia Polytechnic Institute and State University
in partial fulfillment of the requirements for the degree of
DOCTOR OF PHILOSOPHY
in
Industrial Engineering and Operations Research
APPROVED:
Dr. W. W. Wierwille, Chairperspn
Greenstein - Jr. K. y E. Kroemer
Dr. C. E. Nunnally Dr. H. L0• g'.Zyder
July, 1982 Blacksburg, Virginia

ACKNOWLEDGEMENTS
This research was sponsored jointly by the NASA Ames
Resea!"ch Center, Moffett Field, California and Virginia
Polytechnic Institute and State University. Thanks are due
to , who served as grant monitor.
The author wishes to extend his special gratitude to Dr.
Walter W. Wierwille, major advisor, whose constant guidance,
assistance, and support made this dissertation possible. I
would like to express my appreciation to each of my
committee members, whose valuable comments helped immensely
in the accomplishment of this research.
Special thanks are also extended to and
for their practical help and valuable
-discussions throughout this resea!"ch. I also thank those
people, not mentioned here, who gave their technical and
moral support.
Finally, deep appreciation goes to for
her love, understanding, and support throughout the years.
She is also thanked for typing this dissertation.
ii

CONTENTS
ACKNOWLEDGEMENTS
INTRODUCTION
Candidate Workload Estimation Techniques Opinion . . . . . Spare Mental Capacity Primary Task Measures Physiological Measures
LITERATURE REVIEW
General Reviews Opinion . . . . Rating Scales . Spare Mental Capacity
Time estimation Tapping regularity
Physiological Measures Pupil dilation . . . Pulse rate variability
Primary Task Measures . . Mediational reaction time Control movements per unit time
RESEARCH OBJECTIVES
METHOD
Experimental Design Apparatus .
Flight simulator Time estimation Tapping regularity Pupil dilation . Pulse rate variability
Primary Task Design . Adjus~ment of Task Difficulty Subjects
iii
ii
1
4 4 4 4 4
5
5 8 9
15 19 21 22 23 24 27 28 28
30
31
31 33 33 35 35 35 37 37 41 42

PROCEDURE
RESULTS .
Pre-experimental Tests Rating Scales . Secondary Task Measures Physiological Measures Primary Task Measures . Flight Task . Specific Secondary Tasks Instructions
Time estimation Tapping regularity Data taking period
Sensitivity Analysis Raw scores computations Conversion to z-scores
Overall ANOVA . . . . Simple Effects F-tests Sample Size Estimation Newman-Keuls Comparisons Classification of Techniques Intrusion Analysis Overall MANOVA Individual ANOVAs Classification of Techniques
DISCUSSION
Sensitivity Intrusion . Complementary Findings and Explanations
Multi-descriptor rating scale Tapping regularity Control movements Pupil dilation . . Pulse rate variability
SUMMARY AND CONCLUSIONS
REFERENCES
iv
43
43 44 45 46 46 47 48 48 49 49
50
50 50 50 52 54 55 64 66 71
. 76 76 85
90
90 96 97 97 98 99
100 100
102
. 104

Appendix
A. EXPERIMENTAL APPARATUS 111
B. INSTRUCTIONS
General Description of the Experiment for Participants . . . . . .
Participant's Consent Form .... Flight Task Practice Instructions Flight Task Instructions
114
115 118 120 121
C. WIND TRIANGLE PROBLEMS 123
Wind Triangle Problems, Instructions, and Training . . . . . . . . .
D. MEASUREMENT TECHNIQUE INSTRUCTIONS
124
133
Modified Cooper-Harper Rating Scale Instructions 134 Overview . . . . . . . . . 134 Important Definitions ~ . . . . . . 134 Rating Scale Steps . . . . . . . . 135 How You Should Think of the Rating 137
Multiple Descriptor Ratings 139 Overview . . . . . . 139 Important Definitions . . 139 Rating Scale Steps . . . 142 How You Should Think of the Rating 142
Familiarization Session Instructions (Physiological Measures) . . . . 150
Physiological Sensor Description . . . 151 Time Estimation (Secondary Task) Instructions 152 Tapping Regularity (Secondary Task) Instructions 155
E. DEFINITIONS AND DESCRIPTIONS OF MEASURES USED
Opinion measures . . . . . . . . . Modified Cooper-Harper Ratings Multiple Descriptor Ratings
Spare Mental Capacity Measures Time Estimation . . Tapping Regularity
Physiological Measures Pulse Rate Variability Pupil Dilation . . . .
Primary Task Measures Mediational Reaction Time Percent Error Response
v
157
158 158 158 158 158 159 160 160 160 160 160 161

Control Movements per Unit Time . . 161 Pitch High-Pass Mean-Squared (PHPMS) Error 161 Roll High-Pass Mean-Squared (RHPMS) Error 162
VITA 163
vi

LIST OF TABLES
Table
1. Experimental Design Matrix for Sensitivity Analysis 32
2. Classification of Universal Operator Behavior Dimension . 38
3. Overall ANOVA Summary Table for Sensitivity 53
4. Summary Table for Rating Scales Simple Effects F-Tests . 56
5. Summary Table for Secondary Tasks Simple Effects F-Tests . 58
6. Summary Table for Primary Tasks Simple Effects F-tests . . 60
7. Summary Table for Physiological Measures Simple Effects F-tests . 62
8. List of the Sensitive Techniques 63
9. Estimating Number of Subjects Required for Sensitivity . 65
10. Newman-Keuls Test for the Sensitive Measures 67
11. Classification of Sensitive Techniques . 69
12. ANOVA Summary Table for Experience Level 70
13. MANOVA Summary for Intrusion Analysis (Wilk's Criterion)
14.
15.
Intrusion ANOVA Summary for Error Rate
Intrusion ANOVA Summary for Mediational Reaction Time
vii
77
78
. 79

16. Intrusion ANOVA Summary for Pitch (HPMS) Error
17. Intrusion ANOVA Summary for Roll (HPMS) Error
18. Intrusion ANOVA Summary for Control Movements
19. Newman-Keuls Test for Error Rate
20. Newman-Keuls Test for Mediational Reaction Time
21. Classification of Intrusive Techniques .
22. MANOVA Summary for Experience Level (Wilk's Criterion)
23. Summary of Results of Present Experiment
viii
80
81
82
84
86
88
89
104

LIST OF FIGURES
Figure
1. Cooper-Harper rating scale (Cooper and Harper,1969). 10
2. Modified Cooper-Harper rating scale (Wierwille, 1982) . 12
3. Multi-descriptor bipolar adjective rating scale for attentional demand 13
4. Procedural steps for the sensitivity analysis 51
5. Mean z-scores for Cooper-Harper rating scale measure vs. load. 57
6. Mean z-scores for the time estimation measure vs. load.
7. Mean z-scores for the mediational reaction time measure vs. load.
. 59
61
8. Mean z-scores versus experience level. 72
9. ·Procedural steps for the intrusion analysis 75
10. Photograph of experimental equipment. 112
11. Photograph of a subject in the aircraft simulator wearing the physiological sensor. 113
12. A sample wind triangle problem for a GROUND SPEED question. 125
13. A sample wind triangle problem for an AIRCRAFT HEADING question. 129
14. A sample wind triangle problem for an ETA question. 130
ix

INTRODUCTION
In modern aviation,
communications procedures,
cockpit
and mission
instrumentation,
operations are
becoming more complex. This higher system complexity places
additional mental requirements on aircrew personnel. To
complete missions successfully, aircrew members have to meet
increasing system demands. During a mission phase, aircrew
members may become overburdened either instantaneously or
for prolonged periods of time. The result may be
degradation of aircrew/aircraft performance. Significant
aircrew errors may lead to an accident. Such concerns have
resulted in the need to measure aircrew workload.
In designing new systems or modifying the existing ones,
it is becoming imperative for the cockpit and system
engineers to consider total mental workload demands placed
on the pilots. To accomplish this task, accurate
measurement of pi lot mental workload remains a necessary
part of an optimum pilot/aircraft design.
Over the past thirty years, a large body of literature
has been accumulated on operator workload assessment
techniques. Wierwille and Williges (1978) have pointed out
1

2
the lack of workload research in the area
operations and evaluations, and Wierwille
of flight
(1979) has
suggested the need for a more comprehensive study of the
existing techniques. He explained that to select a
technique for a given task, the following attributes should
be included:
1. The technique should accurately and reliably assess
pilot workload.
2. The technique should be well suited to the specific
problem situation.
3. The introduction of the
significantly change the
pilot/vehicle system.
technique
behavior
should
of
not
the
The purpose of this research was to examine workload
estimation techniques and help fill the need for information
in the above three areas.
Among the tasks that pilots are routinely called upon to
perform are the so-called rnediational tasks. These tasks
usually involve problem solving activity. A mediational
task may also involve activities such as calculation,
.coding, interpolation, comparison, and extrapolation. In
modern aircraft, these activities make up a substantial part
of the pi lot's workload. Because mediational workload is
very important, the present study was directed at

3
determining workload estimation techniques suitable for
measurement of mediational load. Several techniques for
assessing pilot workload were compared with the goal of
evaluating their sensitivity to mediational loading. A
workload estimation technique is said to be sensitive if it
reliably discriminates between differences in operator
mental loading requirements of an assigned task. These
techniques were also compared for their level of intrusion
when introduced in the mediational task environment. A
workload estimation technique is said to be intrusive if a
significant primary task performance degradation is observed
due to the use of the technique and associated equipment. A
highly intrusive technique may substantially degrade a
pilot's performance, creating hazardous situations in actual
flight operations.
The present study examined eight techniques which are
likely to be sensitive measures of pilot mental workload in
simulated and actual flight operations. Comparative
statistical evaluations of the measures were conducted.
This research is original in that no previous study has
examined both sensitivity and intrusion of a group of mental
workload estimation techniques in a piloting task
emphasizing mediational activity.

4
Candidate Workload Estimation Techniques
Two techniques were selected from each of the four major
workload assessment technique categories proposed by
Wierwi lle and Wi l liges ( 1978) . The techniques have been
chosen because of the promise shown in previous research and
because of their compatibility with the mediational primary
task.
The eight mental workload estimation techniques used
in this experiment are:
Opinion.
1. Modified Cooper-Harper rating scale
2. Multi-descriptor rating scale
Spare Mental Capacity.
Secondary task measures:
3. Time estimation
4. Tapping regularity
Primary Task Measures.
5. Mediational reaction time
6. Control movements per unit time
Physiological Measures.
7. Pulse rate variability
8. Pupil dilation

LITERATURE REVIEW
General Reviews
Research literature concerning mental workload is
numerous and remarkably diverse.
discussion of review articles
The following is a general
which have surveyed the
concept of mental workload and its associated estimation
techniques.
Reising ( 1972) provides one of the earlier reviews of
operator mental workload. This report is divided into
several sections providing background information on the
relevance of workload to the piloting task. The mental
workload measures are divided into two categories,
physiological
this report
reduction.
and psychological measures. One section of
concentrates on workload data analysis and
Gerathewohl (1976), in a status report,
categorized pilot and aircrew workload into perceptual and
mental workload. This review classifies piloting tasks as
primary or
workload.
secondary
Workload
for quantitative
measures are
determination of
classified as
psychological, physiological, and operational.
5

6
A critical survey of workload, fatigue, and associated
assessment techniques was conducted by Gartner and Murphy
(1976). The notions of workload are discussed as a set of
task demands, efforts, and activities or accomplishments.
Delineation of workload techniques is categorized as task
requirements, task performance, psychophysiological, and
opinion measures. Schiflett
annotated bibliography of
(1976) compiled a
methodologies that
selected
measure
operator mental workload in operational aircrew systems.
Eighty-three articles were selected and placed in seven
categories. The categories were general reference, systems
analysis, subjective techniques, psychomotor, information
processing, physiological measures, and combined
methodologies.
Roscoe (1978) edited an AGARD (Advisory Group for
Aerospace Research and Development) report on various
categories of mental workload techniques. This report
contains sections on physiological and subjective opinion
measures. A section is also devoted to· objective methods
including laboratory, analytic, and synthetic techniques in
simulated and in-flight environments (Chiles, 1978).
Hartman and McKenzie (1979) edited another AGARD report
which contains 19 papers. The measurement domains were
sensory threshold function tests, motor function, and

7
responses to psychological, physiological, and chemical
excitation. The methodologies used were laboratory and
in-flight measurement and modeling. Wierwille and Williges
(1978) provided the most comprehensive survey and
classification of mental workload estimation techniques.
Over 400 documents were analyzed in this report. To
classify these documents,
employed. One dimension
behaviors according to
(1964), which includes
a two-dimensional scheme was
was the universal operator
Berliner, Angell, and Shearer
perceptual, categories of
mediational, communications, and psychomotor processes. The
other dimension was workload assessment methodologies, which
were cataloged into 28 procedures under the general
categories of subjective opinion, spare mental capacity,
primary task, and physiological measures. A brief overview
of the various workload assessment techniques was presented
along with a set of criteria that need to be considered in
evaluating the feasibility of these measures. Wierwille and
Williges (1980) have updated this report in a publication
~hich contains a bibliography of more than 600 citations.
The Wierwille and Williges (1978) report provided a
conceptual framework that was employed later by Connor
(1981). In Connor's report a comparison of the sensitivity
and intrusion of 20 pilot workload assessment techniques was

8
conducted. This research used a psychomotor loading task in
a three degree-of-freedom moving-base aircraft simulator.
Only five measures demor..strated useful sensi ti vi ty. These
measures were Cooper-Harper ratings, Workload Compensation
Interference/Technical Effectiveness ratings, time
estimation standard deviation, pulse rate mean, and number
of control movements per unit time. None of the techniques
was found to be intrusive in this experiment.
The remainder of this chapter contains literature reviews
addressing each proposed workload estimation technique
according to the Wierwille and Williges ( 1978)
classification scheme, namely opinion, spare mental
capacity, physiological, and primary task measures.
Opinion
Opinion techniques are commonly used in most studies
concerning assessment and evaluation of workload measures.
The general forms of opinion measures are structured or
unstructured questionnaires, rating scales, and interviews.
Psychometrically-derived rating
quantitative and therefore are
scales
easier to
are usually
analyze than
questionnaire procedures. Rating scales have the advantage
of being nonintrusive, often sensitive, and widely
acceptable. A disadvantage of rating scales is that the

9
rating is usually obtained after the actual flight phase.
Thus, subjects are relying on their memory in providing a
rating. Other disadvantages include possible sensitivity to
emotional and physical state, training, and fatigue.
Rating Scales
Most rating scales have been designed for
situation-specific applications and have not been tested for
their reliability and validity as measures of pilot mental
workload. Furthermore, only a few rating scales have been
used in more than one study.
One rating scale which has received considerable
application is the Cooper-Harper rating scale (Cooper and
Harper, 1969), shown in Figure 1. This rating scale was not
systematically designed according to rigorous psychometric
developments. Primarily, the scale was designed for
assessing handling qualities of aircraft. The underlying
assumption in this scale is that a pilot's rating of
perceived task loading is directly proportional to the
pi lot's actual task loading. The pi lot is given a set of
instructions describing the proper procedure for using the
rating scale and defining the terms used in the scale. The
pilot follows a logic tree for making his/her rating. This
scale contains 10 categories with descriptors that are

Pilot d&Ctsions
Figure 1:
0.ficienci~s reau1re
improvement
10
Exc•llent H1g,uy desirat>ie
GOOd Neghg1ble delkrenciea
Fair - Seme mildly unoteasa"t deficiencies
Mil'\Of but annoy1"9 11efic1~1es
Modtr•tely ob11X:tiof\lble deticienc1es
Very object1onao1e but loteraole deficiencies
0-DS- ON THI Pit.OT. Pit.OT 91 sal!CTE> TASK OR AEOUIR£1> Ql'EIATION• RATING
Pilot comgensauon not a factor tor desired oerlormance
Pilot compensation nol a factor fOf desired Q41tformaoce
Minimal pilot cotrtoensauon r~ulfed fot daStred P«rformance
Desired oertorl'ftMICe requires mocerate pilot compensauon
Adequall gertorm1nc1 reQu1res considerable p1lol comoensatr°"
AdeQu•<• oerlormal"Ce requiret extensm1 p11or comoensauon
·-~~-~- .. ·__ · ..... . AdeQuate perlOrrnance not attain.cue with
Major deficieneiee mu1mum tolerable orlot com~setlon. Controllab11tty nor 1n cu.est1on
Consioeraote pilot comoensation is required tor concro1 B
~~\:.~~.+------------,-nt_e_n .. -g-,-,o-tc_om_oe_n-,..-,-,o-n-,.-,-eq-u-.,-ed-10---~=9:=:= ·r· • Ma1or defici11t1c:e1 ._ ____ _.; ..,;r..,.: .__, __________ ••_•_••_n_c_on_•_rc'-'-------,--------
/\t/>~~ ::?:~~?~1};;-t: .· .. r·i,'.~~>/<>::::<~::;:r:~f::i::'.'.{~~;:·,:~c/::; ·.;~.',.~·· . -~· •" lrnpro~ernent
mandatory
,.---------~-------Co-n-rro-l-wo_ll_oe-10-~-d-ur_ing __ som __ e_g0<1--;on ...... ol ________ _ Ma10f deOcier.c1H reoulfed cc.rauon
• Cefu•ubOft Of~ 00<9'•h0ft ltT\JIOtwft CSfttQS'•hGll °' ftiql'tt on•M ""4/0I IUOOl'I ... 1"0'I accOfl"Oanytnf COl'tOICtioftS.
Cooper-Harper rating scale (Cooper and Harper,1969).
11
believed to be mutually exclusive. The descriptors of the
scale indicate various degrees of "flyability" of an
aircraft.
A modified Cooper-Harper scale was designed (Wierwille,
1982) containing descriptors pertaining to "mental effort"
of a task. The pilot's decisions follow a logic tree as in
the original Cooper-Harper scale. This scale is less
situation-specific than the original Coqper-Harper scale.
In particular it does not deal with handling. Figure 2
shows the modified Cooper-Harper scale.
The second rating scale used in this experiment is a
multi-descriptor bipolar adjective (semantic differential)
rating scale (Appendix D). An example of this scale is
shown in Figure 3 .
The bipolar adjective rating scale is one of the four
major types of psychological scales. The other three scales
are the Guttman (scalogram) scale, the Thurstone scale, and
the Likert scale. The interested reader is referred to
Guilford (1954), Edwards(l957), and Nunnally (1967) for
detailed construction and explanation of each scale.
Semantic differential rating scales were developed as a
method for measuring various aspects of meaning towards
objects or concepts (Osgood and Suci,1955).

Fig
ure 2
:
12
.... ...
... ... ..
I
Mo
dified
Co
op
er-Harp
er ra
ting
scale
(W
ierwille,
19
82
) .

13
ATTENTIONAL DEMAND refers to the portion of your total time required (or the amount of attention required) to perform the instructed task.
YOUR RATING OF ATTENTIONAL DEMAND
A B c D E F G H I
NONE MODERATE
J K
EXTREMELY HIGH
Figure 3: Multi-descriptor bipolar adjective rating scale for attentional demand

14
Osgood and Suci (1955) used factor analysis to
distinguish among three general factors of meaning that tend
to cluster with the semantic differential scales:
evaluation (good/bad), potency (strong/weak), and activity
(exciting/calm). Nunnally (1970) determined an additional
factor of familiarity (clear/complex) which can be clustered
with the other three factors.
The multi-descriptor rating scales (total of six) used in
this experiment employ all four factors mentioned above.
Also, the results of a study by Hart, Childress, and Hauser
(1982) were useful in designing the scales. One advantage
of the multi-descriptor scales used is that the scores
obtained may be analyzed by parametric methods. Baker,
Hardyck, and Petrinovich (1970) compared the sensitivity of
the t-test to equal interval scores and scores representing
three situations of interval size inequalities (randomly
varied, inequality at the extremes of the scale, and half
equal and half randomly varied interval sizes) under three
frequency distributions (normal, rectangular, and
exponential). Interval size inequalities and frequency
distributions were found to have no effect on Type I error,
but the standard error of the estimate (variance) was
influenced by extreme inequality of interval sizes. Baker
et al. ( 1970) concluded that ordinal data (such as those

15
obtained from the multi-descriptor scales used in this
experiment) may be analyzed by interval statistics. A major
problem with this scale is concept-scale interaction. That
is, the meaning of the scale may depend on the concept being
rated (such as hard/easy to describe a test or a person).
In the present experiment, each subject rated six bipolar
adjective scales for each experimental flight. Each scale
was rated by circling one of the letters A through K.
Letter A represents a score of 0 (the lowest rating) and
letter K represents a score of 10 (the highest rating). The
score on each scale (from 0 to 10) is representative of a
pilot's experience in that aspect or dimension of imposed
mental workload. Hopefully, the six scales (one descriptor
for each scale) take into account the multi-dimensionality
of pilot mental workload.
Spare Mental Capacity
Spare mental capacity can be considered as a measure of
the difference between the mental capacity required to
perform a given task and the total capacity of the operator
(Wierwille and Williges, 1978). The important assumptions
(Senders, 1970) associated with this concept are that (a)
the operator is a single-channel system, (b) the channel has
a fixed capacity, ( c) the capacity has a single metric by

16
which any task can be measured,
workload are linearly additive.
and (d) the constituents of
Chiles (1977) maintained
that the first two assumptions (i.e., single channel, fixed
capacity) are only important under certain circumstances.
Schiflett ( 1976) explained that the first two assumptions
ignore the adaptive nature of human performance in a
multi-task real-world operational setting. Consequently,
extrapolated criteria become irrelevant to real-world
situations. Kahneman (1973) proposed a model which
describes human operators as multi-channel, fixed capacity
systems. Maintaining Sender's (1970) assumptions, the
operator's spare mental capacity supposedly decreases as
his/her workload' increases.
In general, the following three approaches have been used
to measure spare mental capacity:
1. Task analytic
2. Secondary;task
3. Occlusion
The task analytic approach involves
mathematical/theoretical methods to assess
capacity. Task analytic methods assume
the use of
spare mental
that all task
components, performed serially, require specific periods of
time to complete. Task loading occurs when the sum of
theoretical time durations for performing the task

17
components exceeds the actual time available for overall
completion of the task.
The secondary task approach involves the presentation of
an additional (secondary) task to be performed only when the
main (primary) task is being performed satisfactorily.
Theoretically, the performance on the secondary task should
decrease as the difficulty of the primary task increases.
Secondary task performance,
measure of operator workload.
then, becomes an indirect
The occlusion approach involves a time sharing technique
in the form of suppressing information inputs to the
operator, that is, by giving the operator time samples of
input information. Occlusion is usually accomplished by
blanking of the visual display or moving an opaque blind
over the operator's eyes. Workload is assumed to increase
as the proportion of off-time (non-viewing time) decreases.
The occlusion method can oe used to obtain an estimate of
the information content (mostly visual) in the operator's
task (Senders, Kristofferson, Levison, Dietrich, and Ward,
1967).
The spare mental capacity techniques usad in the present
study are from the secondary task group only. Task analytic
methods are fundamentally theoretical approaches based
primarily on laboratory data. Validity of task analytic

18
results are in question when applied to the actual (i.e. ,
in-flight) test and evaluation environments. Also, a major
revision of the fundamental task analytic approach has been
provided by Wingert ( 1973). He suggests the concept of
"function interlacing" in which total processing time is
less than the sum of the individual task component times.
The occlusion technique, on the other hand, may cause
serious safety problems. For example, it could not be used
in actual take off, landing, and difficult maneuvers. Also,
Hicks and Wierwille (1979) indicated that the occlusion
method was not sensitive to task loading in a simulated
driving situation.
The following facto~s should be considered in selecting
secondary task measures (Knowles, 1963):
1. The secondary task should be easy to learn, and
simple to perform and score.
2. The task should have minimum interference with the
primary task.
3. The rate of presentation should be determined for
each specific subject.
Levine, Ogden, and Eisner (1978) provide the most
comprehensive literature review and annotated bibliography
concerning the use of the secodary task method in estimating
operator spare mental capacity. The assumption apparent in

19
the Levine et al. (1978) review papers is that the operator
performs the secondary task only when he/she has additional
or free mental resources available from the instructed
primary task. This assumption emphasizes the serious
problem of secondary task interference on the primary task
performance. Two ways to approach this problem are: 1.
careful selection and design of primary and secondary task
procedures and equipment to minimize their physical
interference, and 2. accurate design of instructions for
effective application of the secondary task while performing
the primary task. Pilots must be thoroughly instructed to
attend to the primary task and to timeshare the secondary
task when they have free mental resources. The intrusion
(interference) of a variety of secondary tasks has been
recognized and studied by Hawkins, Church, and deLemos
{1978), Hicks and Wierwille (1979), Whitaker (1979), and
Wickens {1974). The present study used an experimental
design which would allow detection of any significant
intrusion of the selected techniques.
Time estimation. In theory, the degree of accuracy with
which individuals make short time estimates (e.g., 10 to 15
seconds) in a secondary task mode is a potential measure of
mental workload (Hart, 1976). This technique is generally
easy to instrument and score. One method of estimating time
20
is production. In this method the pilot is presented with a
verbal or a visual signal to begin producing the time
interval. The pilot presses a switch to indicate the
beginning of the interval and his second activation of the
switch indicates the end of the interval.
There are two strategies an individual may use to
estimate time while performing a primary task (Hart and
McPherson, 1976). One is the active mode of time assessment
in which the individual consciously keeps track of the
passage of time using strategies such as counting. The
other is the retrospective mode of time assessment in which
the individual estimates the amount of time elapsed at a few
discrete points in time, referring to memory of the events
that occurred. In other words, in this mode, they do not
mentally or actively count time intervals. They estimate
the time elapsed.
Hart, McPherson, and Loomis (1978) explained that,
theoretically, active time estimates increase in length and
variability with increase in mental workload because of
distractions in time keeping produced by other activities.
Retrospective time estimates, however, decrease in length
and increase in variability with increase in mental workload
because of the learned correlation between passage of time
and the occurrence of events. In other words, perceived

21
passage of time decreases when the rate of activity
increases.
In the present study, the retro spec ti ve time estimation
mode was emphasized. Subjects were specifically instructed
not to count the passage of time.
Tapping regularity. The regularity with which
individuals successively move their limbs (e.g., tapping a
finger or a foot to depress a switch) is believed to be
affected by the increase in the difficulty of a primary task
(Michon, 1964). Indications are that tapping regularity
decreases as the difficulty of the primary task increases.
In other words, there is greater variability in the tapping
interval as mental loading increases. According to Michon
(1966), subjects must be carefully instructed not to count
between tapping intervals if the technique is to be used for
workload assessment. In this respect, it is similar to the
retrospective mode of time estimation.
Michon ( 1966) devised and explained a complex scoring
formula to account for the variability of the tapping
intervals. Michon (1964,1966) found that tapping regularity
measures were sensitive to an increase in difficulty of a
variety of perceptual and cognitive tasks (e.g. , choice
reaction task, letter detection, multiplication, and
Bourdon-test). This measure was used by Johannsen,

22
Pfendler, and Stein (1976) in a sirr.ulated instrument landing
approach of a STOL aircraft simulator. Mental workload was
increased by an increase
regularity decreased with
loading.
in autopilot failures. Tapping
increases in the primary task
Physiological Measures
The underlying concept in physiological measures is that
involuntary physiological changes (i.e., circulatory system,
nervous system, respiratory system, and body fluid
chemistry)
increasing
occur when the
workload. These
human operator experiences
physiological changes can be
monitored and used as a measure of workload. The exact
funtional relationships between the changes
the resulting physiological changes need
precisely to make this measure useful.
in loading and
not be known
Two major
disadvantages of using physiological responses as mental
workload measures are:
1. Possible contamination of the· measure by subject's
physical effort, fatigue, circadian rhythms, level of
arousal, and stress.
2. Possible large differences
physiological responses to
loading.
among subjects in their
the primary task mental

23
With advancement in medical instrumentation technology,
physiological measures are becoming more reliable and less
intrusive.
A wide variety of physiological measures have been
proposed for estimating workload, as is evident from the
overview papers by Perelli (1979), Rolfe and Lindsey (1973),
Spyker, Stackhouse, Khalafalla, and McLane (1971), Ursin and
Ursin (1979), and Wierwille and Williges (1978). In the
present study, two techniques (pupil dilation and pulse rate
variability) were selected which~ on the basis of the
available literature, show promise in assessing cognitive or
mediational workload. These two techniques are easily
implemented and are not likely to be intrusive.
Pupil dilation. It has been demonstrated that the pupil
dilates as mediational workload increases (Beatty, 1976) .
The physiological processes involved are very complex.
Increasing workload stimulates the central nervous system.
The pupil, in turn, responds to the increased central
nervous system activity by dilating or enlarging its
diameter. It is not clear whether the changes are a result
of changes in mental loading directly or a result of changes
in emotional stress (Beatty, 1976). In general, an increase
in pupil diameter occurs with increased cognitive load.
However, when an operator is subjected to overload, pupil

24
constriction may occur (Noel, 1974). Support for using
pupil diameter as a measure of pilot mental workload is
presented by Westbrook, Anderson, and Pietrzak (1966). The
loading task was a variable difficulty control dynamics
tracking task. The results indicate that the pilots' pupil
diameter increased with decreases in control dynamics
stability. A larger increase in pupil size was observed
when the pilot approached loss of control. Also, Krebs,
Wingert, and Cunningham (1977) studied pupil diameter
changes of 12 pilots in a fixed-base Boeing 737 simulator.
Turbulance and degree of autopilot engagement were used to
create an increase in pilot loading. They found that pupil
diameter changes accounted for 89% of the variability in
pilots' Cooper-Harper rating scale scores of mental
workload.
Pulse
obtained
rate
by
variability.
measuring the
Pulse rate can be easily
instantaneous changes in
peripheral artery pressure.
to heart rate.
Pulse rate is closely related
Generally, a heart rate variability measure is obtained
by processing interbeat intervals of an instantaneous heart
rate output. For example, standard deviation of consecutive
heart beat (R-R nodes on an EKG waveform) time intervals is
often used as a heart rate variability measure. Most of the

25
support for using this measure has been generated by studies
which used the electrocardiogram as a data recording
instrument.
In theory, heart rate variability, as a measure of
operator workload, decreases as mental load increases. In
recent years, several studies have supported this theory.
For example, Ettema and Zielhuis (1971) found that two
measures of sinus arrhythmia (heart rate variability)
decreased as task load (auditory choice reaction task)
increased. The two measures took into consideration the
magnitude as well
rate. Kalsbeek
as the frequency of variation in heart
(1973) found the same results involving
similar binary choice tasks. He introduced visual cues into
his task design. He asked the subjects to depress a pedal
if they saw a light flash and to depress a switch if they
heard a tone. It was hypothesized that "concentration of
attention" causes a reduction in heart rate variability.
Also, the results of a study by Boyce (1974) indicate that
heart rate variability decreases with increase in mental
load. His experiment involved mental subtraction tasks.
In a flight-related environment, Stackhouse (1973)
increased pilot mental workload by increasing the difficulty
of simulated and actual flight helicopter hover maneuvers.
He found that pilots' heart rate variability (standard

26
deviation of R-R interval) correlated significantly with
pilots' performance. In another study, Opmeer and Krol
( 1973) found that heart rate variance significantly
decreased with increased difficulty of the simulated flight
task. They concluded that heart rate variability is more
sensitive to cognitive load than to perceptual load.
In contrast, there are some studies which indicate that
heart rate variability is an insensitive measure of mental
workload. For example, Mobbs, Davids, and Thomas (1971)
found no systematic relationship
variability and task difficulty. The
between heart rate
task was summing a
series of single digit numbers. Mental load was increased
by increasing the number of digits to be summed and
increasing the presentation rate. Sherman (1973), in
studying a sonar doppler identification task, found no
systematic change in heart rate variability with task
difficulty. In regard to a task emphasizing psychomotor
behavior, Hicks and Wierwille (1979) found that heart rate
variability was insensitive to driver task loading.
Several methods of scoring heart rate variability have
been devised by different researchers. The standard
deviation of a sequence of R-R intervals is the simplest and
perhaps most promising measure of heart rate variability.

27
Primary Task Measures
The fundamental hypothesis of primary task measures is
that the increase in operator mental workload is accompanied
by a degradation of operator task performance. However, for
a given task, a primary task measure might not be sensitive
to all of the levels of workload. Cooper and Harper (1969)
hypothesized that the operator calls upon his reserve
capacity under higher workload con9itions to maintain
relatively constant overall performance. Then, an
additional primary task measure is necessary to detect any
strategy changes due to inclusion of the reserve capacity
into the operator's overall behavioral pattern.
Nevertheless, a primary task measure directed at a specific
task performance parameter may show sensitivity to changes
of loading in that aspect of the primary task. Wierwille
and Williges (1978) concluded that, under low loading,
primary task measures
in task difficulty.
are generally insensitive to changes
Under high loading, primary task
measures may change with task difficulty.
Primary task measures are usually easy to obtain in
flight simulators because of the existence of the required
signals in the simulator's control systems. They are more
difficult to obtain in an actual aircraft because of the
additional instrumentation and signal processing required.

28
Comprehensive reviews of primary task measures as
indicators of operator mental workload were authored by
Clement (1978) and Wierwille and Willeges (1978). The
primary task measures selected for this study were
reflective of the mediational loading changes (mediational
reaction time) and strategy changes of the pilots in lower
loadings (number of control movements per unit time). It is
generally accepted that primary task measures and the
equipment necessary for obtaining them do not intrude on
primary task performance because they are usually embedded
in the primary task itself and need not appear explicitly.
Mediational reaction time. Pilots' reaction times to the
mediational portion of the primary task were recorded during
all of the experimental sessions. These scores were used as
primary task measures of the extent to which the pilots were
loaded mediationally.
Control movements per unit time. In flight-related
experiments, the number of aileron, rudder, elevator, and
throttle movements per unit time is often obtained as a
measure of task difficulty (psychomotor load). The number
of control movements per unit time reflects the activity of
the pilot in controlling and positioning the aircraft.
Dick, Brown, and Bailey ( 1976) found this measure to be
sensitive to changes in the difficulty of a predominantly
29
psychomotor task. The task difficulty was increased. by
increasing turbulence in a Boeing 737 simulator. Connor
(1981) used a similar type of psychomotor loading and found
that control movements (rudder, aileron, and elevator) are
sensitive to the changes in psychomotor loading. It is
believed that this measure reflects any change in the
control strategy used by the pilot which might result from
higher loading on a concurrent mediational task.

RESEARCH OBJECTIVES
In reviewing the previous literature on pilot mental
workload assessment techniques, certain shortcomings become
apparent. First, there remains a need for applying
individual workload assessment techniques and determining
their sensitivity to changes in mental loading elicited by
mediational activity requirements of a piloting task. A
technique may be sensitive to one type of mental loading but
not to another. Second, a comprehensive study is needed to
determine the relative intrusion of these techniques under·
the influence of the same behavioral processes. Finally, in
a great number of studies, statistical methods have not been
fully employed for data collection and analysis.
In the present research, eight mental workload assessment
techniques were evaluated in a moving base aircraft
simulator using a piloting task emphasizing mediational
activity. The objective of this research was to determine
the relative sensi ti vi ty and intrusion of each technique
when applied to a mediational load setting. Experimental
conditions were identical for the eight techniques. The
results were analyzed in a quantitative statistical manner.
30
METHOD
Experimental Design
The experimental design for sensi ti vi ty analysis was a
complete factorial 3 X 8 (Load X Technique) design. The
load factor (low, medium, and high) was a within-subject
variable. The technique factor (eight levels) was a between
subjects variable.
in Table 1.
The experimental design matrix is shown
For each technique 6 subjects were used, and the order of
presentation of the three load levels was completely
counterbalanced across the subjects.
Additionally, five primary task dependent measures were
obtained in all 8 technique conditions for intrusion
analysis. The matrix in Table 1 was used to collect the
data. A multivariate analysis of variance (MANOVA) was used
to analyze the main effect of technique on the five
dependent measures combined.
31

32
TABLE 1 Experimental Design Matrix for Sensitivity Analysis
Workload measurement Technique (Bet.-sub.)
Load (Within-subject)
Mod. C-H Rating
Multi-descriptor Ratings
Time Estimation
Tapping Regularity
Low
Sl, ... ,S6
S7, ... ,Sl2
Pulse Rate Variability
Pupil Dilation
Mediational Reaction Time
Control Movements S43 I ••• 548
Medium High
Sl, ... ,S6 Sl, ... ,S6
S7, ... ,Sl2 S7, ... ,S12
S43, ... S48 S43, ... S48

33
Apparatus
Flight simulator. A flight simulator (Singer Link, Inc.,
General Aviation Trainer, GAT-lB) was used as the principal
apparatus of this experiment. The GAT-lB is a
self-contained electronic simulator with three degrees of
freedom of motion (pitch, roll, and yaw). The simulator
cockpit contains required instruments for IFR flight. In
the tail portion of the simulator, 26 electronic cards
perform all necessary computing functions. Three servo
drives housed in the base of the simulator are controlled by
the flight dynamics computer contained within the 26 cards.
These three servo drives produce pitch, roll, and yaw
motions of the simulator.
No outside visual cues were provided. The simulator
windows were covered with translucent blinders to control
cockpit illumination and to reduce visual distraction. The
simulator is also equipped with simulated engine sound,
outer and middle marker beacons lights, and touch down tire
squeals. Certain flight simulator characteristics (e.g.,
engine controls, outside air temperature, rough air) can be .
changed using the control panel installed on the outside of
the simulator cabin.

34
Flight simulator modifications were necessary to permit
the flight task to be performed and to provide a means for
changing the level of mediaticnal task difficulty. An
audio-viewer slide projector (Kodak Ektagraphic Model 260)
was installed to present slides containing task problems
which emphasized mediational workload. Pilots were able to
see only the projector screen through the windshield, and
the rest of the projector was masked. In addition to the
remote control advance capability, the projector was
time-programmed using its audio cassette portion. Using
this programming capability, the slide advance rate was held
constant across all loading conditions. A connector and a
small omnidirectional microphone were mounted in the
simulator cockpit to record the pilot's verbal responses to
the visual slide problems.
The simulator modifications necessary to obtain secondary
task measur~s included a microswitch mounted on the control
yoke. This
beginning and
switch allowed the pilots
end of the time intervals
regularity and time estimation tasks.
to
in
signal the
the tapping
For the physiological measures the following
modifications were incorporated: 1) a connector for the
pulse rate sensor (plethysmograph), and 2) a CCTV camera and
zoom lens for video taping of pilots' pupil diameter changes
while performing the primary task.

35
Time estimation. The actuating lever of the microswitch
was positioned near tbe right hand grip of the yoke so the
pi lots could activate it with their right thumbs. A tape
recorded voice signaled the pilots to begin production of a
10-second time interval. The pilots estimated time by
activating the microswitch once for the beginning and once
for the end of the interval. The time between estimation
intervals was 20 seconds. A digital timer was located at
the experimenter's station for data collection.
Tapping regularity. The microswi tch also served as the
tapping instrument. Each microswi tch activation indicated
the end of the previous time interval and a reset for the
next one. The pilots were instructed to maintain regular
2-second tapping intervals. A recorded voice signaled the
beginning and the end of the session. The tapping signals
were routed to the EAI-380 computer, where ramps were
generated. The length of the ramps were dependent on the
intervals between taps. The computer output was then
recorded on a strip chart recorder (Sanborn 350).
Pupil dilation. A video camera (Panasonic model PK-700)
was installed on the front of the aircraft simulator. The
camera was mounted outside the windscreen and was aimed at
the pilot's eyes. Only the lens of the camera was visible
through the windscreen. The rest of the camera was masked

36
to reduce pilot distraction. The camera field of view
allowed for normal pilot head movements. Also, ambient
illumination was held constant to prevent changes in pupil
diameter due to changes in ambient illumination. The video
signals were sent through a connecting cable to a video tape
recorder (Panasonic model NV-8310). For the purpose of data
collection, recorded video signals were displayed on a CRT.
Pupil diameter was measured directly from the CRT screen
with the recorder in the freeze-frame mode.
To obtain reliable data from this measure, several
precautions were taken. First, pupil diameter was always
measured with the pilots fixating at the same position, that
is, observing the external Ektagraphic display. Second,
only pilots with light colored irises (i.e., light blue,
blue grey, or grey) were used so that maximum discrimination
in pupil diameter could be obtained. Third, the measure
taken was pupil diameter divided by iris diameter to remove
any biases of geometry associated with pilots looking at the
display from slightly different angles. Finally, the
measure was only taken after the pilots had observed the
Ektagraphic display for 3 seconds. This approach was used
to eliminate biases resulting from pupil dilation or
restriction due to change in luminance.

37
Pulse rate variabilitv. Pulse rate was measured using a
plethysmograph attached to the pilot's ear at the antihelix.
A plethysrnograph is a small transmitter and receiver of
light. The sensor associated with the plethysmograph senses
small changes in opacity of the antihelix and converts them
to an electrical signal. The signals were received by a
Hewlett-Packard 7807C heart rate monitor which computes
pulse rate from the plethysmograph signal. The pulse rate
signals were processed on-line by the EAI-380 hybrid
computer to produce the standard deviation of pulse rate
over the data interval.
Primary Task Design
Pilots perform a variety of tasks while flying an
aircraft. This study emphasized a mediational portion of
the piloting tasks. The universal operator behavior
categorization scheme (Table 2) developed by Berliner,
Angell, and Shearer (1964) was used to explain the specific
behaviors involved in a predominantly mediational task. The
designed piloting task emphasizing mediational activity
included at least 8 of the 13 mediational "specific
behaviors".
The basis of the mediational loading task was a group of
wind triangle problems. A wind vector triangle is basically

38
TABLE 2 Classification of Universal Operator Behavior Dimension
(Berliner, Angell, and Shearer, 1964)
Processes Activities S2ecific Behavior
Detects Inspects
Searching for and Observes receiving information Reads
Receives 1. Perceptual processes Scans
Surveys
Identifying objects, { Discriminates actions, events Identifies
Locates
Categorizes Calculates Codes
Information processing Computes Interpolates Itemizes Tabulates Translates z. Mediational processes Analyzes Calculates
Problem solving and Chooses decision-making Compares
Computes Estimates Plans
Advises Answers Communicates Directs
3. Commwiication processes Indicates Informs Instructs Requests Transmits
Activates Closes Connects
Simple/Discrete Disconnects Joins Moves
-l. Motor processes Presses Sets
{ Adjusts Aligns
Complex/Continuous Regulates Synchronizes Tracks

39
a vector presentation of aircraft
aircraft heading, and wind direction,
of significant magnitudes are present
speed, wind speed,
when wind conditions
(Appendix C). Wind
causes an airplane to drift away from the direction of
crosswind. Pilots are expected to know the necessary
corrections involved in maintaining the proper path over the
ground. For example, a crosswind of 40 mph on an airplane
moving at 100 mph requires a heading correction of 22
degrees. This relationship is apparent by constructing a
right-triangle with a 40 unit opposite leg, a 100 unit
adjacent leg, and a resulting hypotenuse of 108 units. The
hypotenuse gives the airplane speed necessary to maintain
the 100 mph corrected speed along the desired heading. The
angle between the
heading) and the
correction angle.
uncorrected airplane heading (indicated
corrected one is called the heading
Pilots differ in their ability to work. trigonometric
problems. Therefore, each problem presentation included a
"reference triangle" which directly corresponded to the
problem presented (Appendix C). The solutions to the
problems required pilots to perform one or more of the
following:
*compare triangles
*match corresponding triangle legs and/or angles
*add or subtract two angles (in degrees), or

40
*divide two numbers.
The Kodak Ektagraphic slide projector was used to present
the problems to the pilots. A triangle in the upper left
corner of each slide indicated the triangle leg uni ts and
the angles corresponding to the wind vector triangle. In
the center, the slide presented a red arrow indicating the
wind vector, a black arrow indicating the airplane corrected
speed and heading, and a dashed black arrow indicating the
desired speed and course over the ground. The three arrows
formed a wind vector triangle. The necessary information,
such as wind and aircraft speed and direction, was concisely
presented next to the arrows to reduce the pilot's
perceptual and reading effort. The presentation format
remained constant for different levels of loading. This
prevented the pilot from detecting the level of task
difficulty by mere appearance of slide complexity.
Therefore, the slides of medium and low difficulty contained
some redundant information. In the lower left corner of the
slide, pilots were asked a single question. The question
was: "GROUND SPEED?", or "AIRCRAFT HEADING?", or "ETA?".
ETA is an initialization for "Estimated Time of Arrival"
which can be calculated by di vi ding the given destination
distance by the computed ground speed.

41
Adjustment of Task Difficultv
For each problem (slide), three variables were used to
change the task difficulty. They were:
1. The difficulty of the question asked. A ground speed
calculation requires a direct comparison and
mathematical matching of the corresponding triangle
legs. An aircraft heading calculation requires an
addition or subtraction of the wind correction angle
in addition to the similar processes involved in
ground speed calculations. An
requires a comparison,
division.
matching,
ETA calculation
and subsequent
2. The numbers used in the trigonometric properties of
the reference triangle legs and angles. For example,
subtracting a wind correction angle of 27 degrees
from a heading of 286 degrees is more difficult than
subtracting 10 degrees from 310 degrees.
3. The degree to which rotational direction of the wind
vector triangle matches the reference triangle. A
mismatch of direction forces the pilot to rotate the
reference triangle mentally to fit the directions of
the problem triangle, thereby resulting in a higher
degree of mental loading.

42
Subjects
Forty-eight pilots participated as subjects in this
experiment.
technique.
voluntary,
at least a
hours.
Six pilots were used for evaluation of each
They were informed that their participation was
and they were paid by the hour. All pilots had
private pilot license and 50 or more flying
Pilots' experience levels were determined from personal
data questionnaires.
sextiles based on
sextiles contained
The entire group was then divided into
number of flight hours. One of the
only instrument-rated pilots. To
equalize experience for each workload technique examined,
one pi lot was drawn from each of the sexti les (to match a
group of six). The average number of flight hours were 80,
100, 140, 160, 440, and 800 for the groups one through six,
respectively.
By coincidence, only male pilots volunteered for the
experiment.

PROCEDURE
Initially, each subject was given general instructions
regarding the nature of the experiment (Appendix B).
Subsequently, the subject was given a consent form to read
and sign (Appendix B). This form indicated the subject's
rights, and in particular pointed out that the subject could
withdraw from the experiment after reading and receiving
more detailed instructions, or any time thereafter.
Pre-experimental Tests
Two preliminary tests were administered to each subject
prior to experimental sessions.
1. Personal data. Each pilot was
personal data sheet. It
regarding the pi lot's number
types of aircraft flown. It
asked to fi 11 out a
contained questions
of flight hours and
also asked for the
pilot's eye color. Eye color information was used to
optimize the pupil diameter measurements portion of
the experiment.
2. Knowledge of trigonometry. The mental loading task
used in this experiment was based on wind triangle
43

44
problems. Subjects, therefore, were tested to insure
that they had a minimum knowledge of basic
trigonometric relationships. They were first given a
sheet of data which reviewed basic trigonometric
relationships used in the experiment. Then, they
were given problems to work which contained the same
concepts. The passing score was approximately 50
percent correct responses on a timed test. Two
subjects failed the test and they were replaced.
After the trigonometric test, subjects were divided into
groups of six. Each group served as subjects for one
workload estimation technique. The following discussion
explains the general procedures used for the various
techniques (further details are explained in Appendix D).
Rating Scales
A subject assigned to this group was given instructions
pertaining to the primary task equipment and operations.
Then, the subject flew a practice flight for approximately
10 minutes. Subsequently, the subject flew an experimental
session. In this session, the subject experienced a setting
of mediational load which lasted approximately 6 minutes.
Then, the simulator was placed in an autopilot mode and the
subject read the necessary instructions and descriptions for

45
the rating scale to be used. After the rating was obtained
from the subject, the experimental session procedure was
repeated twice, once for each of the other two load levels.
Secondary Task Measures
A subject assigned to this group was given instructions
pertaining to the equipment and operation of the assigned
secondary task. The subject practiced on the secondary task
by itself for a period of five minutes. Thereafter, a
baseline score was obtained for the secondary task. Next,
instructions for the primary task and for the primary and
secondary tasks together were read by the subject. The
subject flew the simulator for approximately 5 minutes to
practice the primary task. Subsequently, the subject flew
the simulator for another five minutes to practice the
primary and secondary tasks together. Then, the subject
flew the simulator for the experimental trial in which he
performed the primary
Experimental data were
flight was repeated
conditions.
and secondary tasks simultaneously.
obtained during this period. This
for the remaining two loading

46
Physiological Measures
A subject in this group began with an adaptation session
which involved sitting in the aircraft simulator quietly for
a period of approximately 10 minutes. This session was
necessary for the subject to reach a normal (baseline)
physiological response level. Late in this 10 minute
session, physiological baseline data were obtained.
Thereafter, instructions for the primary task were given.
After the instructions, the subject flew a primary task
practice flight for approximately 10 minutes. Subsequently,
the subject repeated the same flight, experiencing a
mediational load level, for data gathering. After the
completion of the first data gathering flight, two
additional data gathering flights were run, one for each of
the remaining two mediational load settings.
Primary Task Measures
A subject in this group first read the instructions for
the primary task. Then he flew the simulator for
approximately 10 minutes, experiencing the practice
mediational load. This run was then repeated for data
gathering. Subsequently, two more experimental flights were
run for the remaining two mediational load conditions.

47
Flight Task
Prior to each flight, the simulator was positioned at a
predetermined heading. The heading used for the low,
medium, and high loading conditions was the magnetic north
(360 degrees). Subjects were then instructed to take off,
to climb to 2000 ft with the rate of climb of 500 ft/min,
and then to level the aircraft and maintain 2000 ft
altitude. Once they had reached this altitude,
instructed to maintain an airspeed of 100 mph.
they were
After the
simulated aircraft had been trimmed, the remainder of the
primary task loading condition involving the presentation of
wind trangle problems was introduced. Between loading
conditions, the simulated aircraft was placed in "altitude
hold" and the motion base was deactivated. This produced a
condition similar to autopilot control in perfectly calm
air. Subjects were given a 5-minute rest between loading
conditions.
All of the flight parameters (controllable by the remote
panel) were positioned at their normal settings, except for
rough air. To force the subject to monitor and p~rform the
flight task continuously, while attending the mediational
loading task, windgusts having an r.m.s. amplitude of
approximately three mph were introduced. The level of this
windgust was the same for each loading condition. The

48
windgusts required the subject to make corrections to
maintain straight and level flight and correct heading.
Each loading condition took approximately 6 minutes.
Subjects responded verbally
each slide. Concurrently,
to the question presented on
data were recorded from the
assigned technique and other primary task measures. Rating
scale scores were obtained after the completion of each
loading condition. After data had been gathered in each
run, subjects were instructed to descend (at a rate of 500
ft/min) and land the aircraft while maintaining the north
heading. After the last flight session had been completed,
subjects were paid for the total time of their
participation, their questions were answered, and they were
released.
Specific Secondary Tasks Instructions
The following procedures were used in instructing the
subjects for the various secondary tasks.
Time estimation. Each subject assigned to this technique
was instructed to produce intervals of 10 seconds by
pressing a microswi tch mounted on the control yoke of the
simulator. A recorded male voice signaled the subject to
begin producing an interval by using the word "now". The
subject then pressed the microswitch to begin the interval

49
and later pressed the microswitch a second time to end the
interval. There was an interval of 20 seconds between "now"
messages.
Tapping regularity. Subjects in this group were
instructed to depress the microswitch every two seconds with
their right thumb. Subjects were told that the "downstroke"
of the switch ended one interval and began the next. In
other words, interval timing was independent of the length
of time the microswitch was depressed. This task was
performed continuously during the data taking period. The
beginning and end of the period were signaled by the
experimenter over the intercom system.
Data taking period. A
approximately five minutes.
data taking period lasted
Pilots performed the wind
triangle task (and the secondary tasks where required) for
an interval of 5-1/2 minutes. Data taking began
approximately 1/2 minute into the wind triangle task.
RESULTS
Sensitivity Analvsis
The sensi ti vi ty analysis was directed at answering two
major questions:
1. Which techniques were sensitive to mediational load?
2. Among those techniques sensitive, which ones were
relatively more sensitive than others?
The procedure illustrated in Figure 4 was followed for the
sensitivity analysis.
by Connor (1981).
This is similar to the procedure used
Raw scores computations. For some of the techniques the
data were recorded in the form of unscaled signal values or
verbal responses during the instructed tasks. These signal
values and responses had to be converted to raw score values
for data analysis.
in Appendix E.
computations, the
The raw score computations are defined
Upon completion of the raw score
scores were placed in a data matrix in
which there were six scores for each cell, one per subject.
Conversion to z-scores. The raw scores in the data
matrix represent different entities, e • g • / pulse rate
50

51
RAW SCORES COMPUTATION I I v
CONVERSION TO Z-SCORES I I v
OVERALL ANOVA I I v
SIMPLE EFFECTS F-TESTS I I v
ESTIMATING SAMPLE SIZE OF NONSIGNIFICANT TECHNIQUES I I v
NEWMAN-KEULS COMPARISONS I I v
PLOTTING OF MEANS FOR SENSITIVE TECHNIQUES I I v
CLASSIFICATION OF TECHNIQUES
Figure 4: Procedural steps for the sensitivity analysis

52
variability, a rating scale score, or a secondary task
score. To detect true differences in the techniques, rather
than scaling value differences, the raw scores were
transformed into z-scores (standard scores). (A z-score
computation is the raw score minus the mean of the scores,
divided by the standard deviation of the scores.)
For each given technique, z-score computations were based
upon all the scores for that techni~e alone. Subsequently,
all of the z-scores were placed in a matrix in which there
were six scores for each cell, one score per subject.
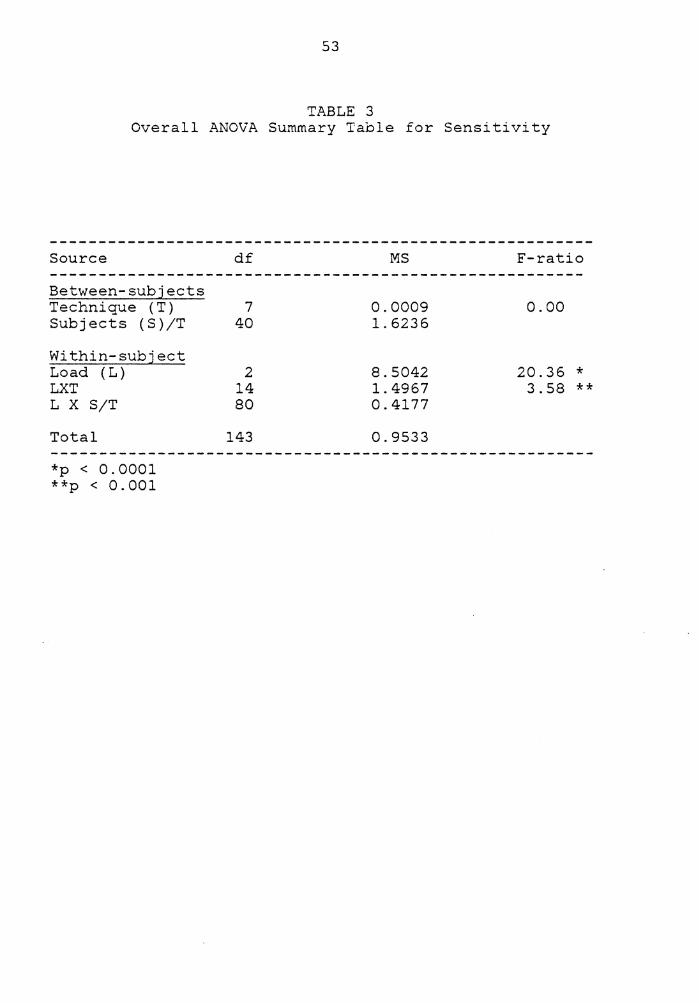
Overall ANOVA
An overall analysis of variance (ANOVA) was performed on
the standardized scores ( z-scores). Since z-scores were
used, a technique main effect was precluded. A significant
main effect of load was found. This indicates that the
manipulation of load was effective in changing the response
scores obtained in this experiment. A significant technique
by load interaction was found. These results are summarized
in an ANOVA summary table (Table 3).
53
TABLE 3 Overall ANOVA Summary Table for Sensitivity
Source
Between-subjects Technique ( T) Subjects (S)/T
Within-subject Load (L) LXT L X S/T
Total
*p < 0.0001 **p < 0.001
df
7 40
2 14 80
143
MS
0.0009 1. 6236
8.5042 1. 4967 0.4177
0.9533
F-ratio
0.00
20.36 * 3.58 **

54
Simple Effects F-tests
There was a significant load by technique interaction
which indicates that the response scores were differentially
affected by changes in the load variable. In other words,
scores of some techniques were more responsive to changes in
load than others.
The normal procedure for determining the individual
effect of load on each technique is the use of simple
effects F-tests. Eight simple effects F-tests were
performed (one for each technique) to isolate those
techniques which contributed to the interaction effect. The
simple effects F-tests use the overall ANOVA error term (L X
S/T) as the denominator error term of the F-ratios. The
results of these tests are presented in Tables 4, 5, 6, and
7. Each table contains F-test results for the two
techniques in each classification as presented in the
introduction. The figures following each table (Figures 5,
6, and 7) are the plots of mean z-scores for the techniques
demonstrating significance (sensitivity).
In the opinion measure group, the Modified Cooper-Harper
scale (MCH) showed a significant effect of load. The
Multi-Descriptor rating scale (MD) showed no significant
effect of load.

55
In the secondary task group, the time estimation measure
(TE) showed a significant load effect. However, no
significant effect of load was present for tapping
regularity measure (TR).
In the primary task measure group, Mediational Reaction
Time (MRT) showed a significant main effect of load.
However, the number of control movements per second showed
no significant effect of load.
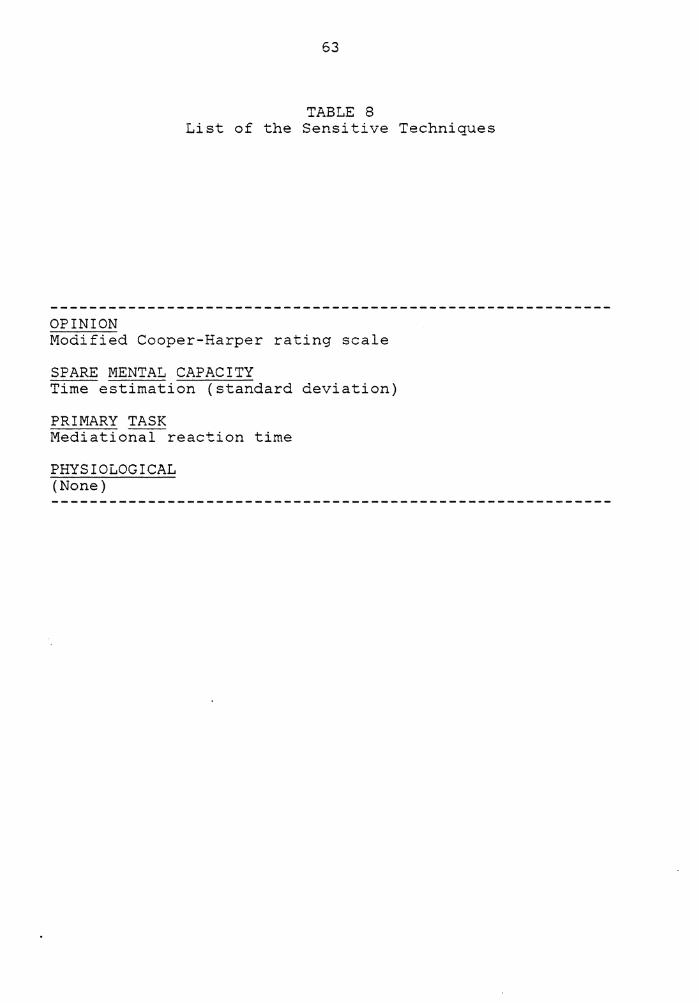
In the physiological measures group, neither the pulse
rate variability measure nor the pupil dilation measure
showed a significant load effect. Table 8 lists the
sensitive measures under their associated mental workload
technique categories.
Sample Size Estimation
If an ANOVA test yields nonsignificance, it should not be
taken as "proof 11 that treatme"nt effects (e.g. , the load
effect) are completely absent (the null hypothesis is true).
It is possible that the effects to be detected are too small
in relation to the sensitivity (power) of the experiment.
In·other words, a conclusion drawn from an F-test is valid
only . .;:-J. ... the experiment possesses adequate power. Keppel
(1973) explains that there is a definite relationship
(formula) among power of the test, number of subjects used,

56
TABLE 4 Summary Table for Rating Scales Simple Effects F-Tests
Source df
Subject (S) 5 Load (L) 2 L X S/T 80
Subject (S) 5 Load ( L) 2 L X S/T 80
MS
Modified Cooper-Harper
0.8067 4.8524 0.4177
Multi-descriptor scale
2.2533 1. 0679 0.4177
F-ratio p-value
11.62 <0.001
2.56 0.068

57
1.
o. LL.I c:: 0 u (/)
I 0.0 N z <C LL.I :re:
-0.5
-1.0
LOW MEDIUM HIGH
LOAD
Figure 5: Mean z-scores for Cooper-Harper rating scale measure vs. load.

58
TABLE 5 Summary Table for Secondary Tasks Simple Effects F-Tests
Source
Subject (S) Load (L) L X S/T
Subject (S) Load (L) L X S/T
df
5 2
80
5 2
80
MS
Time estimation
0.7669 4.5747 0.4177
Tapping regularity
0.5954 0.5731 0.4177
F-ratio p-value
10.95 <0.001
1. 37 >0.05

59
1. L ..J
1. o- -
o. 5- -
lJ..J 0:::: 0 <-> en
I 0. N 0 z <t: lJ..J :E:
-0. 5- -
-1.0 - -
LOW MEDIUM HIGH
LOAD
Figure 6: Mean z-scores for the time estimation measure vs. load.

60
TABLE 6 Summary Table for Primary Tasks Simple Effects F-tests
Source
Subject (S) Load (L) L X S/T
Subject (S) Load (L) L X S/T
df
5 2
80
5 2
80
MS
Mediational reaction time
0.2441 7.2431 0.4177
Control movements
2.9908 0.1966 0.4177
F-ratio p-value
17.34 <0.0001
0.47 >0.05

61
1 . r-....
1. ('- -
o. 5- -LL.J a:: 0 u U')
I o. N z
0 I I <C LL.J :E:
-0. s~ -
-1. a-- -
LOW MEDIUM HIGH
LOAD
Figure 7: Mean z-scores for the mediational reaction time measure vs. load.

62
TABLE 7 Summary Table for Physiological Measures Simple Effects F-
Source
Subject (S) Load (L) L X S/T
Subject (S) Load (L) L X S/T
df
5 2
80
5 2
80
tests
MS
Pulse rate variability
2.3617 0.3979 0.4177
Pupil dilation
2.9695 0.0757 0.4177
F-ratio p-value
0.95 >0.05
0.18 >0.05
63
TABLE 8 List of the Sensitive Techniques
OPINION Modified Cooper-Harper rating scale
SPARE MENTAL CAPACITY Time estimation (standard deviation)
PRIMARY TASK Mediational reaction time
PHYSIOLOGICAL (None)

64
and experimental error obtained. In terms of workload
measurement, the issue of the number of subjects required is
one of importance, especially from the standpoint of
economics. A sensitive technique requiring a large number
of subjects would not be cost-effective to implement in a
operational flight environment.
The procedure in Keppel (1973) was followed to estimate
the number of subjects required to detect a significant load
effect for the techniques failing to demonstrate
sensi ti vi ty. A significance level of 0. 05 and a power of
approximately 0. 8 were used for estimating the number of
subjects.
Table 9.
The results of these estimates are presented in
Newman-Keuls Comparisons
The three techniques showing sensi ti vi ty to mediational
load (modified Cooper~Harper, time estimation, and
mediational reaction time) require further analysis. The
locus and direction of the effect of load on these
techniques was examined using Newman-Keuls comparisons. The
comparisons were performed on the mean z-scores at the three
load levels. Table 10 presents the results of these
comparisons for the sensitive techniques. All three
sensitive techniques indicate that the mean z-scores
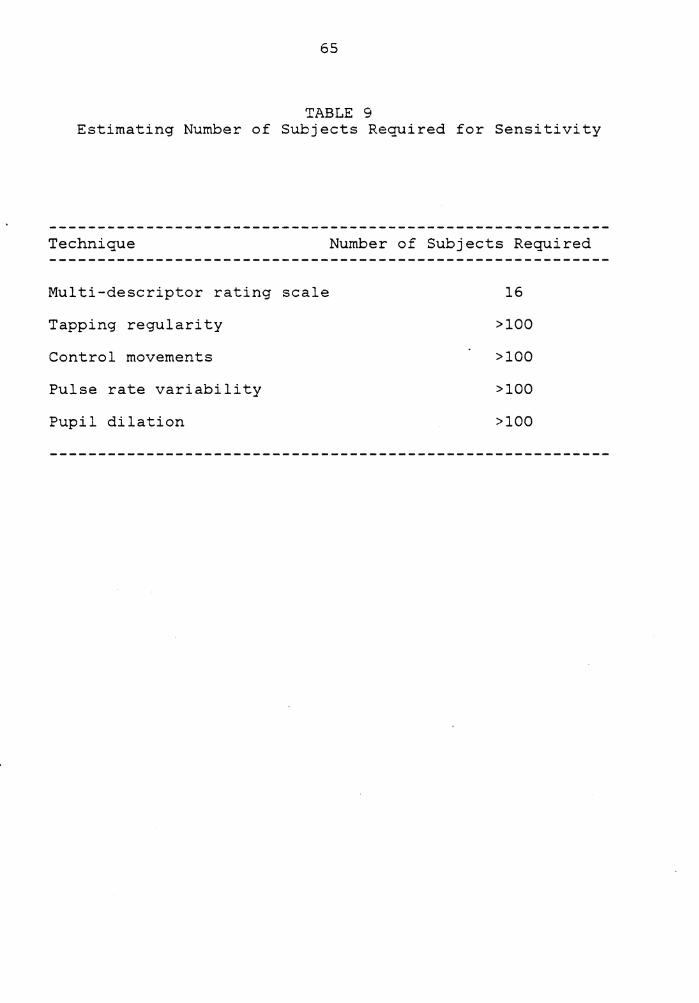
65
TABLE 9 Estimating Number of Subjects Required for Sensitivity
Technique Number of Subjects Required
Multi-descriptor rating scale 16
Tapping regularity >100
Control movements >100
Pulse rate variability >100
Pupil dilation >100

66
(therefore the raw scores) increase monotonically across the
three load levels.
The Newman-Keuls results for the modified Cooper-Harper
scale (Table 10) show
difference between low
that
and
there
medium
was no significant
loadings. But, a
significant difference between medium and high loading in
addition to a significant difference between low and high
loading was detected.
The Newman-Keuls results for the mediational reaction
time measure indicates that the differences between all
pairs of means were statistically significant.
Finally, the Newman-Keuls results for the time estimation
(standard deviation) measure indicate a significant
difference between the mean z-scores of low compared to
medium and high loading. But, no difference was detected
between medium and high loading mean z-scores. All
Newman-Keuls comparisons were conducted using a significance
level of 0.05.
Classification of Techniques
One objective of this study was to determine the relative
sensi ti vi ty of each technique to discriminate among
different load levels. Based on the results of the
Newman-Keuls tests, a logical classification of the
sensitivity of all the techniques is presented in Table 11 .

67
TABLE 10 Newman-Keuls Test for the Sensitive Measures
Modified Cooper-Harper scale*
LOW MEDIUM Load level means -0.8228 -0.1372
I-----------------------I
HIGH 0.9600
I--------I
Mediational reaction time
LOW Load level means -1.0015
I--------I
LOW Load level means -0.9857
I--------I
MEDIUM -0.1742
I--------I
Time Estimation*
HIGH 1.1752
I--------I
MEDIUM HIGH 0.3087 0.6768
I----------------------I
* Means with a common underline do not differ significantly at the p < 0.05 level.
68
A technique was considered to be completely sensitive
(class I) if it discriminated between all pairs of load
levels (i.e., low-medium, low-high, and medium-high).
A technique was considered to be partly sensitive (class
I I) if it did not discriminate between all pairs of load
levels but did discriminate between at least one pair of
load levels. Finally, techniques not demonstrating
sensitivity were categorized as class III. This class
includes all techniques except those in classes I and II.
An additional question studied in the sensitivity
analysis was whether the experience level of the subjects
had any effect on the obtained scores. To study the effect
of experience level, an ANOVA was performed on the
sensi ti vi ty data matrix. The matrix was collapsed across
the technique factor and the experience level of the
subjects was considered as a separate independent variable.
A two way ANOVA was performed on the z- scores and the
results are presented in Table 12
The z-scores showed a significant main effect of
experience level. Also, as expected, a significant main
effect of load was present. However, no load by experience
level interaction was found.
Further analysis was necessary to study the trend of the
z-scores versus the experience levels of the pilots used in

69
TABLE 11 Classification of Sensitive Techniques
Class I: Completely sensitive Mediational reaction time
Class II: Partly sensitive Modified Cooper-Harper scale Time estimation (standard deviation)
Class III: Not sensitive The remaining five techniques

70
TABLE 12 ANOVA Summary Table for Experience Level
Source
Between-subjects Experience Level (EL)
Linear component Nonlinear component
Subject (S)/EL Linear component Nonlinear component
Within-subject Load ( L) L X EL L X S/EL
Total
* p = 0.0423 ** p < 0.0001
df
5 ( 1 ) (4) 42 ( 7 )
(35)
2 10 84
143
MS
3.022 4.500 2.651 1.187 2.110 1. 001
8.504 0.549 0.582
0.953
F-ratio
2.55 * 2.13 2.65
14.61 ** 0.94
71
this experiment.
each experience
First the mean z-scores were plotted for
level (Figure 8). In this figure,
experience levels
hours of 80, 100,
l, through
140, 160,
6 represent
440, and 800,
Then, a trend analysis was performed on the
trend analysis involved the computation
polynomial coefficients to be multiplied
z-scores for sums of squares calculations
average flight
respectively.
z-scores. The
of orthogonal
by the mean
(Myers, 1966).
The linear component of the experience level (EL) F-ratio
was computed and was not found to be significant (Table 12).
This indicates that the slope of the line of best fit
(linear trend) does not significantly differ from zero. In
other words, no overall increasing or decreasing z-scores
trend was observed with increases in the experience levels
of the pilots. Also, the nonlinear component of the
experience level
summary, the
(EL) was not found to be significant.
z-scores obtained did not show
In
any
interpretable pattern with the increase in experience level.
Intrusion Analysis
The purpose of this section is to evaluate possible
interference of equipment and procedures used for estimating
pilot mental workload with performance on the primary flight
task. For each technique measurement condition, five

72
l,5..-~~~~~~~~~~~~~~~-Ex~o-er_i_e_n_ce~L-ev_e_l~-A-v-e-.-H-0-u-rs-...,
l 80 2 100 3 140 4 160 5 440 6 800 1.0
a 0.5
0 w
~ ~
~ 0.0 0 0 0 0
-0.S
-1.0
1 2 3 4 5 6
EXPERIENCE LEVEL
Figure 8: Mean z-scores versus experience level.

73
primary task measures were obtained. The eight technique
measurement conditions were: modified Cooper-Harper rating
scale (MCH), multi-descriptor rating scale (MD), time
estimation (TE), tapping regularity (TR), pupil dilation
(PD), pulse rate variability (PRV), control condition one
(Cl), and control condition two (C2). The Cl and C2
conditions were those under which the two primary task
measures (mediational reaction time and number of control
movements) data were obtained for the sensitivity analysis.
Significant differences among groups of primary task scores
is an indication that the addition of equipment and
procedures used for data collection intrude on the primary
task performance.
It is assumed that the equipment and procedures used in
Cl and- C2 measurement conditions were not intrusive to
primary task performance. Therefore, the primary task
measures obtained in Cl and C2 can be used as a standard for
comparing intrusion of the other six measurement conditions.
The five primary task measures obtained were designed to
evaluate different aspects of primary task (piloting task)
performance. They were as follows:
1. Percent error of the mediational (slide) problems.
This measure is indicative of the accuracy of
subjects' responses to the mediational loading
portion of the overall piloting task.

74
2. Mediational reaction time. This measure was the
average time that the subjects spent before providing
a verbal answer to the slide problems. This measure
is indicative of the speed of subjects' responses to
the mediational loading portion of the overall
piloting task.
3. Pitch high-pass mean-squared (PHPMS) error. This
measure (explained in detail in Appendix E) provides
information as to how accurately and reliably the
subjects were tracking in pitch of the aircraft.
4. Roll high-pass mean-squared (RHPMS) error. This
measure (explained in detail in Appendix E) provides
information as to how accurately and reliably the
subjects were tracking in roll of the aircraft. The
PHPMS and RHPMS error measures are indicative of the
accuracy of the subjects in performing the flight
task portion of the overall piloting task.
5. Number of control movements per second. This measure
(explained in detail in Appendix E) is indicative of
the amount of control (aileron, elevator, and rudder)
activity exhibit~d by the subjects.
The procedure outlined in Figure 9 was followed for the
intrusion analysis.

75
OVERALL MANOVA I I v
INDIVIDUAL ANOVAs I I v
NEWMAN-KEULS TESTS I I v
CLASSIFICATION OF INTRUSIVE TECHNIQUES
Figure 9: Procedural steps for the intrusion analysis

76
Overall MANOVA
A multivariate analysis of variance (MANOVA) was
performed to examine the overall effect of technique
(condition), load, and the interaction of technique and load
on the five primary task measures combined. The main effect
of load was significant. The main effect of technique was
also significant. No significance was found for the load by
technique interaction. Wilk's criterion (Rao, 1965) and a
level of significance of 0.05 were used in the above MANOVA.
The results of the MANOVA are summarized in Table 13.
The significant main effect of technique indicates that
primary task measures (as a group) are affected by different
Further analysis was
task measures were
techniques used in this experiment.
required to determine which primary
affected (or interfered with) by which techniques
(Finkelman, Wolf, and Friend, 1977).
Individual ANOVAs
The overall MANOVA found no significant interaction
effect. The main effect of technique was further studied
using five individual ANOVAs, one for each primary task.
The results of these ANOVAs are summarized in Tables 14, 15,
16, 17, and 18 for error rate, mediational reaction time,
pitch HPMS, roll HPMS, and control movements, respectively.

77
TABLE 13 MANOVA Summary for Intrusion Analysis (Wilk's Criterion)
Source p df (H) df (E) U-Statistic
Between-subjects ----------------Technique ( T) Subject (S)/T
Within-subject --------------
.Load (L) L X T L X S/T
*p < 0.05 **p < 0.0001
5
5 5
35 153 (Error term for T)
10 152 70 365
(Error term for L
P = number of dependent variables df (H) = degrees of freedom for treatment df (E) = degrees of freedom for error
E U-Statistic (likehood ratio) = ------
E+H
(Approx. F-ratio)
1. 72 *
37.23 ** 1.22
and LXT)
where H = sum of squares and cross-products matrix for treatment
E = sum of squares and cross products matrix for error

78
T.Z\BLE 14 Intrusion ANOVA Summary for Error Rate
Source
Between-subjects
Technique (T) Subject (S)/T
Within-subject
Load (L) L X T L X S/T
Total
*p = 0.0025 **p < 0.0001
df
7 40
2 14 80
143
MS
1135.00 290.01
19908.84 342.40 126 .19
519.27
F-ratio
3.91 *
157.77 ** 2.71 *

79
TABLE 15 Intrusion ANOVA Summary for Mediational Reaction Time
Source
Between-subjects
Technique (T) Subject (S)/T
Within-subject
Load (L) L X T L X S/T
Total
*p = 0.0065 **p < 0.0001
df
7 40
2 14 80
143
MS
31.48 9.37
972.81 1. 56 3.45
19.85
F-ratio
3.36 *
281.59 ** 0.45
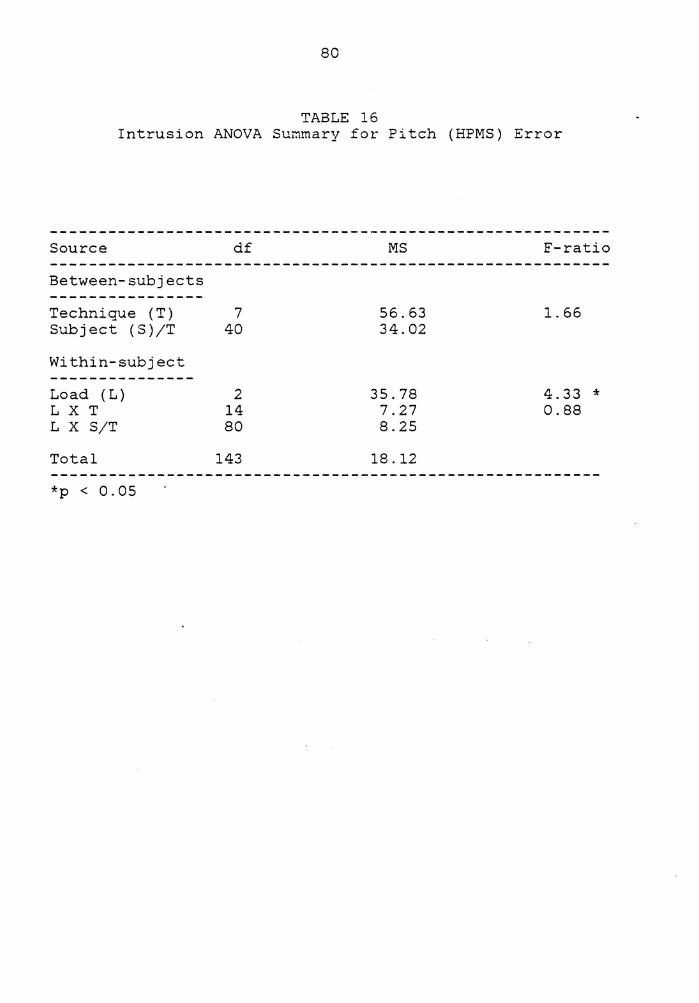
80
TABLE 16 Intrusion ANOVA Summary for Pitch (HPMS) Error
Source
Between-subjects
Technique (T) Subject (S)/T
Within-subject
Load (L) L X T L X S/T
Total
*p < 0.05
d£
7 40
2 14 80
143
MS
56.63 34.02
35.78 7.27 8.25
18.12
F-ratio
1. 66
4.33 * 0.88

81
TABLE 17 Intrusion ANOVA Summary for Roll (HPMS) Error
Source
Between-subects
Technique (T) Subject (S)/T
Within-subject
Load (L) L X T L X S/T
Total
*p<0.0001
df
7 40
2 14 80
143
MS
661.77 768.92
1343.30 115.72 122.22
345.97
F-ratio
0.86
10.99 * 0.95

82
TABLE 18 Intrusion ANOVA Summary for Control Movements
Source
Between-subjects
Technique (T) Subject (S)/T
Within-subject
Load (L) L X T L X S/T
Total
df
7 40
2 14 80
143
MS
0.39 0.65
0.09 0.03 0.03
0.22
F-ratio
2.71
0.194 0.435
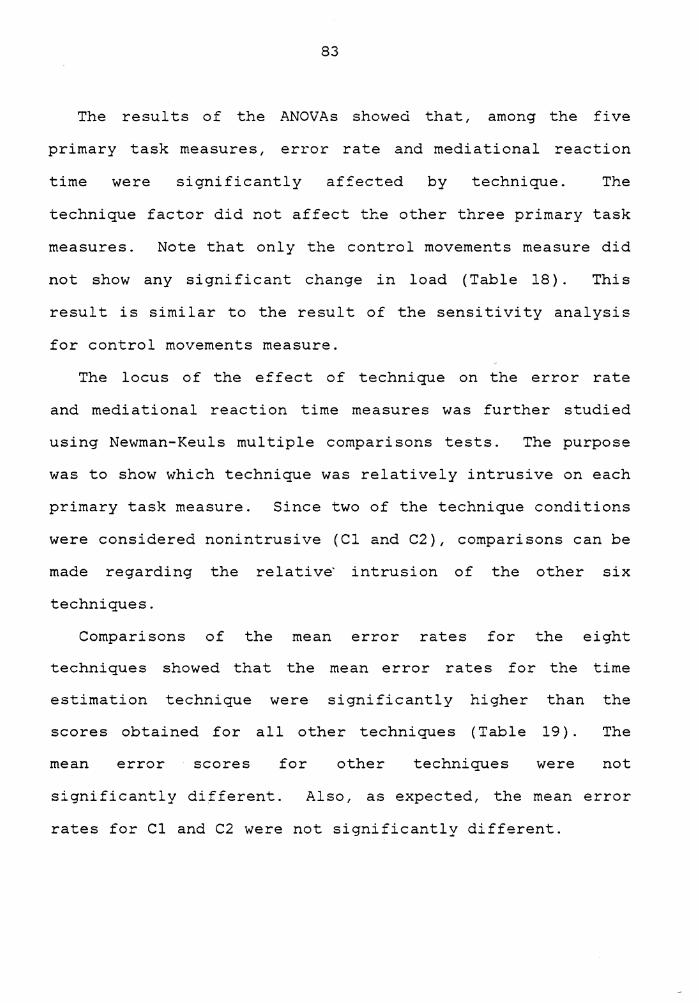
83
The results of the ANOVAs showed that, among the five
primary task measures, error rate and mediational reaction
time were significantly affected by technique. The
technique factor did not affect the other three primary task
measures. Note that only the control movements measure did
not show any significant change in load (Table 18). This
result is similar to the result of the sensitivity analysis
for control movements measure.
The locus of the effect of technique on the error rate
and mediational reaction time measures was further studied
using Newman-Keuls multiple comparisons tests. The purpose
was to show which technique was relatively intrusive on each
primary task measure. Since two of the technique conditions
were considered nonintrusive (Cl and C2), comparisons can be
made regarding the relative intrusion of the other six
techniques.
Comparisons of the mean error rates for the eight
techniques showed that the mean error rates for the time
estimation technique were significantly higher than the
scores obtained for all other techniques (Table 19). The
mean error scores for other techniques were not
significantly different. Also, as expected, the mean error
rates for Cl and C2 were not significantly different.

Mean
33.33 19.78 19.72 18.00 13.72 12.78
9.72 8.22
84
TABLE 19 Newman-Keuls Test for Error Rate
Technique Grouping * TE A MCH B PRV B PD B Cl B C2 B MD B TR B
* Means with the same letters do not differ significantly at the p < 0.05 level.
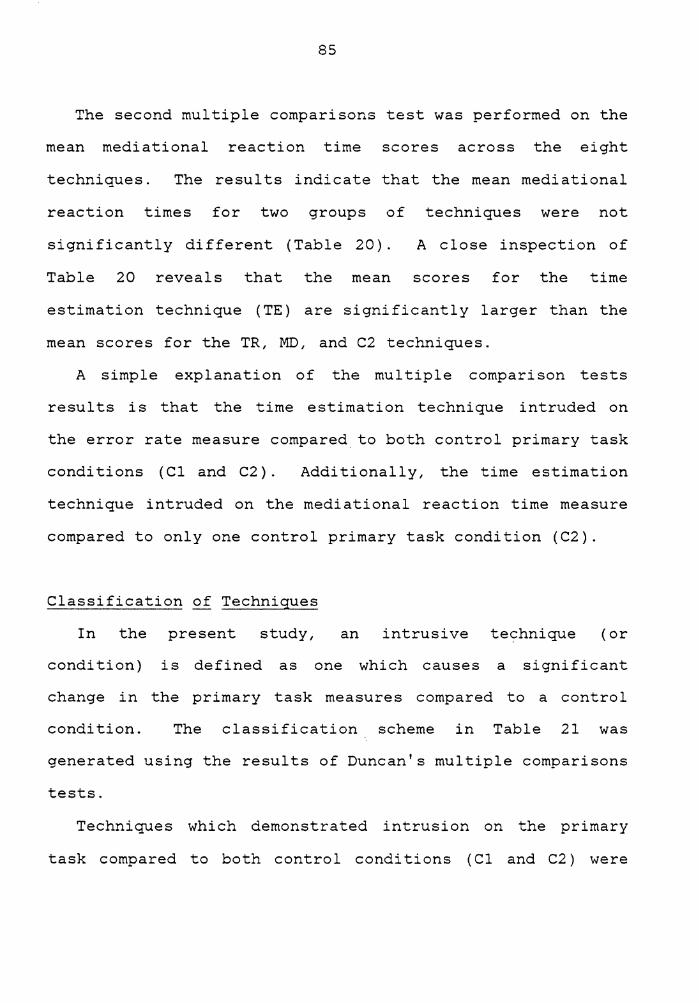
85
The second multiple comparisons test was performed on the
mean mediational reaction time scores across the eight
techniques. The results indicate that the mean mediational
reaction times for two groups of
significantly different (Table 20).
Table 20 reveals that the mean
techniques were not
A close inspection of
scores for the time
estimation technique (TE) are significantly larger than the
mean scores for the TR, MD, and C2 techniques.
A simple explanation of the multiple comparison tests
results is that the time estimation technique intruded on
the error rate measure compared to both control primary task
conditions (Cl and C2). Additionally, the time estimation
technique intruded on the mediational reaction time measure
compared to only one control primary task condition (C2).
Classification of Techniques
In the present study, an intrusive
condition) is defined as one which causes
technique (or
a significant
change in the primary task measures compared to a control
condition. The classification scheme in Table 21 was
generated using the results of Duncan's multiple comparisons
tests.
Techniques which demonstrated intrusion on the primary
task compared to both control conditions (Cl and C2) were

86
TABLE 20 Newman-Keuls Test for Mediational Reaction Time
Mean Technique Grouping * 14.94 TE A 14.36 PRV A B 13.22 MCH A B 12.56 PD A B 12.27 Cl A B 11. 87 TR B 11. 54 MD B 11.29 C2 B
* Means with the same letters do not differ significatly at the p < 0.05 level.

87
included in class I. Techniques which demonstrated
intrusion on the same primary task compared to only one
control condition (Cl or C2) were included in class II.
Finally, class III techniques did not demonstrate any
intrusion.
In summary, the time estimation condition was found to be
a class I intrusive· technique, and pulse rate variability
was found to be a class II intrusive technique.
Finally, an analysis was performed to determine whether
or not level of experience had an effect on the five primary
task measures combined. This analysis is similar to the one
performed to determine the intrusion of the techniques upon
the primary task measures. However, it should be understood
that the results dealing with experience level are simply
further primary task results ·and do not provide an
indication of the effect of experience on intrusion. A
MANOVA was performed on the primary task raw scores with the
six levels of experience as a new independent variable. The
results are summarized in Table 22 No significant overall
effect of experience level was found. Similarly the
interaction of load and experience level was not
significant. Therefore, an increase in the experience level
did not affect the combined primary task measures.
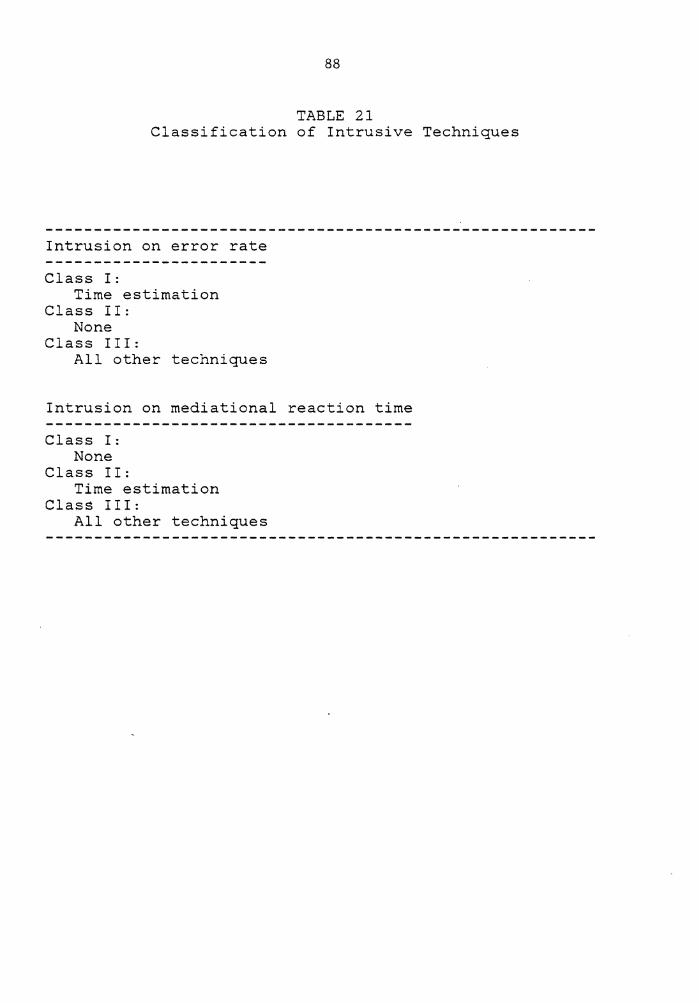
88
TABLE 21 Classification of Intrusive Techniques
Intrusion on error rate
Class I: Time estimation
Class II: None
Class III: All other techniques
Intrusion on mediational reaction time
Class I: None
Class II: Time estimation
Class III: All other techniques

89
TABLE 22 MANOVA Summary for Experience Level (Wilk's
Criterion)
Source p df (H) df (E) U-Statistic (approx. F-ratio)
5 25 120 0.96 Between-subjects Experience Level(EL) Subject {S)/EL (Error term for EL)
Within-subject Load (L) 5 10 136 31.50* L X EL 5 50 313 0.76 L X S/EL (Error term for L and L X EL)
*p < 0.0001
p = number of dependent variables df (H) = degrees of freedom for treatment df (E) = degrees of freedom for error
E U-Statistic (likehood ratio) = ------
E+H
where H
E
sum of squares and cross-products matrix for treatment sum of squares and cross-products matrix for error

DISCUSSION
The primary goal of this section is to review the major
findings of this experiment and provide a rationale for
recommending techniques as measures of pilot mediational
workload. In this experiment, mediational load was
manipulated by instructing the subjects to solve wind
triangle problems while flying an aircraft simulator within
specified tolerances of heading, altitude, and airspeed.
This was found to be an effective method of increasing pilot
mental workload from low to high. The reasons are ( 1) a
significant main effect of load was found in the sensitivity
analysis, and (2) a significant main effect of load was
found in the intrusion analysis.
Sensitivity
The individual ANOVAs indicated that, out of eight
workload measures examined, only three demonstrated
sensitivity to (significant effect of) load. These measures
were:
1. modified Cooper-Harper rating scale,
2. time estimation standard deviation, and
90

91
3. mediational reaction time.
The next step was to determine the relative sensitivity
of these techniques. This step in the analysis is important
in that some techniques are able to detect wide differences
of load and some are not. More importantly, a technique
which can detect load differences only in low loading
situations should not be used for tasks requiring high
mental workload.
The mediational reaction time measure sh6wed significant
differences within all pairs of load levels. This measure
seems to be the most sensitive one in this experiment.
However, it should be noted that the measure may not be
fully applicable in some mediational tasks. If the task
does not have a well-defined beginning point and response
point, mediational reaction time will most likely not be
measureable.
The modified Cooper-Harper scale did not show significant
differences in scores between the low and medium load
levels. However, significant differences were found in the
comparison of the low and high load levels and in the
comparison of the medium and high load levels.
Consequently, this measure would be useful £or detecting
differences between moderate and high separations of load.
The time estimation measure did not show significant

92
differences between the medium and high load levels only.
Therefore, this measure would be useful for detecting
mediational load differences in the low to medium region.
This measure seems to complement the rating scale measure in
detecting mediational load levels.
The rest of the measures did not demonstrate sensitivity
to the increase in mediational load. The reviewed
literature on the nonsensitive measures generally favors
using them as estimators of mental workload. The question
arises as to why these measures did not demonstrate
sensitivity. The following discussion focuses on the
possible factors which may have caused the remaining five
measures to show no significant differences between the
three load levels.
First, the separations of the load levels might not have
been large enough for the technique to discriminate reliably
between scores measured at different load levels. In other
words, some studies may have used wider separations of load
in their experiments. However, there is indication that the
separations of load levels used in the present study were
quite wide. Mediational reaction time, for example,
demonstrated that the subjects clearly required
progressively more time to solve the problems as load was
increased from low to medium and from medium to high.

93
Second, the equipment and procedures used to collect data
could affect the resulting sensi ti vi ty of the techniques
under investigation. Based on existing literature, most of
the equipment and procedures used in this study were
comparable to those used in other mental workload studies.
For the pupil dilation measure, subjects' pupil diameters
were measured manually from the television screen. A much
more expensive alternative would be to use automatic or
computerized procedures to measure the pupil size with high
accuracy. It is possible that a computerized procedure
would have yielded sensitivity for pupil dilation measure.
However, it appears that in any case pupil diameter would
not be as sensitive as the other three measures which
demonstrated sensitivity in this study.
Third, the type of primary task performed by the subjects
may have a bearing on the resulting sensi ti vi ty of the
mental workload measure (Wierwille, 1979). The four types
of tasks suggested by Wierwille ( 1979) are: psychomotor,
mediational, perceptual, and communications. The
psychomotor primary task loading was used in an experiment
involving 20 measures of pilot mental workload (Connor,
1981) . In general, the equipment and procedures were
similar to the ones used in this experiment. The sensitive
measures that matched the sensitive measures obtained in

94
this experiment were Cooper-Harper rating scale (designed
for psychomotor load) and time estimation standard
deviation. No intrusion was found for the techniques used
in Connor's ( 1981) study. The present study found time
estimation techn±que to be intrusive on the mediational
primary task measures.
The primary task used in this experiment was designed to
be predominantly mediational or cognitive within an overall
piloting task. However, there is no doubt that the designed
primary task required some visual (perceptual) attention.
Also, with the application of a small random windgust,
subjects were required to exhibit some psychomotor activity
to control the aircraft simulator within the specified
tolerances. The purpose was to increase the subjects'
mediational load while requiring a minimum effort for the
visual and psychomotor aspects of the task. Therefore,
results of this experiment must be .interpreted
attention to the type of piloting task used. It is
the
with
the
opinion of the author that the piloting task used in this
experiment did emphasize mediational processes. The primary
task included a- majority of the "mediational specific
behaviors" categorized by Berliner et al. (1964).
Finally, the number of subjects (pilots) used directly
affects the power of the experiment to detect differences

95
between the scores obtained for a given technique. The
power analysis performed for the nonsensitive techniques
provided mathematical relationships among the level of
significance (for rejecting the null hypothesis), power of
the F-tests, and the estimates of error variances. A
significant level of 0. 05 and a power of 0. 8 (fairly high
power) was used for these tests. The results indicated
that, all other factors equal, only the multi-descriptor
bipolar adjective rating scales could have demonstrated
sensitivity with 16 subjects (instead of six) in each cell
of the experiment. The other four techniques (pulse rate
variability, pupil dilation, control movements, and tapping
regularity) could not have shown sensitivity even with 100
subjects in each cell. An experiment requiring this many
subjects would require resources of a magnitude unavailable
to most organizations involved in mental workload research
and measurement.
One final finding was that the scores obtained showed
sensitivity to the change in the subjects' experience level.
However, trend analysis tests indicated that the scores did
not follow an increasing or decreasing pattern across the
six experience levels. Therefore, one cannot conclude that
the scores increased or decreased with the increase in the
subjects' experience level. However, one could speculate

96
based on Figure 8 that pilot technique scores tend to become
more stable as experience level increases.
Intrusion
Each mental workload estimation technique used in this
experiment requires certain equipment (instruments) and
procedures for obtaining the data. Rating scales require
instruction forms and rating scale sheets to be completed
after the flight task. Secondary tasks require a
microswitch to be pressed periodically and recording
equipment for prompting. Physiological measures require
either a sensor attached to the body (a plethysmograph for
pulse rate variability) or external devices monitoring the
pilot's behavior (a camera for pupil dilation).
These instruments, procedures, and instructions may
intrude upon the primary task assigned to the subjects.
Clearly, using a workload estimation technique that does not
interfere with the subject's primary task performance is
preferable to using one that does. The results of the
intrusion analysis for this experiment showed that the time
estimation technique intruded on the mediational aspects of
the primary task performance. The primary task measures
affected were error rate of the slide problems and reaction
time to solve these problems. This result disagreed with

97
the one obtained in an experiment involving a psychomotor
task of flying an aircraft simulator (Connor, 1981) . He
found that measurement of time estimation did not intrude on
primary task measures.
Finally, it was hypothesized that the primary task
performance of the subjects did not change with the increase
in their experience level. The results of this analysis
indicated that there was no significant change in the
primary task performance across the six experience levels.
Therefore, more experienced and less experienced subjects
performed the combined flight task and the mediational
(problem solving) task with equal proficiency.
Complementary Findings and Explanations
The rest of this section is devoted to the individual
nonsensitive techniques and explanations of possible
applicability of these techniques in the future studies of
pilot mental workload.
Multi-descriptor rating scale. The present experiment
was the first application of this measure using a piloting
task emphasizing mediational activity. The·measure did not
demonstrate sensitivity. However,
findings point toward the possible
the following two
usefulness of this
measure in future experiments. First, the scores obtained

98
for this measure showed a monotonic increase. This is an
important attribute of a useful mental workload measure,
since a non-monotonic trend (U or inverted U-shape) can not
be interpreted easily. For example, when using a measure
having a nonmonotonic trend, a higher score could be
interpreted as a "higher" or "lower" mental workload.
Second, the required number of subjects (more than 16) to
obtain sensi ti vi ty for this measure (resulting from the
power analysis) encourages a researcher to optimize the
scale. The measure may be improved by inclusion of other
descriptors with the purpose of tapping other aspects of
mental workload. Also, more precise definitions of the
descriptors may be used to describe only the concept being
rated.
Tapping regularity. Since publication of the article by
Michon (1964), only a few studies used this technique as a
measure of operator mental workload·. Generally, the data
acquisition and recording equipment is substantial and is
difficult to implement in a flight-related environment. The
tapping regularity equipment used in this experiment
included- a microswi tch to transmit the signals, the ramp
generator program on the hybrid computer, and the chart
recorder to record the signals for later computation using
the tapping regularity formula.

99
A reasonable explanation for the nonsensitivity result of
the tapping regularity measure might be the following. The
formula used to compute the scores for this measure was
first derived for perceptual-motor mental loading (Michon,
1964). Most of the follow-up supporting studies used the
same type of load. Also, in the present experiment the
tapping intervals used to compute each score were cut off if
they exceeded 5 seconds. This re,striction was used to
account for possible data outliers, which would violate the
assumptions of the ANOVA (particularly, normality of data).
Finally, the central capacity assumption of spare mental
capacity measures has not been successfully supported by the
existing literature on mental workload. For example, Gopher
and Navon ( 1978) examined the central capacity assumption
using a dual axis tracking task. They concluded that the
influence of task difficulty on performance of both primary
and secondary tasks grows as more resources are allocated to
the secondary task whose difficulty increases. then, they
proposed a multiple channel, multiple capacity model for a
human operator. Wickens (1979) provided additional evidence
for a multiple attentional resources model of a human
operator.
Control movements. For a primary task involving
psychomotor loading, one expects an increase in the number

100
of control movements per unit time to justify a constant
flight task performance at higher loadings (Connor, 1981;
Cooper and Harper, 1969). From the results obtained in the
present experiment,
activity does not
mediational loading.
Pupil dilation.
used for measuring
measure for this
it appears that the amount of control
reflect an increase in the pilots'
In the present experiment, the equipment
pupil diameter provided an approximate
technique. It seems that a wider
separation of load levels is necessary for this measure to
demonstrate sensi ti vi ty. A more precise measure based on
data obtained from a sophisticated oculometer system would
have helped to evaluate this technique more thoroughly.
Pulse rate variability. The existing literature on this
measure does not overwhelmingly support the sensitivity of
this measure to mediational load. There is more evidence in
favor of the sensitivity of this measure
(visual and auditory) loading tasks. The
this measure appears to be task-specific.
to perceptual
sensi ti vi ty of
Overall, the
measurement equipment and procedures used in this experiment
were nearly optimal. Finally, the power analysis did not
provide any support for using a reasonably larger number of
subjects in future experiments. Based on the results of the
intrusion analysis, it appears that the ear plethysmograph

101
worn by the subjects is a nonintrusive method of measuring
pulse rate (or pulse rate variability).

In the
intrusion
SUMMARY AND CONCLUSIONS
present research,
of eight pilot
the relative sensi ti vi ty and
mental workload estimation
techniques were investigated. To accomplish this, ordinal
differences in task loading were introduced. The type of
task employed was a piloting task emphasizing mediational
activity in a moving-base aircraft simulator. Among the
ei9ht techniques, three demonstrated sensitivity to the
mediational task loading. Only one technique showed
complete sensitivity across the three mediational load
levels. Among the eight techniques, two demonstrated
intrusion upon the primary task performance. The major
results of this experiment are summarized in Table 23.
A measure of the amount of time required to solve
mediational problems seems to be the best measure of pilot
mediational workload. Also, the technique of asking the
pilots "how mentally loaded they are", in a systematic
format (modified Cooper-Harper scale), appears to be a
desirable alternative. Time estimation appears sensitive to
mediational loading, but it also intrudes on the primary
task. However, based on the results of this experiment, the
102

103
rest of the techniques should not be ruled out for inclusion
in the future pilot mental workload researches.
This research used a pilot mental loading which
emphasized mediational behavior. Connor (1981) investigated
the psychomotor dimension of a piloting task in a setting
similar to the one used in this experiment. Further
research should determine the relative sensitivity and
intrusion of appropriate mental workload techniques with
regard to the other two workload categories (perceptual and
communications). The next logical step would be to combine
the findings of these four researches into one integrated
analysis. This analysis would indicate which techniques are
useful (sensitive and nonintrusive) in estimating workload
for a piloting task that emphasizes one or more of the four
mental workload dimensions.

104
TABLE 23 Summary of Results of Present Experiment
Technique Sensitivity Intrusion Combined rating
Opinion Modified Cooper-
Harper scale Multi-descriptor
Spare mental capacity Time estimation
(standard dev.) Tapping regularity
Primary task Mediational reaction
time Control movements
Physiological Pulse rate var. Pupil dilation
Partial Potential*
Partial Low
Complete Low
Low Low
* requires larger sample size.
None None
GOOD SOME POTENTIAL
Substantial FAIR None LITTLE POTENTIAL
None None
None None
BEST LITTLE POTENTIAL
LITTLE POTENTIAL LITTLE POTENTIAL
REFERENCES
Baker, B. 0., Hardyck, C. D. and Petrinovich, L. F. Weak mesurements versus strong statistics: an empirical critique of S. S. Stevens proscriptions on statistics. In.A. Haber, R. P. Runyon, and P. Badia (Ed.) Readings in statistics. Massachusetts: Addison-Wesley Publishing Co., 1970.
Beatty, J. Pupillometric measurement of cognitive workload. Proceedings of the 12th Annual NASA-University Conference on Manual Control, University of Illinois, May 1976, 135-143. (NASA TM X-37 170).
Berliner, C., Angell, D., and Shearer, D. J. Behaviors, measures, and instruments for performance evaluation in simulated environments. Paper presented at the Symposium and Workshop on the Quantification of Human Performance, Albuquerque, New Mexico, August, 1964.
Boyce, P. R. Sinus arrhythmia as a measure of mental load. Ergonomics, 1974, 17, 177-183.
Chiles, W. D. Objective methods for developing indices of pilot work-load (FAA-AM-77-15), Oklahoma City, Oklahoma: FAA Civil Aeromedical Institute, July 1977.
Chiles, W. D. Objective methods. In A.H. Roscoe (Ed.) Assessing pilot workload. AGARD-AG-233, Feb., 1978, 54-77.
Clement, W. Annotated bibliography of procedures which assess primary task performance in some manner as the basic element of a workload measurement procedure. Hawthorne, CA: Systems Technology, Inc., Tech. Report No. 1104-2, Jan., 1978.
Connor, S. A. A comparison of pilot workload assessment techniques using a psychomotor task in moving base aircraft simulator. Master's thesis, Virginia Polytechnic Institute and State University, October 1981.
105

106
Cooper, G. E. and Harper, R. P., Jr. The use of pilot rating in the evaluation of aircraft handling qualities. Moffett Field, California: NASA Ames Research Center, NASA TN-D-5153, April 1969.
Dick, A. 0., Brown, J. L., and Bailey, G. Statistical evaluation of control inputs and eye movements in the use of instrument clusters during aircraft landing. Rochester, N.Y.: University of Rochester, Center for Visual Science, Tech. Report 4-76, 1976.
Edwards, A. Z. Techniques of attitude scale construction. New York: Appleton Century Crafts, 1957.
Ettema, J. H. and Zielhuis, R. L. Physiological parameters of mental load. Ergonomics 1971, 14, 137-144.
Finkelman, J. M., Wolf, E. H., and Friend, M. A. Modified discriminant analysis as a multivariate post-comparison extension of MANOVA for interpretation of simultaneous multimodality measures. Human Factors, 1977, 19, 255-263.
·Gartner, W. B. and Murphy, M. R. Pilot workload and fatigue: A critical survey of concepts and assessment techniques. Moffett Field, California: NASA Ames Research Center, NASA TN D-8365, November, 1976.
Gerathewohl, S. J. Definition and measurement of perceptual and mental workload in aircrews and operators of Air Force Weapon Systems: A Status Report, AGARD-CP-181, April 1976.
Gopher, D. and Navon, D. How is performance limited: Testing the notion of central capacity. Haifa, Israel: The Technion, Report No. HElS-78-11, Dec., 1978.
Guilford, J. P. Psychometric methods. New York; McGraw-Hill Book Co., 1954.
Hart, S. G. A cognitive model of time perception. Paper presented at the 56th Annual Meeting of the Western Psychological Association, Los Angeles, Cal., April, 1976.
Hart, S. G., Childress, M. definitions of the term Psychology in the DOD. 1982.
E., and Hauser, J. R. Individual "workload". Symposium: U.S. Air Force Academy, Colorado,

107
Hart, S. G. and McPherson, D. Airline pilot time estimation during concurrent activity including simulated flight. Paper presented at the 47th Annual Meeting of the Aerospace Medical Association, Bal Harbour, Florida, May, 1976.
Hart, S. G., McPherson, D., and Loomis, L. L. Time estimation as a secondary task to measure workload: Summary of research. Proceeding of the Fourteenth Annual Conference on Manual Control, April, 25-27, 1978, USC, Los Angeles, 693-712. (NASA Conference Publication 2060, Ames Research Center, Moffett Field, California).
Hartman, B. 0., and McKenzie, R. E. (Ed.) Survey of methods to assess workload. AGARD-AG-246, August, 1979.
Hawkins, H. L., Church, M., and de Lemos, S. is not a unitary ability. Eugene, Oregon: Oregon, Center for Cognitive and Perceptual Technical Report No. 2; June 30, 1978.
Time sharing University of Research,
Hicks, T. G. and Wierwille, W. W. Comparison of five mental workload assessment procedures in a moving base driving simulator. Human Factors .. 1979, 21, 129-143.
Johannsen, G., Pfendler, C., and Stein, W. Human performance and workload in simulated landing approaches with autopilot failures. In T. B. Sheridan and G. Johannsen (Ed.) Monitoring behavior and supervisory control. New York: Plenum, 1976, 83-95.
Kahneman, D. Attention and effort. Englewood Cliffs, N.J.: Prentice-Hall, 1973.
Kalsbeek, J. W. H. Do you believe in sinus arrhythrn~a? Ergonomics, 1973, 16, N-1, 99-104.
Keppel, G. Design and analvsis: ~researcher's handbook. New Jersey: Prentice-Hall, Inc., Englewood Cliffs, 1973.
Knowles, W. B. Operator loading tasks. Human Factors, 1963, ~' 155-161.
Krebs, M. J., Wingert, J. W., and Cunningham T. Exploration of an oculometer-based model of pilot workload. Washington, D.C.: National Aeronautic and Space Administration, NASA CR-145153, March, 1977.

108
Levine, J. M., Ogden, G. D. and Eisner, E. J. Measurement of workload by secondary task: A review and annotated bibliography. Washington, D.C.: Advanced Research Resouces Organization, Contract No. NASZ-9637, January, 1978.
Michon, J. A. A note on the measurement of perceptual motor load. Ergonomics, 1964, z, 461-463.
Michon, J. A. motor load.
Tapping regularity as a measure of perceptual Erogonomics, 1966, ~, 401-412.
Mobbs, R. F., Davids, G. C., and Thomas, J. M. An evaluation of the use of heart rate irregularity as a measure of mental workload in the steel industry. London, England: British Steel Corp., BISRA, · OR/Hf/25/71, August, 1971.
Myers, J. L. Fundamentals of experimental design. Boston, Allyn and Bacon, 1966.
Noel, C. E. Pupil diameter versus task layout. Master's thesis, Naval Postgraduate School, Monterey, California, September, 1974.
Nunnally, J. C. Psychometric theory. New York: McGraw Hill Co., 196~.
Nunnally, J. c. Popular conceptions of mental health. In J. C. Nunnally (Ed.) Introduction to psychological measurement. New York: McGraw Hill, Inc., 1970.
Opmeer, C. H. J. M. and Krol, J. P. assessment of cockpit workload: during different flight phases. 1973, 44, 527-532.
Towards an objective Physiological variables Aerospace Medicine,
Osgood, C. E. and Suci, G. J. Factor analysis of meaning. Journal of Experimental Psychology, 1955, 50, 325-338.
Perelli, L. P. Physiological aspects of · workload/fatigue/stress. In Hartman and McKenzie (Ed.)
Survey of methods to assess workload. AGARD-AG-246, Aug., 1979, 13-18.
Rao, C. R. Linear statistical inference and its applications. New York: Wiley, 1965.

109
Reising, J. M. The definition and measurement of pilot workload. Wright-Patterson AFB, Ohio: USAF Flight Dynamics Labs, AFFDL-TM-72-4-FGR, Feb. 1972.
Rolfe, J. M. and Lindsay, S. J. E. Flight deck environment and pilot workload: Biological measures of workload. Applied Ergonomics, 1973, ~' 199-206.
Roscoe, A.H. (Ed.) Assessing pilot workload. AGARD-AG-233, Feb., 1978.
Schiflett, S. G. Operator Workload: An annotated bibliography. Patuxent River, Maryland: US Naval Air Test Center, SY-257R-76, December, 1976.
Senders, J. W. The estimation of operator workload in complex systems. In K. B. Degreene (Ed.), Systems psychology. New York: McGraw-Hill, 1970.
Senders, J. W. Kristofferson, A. B., Levison, W. H., Dietrich, C. W., and Ward, J. L. The attentional demand of automobile driving. Highway Research Record, No. 195, 15-33, 1967.
Sherman, M. R. The relationship of eye behavior, cardiac activity and electromyographic responses to subjective reports of mental fatigue and performance on a Doppler identification task. Master's thesis, Naval Postgraduate school, Monterey, California, September, 1973. (AD 769 754).
Spyker, D. A., Stackhouse, S. P., Khalafalla, A. S. and McLane, R. C. Development of techniques for measuring pilot workload. Washington, D.C.: NASA, Contractors Report NASA CR-1888, Nov., 1971.
Stackhouse, S. Workload evaluation of Lino display. Minneapolis, Minnesota: Honeywell, 7201-3408, Oct., 1973.
Ursin, H. and Ursin, R. Physiological indicators of mental load. In N. Moray (Ed.) Mental workload: Its theory and measurement. New York: Plenum Press, 1979, 340-365.
Westbrook, C. B., Anderson, R. 0. and Pietrzak, P. E. Handling qualities and pilot workload. Wright-Patterson AFB, Ohio: AF Flight Dynamics Lab., AFFOL-FDCC-TM-66-5, Sept., 1966.

110
Whitaker, L.A., Dual-task interference as a function of cognitive load processing. Acta Psychologica, 1979, 43, 71,84.
Wickens, C. D. The effect of time sharing on the performance of information processing tasks: A feedback control analysis. Ann Arbor, Michigan: The University of Michigan, Human Performance Center, Technical Report No. 51, August, 1974.
Wickens, C. D. The structure of attentional resources. In R. Nickerson (Ed.) Attention and oerformance VIII. Hillsdale, New Jersey: Lawrence Erlbaum and Associates, 1979.
Wierwille, W. W. Proposal on comparison of pilot workload assessment techniques. Blacksburg, Virginia: VPI&SU, IEOR department, 1979.
Wierwille, W. W. Personal communication, 1982.
Wierwille, W. W. and Williges, R. C. Survey and analysis of operator workload assessment techniques. Blacksburg, Virginia: Systemetrics, Inc. Report No. S-78-101, September, 1978.
Wierwille, W. W. and Williges, B. H. An annotated bibliography on operator mental workload assessment. Patuxent River, Maryland: Naval Air Test Center, Technical Report SY-27R-80, March 1980.
Winer, B. J. Statistical princioles in exoerirnental design, (Second Edition). New York: McGraw-Hill Book Co., 1971.
Wingert, J. W. Function interlace modifications to analytic workload prediction. In K. D. Cross and J. J. McGrath (Ed.) Crew system design. Santa Barbara, CA: Anacapa Sciences, July, 1973.
Zwaga, H. J. C. Psychophysiological reactions to mental tasks: Effort or stress? Ergonomics, 1973, 16, 61-67.

Appendix A
EXPERIMENTAL APPARATUS
111

112
/}' ' -~J
Figure 10: Photograph of experimental equipment.

Figure 11:
113
~ ~ ... ..,... . ... - w . .
•.: ·"'·
Photograph of a subjec~ in the aircraft simulator wearing the physiological sensor.

Appendix B
INSTRUCTIONS
114

115
General Description of the Experiment for Participants
The purpose of this experiment is to examine the
responses of pilots under varying levels of task difficulty.
In this experiment, you will be asked to fly four simulated
flights. Each flight contains a simple take off,
approximately 10 minutes of straight and level flying, and a
simple approach and landing. The first flight will be a
practice session. The remaining flights will be for data
collection. The data collected during this experiment will
be treated with anonymity.
All of the flights will be flown in the GAT-lB aircraft
simulator. This simulator is widely used for training
purposes in the United States. The simulator has been
enhanced with some research equipment for this experiment.
You should fly the simulator as you would a real aircraft.
In addition to flying the simulator, you will be asked to
perform concurrent tasks. These will include solving
navigation problems involving the effects of crosswind on
flight path. You will be given practice on this additional
task prior to data taking.
Depending upon the group to which you are assigned, you
may also be requested to do one of the following:
1. to perform an additional task called a secondary
task,

116
2. to provide opinion ratings of difficulty, or
3. to wear a special physiological sensor.
You may rest assured that the physiological sensor will not
harm you in any way. It does not make any electrical
contact with your body, nor does it emit any type of harmful
radiation. Its only purpose is to sense your body's
reaction to the tasks.
If you decide to participate, you will be paid for each
hour of your participation. The entire experiment is
expected to last approximately two hours.
The research team consists of:
1. Mr. Mansour Rahimi, Graduate Student, IEOR
Department,
2. Mr. John Casali, Graduate Student, IEOR Department,
and
3. Dr. Walter Wierwille, Faculty Member, IEOR
Department.
The research is sponsored by NASA, Ames Research Center,
Moffett Field, California.
Further instructions will follow your reading and signing
the attached consent form. As the participant's consent
form indicates, you have the right to decline to participate
at any point in this experiment. This includes the right to
decline after reading the detailed instructions.
117
A member of experimental team will answer any questions
you may have. However, in cases that may affect the outcome
of the experimental data, the team member may delay a
detailed answer until you have completed your runs.
You are requested to refrain from discussing the
experiment with other persons (pilots) who may become
subjects. We expect all data to be taken by March, 1982.
Following that date, feel free to discuss the experiment
with anyone you wish.
Finally, we want to point out that some tasks or portion
of tasks may be difficult to perform. When this occurs,
simply do your best. This experiment is not designed to
test ~ skill. Furthermore, your results will be treated
with anonyrni ty. Your name wi 11 be removed from your data
file immediately after you complete your portion of the
experiment.

118
Participant's Consent Form
As a participant in this experiment, you have certain
rights. The purpose of this note is to make you aware of
these rights and to obtain your consent to participate.
1. You have the right to stop the experiment in which
you are participating at any time if you feel that it
is not agreeable to you. Should you terminate the
experiment, you will receive pay only for the time
you participated.
2. You have the right to see your data and to withdraw
it from the experiment if you feel that you should.
In general, data are processed after all runs are
completed. In this experiment, we can provide you
with some qualitative information immediately after
the experiment. Subsequently, all data are treated
with anonymity. Therefore, if you wish to withdraw
your clata, you must do so immediately after your
participation is completed.
3. You have the right to be informed on the results of
the overall experiment. If you wish to receive
information on the results (four to six months
hence), please include your address (four to six
months hence) with your signature below. A summary
will be sent to you. If you would then like further

119
information, please contact the Human Factors
Laboratory and a full report will be made available
to you.
We hope you will find the experiment a pleasant and
interesting experience. The faculty and graduate students
involved greatly appreciate your help as a participant. If
you have any questions about the experiment or your rights
as a participant, please do not hesitate to ask. We will
do our best to answer them, subject only to the constraint
that we do not want to pre-bias the experimental results.
Your signature below indicates that you have read the
above stated rights and that you consent to participation.
If you include your printed name and address below, a
summary of experimental results will be sent to you.
Signature
Print name and address

120
Flight Task Practice Instructions
The purpose of this session is to familiarize you with
the aircraft simulator and the flight procedures used in
this experiment.
The flight procedures are the same as the flight
procedures you will experience in the experimental sessions.
The loading conditions (wind triangle problems) may vary
from one flight to another. You will experience flight task
and loading conditions similar to the experimental sessions
and your questions will be answered at the end of the
session.
Any question?

121
Flight Task Instructions
The procedures for the flight task are as follows:
1. Prior to each flight, the simulator will be
positioned at predetermined heading of 0 degrees
(north).
2. The experimenter will tell you when you are cleared
for take-off over the intercom system.
3. Assuming a mild turbulance, you will take-off
maintaining the predetermined heading and climb to
2000 feet with the rate of climb of 500 feet per
minute. Take-off speed is approximately 70 mph in
the simulator under zero wind condition. The maximum
rate of climb can be reached at approximately 72 mph.
4. After you arrive at 2000 feet, you should level the
aircraft and maintain 2000 (+/- 100) feet while
flying at 100 (+/-10) mph airspeed.
5. You will fly this level flight for approximately 10
minutes. It is within this portion of your flight
that the mediational loading task will be presented.
The task is in the form of wind triangle problems
presented on a slide projector. At the end of this
portion of your flight the experimenter will tell you
to descend.
122
6. Then, reduce your airspeed to 70 mph and lower one
half flaps. Descend at a rate of 500 feet per minute
at the same heading until you make a landing. Field
elevation is 180 feet, and barometric pressure at the
field is 29.92 inches of mercury.
7. Upon landing, you should pull the parking brakes,
leave the engine on. Then, you will be instructed to
exit the simulator.
You should maintain adequate performance while flying the
simulator in the level portion of your flight. Adequate
performance is defined as maintaining the indicated heading
of 0 (+/-10) degrees, maintaining altitude of 2000(+/-100)
feet, maintaining airspeed of 100 (+/-10) mph, and ·solving
wind triangle problems simultaneously.
Any questions?
The simulator is already set up for takeoff. All you
need to do is to release the parking brakes and apply
throttle to begin taxiing for the takeoff. Do not begin
until the experimenter has cleared you for the takeoff.
In summary: Your primary task is to takeoff and climb_ to
2000 feet, cruise at the constant altitude of 2000 at 100
mph and 0 degrees heading, solve the problems on the slides,
and when you are told, descend and land the simulator.
Any questions?

Appendix C
WIND TRIANGLE PROBLEMS
123

124
Wind Triangle Problems, Instructions, and Training
During the level portion of your flight scenario (between
takeoff and landing), you will be presented with a series of
slides. Each slide contains one wind triangle problem
(e.g., Figure 12). A wind triangle is a vector presentation
of aircraft speed, aircraft heading, wind speed, and wind
direction. The three vectors constructing a triangle are:
1) red arrow indicating crosswind, 2) black arrow indicating
true airspeed (TAS) and indicated heading, and 3) dashed
black arrow indicating true course or the path over the
ground. To the center of each slide a wind triangle problem
is presented. Notice the triangles are right-angle
triangles because
cross-winds only.
the wind components considered are
The magnitude of each arrow indicates
"speed" in miles per hour, and the direction of each arrow
indicates "direction" or "heading" from true north
(clockwise).
Any questions?
In the upper left hand of each slide a "reference"
triangle is presented. These triangles are drawn with solid
black lines
trigonometric
presented in
(not arrows). They
leg/angle relationship of
the center of the slides.
demonstrate the
the wind problems
The purpose of a
reference triangle is to give all the necessary information
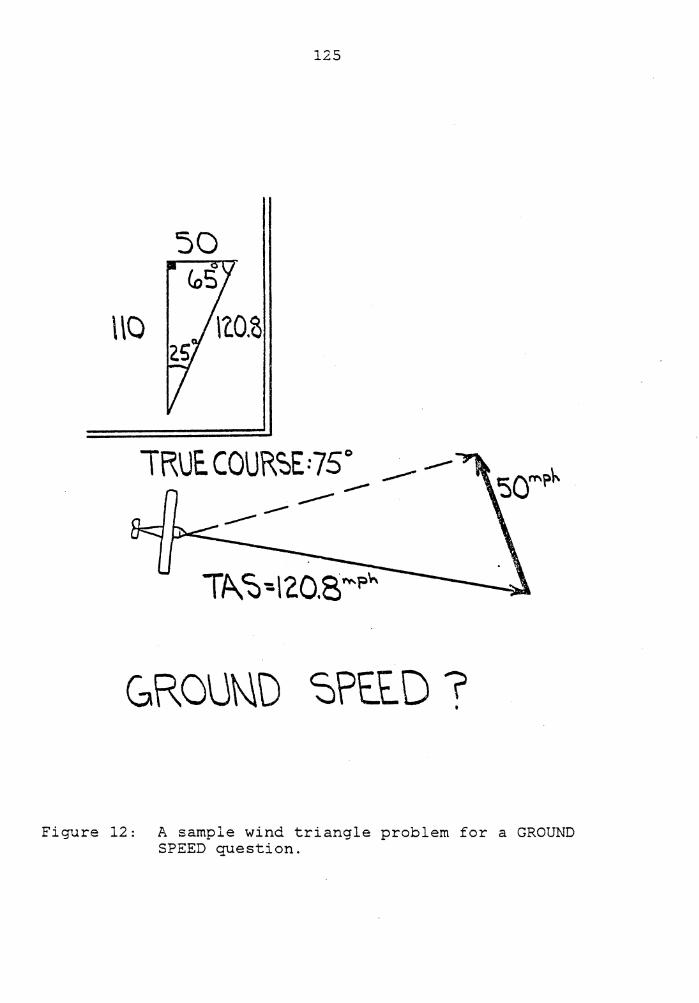
125
so
\\0
TRUE COURSE=75° -----
GROUND SPt.t. D 7 •
Fi~~re 12: A sample wind triangle problem for a GROUND SPEED question.
126
to solve the wind triangle oroblem given in the center of
the slide. For example, if two legs of the wind problem are
given, the hypotenuse (TAS) can be found by referring to the
"reference" triangle (Figure 12).
Any questions?
In the bottom portion of each slide, you are asked only
one question. The three possible questions are:
1. GROUND SPEED?
Ground speed is the speed with which the aircraft is
moving in the direction of "true course" over the ground.
True airspeed (TAS) is the speed with which the aircraft is
moving into the air. Therefore,
speed correction due to the wind.
ground speed considers the
To find the ground speed
(Figure 12) you should compare the reference triangle with
the problem triangle. Find out which leg corresponds to the
wind vector, then find out which leg corresponds to the TAS,
finally the leg corresponding to the dashed black arrow will
give you the magnitude of the arrow or the ground speed.
You may need to mentally rotate one or the other triangle to
match the other one. This mental rotation will help you to
find the required speed.
Any questions?

127
In some problems the reference triangle speeds are
proportional to the problem triangle speeds. In that case,
you have to 1) mentally rotate a triangle, 2) find the
proportionality with which the triangle speeds are related,
3) find the leg corresponding to the ground speed, and 4)
multiply that number by the ground speed given in the
reference triangle.
CAUTION: For experimental purposes, use only this method to
find the ground speed. Do not use pythagorean theorem to
find the third leg of a triangle. It is impossible to
calculate the ground speed using this theorem within the
time frame given for a slide.
Any questions?
2. AIRCRAFT HEADING?
By definition,
indicated heading
the difference between true course and
of an aircraft, when winds of a
significant magnitude are present, is called wind correction
angle. To calculate aircraft heading (Figure 13), first you
should find the wind correction angle from the reference
triangle which is the angle between the corresponding TRUE
COURSE and TAS. Then, you add that angle to the TRUE COURSE
if the wind is blowing from right to left; or, subtract the
angle from TRUE COURSE if the wind is blowing form left to

128
right. _ The true course directions are given next to the
dash arrows.
Any questions?
3. ETA?
Estimated Time of Arrival (ETA) can be calculated by
di vi ding the di stance to the destination by ground speed
(Figure 14).
Find the ground speed exactly the same way as you would
in the "GROUND SPEED?" slides. Then, di vi de the
destination distance given next to the dashed arrows (e.g.,
DESTINATION: 87.5 miles) by the ground speed (e.g.,70 mph)
you will have ETA (e.g., one hour and 15 minutes).
Any questions?
Remember that a) the question "ETA?" is asked only if the
word "DESTINATION:" appears next to the dashed arrow. B)
When you divide distance (miles) by speed (miles per hour),
the result would be a measure of time (hours). You can
express this time by hour and a fraction of hour (e.g., 1
and hal£ hour; half an hour; 1 and one sixth of an hour) or
by hour and minutes (e.g., 1 hr. and 30 minutes, 30 minutes,
1 hr. and 10 minutes). Try to simplify all the fractions as
much as possible.
Any question?

129
10 0
B4
r~o 0 r~o.4
_ TR\Jt CO\JR~rt. ~2llo0 --- ---- -- --P\\RCR}\f\ HE/\D\NG 7
'
Figure 13: A sample wind triangle problem for an AIRCRAFT HEADING question.

130
40
~ D£S1\N~\\Q~: 125 NILES ---- ------- --
Figure 14: A sample wind triangle problem for an ETA question.

131
The following is some general information you should keep
in mind while working on the problems:
1. There is
(answers)
no relationship between the
of the wind triangle problems
results
and the
actual parameters of your simulated flight. In other
words, the problems are presented for you to solve
cognitively and not to implement.
2. All directions are in degrees from true north and all
speeds are in miles per hour (mph).
3. Some of the problems might be difficult to solve
within the time frame available. Do not quit on any
problem. Keep working on the problem until the next
slide appears. It is important for you to realize
that these problems are presented to increase your
mediational load. They are, by no means, used to
measure your mathematical or trigonometrical
abilities.
4. If during your mental calculations a slide is
advanced, stop working on it and start solving the
next problem.
5. Respond verbally and as clearly as possible.
6. Make only one response for each slide when you are
sure of the answer.

7. During the practice
different level of
experimental runs.
132
trial you might experience a
problem difficulty than the

Appendix D
MEASUREMENT TECHNIQUE INSTRUCTIONS
133

134
Modified Cooper-Harper Ratinq Scale Instructions
Overview
After each of the following flights, you will be asked to
give a rating on the Modified Cooper-Harper Scale for
workload. This rating scale and important definitions for
using the scale are shown on the sample which I have given
you. Before you make any flights, we will review:
1. The definitions of the terms used in the scale,
2. The steps you should follow in making your rating on
the scale, and
3. How you should think of the ratings.
If you have any questions as we review these points please
ask me.
Important Definitions
To understand and use the modified Cooper-Harper scale
properly, it is important that you understand the terms used
on the scale and how they apply in the context of this
experiment.
F~rst, "instructed task" is the task you have been
assigned in this experiment. It includes all the duties you
have been requested to perform over the time interval
designated by the experimenter.

135
Second, the "operator" in this situation is you. Because
the scale can be used in different situations, the person
performing the ratings is called an operator. You will be
operating the system and then using the rating scale to
quantify your experience.
Third, the "system" is the complete group of equipment
you will be using in performing the instructed task.
Together you and the system make up the "operator/system".
For the present experiment, the system is composed of the
aircraft simulator, its instruments and controls and the
slide projector display near the windscreen.
Fourth, "errors" include any of the following: mistakes,
incorrect actions or responses, blunders, omissions, and
incompletions. In other words, errors are any appreciable
deviation from desired operator/system performance.
Finally, "mental workload" is the intergrated mental
effort required to perform the instructed task. It includes
such factors as level of attention, depth of thinking, and
level of concentration required by the instructed task.
Rating Scale Steps
On the modified Cooper-Harper scale you will notice that
there is a series of decisions which follow a predetermined
logical sequence. This logic sequence is designed to help

136
you make more consistent and accurate ratings. Thus, you
should follow the logic sequence on the scale for each of
your ratings in this experiment.
The steps which you will follow in using the rating scale
logic are as follows:
1. First you will decide if the instructed task can be
accomplished most of the time; if not, then your
rating is a 10 and you should circle the 10 on the
rating scale.
2. Second, you will decide if adequate performance is
attainable. Adequate performance means that the
errors are small and inconsequential in performing
the instructed task. If they are not, then there are
major deficiencies in the system and you should
proceed to the right. By reading the descriptions
associated with the number 7, 8, 9, you should be
able to select the one that best describes the
situation you have experienced. You would then
circle the most appropriate number.
3. If adequate performance is attainable your next
decision is whether or not your mental workload for
the instructed task is tolerable. If it is not
tolerable, you should select a rating of 4, 5, or 6.
One of these three ratings should describe the
137
situation you have experienced, and you would circle
the most appropriate number.
4. If mental workload is tolerable, you should then move
to one of the top three descriptions on the scale.
You would read and carefully select the rating l, 2,
3, based on the corresponding description that best
describes the situation you have experienced. You
would circle the most appropriate number.
Remember you are to circle only one number, and the
number should be arrived at by following the logic of the
scale. You should always begin at the lower left and follow
the logic path unti 1 you have decided on a rating. In
particular, do not skip any steps in the logic. Otherwise
your rating may not be valid and reliable.
How You Should Think of the Rating
Before you begin making "ratings there are several points
that need to be emphasized. First, be sure to try to
perform the instructed task as instructed and make all your
evaluations within the context of the instructed task. Try
to maintain adequate performance as specified for your task.
Second, the rating scale is not a test of your personal
skill. On all of your ratings, you will be evaluating the
system for a general user population, not yourself. You may

138
assume you are an experienced member of that population.
You should make the assumption that problems you encounter
are not problems you created. They are problems created by
the system and the instructed task. In other words, don't
blame youself if the system is deficient, blame the system.
Third, try to avoid the problem of nit picking an
especially good system, and of saying that a system which is
difficult to use is not difficult to use C?-t all. These
problems can result in similar ratings for systems with
quite different characteristics. Also, try not to overreact
to small changes in the system. This can result in ratings
which _are extremely different when the systems themselves
are quite similar. Thus, to avoid any problems, just always
try to "tell it like it is" in making your ratings.
Any questions?
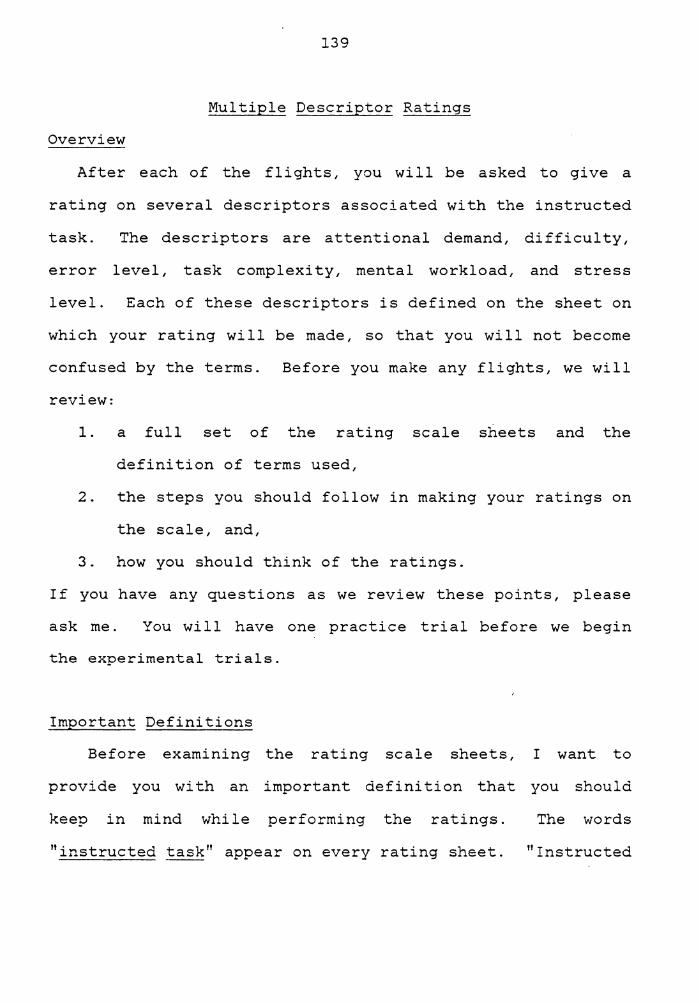
139
Multiple Descriptor Ratings
Overview
After each of the flights, you will be asked to give a
rating on several descriptors associated with the instructed
task. The descriptors are attentional demand, difficulty,
error level, task complexity, mental workload, and stress
level. Each of these descriptors is defined on the sheet on
which your rating will be made, so that you will not become
confused by the terms. Before you make any flights, we will
review:
1. a full set of the rating scale sheets and the
definition of terms used,
2. the steps you should follow in making your ratings on
the scale, and,
3. how you should think of the ratings.
If you have any questions as we review these points, please
ask me. You will have one practice trial before we begin
the experimental trials.
Important Definitions
Before examining the rating scale sheets, I want to
provide you with an important definition that you should
keep in mind while performing the ratings. The words
"instructed task" appear on every rating sheet. "Instructed

140
task" is the task you have been assigned in this experiment.
It includes all the duties you have been requested to
perform over the time interval designated by the
experimenter. Thus your ratings should be based on the
total of your duties during the experimental runs.
Also, later we will use the word "system".
the complete group of equipment you will
The system is
be using in
performing the instructed task. For the present experiment,
the system is composed of the aircraft simulator, its
instruments, controls, and the slide projector display.
Now, let's proceed to rating sheets. The first of them
deals with Attentional Demand. As the sheet indicates,
attentional demand refers to the portion of your total time
required (or the amount of attention required) to perform
the instructed task. Below the definition on the sheet is a
rating scale. After an experimental run you are to circle
the one letter which best describes the attentional demand
associated with the instructed task. If the task took up
most of your attention, your rating should be to the right
of center, that is, one of the letters G through K. If the
task took little of your time, Your rating should be to the
left of center (letters A through F).
The letters themselves have no meaning implied. They are
simply used to designate equal intervals on a continuum of
141
attentional demand from none to extremely high. The letters
allow us to extract information from the sheet with little
likelihood of error.
We would like for you to rate your attentional demand in
performing the instructed task as accurately as possible.
Please take as much time as necessary and remember, that as
you move to the right on the scale, you are indicating
higher attentional demand, and as you move to the left on
the scale, you are indicating lower attentional demand. A
rating of C represents less attentional demand than a rating
of D.
The remaining five rating scale sheets each contain a
single descriptor definition and a single rating scale
associated with that descriptor. Please read over the five
remaining definitions and carefully examine their
corresponding scales. The descriptors
mutually exclusive (non-overlapping).
are not necessarily
Therefore, it is
possible that your ratings on two or more scales may be
similar. However, on each scale, please rate the descriptor
base.d on the definition given. If there are any questions,
please ask.
142
Rating Scale Steps
After you have completed an experimental run, you will be
given· a full set of the rating scale sheets. Read the
descriptor definition at the top of the first sheet. Then
carefully select a rating on the scale which best describes
the level of the descriptor you experienced.
Remember, please do not hurry in making your rating.
Read the definition first, then carefully make the rating by
circling the letter which is most appropriate.
How You Should Think of the Rating
Before making ratings there
to be emphasized. First, be
are several points that need
sure to try to perform the
instructed task as instructed and make all your evaluations
within the context of the instructed task. Try to maintain
adequate performance as specified for your task. Second,
the rating sheets are not a test of your personal skill. On
all of your ratings, you will be evluating the system for a
general user population, not yourself.· You may assume you
are an experienced member of that population. You should
make the assumption that problems you encounter are not
problems you created. They are problems created by the
system and the instructed task. In other words, don't blame
yourself if the system is deficient, blame the system.

143
Third, try to avoid the problem of nit picking an
especially good system and of saying that a system which is
difficult to use is not difficult to use at all. These
problems can result in similar ratings for systems with
quite different characteristics. Also, try not to
over-react to small changes in the system. This can result
in ratings which are extremely different when the systems
themselves are quite similar. Thus, to avoid any problems,
just always "tell it like it is in making your ratings".
Any questions?

144
ATTENTIONAL DEMAND refers to the portion of your total
time required (or the amount of attention required) to
perform the instructed task.
YOUR RATING OF ATTENTIONAL DEMAND
A B c D E F G H I
NONE MODERATE
J K
EXTREMELY
HIGH

145
DIFFICULTY refers to how hard or difficult you found the
instructed task.
A B
EXTREMELY
EASY
YOUR DIFFICULTY RATING
c D E F G H
MODERATE
I J K
EXTREMELY
DIFFICULT

146
ERROR LEVEL refers to the magnitude and frequency of
mistakes, omissions, incorrect procedures, and incompletions
you made in performing the instructed task.
A
NO
ERRORS
B
YOUR ERROR LEVEL RATING
c D E F
MODERATE
LEVEL
G H I J K
NUMEROUS AND/OR
LARGE ERRORS

147
TASK COMPLEXITY refers to how complicated or complex you
found the instructed task.
A B
EXTREMELY
EASY
YOUR TASK COMPLEXITY RATING
c D E F G H I
MODERATE
J K
EXTREMELY
COMPLEX

148
MENTAL WORKLOAD refers to the integrated mental effort
required to perform the instructed task. It includes such
factors as depth of thinking and level of concentration
required by the instructed task.
A
EXTREMELY
LOW
B
YOUR MENTAL WORKLOAD RATING
c D E F G H I
MODERATE
J K
EXTREMELY
HIGH

149
STRESS LEVEL refers to your emotional reaction while you
performed the instructed task. Stress may be considered as
your feeling of anxiety, concern, uneasiness and uncertainty
brought on as a direct result of performing the instructed
task.
A
ABSOLUTE
CALM
B
YOUR STRESS LEVEL RATING
c D E F
MODERATE
STRESS
G H I J K
EXTREME
STRESS

150
Familiarization Session Instructions (Physiological Measures)
Before attending the experimental sessions, you are to
sit in the aircraft simulator, quietly, for 10 minutes.
There are two purposes for this session: a) This period
allows you to become familiar with the aircraft systems and
environment while getting used to wearing the physiological
sensor, and b) allows the experimenter to adjust the
physiological monitoring equipment and to obtain your
physiological baselines for later comparisons. The
experimenter will help you to position the sensor properly.
After wearing the sensor, remain in the seated position and
do not make sudden moves. The experimenter will instruct
you to your next task. Meanwhile, try to adapt to the new
environment as much as you can.
Any questions?

151
Physiological Sensor Description
In this set of trials you will be asked to wear a special
physiological sensor while you fly the simulator. This
sensor will not harm you in any way. It does not emit any
type of harmful radiation, and it does not make any
electrical contact with your body. Its sole purpose is to
check your body's reaction to the flight task.
The sensor is the ear plethysmograph. The ear
plethysmograph is worn on the anti-helix of your left ear
like this (experimenter demonstrates on his own ear).

152
Time Estimation (Secondary Task) Instructions
In each of your four flights (one practice flight and
three experimental flights) you will be asked to perform a
secondary time estimation task while flying the aircraft
simulator. You are to perform the time estimation task
simultaneously with the integrated primary task.
The primary task in this experiment consists of flying
the simulator within the specified accuracy and solving the
wind triangle problems simultaneously.
The performance requirements for the primary task will be
explained in more detail later.
For the time estimation task, you will perform mental
estimates of 10-second intervals, indicating the beginning
and end of each interval by pressing the microswitch mounted
on the control yoke of the simulator. Follow the procedure
outlined below for each trial.
1. The beginning of each trial will be indicated by the
word "ready" over the cockpit speaker. This is to
signal you to prepare to estimate a 10-second
interval.
2. Soon after the word "ready", the word "now" wi 11 be
presented over the speaker. "Now" signals you to
press the microswitch once to indicate the beginning
of the 10-second interval.
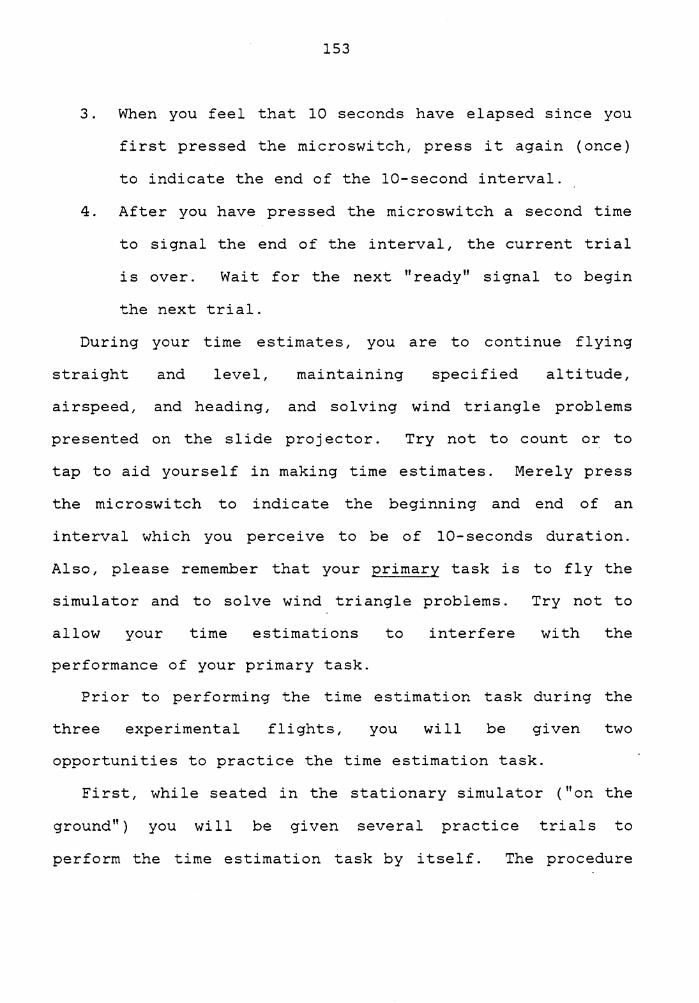
153
3. When you feel that 10 seconds have elapsed since you
first pressed the microswitch, press it again (once)
to indicate the end of the 10-second interval.
4. After you have pressed the microswitch a second time
to signal the end of the interval, the current trial
is over. Wait for the next "ready" signal to begin
the next trial.
During your time estimates, you are to continue flying
straight and level, maintaining specified altitude,
airspeed, and heading, and solving wind triangle problems
presented on the slide projector. Try not to count or to
tap to aid yourself in making time estimates. Merely press
the microswi tch to indicate the beginning and end of an
interval which you perceive to be of 10-seconds duration.
Also, please remember that your primary task is to fly the
simulator and to solve wind triangle problems. Try not to
allow your time estimations to interfere with the
performance of your primary task.
Prior to performing the time estimation task during the
three experimental flights, you will be given two
opportunities to practice the time estimation task.
First, while seated in the stationary simulator ("on the
ground") you will be given several practice trials to
perform the time estimation task by itself. The procedure

154
for the practice trials will be identical to the procedure
discussed above. When you hear "ready", prepare to press
the microswitch. When you hear "now", press the microswitch
to indicate the beginning of a 10-second interval. After
you feel that 10 seconds have elapsed, press the microswitch
again to indicate the end of the interval. Also, you will
have an opportunity to practice the time estimation task
again while flying the simulator during the practice flight.
Again, your signal to prepare to begin an interval estimate
wi 11 be the word "ready" over the cockpit speaker. If you
have any questions concerning the time estimation task
procedures, please ask the experimenter at this time.

155
Tapping Regularity (Secondary Task} Instructions
In each of your four flights (one practice flight and
three experimental flights} you will be asked to perform a
secondary tapping task while flying the aircraft simulator.
You are to perform the tapping task simultaneously with the
integrated primary task. The primary task consists of
flying the simulator within specified levels of accuracy and
solving wind triangle problems as presented on the slide
projector.
The primary task will be described in more detail later.
For the tapping task, you are to tap (depress} the
control yoke-mounted microswitch at a rate of 1 tap
(depression) every 2 seconds. Try your best to tap the
microswitch at this rate as regularly or as rhythmically as
possible. Because you are trying to tap at a rate of 1 tap
per 2 seconds, each microswi tch depression will indicate
that 2 seconds (in your opinion) have elapsed si"nce your
last depression. The measured interval will be from one
switch depression to the next depression. You do not have
to "flick" or hit the microswitch and let it return
immediately after each·tap. Instead, it is probably better
to tap the microswi tch with a smooth, stroking motion to
maintain rhythm.

156
Also, please remember that your primary task is to fly
the simulator and to solve wind triangle problems. Try not
to allow your tapping to interfere with performance of your
primary task.
Prior to performing the tapping task during the three
experimental flights, you will be given two opportunities to
practice the tapping regularity task.
First, while seated in the stationary simulator ("on the
ground") you will be instructed to tap the microswi tch at
the rate of 1 tap per 2 seconds for a few minutes of
practice. Later, you will again perform the tapping task
while actually flying the simulator during the practice
flight.
During all flights, the experimenter will instruct you
over the cockpit speaker when to begin tapping and when to
stop tapping. If you have any questions concerning the
tapping task procedures, please ask.

Appendix E
DEFINITIONS AND DESCRIPTIONS OF MEASURES USED
157

158
Opinion measures
Modified Cooper-Harper Ratings
Ratings provided by the subjects were obtained on the
Modified Cooper-Harper scale for the instructed tasks
performed during the level portion of each flight. No
computation was necessary to score these ratings.
Multiple Descriptor Ratings
Ratings provided by the
multiple descriptor scales
subjects were
for the
obtained on the
instructed tasks
performed during the level portion of each flight. Each
rating (A to K) was converted to a number (0 to 10). The
final score for each experimental run (each load level) was
the average of the six descriptor ratings.
Spare Mental Capacity Measures
Time Estimation
The standard deviation of the interval duration for the
time estimation trials performed during the level portion of
a given flight. Trials on which pilots did not signal the
end of the time interval were considered as the maximum
allowable interval (20 seconds). Trials on which pilots did
not even start the beginning of the time interval were not
included in the score computation.

159
Tapping Regularity
The formula derived by Michon (1966) was used for score
computation of the tapping reqularity measure. This formula
considers both the variability and the mean of the tapping
intervals compared to a baseline (without the effect of
primary task loading). The formula is :
PML = ( 1)
where, PML = perceptual motor load
T = total time of a run ( s)
N = number of taps in a run
t = time between two consecutive taps ( s)
b = baseline values
1 = loaded values
Time intervals more than 5 seconds were mapped to 5 seconds.

160
Physiological Measures
Pulse Rate Variability
The standard deviation of the instantaneous pulse rate.
The instantaneous pulse rate was calculated by a
Hewlett-Packard 7807C heart rate monitor. The standard
deviation was calculated over a 5-minute period by the
EAI-380 hybrid computer.
Pupil Dilation
The average normalized diameter of the pupil (measured
horizontally) while the pilot viewed the slide projector
display. To correct for rotational and translational eye
and head movements, pupil diameter was normalized (divided )
by the diameter of the iris. Samples were taken
approximately 3 seconds after the first glance fixation on
the projector screen for each slide (12 data points for each
loading level).
Primary Task Measures
Mediational Reaction Time
Subjects' verbal responses to each slide were timed. A
digital timer was started with an appearance of a slide on
the screen and ended when the subject made his first
response to the slide. Subjects had 25 seconds for each

161
slide. Lack of response or any response longer than the
time interval given was considered as 25 seconds duration.
Percent Error Response
Percent of errors (out of 12 slides for each loading
level) made by the subjects. Subjects were instructed that
only their first response was accepted.
Control Movements per Unit Time
A count per unit time (seconds) of the number of inputs
to the flight controls (aileron, elevator, and rudder). A
movement was defined as control rate reaching a velocity of
more than 2 percent of full range per second after having
passed through zero velocity.
Pitch High-Pass Mean-Squared (PHPMS) Error
This measure computes the amount of pitch deviations from
a level flight integrated over a 5-minute experimental
period. The filter used for this computation had a time
constant 20 seconds and a corner frequency of 0.05
radian/second. The low frequency deviations were not
considered because some pilots have a habit of trimming the
simulator slightly pitched up or down. Therefore, PHPMS is
a primary task measure reflecting pilots quick responses (or
corrections) of pitch.

162
Roll High-Pass Mean-Squared (RHPMS) Error
Similar to the previous measure, this measure computes the
amount of roll deviation from level flight integrated over a
5 minute experimental period. The same high pass fi 1 ter
used in pitch calculation was used for RHPMS also. This is
a primary task measure reflecting pilots quick responses (or
corrections) of roll.

The two page vita has been removed from the scanned
document. Page 1 of 2

The two page vita has been removed from the scanned
document. Page 2 of 2

EVALUATION OF WORKLOAD ESTIMATION TECHNIQUES IN
SIMULATED PILOTING TASKS EMPHASIZING
MEDIATIONAL ACTIVITY
by
Mansour Rahimi
(ABSTRACT)
Pilots and other aircrew members are often required to
perform tasks involving a substantial amount of mediational
or cognitive activity. Generally speaking, workload
estimation techniques have not been tested to determine
their relative sensitivity and intrusion to mediational
piloting tasks.
An experiment comparing the sensitivity and intrusion of
eight workload estimation techniques was conducted using a
mediational loading task in a three-degrees-of-freedom
moving-base aircraft simulator. The primary task
mediational loading required the pilots to solve a variety
of navigational
straight-and-level
sorted prior to the
difficulty problems.
problems while maintaining
measures
flight. The presented problems were
experiment into low, medium, and high
The eight techniques included opinion
Cooper-Harper rating scale and (modified

multi-descriptor rating scale), spare mental capacity
measures (time estimation and tapping regularity), primary
task measures (mediational reaction time and control
movements per unit time), and physiological measures (pulse
rate variability and pupil dilation).
A sensitive technique was defined as a technique which
indicated statistical differences of scores across the three
mediational load levels. An intrusive technique was defined
as a technique which significantly changed the primary task
measures compared to the primary task measures obtained in a
control condition. One opinion measure (modified
Cooper-Harper
measure (time
(mediational
rating scale), one
estimation), and one
spare mental capacity
primary task measure
reaction time) demonstrated sensitivity.
Mediational reaction time demonstrated sensi tivi·ty to all
levels of load. The other two showed partial sensitivity to
load. One spare mental capacity measure (time estimation)
demonstrated intrusion on two primary task measures
(rnediational reaction time and percent error response).