evaluation report of the pneumatic tube transport system ... · same building. the other pneumatic...
TRANSCRIPT

2015
Dr.AnwarAlAnjeriSeniorRegistrarClinicalBiochemistryLaboratoryMubarakHospital
EvaluationReportofthePneumaticTubeTransportSystem(PEVCO)connectingDialysisHospitalto
MubarakHospital

1 | P a g e
Introduction:
Delivering prompt, customized care is critical to improving the patient experience and ultimately enabling better patient outcomes. Pneumatic tube systems help hospitals meet patient needs by efficiently transporting drugs, documents and specimens to and from nurses’ stations, labs, inpatient and outpatient pharmacies, blood banks and the ED.
The dialysis Hospital has two main pneumatic tube systems. One system is intended to transport patients’ samples from the dialysis wards to the Clinical Biochemistry Laboratory in the same building. The other pneumatic tube system is used to transport samples from dialysis hospital to Clinical Biochemistry Laboratory in Mubarak Hospital.
Comparison Study:
The pneumatic tube system linking the Dialysis hospital to Mubarak Hospital was evaluated by analyzing 41 patient samples. Each sample was divided into two aliquots; one aliquot was sent from the Phlebotomy room in Mubarak Hospital to the Clinical Biochemistry Laboratory in Dialysis Hospital by the pneumatic tube system, the other aliquot was sent by porter. Both aliquots were analyzed using the same Beckman UniCel DxC 600 Synchron® Clinical System. Comparison results were subjected to linear regression analysis using Microsoft Excel 2010 and Bland-Altman difference plots using the MedCal software (www.medcal.be).
2 | P a g e
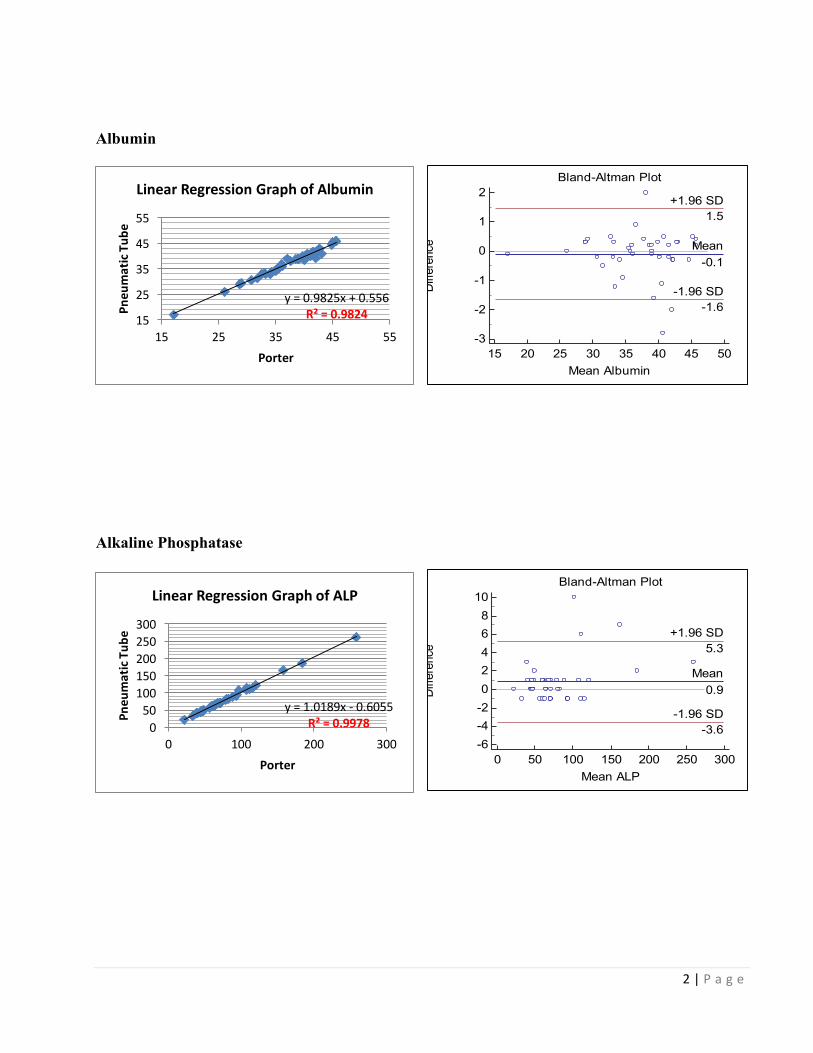
Albumin
Alkaline Phosphatase
y = 0.9825x + 0.556R² = 0.982415
25
35
45
55
15 25 35 45 55
Pneu
matic Tub
e
Porter
Linear Regression Graph of AlbuminBland-Altman Plot
15 20 25 30 35 40 45 50-3
-2
-1
0
1
2
Mean Albumin
Difference
(Pneumatic Tube - Porter)
Mean-0.1
-1.96 SD-1.6
+1.96 SD1.5
y = 1.0189x -‐ 0.6055R² = 0.99780
50100150200250300
0 100 200 300
Pneu
matic Tub
e
Porter
Linear Regression Graph of ALPBland-Altman Plot
0 50 100 150 200 250 300-6-4-20246810
Mean ALP
Difference
(NPneumatic Tube - Porter)
Mean0.9
-1.96 SD-3.6
+1.96 SD5.3

3 | P a g e
Alanine Aminotransferase
Aspartate Aminotransferase
y = 1.0238x + 0.0311R² = 0.99560
20
40
60
80
0 20 40 60 80
Pneu
matic Tub
e
Porter
Linear Regression Graph of ALTBland-Altman Plot
0 20 40 60 80-1.5-1.0-0.50.00.51.01.52.02.53.03.5
Mean ALT
Difference
(Pneumatic Tube - Porter)
Mean0.47
-1.96 SD-1.12
+1.96 SD2.06
y = 1.0053x + 0.5178R² = 0.9936
0
20
40
60
80
0 20 40 60 80
Pneu
matic Tub
e
Porter
Linear Regression Graph of AST Bland-Altman Plot
0 10 20 30 40 50 60 70 80-2
-1
0
1
2
3
4
Mean AST
Difference
(Pneumatic Tube - Porter)
Mean0.6
-1.96 SD-1.1
+1.96 SD2.4

4 | P a g e
Calcium
Carbon Dioxide
y = 0.9861x + 0.042R² = 0.9636
1.82
2.22.42.62.8
1.8 2 2.2 2.4 2.6 2.8
Pneu
matic Tub
e
Porter
Linear Regression Graph of Calcium Bland-Altman Plot
1.8 2.0 2.2 2.4 2.6 2.8-0.1
0.0
0.1
Mean Calcium
Difference
(Pneumatic Tube - Porter)
Mean0.01
-1.96 SD-0.05
+1.96 SD0.06
y = 0.8681x + 2.7806R² = 0.9141
10
20
30
40
10 20 30 40
Pneu
matic Tub
e
Porter
Linear Regression Graph of Carbon Dioxide
Bland-Altman Plot
15 20 25 30 35 40-4
-3
-2
-1
0
1
2
3
Mean Carbon Dioxide
Difference
(Pneumatic Tube - Porter)
Mean-0.4
-1.96 SD-2.9
+1.96 SD2.2
5 | P a g e
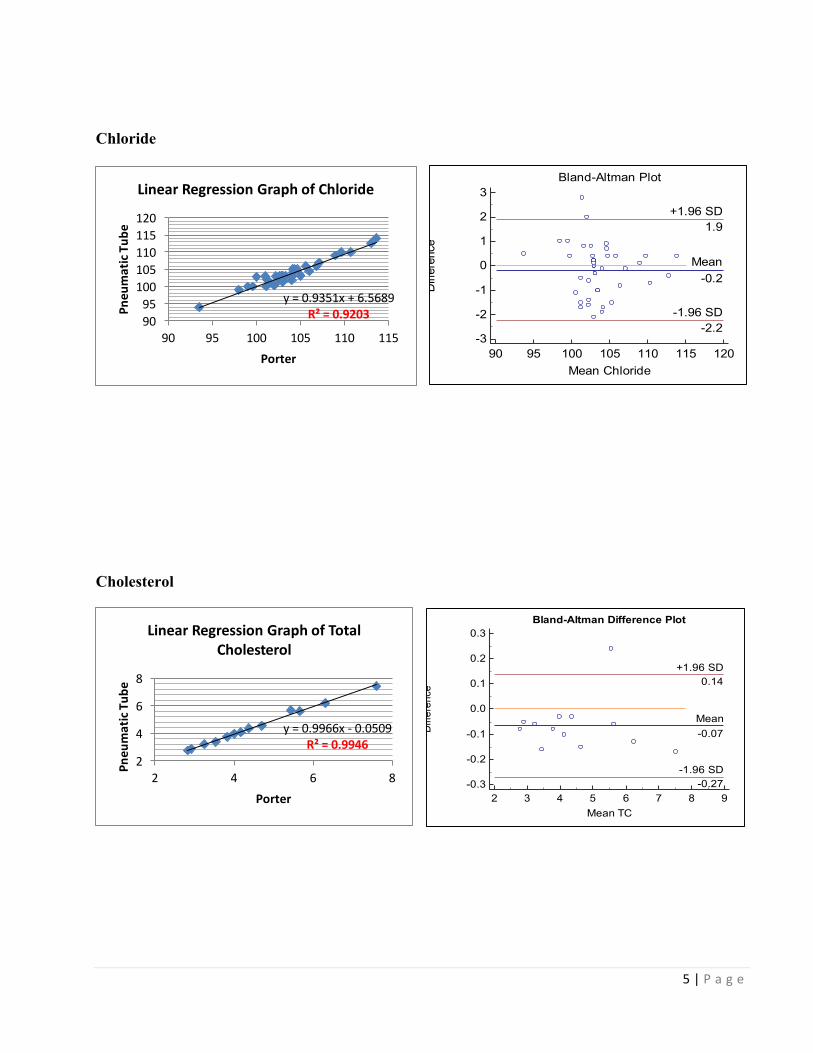
Chloride
Cholesterol
y = 0.9351x + 6.5689R² = 0.920390
95100105110115120
90 95 100 105 110 115
Pneu
matic Tub
e
Porter
Linear Regression Graph of ChlorideBland-Altman Plot
90 95 100 105 110 115 120-3
-2
-1
0
1
2
3
Mean Chloride
Difference
(Pneumatic Tube - Porter)
Mean-0.2
-1.96 SD-2.2
+1.96 SD1.9
y = 0.9966x -‐ 0.0509R² = 0.9946
2
4
6
8
2 4 6 8
Pneu
matic Tub
e
Porter
Linear Regression Graph of Total Cholesterol
Bland-Altman Difference Plot
2 3 4 5 6 7 8 9-0.3
-0.2
-0.1
0.0
0.1
0.2
0.3
Mean TC
Difference
Pneumatic tube - porter
Mean-0.07
-1.96 SD-0.27
+1.96 SD0.14

6 | P a g e
Creatinine
Direct Bilirubin
y = 1.0021x + 0.5522R² = 0.9998
0
500
1000
1500
0 500 1000 1500
Pneu
matic Tub
e
Porter
Linear Regression Graph of Creatinine
Bland-Altman Plot
0 200 400 600 800 1000 1200 1400-10
-5
0
5
10
15
Mean Creatinine
Difference
(Pneumatic Tube - Porter)
Mean0.9
-1.96 SD-5.1
+1.96 SD6.8
y = 0.9991x + 0.0371R² = 0.9989
0
5
10
15
0 5 10 15
Pneu
matic Tub
e
Porter
Linear Regression Graph of DBilBland-Altman Plot
0 2 4 6 8 10 12-0.2
-0.1
0.0
0.1
0.2
Mean Direct Bilirubin
Difference
(Pneumatic Tube - Porter)
Mean0.04
-1.96 SD-0.11
+1.96 SD0.18

7 | P a g e
Gamma Glutamyl Transferase
Glucose
y = 1.0056x + 0.0061R² = 0.9999
0
50
100
150
200
0 50 100 150 200
Pneu
matic Tub
e
Porter
Linear Regression Graph of GGTBland-Altman plot
0 20 40 60 80-1.5-1.0-0.50.00.51.01.52.02.53.03.5
Mean GGT
Difference
(Pneumatic Tube - Porter)
Mean0.47
-1.96 SD-1.12
+1.96 SD2.06
y = 1.002x + 0.0563R² = 0.99740
5
10
15
20
0 5 10 15 20
Pneu
matic Tub
e
Porter
Linear Regression Graph of GlucoseBland-Altman Plot
2 4 6 8 10 12 14 16 18-0.3-0.2-0.10.00.10.20.30.40.5
Mean Glucose
Difference
(Pneumatic Tube - Porter)
Mean0.07
-1.96 SD-0.18
+1.96 SD0.32

8 | P a g e
Phosphorus
Potassium
y = 0.95x + 0.0344R² = 0.98750
1
2
3
0 0.5 1 1.5 2 2.5
Pneu
matic
Porter
Linear Regression Graph of Phosphorus
Bland-Altman Plot
0.0 0.5 1.0 1.5 2.0 2.5-0.2
-0.1
0.0
0.1
Mean Phosphorus
Difference
(Pneumatic Tube - Porter)
Mean-0.02
-1.96 SD-0.11
+1.96 SD0.07
y = 0.9807x + 0.0742R² = 0.98793
4567
3 4 5 6 7
Pneu
matic Tub
e
Porter
Linear Regression Graph of Potassium
Bland-Altman Plot
3 4 5 6 7 8-0.3
-0.2
-0.1
0.0
0.1
0.2
Mean Potassium
Difference
(Pneumatic Tube - Porter)
Mean-0.01
-1.96 SD-0.15
+1.96 SD0.13

9 | P a g e
Sodium
Total Bilirubin
y = 0.8388x + 22.863R² = 0.7758
134136138140142144146
130 135 140 145 150
Pneu
matic Tub
e
Porter
Linear Regression Graph of SodiumBland-Altman Plot
134 136 138 140 142 144 146 148-4-3-2-101234
Mean Sodium
Difference
(Pneumatic Tube - Porter)
Mean0.2
-1.96 SD-2.2
+1.96 SD2.7
y = 0.9925x -‐ 0.1157R² = 0.98670
1020304050
0 10 20 30 40 50
Pneu
matic Tub
e
Porter
Linear Regression Graph of TBilBland-Altman Plot
0 10 20 30 40 50-2.5-2.0-1.5-1.0-0.50.00.51.01.52.0
Mean Total Bilirubin
Difference
(Pneumatic Tube - Porter)
Mean-0.20
-1.96 SD-1.88
+1.96 SD1.49

10 | P a g e
Total Protein
Triglyceride
y = 0.9875x + 1.0724R² = 0.978240
60
80
100
40 50 60 70 80
Pneu
matic Tub
e
Porter
Linear Regression Graph of Total Protein
Bland-Altman Plot
40 50 60 70 80 90-3
-2
-1
0
1
2
3
Mean Total Protein
Difference
(Pneumatic Tube - Porter)
Mean0.2
-1.96 SD-1.8
+1.96 SD2.2
y = 1.0014x -‐ 0.0225R² = 0.9976
01234
0 1 2 3 4
Pneu
matic Tub
e
Porter
Linear Regression Graph of Triglyceride
Bland-Altman Dofference Plot
0.0 0.5 1.0 1.5 2.0 2.5 3.0 3.5 4.0-0.1
0.0
0.1
Mean TG
Difference
Pneumatic tube - Porter
Mean-0.02
-1.96 SD-0.09
+1.96 SD0.05

11 | P a g e
Urea
Uric Acid
y = 1.0057x + 0.0953R² = 0.9983
0
10
20
30
40
0 10 20 30 40
Pneu
matic Tub
e
Porter
Linear Regression Graph of UreaBland-Altman Plot
0 5 10 15 20 25 30 35 40-1.0
-0.5
0.0
0.5
1.0
1.5
Mean Urea
Difference
(Pneumatic Tube - Porter)
Mean0.14
-1.96 SD-0.48
+1.96 SD0.76
y = 1.056x -‐ 11.852R² = 0.99390
100200300400500600
0 200 400 600
Pneu
matic Tub
e
Porter
Linear Regression Graph of Uric AcidBland-Altman Plot
100 200 300 400 500 600-20
-10
0
10
20
30
Mean Uric Acid
Difference
(pneumatic tube - porter)
Mean6.8
-1.96 SD-13.4
+1.96 SD27.0

12 | P a g e
Conclusion
Comparison of pneumatic tube transport system with porter transport indicated good analytical agreement across the studied clinical biochemistry tests. The Bland-Atman difference plots showed no significant bias between the two methods. Therefore, the Pneumatic Tube Transport System connecting the Dialysis Hospital to Mubarak Hospital is fit for use in the transport of patients’ samples between the two Hospitals.
Dr. Anwaar AlAnjeri Professor Segun Mojiminiyi
Senior Registrar Consultant and Head of Unit Clinical Biochemistry Laboratory Clinical Biochemistry Laboratory Mubarak Hospital Mubarak Hospital
13 | P a g e
Acknowledgement
We wish to thank Mrs. Najah Rezqalaah for her major contribution into sample collection and analysis. We are also grateful to Mr. Anwar AlAwadi for his great help in data entry.