evaluation report - public service commission · the 2015/2016 evaluation report is the fourth in...
TRANSCRIPT


Evaluation Report
for the
Year 2015/2016
on
Public Service Compliance with the Values and Principles in Articles 10 and 232 of the
Constitution
Abridged Version
December, 2016


VISION To be the lead service Commission in the provision, management and development of
competent human resource in the public service. MISSION
To transform the public service to become professional, efficient and effective for the realization of national development goals.
CORE VALUES In the discharge of its functions, the Commission is guided by the following Core Values—
Integrity Professionalism Equity and diversity Team spirit Transparency and accountability Creativity and innovation Continual improvement


v
FOREWORD An effective and efficient public service is critical for the sustainable development of any economy. In turn, the values and principles of a public service are instrumental in determining, guiding and informing the development of its corporate culture. This is essentially because public service as an organization operates in a dynamic environment subjected to regular change, and public officers face competing demands and obligations, which affect overall public service delivery. Effective public management also requires that public actions, such as planning, budgeting and programme implementation, are conducted in an environment that is guided by a clear framework of values and principles. This report fulfills the constitutional requirement for the Public Service Commission to produce an annual report on compliance in the public service, with the national values and principles of governance of Article 10 of the Constitution, as well as the values and principles of the public service of Article 232 – hereafter referred to as ‘values and principles’. This 2016 report builds on earlier monitoring and evaluation initiatives and their respective reports, by providing compliance indices for each thematic area of the values and principles, and for each public institution covered. Various legislative frameworks, systems, structures and measures have been put in place to date in support of the espousal of the values and principles of the public service. However, public institutions continue to face peculiar challenges that contribute to their low levels of compliance with the values and principles across the country. Among the challenges are the weak implementation and enforcement of pertinent policies, laws and related regulations. Interventions towards ensuring higher levels of compliance with the values and principles of the public service include promoting high standards of professionalism, ensuring efficiency and effectiveness in service delivery and entrenching good governance practices across the entire public service, among other initiatives, which this report reviews. The effective implementation of the recommendations proposed in this report will enable the country improve service delivery in the various sectors of the economy while ensuring sustainable development. Prof. Margret Kobia, PhD, C.B.S., Chairperson, Public Service Commission.

vi
PREFACE The Public Service Commission (PSC) is constitutionally obligated to evaluate and report to the President and Parliament on the extent to which the public service complies with the national values and principles of governance of Article 10, and the public service values and principles of Article 232 – collectively referred to as ‘values and principles’. The 2015/2016 evaluation report is the fourth in the PSC’s series, and presents an objective assessment of how government institutions have promoted the values and principles. Previous reports have shown progressive public institution gains on values and principles amidst varying challenges faced, and have recommended measures towards greater entrenchment of the same in the public service. The current report assesses the successes of the measures taken, progress achieved and impediments in the realization of values and principles of public service. The 2015/2016 report’s approach is guided by standards and indicators identified for the implementation of the values and principles, by the Commission’s Framework of September 2015. The report’s development of compliance indices across the performance indicators is a pioneering effort that provides a baseline for comparison in succeeding years and across individual public institutions, or clusters of them. Additionally, the report introduces citizen and private sector perceptions on public service delivery. The preparation of the 2015/2016 report involved the survey of public institutions, and of private sector institutions and households, whose samples were provided by the Kenya National Bureau of Statistics. The report also drew on secondary data from government agencies, and the Commission’s reports predating this one. The Commission wishes to thank all the public and private sector institutions, households and individual respondents who provided the valuable information required for this report. However, some public institutions – especially the newly established ones – did not have adequate information to meet the data threshold for objective assessment, and were consequently omitted from the analysis. The conduct of this task underscored the need for prudent public institution data and information management. Weak data reporting and failure to avail data were some of the challenges encountered in the evaluation exercise. The findings of the report show continued improvement in the number and intensity of measures taken towards adhering to and promoting values and principles in the public service. However, performance varies among the public institutions in general, and among the different categories of public institutions. Most of the public institutions continue to put in place structures and measures aimed at promoting the values and principles. The main report also contains sections evaluating service delivery. The main report’s appendices provide specific details on the public institutions’ performances. Mrs. Alice A. Otwala, C.B.S. Secretary/Chief Executive Officer, Public Service Commission.

vii
ACKNOWLEDGEMENTS The Public Service Commission (PSC) wishes to express special thanks to all government Ministries, State Departments and Agencies, Constitutional Commissions and Independent Offices, State Corporations, Statutory Commissions and County Governments, sampled private sector institutions and households, for their active participation in the provision of the data and information used in preparing this report. We would like to thank the Kenya Institute for Public Policy Research and Analysis (KIPPRA) for providing the technical lead throughout the preparation of the report. Specifically, we wish to thank KIPPRA’s Ag. Executive Director Dr. Dickson Khainga and Prof. Germano Mwabu of the University of Nairobi, for guiding the study process. We would also like to thank the entire KIPPRA technical and research team comprising Dr Eldah Onsomu, Dr. Nancy Nafula, Mr. Boaz Munga, Dr. Othieno Nyanjom (Consultant), Mr Philip Kinara and Dr. Douglas Kivoi, for their tireless contributions to the success of this report. Special thanks go to the Kenya National Bureau of Statistics for providing the survey samples. We appreciate the Commission under the leadership of Professor Margret Kobia, PhD, C.B.S. (Chairperson), and the Commissioners for their strategic and policy guidance. We also appreciate the Commission Secretary/Chief Executive, Mrs. Alice A. Otwala, C.B.S., and the Secretariat for immensely facilitating the resources required for the entire assignment. Special thanks to the Compliance and Quality Assurance Committee which comprised of Dr. Judith Bwonya, M.B.S. (Chairperson), Prof. Michael Lokoruka, M.B.S. and Mr. Patrick Gichohi, MBS for providing insightful advisory and quality control for the report. In addition, we also thank the lead backstopping team which comprised of Mr. Wachinga S. Gikonyo (Director, Compliance and Quality Assurance), Mr. Wesley Kipngetich (Deputy Director), Mr. Gabriel Juma (Deputy Director), Mr. William Migwi (Deputy Director), and Mr. Francis Lemarkat (Assistant Director). We also greatly appreciate the stakeholders who participated in various stages of preparation of this report. Amb. Peter O. Ole Nkuraiyia, C.B.S., Vice-Chairperson, Public Service Commission.

viii
ABBREVIATIONS AND ACRONYMS AGPO Access to Government Procurement A–i–A Appropriations-in-Aid ASALs Arid and Semi Arid Lands CAJ Commission of Administrative Justice CC & IO Constitutional Commissions and Independent Offices CIDP County Integrated Development Plan CoK Constitution of Kenya CPI Corruption Perception Index DfID Department for International Development EACC Ethics and Anti-Corruption Commission EAs Enumeration Areas ERS Economic Recovery Strategy FGD Focused Group Discussion FY Financial Year GDP Gross Domestic Product HDI Human Development Index HELB Higher Education Loans Board HRM Human Resource Management IBEC Intergovernmental Budget and Economic Council ICT Information Communication Technology IFMIS Integrated Financial Management Information System IGRTC Intergovernmental Relations Technical committee ISO International Standards Organization KICC Kenyatta International Conference Centre KII Key Informant Interview KIPPRA Kenya Institute for Public Policy Research and Analysis KNCHR Kenya National Commission on Human Rights LAPSSET Lamu Port-South Sudan-Ethiopia- Transport Corridor MDAs Ministries Departments and Agencies M&E Monitoring and Evaluation MTEF Medium-Term Expenditure Framework NACADA National Authority for the Campaign against Alcohol and Drug Abuse NACC National AIDS Control Council NASSEP National Sample Survey and Evaluation Programme NCIC National Cohesion and Integration Commission O&M Operations and Maintenance OCoB Office of Controller of Budget PAC Parliamentary Accounts Committee PFM Public Finance Management Act PIC Parliamentary Investment Committee PPAD Public Procurement and Assets Disposal PPOA Public Procurement Oversight authority PSC Public Service Commission PWDs Persons with Disabilities RBM Results Based management ToRs Terms of Reference USD United States Dollars

ix
TABLE OF CONTENTS
Foreword .......................................................................................................................... v Preface ............................................................................................................................. vi Acknowledgements .......................................................................................................... vii Executive Summary ........................................................................................................ xiii 1 Introduction ............................................................................................................... 1
1.1 Background ........................................................................................................ 1 2 Brief Review of Values and Principles of Public Service ........................................ 2 3 Methodology and Data ............................................................................................. 4
3.1 Sample design .................................................................................................... 4 3.2 Computation of thematic performance indices .................................................. 4
4 Key findings and Discussions ................................................................................... 7 4.1 Overall Compliance Index Scores ...................................................................... 7 4.2 Performance and Compliance by the 10 Thematic Areas .................................. 9
4.2.1 High Standards of Professional Ethics ....................................................... 9 4.2.2 Devolution and Sharing of Power ............................................................. 10 4.2.3 Good Governance, Transparency and Accountability .............................. 11 4.2.4 Diversity Management .............................................................................. 13 4.2.5 Economic Use of Resources and Sustainable Development .................... 15 4.2.6 Equitable Allocation of Opportunities ...................................................... 17 4.2.7 Accountability for Administrative Acts .................................................... 19 4.2.8 Improvements in Service Delivery ........................................................... 21 4.2.9 Performance Management ........................................................................ 24 4.2.10 Public Participation in Policy Making ...................................................... 26
5 Conclusion .............................................................................................................. 28

x

xi


xiii
EXECUTIVE SUMMARY The Public Service Commission (PSC) has a constitutional mandate to promote the national values and principles of governance of Article 10 of the Constitution, and the public service values and principles of Article 232, and to report to the President and Parliament on the extent to which the values and principles are complied with in the public service. The Commission has produced three compliance evaluation reports since the inaugural one of 2012/13, making this 2015/16 report the fourth in line. This report follows largely in the tradition of its predecessors in presenting aggregated performance scores for public institutions in ten thematic areas identified by the PSC’s 2015 Framework for implementing the said values and principles. The overall compliance index score for all the reporting public institutions for nine thematic areas was 68.1 percent. The thematic area of Devolution and Sharing of Power was not included in the overall compliance index because most public institutions’ functions are not devolved. The analysis clusters the public institutions into (i) State Corporations with an overall compliance score of 67.4 percent, (ii) Ministries and State Departments with a compliance score averaging 64.3 percent, and (iii) Constitutional Commissions and Independent Offices averaging 72.7 percent. The citizen satisfaction index for public service delivery stood at 42.6 percent. This index incorporates citizen perceptions on the availability and quality of basic services, including health, education, security, water and sanitation, and the quality of the administration of justice, among others. Overall, the responsiveness of services received attained the highest approval (good + very good) rating of 79.7 percent. This can be attributed to improved service delivery through the Huduma centres. The lowest approval rating was on the quality of the administration of justice with a score of 20 percent. An assessment on the prevalent challenges within respondents’ respective communities found youth unemployment the dominant ‘severe problem’ with a score of 75 percent, followed by income inequality (54%), and poverty and food insecurity (53%). On the other hand, 53 percent adjudged ethnic tensions and hostilities ‘not a major problem’, likely confirming that most Kenyans to live in ethnically exclusive enclaves. Recommendations High standards of professional ethics in public service Findings indicate that compliance with integrity laws in public institutions stood at 81.1 percent. This finding reveals that close to 20 percent of public officers have not been sensitized on ethics and integrity requirements in the public service, or ignore them. It is therefore recommended that: (i) Public institutions make budgetary provisions for the continuous sensitization of public
officers on ethics and integrity; (ii) All public institutions, including the Kenya School of Government, mainstream
continuous training on ethics and integrity during induction courses and in-service programmes;
(iii) PSC incorporate an assessment on ethics and integrity in Staff Performance Appraisal tools for public officers;
(iv) Government institutionalize continuous vetting of public officers, and lifestyle audits be made a compulsory requirement for them; and
xiv
(v) Public institutions maintain updated registers on the membership of employees in respective professional bodies.
Strengthening devolution and sharing of power The findings on this thematic area indicate that devolution of functions stood at 67 percent. This confirms the defunct Transition Authority’s report that the transfer of functions and resources had not been finalized within the transitional timeline of three years. The outstanding issues undermine the discharge of devolved functions at county level. It is therefore recommended that:
(i) Government fast track attention to the proposals of the Transition Authority’s end-of-term report, including the audit of assets, incomes, and liabilities of devolved entities;
(ii) Government fast track the establishment of county public service pension frameworks; (iii) Government fast tracks the establishment of norms and standards for the management
of national and county public services. (iv) All institutions discharging national functions be required to decentralize their services
to the extent practicable in order to bring their services closer to the citizens. Good Governance, Transparency and Accountability A. The findings against the nine indicators on good governance revealed that performance
stood at 70.6 percent. Performance for the three indicators was below average. It is recommended that:
(i) Government fast tracks the documentation and automation of business processes, and their migration to e-platforms. This is the area that had performed poorly at 14.7 percent;
(ii) Government accelerate the establishment of more Huduma Centres in the 47 counties and sub-counties;
(iii) Public institutions be required to establish their service points in Huduma Centres and resolve their business processes in terms of lead time and user cost;
(iv) Government implement the recommendations of the task force report on the legislative, policy and institutional reforms in the fight against corruption; and
(v) Government institutionalize service delivery standards. B. The findings on implementation of Public Accounts Committee (PAC) and Public
Investment Committee (PIC) reports by public institutions indicate that of the 178 of them interviewed, 16 percent received recommendations from PAC and PIC in 2014/15. Of those that received recommendations, implementation by Commissions led at 75%, with State Corporations and Ministries averaging 40 percent and 50 percent respectively. It is recommended that:
(i) All public institutions that did not implement PAC and PIC recommendations be sanctioned;
(ii) Public institutions that did not implement the recommendations comply within six months; and
(iii) Parliament put in place mechanisms for enforcing compliance with its recommendations.

xv
Diversity management The findings on this thematic area against three indicators (the 2/3 gender principle; 5% persons with disabilities (PWDs) in employment; and youth access to employment) stood at 53.9 percent, an average performance. The fourth indicator on proportionate representation of ethnic communities revealed that 19 out of 39 communities are under-represented in the public institutions evaluated. It is recommended that:
(i) Public institutions develop time bound affirmative action programmes to bring on board PWDs, marginalized groups, minorities, women and the youth progressively as required by law. This is because for example, the performance on the 5 percent PWD indicator was poor at 39 percent of the public institutions complying.
(ii) Public institutions put in place liaison frameworks with the National Council for Persons with Disabilities and other institutions targeting minorities and marginalized during recruitment process.
(iii) Public institutions institutionalize time bound affirmative action programmes to bring on board women in the service to bridge the 25 percent gap on representation.
(iv) Public institutions to institutionalize time bound affirmative action programmes to bring on board more youths into the service to meet the 29 percent proportionate representation. This is because 50 percent of the public institutions did not meet the proportionate representation of the youth.
(v) Public institutions develop time bound affirmative action programmes to enhance proportionate representation of the 19 communities – 49 percent of the 39 ethnic groups covered in the survey – under-represented in the public institutions.
(vi) Government fast track implementation of Equalization Fund projects to facilitate affirmative action initiatives.
(vii) Public institutions maintain disaggregated and updated records on gender, ethnicity - including minority and marginalized communities, PWDs and age.
Economic use of resources and sustainable development
A. The findings on this thematic area measured by three human resource indicators revealed that the public institutions performance stood at 86.7 percent.
B. A trend analysis on four fiscal management indicators reveals the failure to meet the overall set thresholds. It is recommended that:
(i) All public institutions comply with the set recurrent to development thresholds of 70:30. The findings indicate that over the last five financial years there has been an improvement in allocation to development from 23.6 percent in 2011/12 to 27.7 percent in 2015/16.
(ii) Government builds capacity on developing and implementing Programme Based Budgeting in the public sector to ensure 100 percent budget absorption. The findings indicate that absorption of the recurrent budget improved from 89.9 percent in 2011/2012 to 90.5 percent in 2015/16. Meanwhile, absorption of the development budget improved from 55.1 percent in 2011/12 to 66.3 percent in 2015/16.
(iii) Government contain debt to GDP ratio. The findings indicate that the debt/GDP ratio rose from 35.9 percent in 2011/12 to 51.3 percent in 2015/16, which represents 42.6 percent increase over the four year period. The 51.3 percent rate is above the East

xvi
African Community Monetary Union Convergence Criteria of 50 percent, and could compromise fiscal sustainability.
Supporting Equitable Allocation of Opportunities The findings for this thematic area based on four indicators revealed that the public institutions’ performance averaged 58.6 percent. This finding means that the performance was below average as 41.4% of the public institutions did not meet the standards set in the evaluation. It is recommended that:
(i) Public institutions conduct diversity audits of their establishments within the first six months of 2017. The findings indicate that 52.8 percent of the MDAs are yet to conduct diversity audits.
(ii) Public institutions comply with the 30 percent allocation of procurement opportunities to disadvantaged groups. The findings indicate that 39 percent of public institutions failed to comply with the threshold.
(iii) Public institutions institutionalize time bound affirmative action programmes for appointments, training and promotions for the disadvantaged groups in the public service. The findings indicate that a few communities continue to account for disproportionately large shares of appointments, training and promotions.
(iv) Government reviews the criteria for the determination of the disadvantaged groups for the award of the reserved 30 percent of government tenders.
Accountability for Administrative Acts The findings on this thematic area based on 4 indicators revealed that public institutions’ performance was at a commendable 81.9 percent. It is however recommended that: (i) Public institutions review their client service charters and grievance handling
procedures in view of the malpractice reports received by the Commission for Administrative Justice, which have risen by 4,800 percent in four years, from 4,062 in 2012 to over 200,000 in 2015. The leading complaints are unresponsive officials and delays in service delivery.
(ii) Government develops regulations to give effect to the Fair Administrative Action Act 2015 and the Public Service (Values and Principles) Act 2015.
Improvement in Service Delivery The findings on this thematic area based on 11 indicators revealed that the public institution performance was at 69 percent, an average outcome. Whereas five of the indicators scored above 70 percent, the remaining six indicators averaged below 55 percent. It is recommended that:
A. Public institution Service Delivery i) Public institutions mainstream systems and structures for accommodation of PWDs in
their service delivery processes, including the use of Kenyan sign languages. The performance on this indicates that 61.8 percent of public institutions had customized their business processes for use by PWDs.;
ii) Public institutions automate their business processes for ease of access and use by citizens. The findings indicate that 75.0 percent of public institutions are yet to attain the required minimum automation level of at least 60 percent.

xvii
B. Citizen perception on service delivery The findings indicate that customer satisfaction levels for public institution service delivery stood at 71 percent. A citizen satisfaction baseline survey conducted in 1,393 households across 47 counties indicated that satisfaction levels stood at 42.6 percent, a variance of 28 percent. This means that a self-assessment by public institutions gives satisfactory performance levels not in consonance with perceptions of service recipients. It is recommended that: (i) Public institutions undertake periodic customer satisfaction surveys while an annual
citizen satisfaction survey is conducted by an oversight body, such as the Commission. (ii) A citizen service charter prescribes minimum service delivery standards, which can be
used to understand citizen service delivery satisfaction levels. These will set the annual citizens service satisfaction index which can be assessed and improved annually.
(iii) Improvements to the citizen service satisfaction index form part of the performance contract targets for public institutions.
Improve Performance Management The findings on this thematic area based on 7 indicators revealed that public institution performance was at 78.6 percent; but two indicator scores were below average. It is recommended that:
(i) Government strengthens the performance management system for more effective and efficient service delivery, and to enhance accountability for results. The findings indicate that the cascading of performance contracts had not been done for 31.5 percent of the public institutions surveyed.
(ii) Public institutions adopt and utilize quality management systems in their business processes. Findings indicate that 38.2 percent of them presently do not have valid ISO certification.
Public Participation in Policy Making The findings on this thematic area based on 4 indicators revealed that public institution performance was a commendable 76.6 percent; but the scores for 3 of the 4 indicators were below average. Findings indicate that 39 percent of public institutions have not developed policy guidelines for public participation. It is recommended that: (i) Government institutionalize the policy guidelines on public participation issued by the
Commission in 2014. Data Management and monitoring The evaluation established that there are gaps in the monitoring and evaluation of national and public service values and principles. It is recommended that: (i) Government establish an inter-agency forum for monitoring the implementation of
values and principles in the public service.

1
Introduction 1.1 Background
Global efforts to improve service delivery are reflected in the recently launched Sustainable Development Goals (SDGs) to which most governments have made a commitment following the 2015 lapse of the Millennium Development Goals (MDGs). The key commitment in the SGD framework is to “leave no one behind”. The idea that “no goal should be met unless it is met for everyone” is well established around the new goals. Consequently, various international benchmarks, such as the Human Development Index (HDI), Corruption Perception Index, Ease of Doing Business rankings, and Global Competitiveness Index, are important in at least two respects: firstly, they measure comparative service delivery; and secondly, they define national and international trust and confidence in the performance of governments and their respective public services. For example, a low HDI status points to a likely poor delivery of education and/or health services, and/or high poverty in households. Such a status undermines citizens’ confidence and trust in their government, but it also undermines the confidence of prospective investors, whether local or international. The Constitution of Kenya (2010) mandates the public service to deliver some of the direct services with which to improve such indicators, while also providing an environment conducive for the private sector – formal and informal; local and international – to contribute to the country’s development aspirations. A public service operating in the context of positive values and principles is most likely to succeed in delivering such development. Cognizant of these aspirations and realities, the Constitution commits to instill values and principles among citizens as a basis for improved service delivery, with the aim of transforming the country to middle-income status by 2030. In particular, the Constitution paid specific attention to initiatives that can uplift the performance of the Government and its public service, in incorporating foci on Leadership and Integrity (Chapter 6), National Values and Principles of Governance (Article 10), and Values and Principles of Public Service (Article 232). Further, Article 132 (1)(c) of the Constitution mandates the President to report to the nation annually on all the measures taken and progress achieved in realizing the National Values and Principles of Governance of Article 10 of the Constitution. Additionally, Article 234 (2)(h) mandates Public Service Commission (PSC) to evaluate and report to the President and to Parliament on the extent to which the values and principles of Articles 10 and 232 have been complied with in the Public Service. The Constitution also provided a calendar within which to institute necessary policy, legislation and other frameworks by 2015 to enable its implementation, resulting in various frameworks around the implementation of the said values and principles. The values and principles of public service in particular are instrumental in determining, guiding, and informing the development of a corporate culture. This is essential because public service as an organization operates in a dynamic environment subjected to regular change, and public officers are faced with competing demands and obligations which affect overall public service delivery. Public service delivery processes are also important as an outcome, and for promoting public trust, confidence and democratic governance. Effective public management also requires that public actions, such as planning, budgeting and programme implementation, are conducted in an environment that is guided by a clear framework of values and principles. However, for such a framework to have positive influences on service delivery, it must be transformed into actions. To date, both the President and PSC have fulfilled their respective constitutional mandates on values and principles, with annual reports between 2012/13 and 2015/16. Yet, these initiatives have faced various constraints, especially due to the lack of sound frameworks for collecting

2
consistent datasets across the whole public service to allow for sound analyses. This 2015/2016 report builds on the earlier monitoring and evaluation (M&E) experiences, and generates quality data with which to assess public service compliance with Chapter 6, and Articles 10 and 232 of the Constitution. To this end, PSC commissioned the Kenya Institute for Public Policy Research and Analysis (KIPPRA) to lead a research activity whose terms of reference (TORs) were to: (a) Assess the responsiveness of systems and structures for the implementation of values
and principles in the public institutions. (b) Determine the extent to which each of the provided indicators is implemented in the
respective public institutions. (c) Undertake a trend analysis of the provided indicators for the years 2012/13 to 2015/16. (d) Develop a trend analysis for the last three years on the implementation of values and
principles in the public service based on the provided indicators. (e) Develop performance indices on the ten (10) thematic areas and a composite score index
for each public institution. (f) Determine compliance index for the values and principles in the public service. (g) Determine the extent to which the public service has complied with the values and
principles in Articles 10 and 232. (h) Make appropriate public institution specific findings and recommendations. (i) Prepare and present the draft report to the Commission for review and validation. (j) Prepare final report on values and principles of the public service. (k) Hand over the primary and secondary data and by products. Besides this study’s estimation of indices of compliance for individual and collective public institutions, and for the 10 thematic areas, it also introduces household and private sector perceptions on the public institutions’ compliance with the values and principles. A detailed version of this report is available for further reference. This is an abridged version and therefore only contains summarized analysis of the main report and the main recommendations from the findings. The rest of the sections are organized as follows: Section 2 outlines a brief review of the values and principles of public service. The methodology and data of the study leading to this report are discussed in section 3. Key findings and recommendations are presented in section 4, while section 5 focuses on conclusion and major action areas. Brief Review of Values and Principles of Public Service The present study takes PSC’s ‘Framework for the Implementation of Values and Principles of Articles 10 and 232’ hereafter, the PSC Framework as given, including its 10 thematic areas drawn from Article 232, listed in Table 1. The table maps the various National Values and Principles of Governance of Article 10 against each of the thematic areas, with evident overlaps. By implication, the delivery of a thematic area might involve the upholding more than a single National Value and Principle of Governance. Additionally each of the thematic areas could involve multiple policies and legislation. While all Kenyans, individuals and corporations, are encouraged to uphold the values and principles of Article 10, these and those of Article 232 are an imperative for satisfactory public service delivery.

3
Table 1: Mapping the values and principles of Articles 10 and 232 Public Service Values (Article 232) Corresponding national values and principles of governance (Article 10) (a) High standards of professional ethics Rule of Law; Human Dignity; Social Justice; Human Rights; Non-discrimination; Good
Governance; Integrity; Transparency and Accountability; Sustainable Development (b) Efficient, effective and economic use of resources Patriotism; Democracy and Participation of the People; Equity; Inclusiveness; Equality; Non-
discrimination; Protection of the Marginalized; Good Governance; Integrity; Transparency and Accountability; Sustainable Development
(c) Responsive, prompt, effective, impartial and equitable provision of services Patriotism; National Unity; Sharing and Devolution of Power; Democracy and Participation
of the People; Equity; Social Justice; Inclusiveness; Equality; Human Rights; Non-discrimination; Protection of the Marginalized; Good Governance; Integrity; Transparency and Accountability; Sustainable Development
(d) Involvement of people in the process of policy making National Unity; Sharing and Devolution of Power; Democracy and Participation of the
People; Human Dignity; Inclusiveness; Equality; Human Rights; Non-discrimination; Protection of the Marginalized; Good Governance; Integrity; Transparency and Accountability; Sustainable Development
(e) Accountability for administrative acts Patriotism; National Unity; Democracy and Participation of the People; Social Justice;
Human Rights; Non-discrimination; Good Governance; Integrity; Transparency and Accountability
(f) Transparency and provision to the public of timely, accurate information Patriotism; Democracy and Participation of the People; Non-discrimination; Good
Governance; Integrity; Transparency and Accountability; Sustainable Development (g) Fair competition and merit as the basis of appointments and promotions National Unity; Equity; Equality; Human Rights; Non-discrimination; Protection of the
Marginalized; Good Governance; Integrity; Transparency and Accountability; Sustainable Development
(h) Representation of Kenya’s diverse communities National Unity; Democracy and Participation of the People; Human Dignity; Equity; Social
Justice; Inclusiveness; Equality; Human Rights; Non-discrimination; Protection of the Marginalized; Good Governance; Integrity; Transparency and Accountability; Sustainable Development
(i) Affording adequate and equal opportunities for appointment, training, and advancement at all levels of the public service, of : (i) Men and women; (ii) Members of all ethnic groups; and (iii) Persons with disabilities
Patriotism; National Unity; Democracy and Participation of the People; Equity; Social Justice; Equality; Human Rights; Non-discrimination; Protection of the Marginalized; Good Governance; Integrity; Transparency and Accountability; Sustainable Development

4
Methodology and Data 1.2 Sample design The study for this report utilized both qualitative and quantitative research methodologies to respond to the TORs. The qualitative research mainly involved county level focus group discussions (FGDs) and the review of relevant literature, policy and legal documents, as well as reports from the PSC. The quantitative research involved structured questionnaires administered to selected samples of institutions, their employees, and households across the country. Secondary data from PSC, though limited, was to the extent possible analyzed in this study. The Kenya National Bureau of Statistics provided the samples for the survey of households and non-government respondents. The survey realized a coverage of 178 MDAs (71% coverage), 1,395 households (93% response rate) and 151 respondents from private institutions (100% response rate), with coverage of all 47 counties. However, for some variables, not all public institutions responded, resulting in varied response rate across variables. 1.3 Computation of thematic performance indices This study computed thematic performance indices for all public institutions, as well as composite indices. The computation approaches employed in the study are consistent with global practice. The estimation of an index involved three broad steps:
a) Data collection especially on indicator scores; b) Assigning standardized values to data on indicators – and if necessary banding of
indicators; and c) Aggregating thematic and composite indicators
The indices were based on objective data collected from public institutions using an institutional questionnaire. These data were standardized to take account of the varied scales of measurement of indicators within each of the themes. Consequently, the scores range between zero (0) and one (1). In some cases, the score of one (1) was assigned for possessing a targeted attribute, while zero (0) was assigned for not possessing the desired attribute. As an example, one indicator for the “Equitable Allocation of Opportunities” was whether at least 30 percent of the value of total procurement was reserved for youth, women and persons with disabilities (PWDs), as provided by the law. Public institutions meeting that benchmark were assigned a value of 1, while those failing the benchmark were given zero (0). In other instances, standardization was achieved by picking appropriate minimum and maximum values for each indicator and computing the standardized score using equation 1. Any value below the minimum was assigned 0, while any value above the maximum was assigned a value of 1. All other values would be scaled evenly between 0 and 1. As an example, performance against Article 54(2)’s provision of a 5 percent share of employment for PWDs is an indicator for the “Diversity Management” thematic area. Public institutions scored 1 if they met the threshold. The standardized score for this indicator would be computed by equation 1.

5
Standardized Score = !!"#$%&'()*+�!"#$!!"#"$"$%&'()!"#$%&%'"(&)!!"#"$%$&'(%)
... (1)
Equation 1 applies for indicators for which a higher value for the indicator is inherently better. However, there are some indicators, such as the percentage of employees who did not comply with declaration of income, for which a higher value is less desirable. For such indicators, the standardized score was calculated as shown in equation 2. The reverse standardized score for such indicators ensures all measurements are consistent, with 0 to 1 running from the worst to best scores.
Standardized Score = 1− !"#$%&'()*+,-)./0!!"#"$"$%&'()!"#$%&%'"(&)!!"#"$"$%&'()
…. (2)
Some standardized scores ranged progressively between 0 and 1, while others were either 0 (if attribute was non-existent), or 1 (if it merely existed, without evaluating effectiveness). For MDAs without data that should routinely be available – such as the share of PWDs in employment, the 0 score is designed to penalize non-response (where applicable), or spur action where the rate is below 5 percent. For convenience in reporting, these 0 to 1 standardized scores are read as percentages. The analysis provides a baseline aggregate index per public institution, and for each of the 10 thematic areas. The analysis also clustered public institutions into (i) Ministries and State Departments, (ii) Constitutional Commissions, and Independent Offices (CC&IOs) and (iii) State Corporations –also referred to as ‘Parastatals’. It then distinguished ‘Low’ attainment public institutions as those with an overall score of below 1 standard deviation from the cluster mean score; and, a ‘Medium’ classification represents a mean score within 1 standard deviation of the cluster mean, while a ‘High’ classification is a score above 1 standard deviation from the cluster mean. Since only 9 CC&IOs were covered, the population was considered too small for useful clustering into High/Medium/Low achievers. Additionally, the analysis excluded Thematic Area 2 – Devolution and Sharing of Power, since the majority of public institutions do not have devolved functions. In some instances, the analysis also covered County Governments. The indicators used in the computation of the compliance indices were drawn from the options offered by the PSC Framework of 2015, and are presented in Table 2. Table 2: Summary of Indicators by Thematic Area Thematic Area Indicators
Indicators of High Standards of Professional Ethics
(i) Existing documented policy on staff capacity development
(ii) Existing customized Code of Conduct and Ethics (iii) Board/Commissioners trained on Corporate Governance (iv) Staff trained on the Public Officer Ethics Act (v) Percentage compliant over income, assets and liability
declaration. 1. Devolution and
sharing of power (i) Fully devolved functions
(ii) Fully transferred records (iii) Devolved staff and finances.
2. Good Governance
(i) Publish annual reports/newsletters (ii) Existing operational anti-corruption committee

6
(iii) Submit quarterly reports to EACC (iv) Existing interactive website (v) An interactive social media presence
(vi) Appraised staff performance 2014/15 3. Diversity
Management (i) %age of women in MDA (At least 33%)
(ii) %age of youth in MDA (28.6% aged 18-34) (iii) %age of PWDs (at least 5%) (iv) Ethnic composition by MDA
4. Economic Resource Use and Sustainable Development
Human resource (i) Existing complete/approved strategic plan 2015/16
(ii) Existing human resource management plan (iii) Documented service delivery procedures Economic
indicators (iv) Debt to GDP ratio (v) Development to recurrent expenditure ratio
(vi) GDP growth rate (vii) Operations and maintenance: Salaries ratio
5. Equitable Allocation of Opportunities
(i) Audited diversity within last 2 years (ii) Existing policy on promotions
(iii) Existing skills competency framework (iv) % Procurement reserved for women, youth and PWDs
6. Accountability for Administrative Acts
(i) Existing corporate communications strategy (ii) Existing complaints resolution committee
(iii) Existing client service charter (iv) Existing grievance handling procedures
7. Improvements to Service Delivery
(i) Available front office services (ii) Visible client service charter
(iii) Presence in e-citizen platform (iv) Available and accessible customized facilities (v) Clear directional signage
(vi) Existing website (vii) Automation
(viii) Availability of Braille and sign language interpreter (ix) Client complaints handling procedure (x) Client complaints register
(xi) Client complaints online form (xii) Presence in e-citizen platform
8. Performance (i) Existing signed performance contract for 2015/16

7
Management
(ii) Cascaded performance contract to employees (iii) Delivery of performance contract targets (iv) Existing updated asset register (v) Existing asset maintenance schedule(s)
(vi) Existing Quality Management System (vii) Quality Management System status
9. Public Participation for Policy Making
(i) Existing public participation policy. (ii) Existing public participation guidelines.
(iii) Existing public participation systems/structures. (iv) Existing inventory of stakeholders.
Key findings and Discussions 1.4 Overall Compliance Index Scores The study findings reflect varied levels of public institution compliance with the values and principles of public service. The overall compliance index score for all the public institutions based on the nine thematic areas was 68.1 percent. Devolution and Sharing of Power was not included in the overall compliance index because majority of public institutions’ functions are not subject to devolution. The public institutions are clustered into (i) State Corporations with an overall compliance score of 67.4 percent, (ii) Ministries and State Departments’ compliance score averaging 64.3 percent, and (iii) Constitutional Commissions and Independent Offices’ (CC&IOs) compliance score averaging 72.7 percent. The average scores for each of the thematic areas of the study are also presented in Figure 1. For the nine thematic areas analyzed, the overall composite index for State Corporations was 67.4 percent. The results are classified into low, medium and high achievers. A ‘Low’ classification applied in the case of 14.6 percent of the 130 institutions covered, 72.3 percent attained ‘Medium’ classification, while only 13.1 percent had a ‘High’ classification. The individual scores ranged from Kenya Forest Service’s leading 84percent score to Kenya Planters Co-operative Union’s 20.4 percent. Among the notable Low classifications were the National Communications Secretariat (29.7%) and the Konza Technologies Development Authority (48.4%). Notables classified as Medium achievers were LAPSSET Authority (65.1%) and Kenya Power Company (69.0%), while the High achievers included NACADA (76.0%), National AIDS Control Council (79.0%) and Kenya National Museum (81.5%). Of the 20 Ministries and State Departments, 3 (15.0%) were High achievers, 15 (75.0%) were Medium achievers and 2 (10.0%) were Low achievers. The scores ranged from 82.1 percent for State Departments of University Education and Energy and Petroleum, to19.8 percent for the Department for Special Programmes. For the 9 CC&IOs, the scores ranged from the Salaries and Remuneration Commission’s 57.1 percent score to the Commission on Administrative Justice’s 68.9 percent.

8
Figure 1: Compliance Indices for MDA clusters and Thematic Areas, 2016
88.9
75.0
55.6
100.0
62.6
80.6
69.2
78.1
96.9
72.7
70.8
63.5
51.4
71.5
58.2
78.1
63.4
76.9
66.3
64.3
83.5
73.3
54.6
88.7
55.0
86.9
74.3
80.7
66.7
67.4
81.1
70.6
53.9
86.7
58.6
81.9
69.0
78.6
76.6
68.1
0.0 20.0 40.0 60.0 80.0 100.0 120.0
Professionalism
Good Governance
Diversity Management
Economic Use of Resources & Sustainable Development
Equitable OpportuniKes
Accountability
Service Delivery
Performance Management
Public ParKcipaKon
Overall Compliance Index
Average ThemaKc Area score
State CorporaKons (inc Public UniversiKes)
Ministries and State Departments
ConsKtuKonal Commissions/Independent Offices

9
1.5 Performance and Compliance by the 10 Thematic Areas 1.5.1 High Standards of Professional Ethics 1.5.1.1 Measures taken Kenya has taken various measures over time to enhance high standards of professionalism and ethics among individuals and institutions in the public sector. Reforms have included the enactment of legislation which include: Public Financial Management Act, 2012; Leadership and Integrity Act, 2012; Public Service Commission Act, 2012; Public Service (Values and Principles) Act, 2015; Public Officers and Ethics Act, 2003, amongst others. Institutional reforms include the granting of independence and security of tenure to key public offices including; the Auditor General, the Director of Public Prosecutions, the Ombudsman, and the Controller of Budget, amongst others. Service delivery reforms have included new or reviewed policies. Besides encouraging membership of professional bodies, the government has also espoused strategic management which has resulted in the mainstreaming of Service Charters, Vision, Mission and Core Values statements to guide service delivery. 1.5.1.2 Performance and compliance level For this thematic area, 15 percent of the Ministries and State Departments were High and Low achievers, while 70 percent of the 20 Ministries were Medium achievers. Six institutions had 100 percent compliance scores; but the Ministry of Agriculture had a low score. The distribution among the State Corporations was quite similar: 13.6 percent and 14.6 percent were High and Low achievers respectively while 72.3 percent were Medium achievers. Among the CC&IOs, five agencies scored 100percent while the Salaries and Remuneration Commission achieved a 60 percent score. Overall, 68 agencies scored 100 percent, while the lowest three institutions each scored 20 percent. Figure 2: High standards of professionalism performance distribution (%)
1.5.1.3 Challenges The 2015/16 report identified the following challenges: (i) Low levels of compliance with the Leadership and Integrity Act, 2012; (ii) Low levels of capacity building on Public Officer Ethics Act; (iii) Low budgetary levels and continuous shifts in budgetary allocations vis a vis budgetary
requirements; Institutions entrusted with the promotion of good governance, including Ethics and Anti-Corruption Commission, Director of Public Prosecution, and National Police Service, experienced low financial, human and physical capacities, which undermined their efficiency and effectiveness;
30.0
49.6
47.0
55.0
31.0
34.2
15.0
19.4
18.8
0.0 10.0 20.0 30.0 40.0 50.0 60.0
Ministries
State Corporations
Total
Low Medium High

10
(iv) Weak compliance with the Public Procurement and Asset Disposal Act; and (v) Very few public institutions maintained an updated inventory of the professional
organization that their staff participated in, partially because most of the schemes of service do not mandate staff membership of professional bodies.
1.5.1.4 Recommendations Findings indicate that compliance with integrity laws in public institutions stood at 81.1 percent. This finding reveals that close to 20 percent of public officers have not been sensitized on ethics and integrity requirements in the public service, or ignore them. It is therefore recommended that: (i) Public institutions make budgetary provisions for the continuous sensitization of public
officers on ethics and integrity; (ii) All public institutions, including the Kenya School of Government, mainstream
continuous training on ethics and integrity during induction courses and in-service programmes;
(iii) PSC incorporate an assessment on ethics and integrity in Staff Performance Appraisal tools for public officers;
(iv) Government institutionalize continuous vetting of public officers, and lifestyle audits be made a compulsory requirement for them; and
(v) Public institutions maintain updated registers on the membership of employees in respective professional bodies.
1.5.2 Devolution and Sharing of Power 1.5.2.1 Measures taken The Constitution of Kenya provides for two-tiers of government, the national government and forty seven (47) county governments. During the year under review, the Government undertook several measures aimed at ensuring the continuation of the smooth transition to devolution and sharing of power. These measures include:
(i) Transferring of functions to county governments as required by the Constitution; (ii) Allocation of public finances to county governments;
(iii) Establishing the Inter-governmental Relations Technical Committee to assume the functions of the defunct Transition Authority in facilitating and coordinating the transition to the devolved system of government;
(iv) Implementing the Inter-governmental Relations Act, No.2 of 2012; and (v) Other measures taken include convening of intergovernmental sectoral forums through
the Ministry of Devolution and Planning, and establishment of county service delivery committees.
1.5.2.2 Performance and compliance level Most of the functions marked for devolution had already been devolved to counties at the time of the survey. The survey for this study established divergent devolution functions across the public institutions, with only 16.3 percent of State corporations having such obligations compared to 47.6 percent of Ministries. Of the public institutions with devolved responsibilities, the rate of full compliance ranged between 12 percent for State corporations

11
to 67 percent for Ministries. The picture was similar over devolution of staff, finances and records, except in the case of the CC&IO category. 1.5.2.3 Challenges The following are among the challenges that were observed and could undermine devolution and sharing of power. (i) Challenges related to adherence to budget procedures and delayed disbursements. (ii) Inadequate human resource capacity in the counties. (iii) Lack of cohesion among various communities within counties. (iv) Weak governance structures at the county level 1.5.2.4 Recommendations The findings on this thematic area indicate that devolution of functions stood at 67 percent. This confirms the defunct Transition Authority’s report that the transfer of functions and resources had not been finalized within the transitional timeline of three years. The outstanding issues undermine the discharge of devolved functions at county level. It is therefore recommended that:
(i) Government fast track attention to the proposals of the Transition Authority’s end-of-term report, including the audit of assets, incomes, and liabilities of devolved entities;
(ii) Government fast track the establishment of county public service pension frameworks; (iii) Government fast track the establishment of norms and standards for the management
of national and county public services. (iv) All institutions discharging national functions be required to decentralize their services
to the extent practicable in order to bring their services closer to the citizens. 1.5.3 Good Governance, Transparency and Accountability 1.5.3.1 Measures taken Public institutions have put in place various policies and statutes to improve good governance in Kenya. Additionally, Mwongozo, the code of governance for State corporations addresses matters of effectiveness of boards, transparency and disclosure, accountability, risk management, internal controls, ethical leadership and good corporate citizenship. Other strategies address justice, security, law and order. Further measures include the review of organizational structures, adoption of e-procurement, existence of statutory boards and substantive chief executives, existence of succession management plans, board members’ induction, asset declaration, execution of performance appraisals, procurement queries, accounting queries from the parliamentary Public Accounts Committee (PAC) and Public Investments Committee (PIC). An area of potential improvement in Good Governance is the MDA presence in the e-Citizen platform. Only about 15 percent of public institutions reported having presence in the platform – which could undermine the effectiveness of digital payments. 1.5.3.2 Performance and compliance level The findings against the nine indicators on good governance revealed that the performance stood at 63.6 percent. Performance for the three indicators was below average. Further, the findings on implementation of PAC and PIC reports by public institutions indicate that of the 178 public institutions interviewed, 16 percent received recommendations from PAC and PIC

12
in 2014/15. Of the public institutions that received recommendations, implementation by Commissions stood at 75 percent, while State Corporations and ministries averaged 40 percent and 50 percent respectively. Among Ministries and State Departments, 10.0 percent were assessed as High achievers, 10.0 percent as Low achievers and 80.0 percent as Medium achievers. The two High achievers were National Treasury and the State Department for Sports Development (both scored 100 percent), while the lowest score of 25.0 percent went to both the State Department of Special Programmes and the State Department of Transport. Among the State Corporations, 60 (46.5%) institutions scored 100.0 percent, while the National Sports Fund and Tourism Regulatory Authority each scored 14.3 percent. Among the 129 institutions that responded under this area, 38.0 percent were Medium achievers. There were 3 perfect scores among the CC&IOS, with the Commission on Revenue Allocation attaining a score of 57.1 percent. Figure 3: Good governance performance distribution (%)
In particular, performance on specific indicators were very discouraging. For instance, the indicator on representation of public institutions at Huduma Centres was a low 14.7 percent. Documentation of business processes, the automation of the processes and migration of the services to e-platforms attained a score of 23.1 percent. 1.5.3.3 Challenges Some of the challenges faced in the promotion of good governance in the public sector include:
(i) Lack of implementation of the task force report on the legislative, policy and institutional reforms in the fight against corruption.
(ii) Non representation of some essential services at Huduma centres across various counties.
(iii) Some public institutions did not implement recommendations from PAC and PIC (iv) Some of the boards of directors’ terms had expired and it took long to appoint new
substantive boards, undermining the wholesome decision-making. (v) The lack of knowledge on the existence of good governance practices among staff
resulting from low awareness on national values by many employees and low capacity and training of staff on procurement procedures. Further, existing procurement and financial laws had not been fully cascaded to all staff. There was lack of training and capacity building of staff on good governance practices, procurement and financial laws in public institutions.
10.0
46.5
41.6
80.0
38.0
43.6
10.0
15.5
14.8
0.0 20.0 40.0 60.0 80.0 100.0
Ministries
State Corporations
Total
Low Medium High

13
(vi) Low adoption of ICT and automation of services resulted in the slow transition to e- channels of service delivery, like E- citizen, e- procurement and social media presence.
(vii) Inadequate budgetary allocation towards programs that support governance had slowed down capacity building programmers, ICT adoption and awareness programs.
1.5.3.4 Recommendations A. The findings against the nine indicators on good governance revealed that performance
stood at 70.6 percent. Performance for the three indicators was below average. It is recommended that:
(i) Government fast tracks the documentation and automation of business processes, and their migration to e-platforms. This is the area that had performed poorly at 14.7 percent;
(ii) Government accelerate the establishment of more Huduma Centres in the 47 counties and sub-counties;
(iii) Public institutions be required to establish their service points in Huduma Centres and resolve their business processes in terms of lead time and user cost;
(iv) Government implement the recommendations of the task force report on the legislative, policy and institutional reforms in the fight against corruption; and
(v) Government institutionalize service delivery standards. B. The findings on implementation of Public Accounts Committee (PAC) and Public
Investment Committee (PIC) reports by public institutions indicate that of the 178 of them interviewed, 16 percent received recommendations from PAC and PIC in 2014/15. Of those that received recommendations, implementation by Commissions led at 75%, with State Corporations and Ministries averaging 40 percent and 50 percent respectively. It is recommended that:
(i) All public institutions that did not implement PAC and PIC recommendations be sanctioned;
(ii) Public institutions that did not implement the recommendations comply within six months; and
(iii) Parliament put in place mechanisms for enforcing compliance with its recommendations.
1.5.4 Diversity Management 1.5.4.1 Measures taken Diversity management refers to deliberate policies, programmes and actions to create greater inclusion of employees from various backgrounds into existing structures, resulting in a representative and all-inclusive public service as provided for in the Constitution. Article 10 provides for inclusion, social justice and protection of the vulnerable groups, while Article 232 provides that the public service must include the diverse Kenyan communities, with equal opportunities in appointment, training and advancement at all levels of the public service. The measures taken by the government and its agencies to enhance this value and principle within the public service include:
(i) The development of several policies by the Government through the Kenya National Commission on Human Rights and National Gender and Equality Commission. These

14
include attention to policies and legislation surrounding equality, Human Rights, and the Gender Diversity Mainstreaming Policy, 2015 to promote the Bill of Rights.
(ii) The requirement for state agencies to provide gender disaggregated data to the National Gender and Equality Commission.
(iii) The ongoing implementation of the one third gender rule in public appointments (iv) Provision of sanitary towels to mitigate against existing gender disparities in access,
equity, retention, transition and achievements in education. (v) Disability mainstreaming programmes implemented in public institutions as part of
the annual performance contract targets in addition to the reporting requirement to the National Council of Persons with Disability.
1.5.4.2 Performance and compliance level The findings on this thematic area against 3 indicators (2/3 gender principle, 5 percent PWDs and youth access to employment) stood at 55 percent. This reveals that public institutions performance was average against the three indicators. The fourth indicator on proportionate representation of ethnic communities revealed that 19 out of 39 communities are underrepresented in the public institutions evaluated. Performance on PWDs indicator was poor at 39 percent of the public institutions complying with the 5 percent requirement. Fifty percent of the public institutions did not meet the proportionate representation of the youth. Among the 20 Ministries and State Departments, 20.0 percent were High achievers, 70.0 percent were Medium achievers, and 10.0 percent were Low achievers. The three 100.0 percent score belonged to the Ministry of Energy and Petroleum, and the departments of Special Programmes, and University Education, in contrast to the 25.0 percent scores of the Departments of Infrastructure and Environment. Among the State Corporations, an even 18.5 percent were Low and High achievers respectively, while 63.0 percent - 85 of 129 institutions that responded– were Medium achievers. NACADA had the highest score of 85.2 percent while Kenya Film Commission trailed with a score of 14.5 percent. Among the CC&IOs, six agencies scored an even 75 percent while three had 50 percent scores. Figure 4: Diversity management performance distribution (%)
1.5.4.3 Challenges
Challenges affecting effective diversity management include: (i) Low response or turnout from marginalized groups during recruitments was reported
as hindrance to their inclusion in the employment process in some public institutions. (ii) Low qualifications especially in technical skills and education among the minorities
and marginalized communities is a major problem.
20.0
18.5
18.7
70.0
63.0
63.9
10.0
18.5
17.4
0.0 20.0 40.0 60.0 80.0
Ministries
State Corporations
Total
Low Medium High

15
(iii) Freeze on employment in the public sector has slowed down new recruitments and by extension slowed corrective measures towards ethnic imbalance and succession plans.
(iv) Poor data management and record management on the indicators of diversity were prevalent in many institutions.
(v) Weak awareness of diversity management issues among public institutions 1.5.4.4 Recommendations The findings on this thematic area against three indicators (the 2/3 gender principle; 5% persons with disabilities (PWDs) in employment; and youth access to employment) stood at 53.9 percent, an average performance. The fourth indicator on proportionate representation of ethnic communities revealed that 19 out of 39 communities are under-represented in the public institutions evaluated. It is recommended that:
(i) Public institutions develop time bound affirmative action programmes to bring on board PWDs, marginalized groups, minorities, women and the youth progressively as required by law. This is because for example, the performance on the 5 percent PWD indicator was poor at 39 percent of the public institutions complying.
(ii) Public institutions put in place liaison frameworks with the National Council for Persons with Disabilities and other institutions targeting minorities and marginalized during recruitment process.
(iii) Public institutions institutionalize time bound affirmative action programmes to bring on board women in the service to bridge the 25 percent gap on representation.
(iv) Public institutions to institutionalize time bound affirmative action programmes to bring on board more youths into the service to meet the 29 percent proportionate representation. This is because 50 percent of the public institutions did not meet the proportionate representation of the youth.
(v) Public institutions develop time bound affirmative action programmes to enhance proportionate representation of the 19 communities – 49 percent of the 39 ethnic groups covered in the survey – under-represented in the public institutions..
(vi) Government fast track implementation of Equalization Fund projects to facilitate affirmative action initiatives.
(vii) Public institutions maintain disaggregated and updated records on gender, ethnicity - including minority and marginalized communities, PWDs and age.
1.5.5 Economic use of Resources and Sustainable Development 1.5.5.1 Measures taken The constitutional values and principles of the Kenyan public service affirm the need for competence, efficiency, effectiveness and economic use of resources. These provisions lay the cornerstone for accountable public sector governance that deploys resources in a least cost but effective manner. During the 2014/15 and 2015/16 financial years, a number of measures were put in place towards ensuring that the principle of economic resource use is upheld. These measures include:
(i) Issuance of the Public Finance Management Act (Regulations) 2015; (ii) Amendments to the Public Financial Management Act and the Public Procurement
and Disposal Act;

16
(iii) Preparation of the Medium Term Expenditure Framework (MTEF) reports for each of the MTEF sectors as part of the Sector Wide approach to government budgeting;
(iv) Development of programme-based budgets reports for each of the public institutions;
(v) Review of organizational structures by ministries to align to the revised structure of government;
(vi) Development of County Integrated Development Plans as a pre-requisite for rolling out devolution interventions;
(vii) Preparation and submission of MDA annual work plans, procurement plans and cash flow requirements to the National Treasury before commencement of a financial year;
(viii) Preparation of Annual Financial Statements and budget implementation reports by the all public institutions; and
(ix) Annual audit of MDA accounts by the Auditor General. 1.5.5.2 Performance and Challenges A trend analysis on four fiscal management indicators reveals that the overall set thresholds were not met. All public institutions comply with the set recurrent/ development thresholds of 70:30. The findings on this thematic area against 3 human resource indicators revealed that public institutions performance was at 86.7 percent. The findings indicate that over the last five financial years there has been an improvement in allocation to development from 23.6 percent in 2011/12 to 27.7 percent in 2015/16. Among Ministries and State Departments, 12 managed the perfect score of 100.0 percent, being 60.0 percent of the 20 institutions evaluated. Some four institutions attained Medium and Low statuses (20%), with Special Programmes and Transport trailing with 16.7 percent score. Among the State Corporations, 34.1 percent were High achievers, 44.2 percent were Medium achievers, and 21.7 percent were Low achievers. Among the low achievers category were Anti-FGM Board, Kenya Institute of Mass Communications, and Konza Technologies Development Authority, each scoring 16.7 percent. Among the CC&IOS, all 9 had perfect scores of 100 percent.

17
Figure 5: Economic use of human resources performance distribution (%)
Recommendations
A. The findings on this thematic area measured by three human resource indicators revealed that the public institutions performance stood at 86.7 percent.
B. A trend analysis on four fiscal management indicators reveals the failure to meet the overall set thresholds. It is recommended that:
(i) All public institutions comply with the set recurrent to development thresholds of 70:30. The findings indicate that over the last five financial years there has been an improvement in allocation to development from 23.6 percent in 2011/12 to 27.7 percent in 2015/16.
(ii) Government builds capacity on developing and implementing Programme Based Budgeting in the public sector to ensure 100 percent budget absorption. The findings indicate that absorption of the recurrent budget improved from 89.9 percent in 2011/2012 to 90.5 percent in 2015/16. Meanwhile, absorption of the development budget improved from 55.1 percent in 2011/12 to 66.3 percent in 2015/16.
(iii) Government contain debt to GDP ratio. The finding indicates that the debt/GDP ratio rose from 35.9 percent in 2011/12 to 51.3 percent in 2015/16, which represents 42.6 percent increase over the four year period. The 51.3 percent rate is above the East African Community Monetary Union Convergence Criteria of 50 percent, and could compromise fiscal sustainability.
1.5.6 Equitable Allocation of Opportunities 1.5.6.1 Measures taken The Constitution of Kenya provides for adequate access to equal opportunities in appointment, training and advancement at all levels of the public service without discrimination on any of the grounds listed in Article 27, including grace, sex, pregnancy, marital status, health status, ethnic or social origin, colour, age, disability, religion, Conscience, belief, culture, dress, language or birth The measures taken to promote equitable allocation of opportunities include the following: (i) The Constitution has reserved at least five percent (5%) of appointments in the public
sector for PWDs. The Diversity Policy for Public Service envisages this to be realized progressively over five years.
60.0
78.3
75.8
20.0
0.0
2.7
20.0
21.7
21.5
0.0 20.0 40.0 60.0 80.0 100.0
Ministries
State Corporations
Total
Low Medium High

18
(ii) The Constitution provides that not more than two-thirds of members in elective and appointive positions shall be of the same gender.
(iii) Every public service institution shall ensure fair and equitable representation of the diverse Kenyan ethnic communities and groups, including minorities and marginalized groups, proportionate to their national population size.
(iv) Equitable access to training opportunities and human resource development. (v) Equitable access to procurement opportunities for youth women and persons with
disabilities. 1.5.6.2 Performance and compliance level The findings on this thematic area against 4 indicators revealed that public institutions performance was at 58.6 percent. This finding means that the performance was below average as 41.4 percent of public institutions did not meet the standards set in the evaluation. The scores for Ministries and State Departments ranged between Special Programmes’ 0.0 percent to 94.9 percent for the State Department of Energy and Petroleum, the sole entity attaining the High compliance level. Some 15.0 percent of the agencies attained the Low compliance score, while 80.0 percent achieved Medium status. Among the State Corporations, 18 percent – 14.0 percent of the group of 129 – attained the High status. The Medium and Low statuses had 63.6 percent and 14.7 percent respectively. Only three institutions attained the perfect score, including Kenya Ports Authority, Kenya Revenue Authority, and Kenya Universities Central Placement Agency. Kenya Safari Lodges and Hotels’ 7.5 percent is the lowest in this cohort, and also the lowest score among all the cohorts. The CC/IO scores also exhibited a similarly wide range, from the Commission on Administrative Justice’s 7.5 percent to the Energy Regulatory Commission’s perfect score of 100 percent. Figure 6: Equitable allocation of resources performance distribution (%)
1.5.6.3 Challenges
(i) There is a persisting domination of public sector employment opportunities by a small number of ethnic groups.
(ii) Freeze on employment and promotions has slowed down new recruitments in most public agencies. Public institutions therefore, noted that plans to correct inequalities in employment consequently slowed down.
(iii) Large ethnic groups still dominate new recruitments and promotions, with 19 of the country’s over 40 ethnic groups taking up most of the positions. This pattern is reflected across all the Public institutions. Public institutions observed that there was a low number of applications for marginalized group’s especially those with disabilities.
5.0
15.1
13.7
80.0
68.9
70.5
15.0
16.0
15.8
0.0 20.0 40.0 60.0 80.0 100.0
Ministries
State Corporations
Total
Low Medium High
19
(iv) There was a low uptake of the civil service education funding scheme administered by the Higher Education Loans Board. Many staff who missed on training sponsorship from their Public institutions have given the scheme a wide consideration.
(v) Some employees especially lower cadre staff complained of exclusion in access to training opportunities and felt that their training needs were not fully addressed.
1.5.6.4 Recommendations The findings for this thematic area based on four indicators revealed that the public institutions’ performance averaged 58.6 percent. This finding means that the performance was below average as 41.4% of the public institutions did not meet the standards set in the evaluation. It is recommended that:
(i) Public institutions conduct diversity audits of their establishments within the first six months of 2017. The findings indicate that 52.8 percent of the MDAs are yet to conduct diversity audits.
(ii) Public institutions comply with the 30 percent allocation of procurement opportunities to disadvantaged groups. The findings indicate that 39 percent of public institutions failed to comply with the threshold.
(iii) Public institutions institutionalize time bound affirmative action programmes for appointments, training and promotions for the disadvantaged groups in the public service. The findings indicate that a few communities continue to account for disproportionately large shares of appointments, training and promotions.
(iv) Government review the criteria for the determination of the disadvantaged groups for the award of the reserved 30 percent of government tenders.
1.5.7 Accountability for Administrative Acts Integrity, transparency and accountability are some of the values and principles that are fundamental for public sector governance, upon which the public expect and demand services and accountability. The public service should be accountable to the citizenry in the execution of duties bestowed upon its institutions and individuals managing them. 1.5.7.1 Measures Taken The provisions of the Constitution of Kenya (2010) focus strongly on transparent and accountable government, with compliance with Chapter 6 and Articles 10 and 232 of the document being pre-conditions for accession to various key public offices. Kenya has a long history of institutions designed to ensure public service accountability, whose importance the Constitution and the policy legal and institutional reforms consequent upon it merely underscored. Vision 2030 and its Medium Term Plans and the related Medium Term Expenditure Frameworks and Sector Working Groups are designed to ensure transparency and accountability in planning, budgeting and implementation. In relation to the foregoing, the Public Finance Management Act regulates spending which the Public Audit Act scrutinizes annually for the entire public sector. The Parliamentary Public Accounts Committee and Public Investments Committee review the public audits and make appropriate recommendations to public institutions, including surcharging public officers for fiscal improprieties. Public service delivery involves extensive procurement outlays, which are managed under the Public Procurement and Asset Disposal Act (2015) whose framework provides for an appeals board to review procurement legitimacy. Most MDA officers also sign performance contracts which guide their service delivery conduct. Consequently, MDA boards and staff are appraised as pertinent.
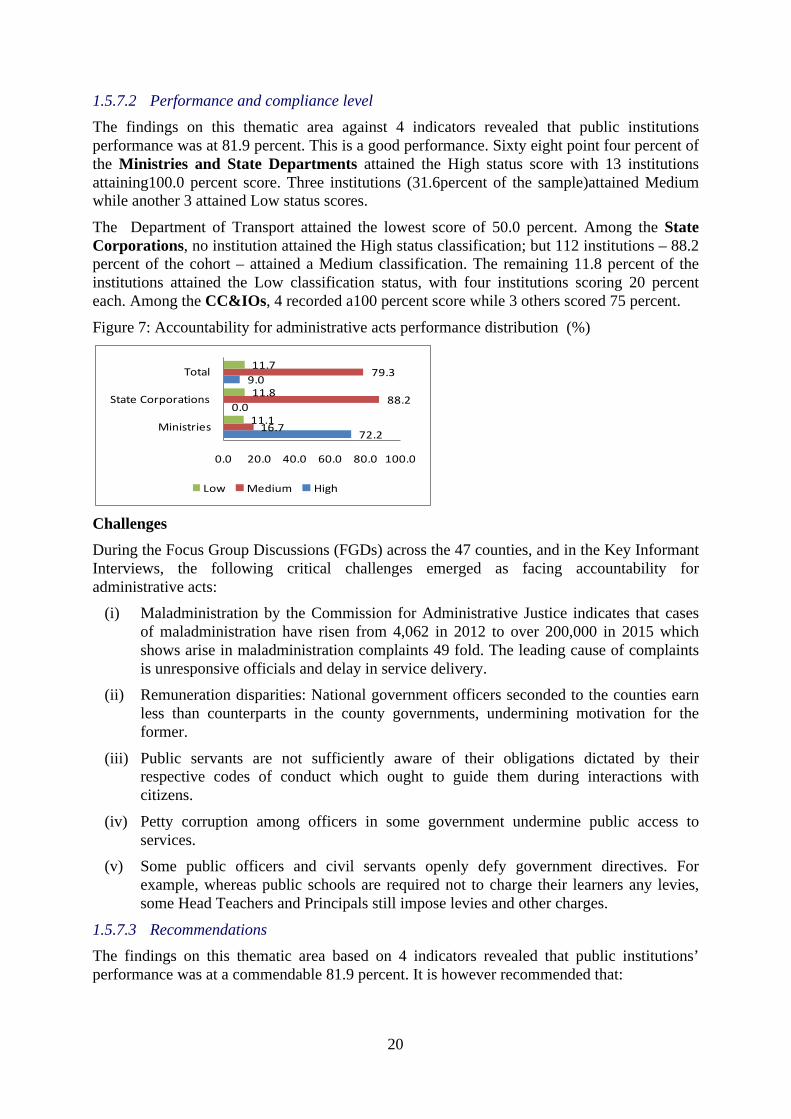
20
1.5.7.2 Performance and compliance level The findings on this thematic area against 4 indicators revealed that public institutions performance was at 81.9 percent. This is a good performance. Sixty eight point four percent of the Ministries and State Departments attained the High status score with 13 institutions attaining100.0 percent score. Three institutions (31.6percent of the sample)attained Medium while another 3 attained Low status scores. The Department of Transport attained the lowest score of 50.0 percent. Among the State Corporations, no institution attained the High status classification; but 112 institutions – 88.2 percent of the cohort – attained a Medium classification. The remaining 11.8 percent of the institutions attained the Low classification status, with four institutions scoring 20 percent each. Among the CC&IOs, 4 recorded a100 percent score while 3 others scored 75 percent. Figure 7: Accountability for administrative acts performance distribution (%)
Challenges During the Focus Group Discussions (FGDs) across the 47 counties, and in the Key Informant Interviews, the following critical challenges emerged as facing accountability for administrative acts:
(i) Maladministration by the Commission for Administrative Justice indicates that cases of maladministration have risen from 4,062 in 2012 to over 200,000 in 2015 which shows arise in maladministration complaints 49 fold. The leading cause of complaints is unresponsive officials and delay in service delivery.
(ii) Remuneration disparities: National government officers seconded to the counties earn less than counterparts in the county governments, undermining motivation for the former.
(iii) Public servants are not sufficiently aware of their obligations dictated by their respective codes of conduct which ought to guide them during interactions with citizens.
(iv) Petty corruption among officers in some government undermine public access to services.
(v) Some public officers and civil servants openly defy government directives. For example, whereas public schools are required not to charge their learners any levies, some Head Teachers and Principals still impose levies and other charges.
1.5.7.3 Recommendations The findings on this thematic area based on 4 indicators revealed that public institutions’ performance was at a commendable 81.9 percent. It is however recommended that:
72.2
0.0
9.0
16.7
88.2
79.3
11.1
11.8
11.7
0.0 20.0 40.0 60.0 80.0 100.0
Ministries
State Corporations
Total
Low Medium High

21
(i) Public institutions review their client service charters and grievance handling procedures in view of the malpractice reports received by the Commission for Administrative Justice, which have risen by 4,800 percent in four years, from 4,062 in 2012 to over 200,000 in 2015. The leading complaints are unresponsive officials and delays in service delivery.
(ii) Government develops regulations to give effect to the Fair Administrative Action Act 2015 and the Public Service (Values and Principles) Act 2015.
1.5.8 Improvements in Service Delivery Improvement of public service delivery was identified as one of the strategic components for driving the transformation of the country’s political governance system under Vision 2030. The Vision envisages equitable economic development that is driven by responsive, prompt, equitable, improved and efficient public service delivery. The Constitution of Kenya further reinforces the right of citizens to expeditious, efficient and fair public service and emphasizes the right to public information on service delivery. 1.5.8.1 Measures taken Performance Contracting is a key reform that has driven improvement of service delivery in Kenya. The country implemented the 12th cycle of performance contracting in 2015/16. Some of the components of service delivery in performance contracting guidelines were: (i) customer satisfaction; (ii) service delivery innovations; (iii) application/implementation of ICT; (iv) resolution of public complaints; (v) institutionalization of quality management system; and (vi) automation of public services such as through Huduma centers. According the 12th cycle performance contracting guidelines service delivery encompasses business process re-engineering that refers to new ways of transforming and improving service delivery in enhancing efficiency, timeliness, quality, flexibility and convenience. For effective service delivery, agencies are required to have defined linkage between their service charter and the performance contracts linked to their Key Result Areas (KRA’s). To support this, quality management systems such as ISO and institutionalization of standard operating procedures (SOPs) are aimed at benchmarking public service practices to international standards, and provide mechanisms for continued improvement in service delivery. Another critical measure of service delivery was the automation of public services through electronic (e-citizen platform) services, business, employees and government; enhancing e-procurement services thus encouraging Public institutions to embrace ICT resources in service delivery. Automation increases efficiency of service delivery by reducing turnaround time and costs of operations. During the review period, the automation of public service initiatives gained momentum in Kenya with services such as tax returns, renewal of driving license and application of university student loans being offered online. Huduma centers were also rolled to a number of counties across the country. Huduma centers Kenya is an example of programmes that have successfully transformed public service delivery by providing citizen’s access to various public services and information from one-stop shop citizen service centers with integrated technology platforms. 1.5.8.2 Performance and compliance The findings on this thematic area against 11 indicators revealed that public institutions performance was at 69 percent. This is an average performance. Whereas 5 of the indicators performed well above 70 percent the remaining 6 indicators (55%) performed below average. Further, the findings indicate that customer satisfaction levels for public institutions stood at

22
71 percent. A citizen satisfaction baseline survey conducted in 1500 households across 47 counties indicated that citizen service satisfaction levels stood at 42.6 percent, a variance of 28 percent. This means that a self-assessment by public institutions gives exaggerated performance levels not in consonance with the service recipients. It is recommended that: Among the Ministries and State Departments, only three institutions – State Departments of Energy and Petroleum, Basic Education, and University Education – attained the High classification status with scores of 95.0 percent each. The scores for the 12 Medium attainment institutions – 78.6 percent of the sample of 17 –ranged between 60.0 percent and 80.0 percent. The two Low attainment institutions included State Department of Transport and Petroleum (25% score) and Directorate of Immigration and Registration of Persons (20%). For State Corporations, 99 institutions – 76.7 percent of the sample of 129 – attained a Medium classification, with 14 others attaining a High classification, with seven perfect 100 percent scores. The 18 Low achievers’ scores ranged from Nairobi Centre for International Arbitrations’ 15.0 percent to a 50.0 percent for seven institutions. The CC&IOs scores ranged from 25 percent for the Salaries and Remuneration Commission to the Energy Regulatory Commission’s 95 percent. Figure 8: Improved service delivery performance distribution (%)
1.5.8.3 Public Perceptions on Service Delivery The foregoing analysis was either MDA self-assessments or assessments based on objective data, such as the human resource returns. The 2015/16 report established the service provider assessments at 68.1 percent, compared to the citizen satisfaction index which stood at 42.6 percent as shown in Figure 2. The satisfaction index incorporates citizen perceptions on availability and quality of basic services such as health, education, security, water and sanitation and quality of administration of justice, among others. Overall, the responsiveness of services received attained the highest approval rating of 79.7 percent. This can be attributed to improved service delivery through the Huduma centres. The lowest approval rating was on the quality of administration of justice with a score of 20 percent.
17.6
10.9
11.6
70.6
75.2
74.7
11.8
14.0
13.7
0.0 20.0 40.0 60.0 80.0
Ministries
Parastatals
Total
Low Medium High

23
Figure 9: Public Perceptions on Service Delivery
An assessment on the prevalent challenges within respondents’ respective communities is presented in Figure 10. Among the emerging development challenges, youth unemployment dominated the ‘severe problem’ category with a score of 75 percent, followed by income inequality (54%); and poverty and food insecurity (53%). On the other hand, ethnic tensions and hostilities were not a major problem. Figure 10: Major challenges, 2016 (%)
20.026.5
32.833.034.836.436.8
43.746.0
78.979.7
42.6
0.0 10.0 20.0 30.0 40.0 50.0 60.0 70.0 80.0 90.0
Quality of administration of justiceRating of efficiency of mode used
Quality of water and sanitationQuality of transport services
SecurityAvailability of clean sanitary facilities
Quality of public health careRating of efficiency of public services received
Quality of public educationAvailability of emergency facilities
Responsiveness of services received …Citizen satisfaction index
Good and very good (%)
33 21
39 32 45
50 41
46 44
39 35
37 38
41 41 43
36
14 4 6
26 21
28 15
29 40
23 53 44
31 40 42 42
18
0 20 40 60 80 100 120
Poverty and food insecurity Youth unemployment
Income inequality Lack of access to clean and safe water
Poor health services Irrelevant EducaKon
High cost of educaKon Crime/weak enforcement of law and order
Social issues (family /clan differences) Poor transport infrustructure Ethnic tensions and hosKliKes
NepoKsm/Tribalism Environmental challenges and drought
ExKncKon on indigneious culture ExKncKon of ethnic idenKty
Lack of trust in the community Alcoholism and drug abuse
Severe problem Moderate problem Not a problem

24
1.5.8.4 Challenges Key challenges affecting effective service delivery include: (i) Weak monitoring and evaluation leading to unsatisfactory service delivery (ii) Some Public institutions have no websites (iii) Availability of Braille and sign language is limited in most institutions.
1.5.8.5 Recommendations The findings on this thematic area based on 11 indicators revealed that the public institution performance was at 69 percent, an average outcome. Whereas five of the indicators scored above 70 percent, the remaining six indicators averaged below 55 percent. It is recommended that: A. Public institution Service Delivery (i) Public institutions mainstream systems and structures for accommodation of PWDs in
their service delivery processes, including the use of Kenyan sign languages. The performance on this indicates that 61.8 percent of public institutions had customized their business processes for use by PWDs.;
(ii) Public institutions automate their business processes for ease of access and use by citizens. The findings indicate that 75.0 percent of public institutions are yet to attain the required minimum automation level of at least 60 percent.
B. Citizen perception on service delivery The findings indicate that customer satisfaction levels for public institution service delivery stood at 71 percent. A citizen satisfaction baseline survey conducted in 1,393 households across 47 counties indicated that satisfaction levels stood at 42.6 percent, a variance of 28 percent. This means that a self-assessment by public institutions gives satisfactory performance levels not in consonance with perceptions of service recipients. It is recommended that:
(i) Public institutions undertake periodic customer satisfaction surveys while an annual citizen satisfaction survey is conducted by an oversight body, such as the Commission.
(ii) A citizen service charter prescribe minimum service delivery standards, which can be used to understand citizen service delivery satisfaction levels. These will set the annual citizens service satisfaction index which can be assessed and improved annually.
(iii) Improvements to the citizen service satisfaction index form part of the performance contract targets for public institutions.
1.5.9 Performance Management Performance management is the process of improving an organization, team and individual results by working within a set framework of planned goals, objectives and standards. It therefore provides a platform for optimizing performance of public organizations. Public agencies are therefore able to monitor, evaluate and reward performance of both the employees and the organizations.

25
1.5.9.1 Measures taken There are various reform strategies that the Government has adopted since 2003 in order to improve performance and hence service delivery in the public sector. These strategies include; Rapid Results Initiatives (RRI), Performance Contracting, Citizen Score Card, Transformative Leadership, Values and Ethics, Institutional Capacity Building among others. Various other public service reforms initiated have aimed at improving citizen satisfaction at the heart of policy making and service delivery. Improving public service delivery can also be traced as far as the Economic Recovery Strategy (ERS) where the link between planning, budgeting and implementation was strengthened; improvement on performance management as well as strategic management were emphasized. Further, the Kenya Vision 2030 realizes that an efficient, motivated and well trained public service is one of the major foundations pillar. Above all the government has also promoted attitude change in public service, service delivery orientation, skills inventory assessments, rewards, performance management, computerization of service delivery as well as training and development. 1.5.9.2 Performance and compliance level The findings on this thematic area against 7 indicators revealed that Public institutions performance was at 78.6 percent. Of the 7 indicators, performance on 2 indicators was below average. Under Performance Management, only the State Department for Sports Development among the 19 Ministries and State Departments attained a High score of 100.0 percent. The scores for the 15 Medium achievers ranged from 96.4 percent for three institutions, to 64.3 percent for two institutions. The three Low achievers were the State Department for Arts and Culture (28.6%), Kenya Meteorological department (39.3%), and the Presidency (46.4%). Among the 129 State Corporations, 14 institutions (10.9%) managed the High status with five of them getting the 100.0 percent score, while 23 institutions (17.8%) acquired the Low attainment status with scores ranging from 25 percent for Tourism Regulatory Authority to 53.6 percent formational Construction Authority. The remaining 92 institutions (71.3%) attained a Medium achievement status. Among the CC&IOs, Energy Regulatory Commission led with a score of 96.4 percent while National Lands Commission attained a medium compliance level of 67.9 percent. Figure 9: Performance management distribution (%)
1.5.9.3 Challenges During focused group discussions (FGDs) in all counties the following emerged as some of the challenges that impede performance management (i) Training offered by PSC is not consistent and leaves out most deserving cases
5.0
10.9
10.1
75.0
71.3
71.8
20.0
17.8
18.1
0.0 20.0 40.0 60.0 80.0
Ministries
State Corporations
Total
Low Medium High

26
(ii) Inadequate funding for all training programs offered by PSC so that all staff benefit from the training
(iii) Lack of a clear framework for rewarding national government employees (iv) Some government offices outside major towns are not connected to ICT and hence
cannot offer government services online (v) The findings indicate that the cascading of performance contracts was not done for
31.5 percent of the Public institutions surveyed. Some Public institutions like Anti-counterfeit Authority, Cabinet Office, Child Welfare Society of Kenya, Export Promotion Council, Intellectual Property Tribunal, Kenyatta International Conference Centre (KICC) and Kenya Leather Development Council have not cascaded their performance contract
(vi) Lack of quality certification standards. Findings indicate that 47 percent of Public institutions did not have valid ISO certifications.
1.5.9.4 Recommendations The findings on this thematic area based on 7 indicators revealed that public institution performance was at 78.6 percent; but two indicator scores were below average. It is recommended that:
(i) Government strengthen the performance management system for more effective and efficient service delivery, and to enhance accountability for results. The findings indicate that the cascading of performance contracts had not been done for 31.5 percent of the public institutions surveyed.
(ii) Public institutions adopt and utilize quality management systems in their business processes. Findings indicate that 38.2 percent of them presently do not have valid ISO certification.
1.5.10 Public Participation in Policy Making Public participation entails facilitation of citizens in decision making and implementation of public programmes and projects. The principle of public participation holds that those who are affected by a decision have a right to be involved in planning, decision making and its implementation process; and that public participation is effective if citizens are involved in the various levels of decision making; and if their contributions influence a decision and or if public concerns, needs and values are incorporated into a government decision making process. 1.5.10.1 Measures taken During the survey, it was established that counties had put in place a number of systems to promote effective public participation. These include: (i) Establishment of decentralized structures to sub-county and ward levels; and
appointment of ward and sub-county administrators. This mechanism has enabled citizens to attend public forums on preparation and implementation of various development projects.
(ii) Organization and mobilization of citizens to attend budget meetings at ward level. (iii) Giving opportunities to the public to scrutinize and validate county and national
budgets through annual county and national budget sector hearings.

27
(iv) Enhancing principle of social accountability by holding both the national government and county government to account for public resources and ensure efficiency in utilization and service delivery.
(v) Some counties have institutionalized ICT mechanisms such as toll free numbers seeking public opinion on issues under discussion at any point in time.
(vi) Conducting public barazas; (vii) Use of notice boards to communicate important issues of public interest.
1.5.10.2 Performance and compliance level Of the 17 Ministries and State Departments, 3 (17.6% of the sample) attained a Low compliance status, including State Departments of Environment, Planning and Statistics, and Transport – each with a score 25.0 percent. Five institutions (29.4%) attained the Medium status, while 9 institutions (52.9%) had a High status, all of them scoring 100.0 percent. Among the 130 State Corporations, 56 institutions (43.1percent) of the sample attained the High status, all scoring 50.0percent. The 47 Medium status institutions all scored 25.0 percent while the Low attainment institutions scored less than 25.0 percent. For the CC&IOs, all scored 100 percent except the Office of The Controller of Budget which scored75 percent. Figure 10: Public participation performance distribution (%)
1.5.10.3 Challenges Although most counties and public institutions have made progress in implementation of public participation principle, there are some gaps and challenges in the process: (i) Public institutions and Counties have not fully implemented public participation
guidelines due to weak institutionalization of appropriate legislative, institutional and structural frameworks.
(ii) Inadequate information dissemination on public participation framework and guidelines. Citizens are not informed about different roles of county and national governments; their rights and civic duties. There is also low levels of understanding of human rights especially among rural, marginalized and minority communities;
(iii) Civic education has had limited impact due to failure of the public to attend public meetings whenever they are organized. This was attributed to citizen apathy and lack of facilitation such as through provision of transport.
(iv) The findings on this thematic area against 4 indicators revealed that Public institutions performance was at 76.6 percent. Although this performance is good, the performance in 3 of the 4 indicators was below average. Findings indicate that 39 percent of Public institutions have not developed policy guidelines for public participation.
52.9
43.1
44.2
29.4
36.2
35.4
17.6
20.8
20.4
0.0 10.0 20.0 30.0 40.0 50.0 60.0
Ministries
State Corporations
Total
Low Medium High

28
1.5.10.4 Recommendation The findings on this thematic area based on 4 indicators revealed that public institution performance was a commendable 76.6 percent; but the scores for 3 of the 4 indicators were below average. Findings indicate that 39 percent of public institutions have not developed policy guidelines for public participation. It is recommended that: i) Government institutionalize the policy guidelines on public participation issued by the
Commission in 2014. Data Management and monitoring The evaluation established that there are gaps in the monitoring and evaluation of national and public service values and principles. It is recommended that: Government to establish an inter-agency forum for monitoring the implementation of values and principles in the public service. Conclusion The compliance evaluation reports shows areas where greater effort is required by various Public institutions to enable full integration of the values and principles for improved service delivery. One of the outcomes of this study was the computation of Public institutions specific compliance index, overall compliance index and citizen satisfaction index. In conclusion, an additional departure of the 2015/16 report from its predecessors is a detailed matrix on the time-bound management of public institution-specific recommendations arising from the study; and proposed interventions by the Presidency and Parliament. Further, specific Public institutions can use the contents in the implementation matrix presented in this report to inform their respective work plans toward promotion and compliance with the values and principles of public service. Table 3 presents a summary of recommendations, activities, indicators, responsible institutions and timeframe for identified areas of action. Table 3: Implementation matrix Recommendation Activities Indicators Responsibility Timeframe Ensuring high standards of professional ethics in public service
Budgetary provisions for the continuous sensitization of public officers on ethics and integrity.
Allocation of adequate budget for sensitization of public officers on ethics and integrity.
Proportion of training expenditure allocated to sensitization of public officers on ethics and integrity.
All Public institutions Annual
Mainstream continuous training on ethics and integrity at induction and other in-service programmes for public officers.
training of public officers on ethics and integrity
No of public officers trained on ethics and integrity
All Public institutions, Kenya School of Government, DPSM, PSC
By June 2017
Assessment on ethics and integrity of public officials at entry and advancement
Incorporate integrity checks in PAS
% of PAS with integrity checks included
All Public institutions By June 2017
Incorporate ethics and integrity in Staff performance appraisal tool
Review SPAS instruments Reviewed SPAS form PSC By June 2017
Vetting and lifestyle audit be made a compulsory requirement for public officers
Develop and implement vetting and lifestyle audit regulations and guidelines
Number of vetting and lifestyle audits undertaken
All Public institutions OAG&DOJ PSC CC&IOs
Bi- annual
To maintain updated register for all employees on their membership with respective professional bodies
Establish and update registers membership to professional bodies for all employees
Updated register /inventory
All Public institutions Immediate
Strengthening devolution and sharing of power
Fast track the audit of assets, incomes, and liabilities of devolved entities.
Audit of assets and liabilities
Updated assets and liability inventory for each county
All county governments IGRTC, MoDP
June 2017

29
Recommendation Activities Indicators Responsibility Timeframe Fast track the establishment of county public services for pensionable purposes.
Establish pension schemes for county public services
No of counties with pension schemes
All county governments IGRTC, MoDP
June 2017
Fast track the establishment of norms and standards for the management of national and county public services
Develop norms and standards framework
Norms and standards framework
PSC CPSBs All Public institutions
June 2017
All institutions discharging national functions to decentralize their services to the extent practicable
Develop decentralization strategy
Decentralization strategy
All National Government entities
June 2017
Good Governance, Transparency and Accountability
Fast tracks the documentation of business processes, the automation of the processes and migrate the services to e-platforms.
Migrate to e-platforms % of Public institutions with services on e-platform
All Public institutions ICT authority
June 2017
Establishment of more Huduma Centres in the 47 counties and sub-counties.
Establish huduma centers in the remaining counties
Number of counties with huduma centres
MoDP June 2017
Public institutions to establish their service points to the extent practicable in Huduma Centres
Establish service points Number of Public institutions that have established service points
All Public institutions June 2017
Government to institutionalize the fight against corruption
Implement the recommendations of the task force report on the legislative, policy and institutional reforms in the fight against corruption.
% of recommendations of the task force report implemented
Identified institutions June 2017
The Government to institutionalize service delivery standards
Develop Citizen’s Service delivery Charter
Prescribed minimum service delivery standards
PSC, All Public institutions, PSDU
June 2017
All the Public institutions that do not implement PAC and PIC recommendations be sanctioned
Prescribe sanctions Number of Public institutions sanctioned
Executive, Parliament, Judiciary
2017
Diversity management Public institutions to develop time bound affirmative action programmes to bring on board PWDs, marginalized groups, minorities, women and youth progressively as required by law.
Fast track the implementation of the Diversity Policy for the public service
Proportion of PWDs, marginalized groups, minorities, women and youth in public service
PSC, All Public institutions, CC&IOs
June 2017
Public institutions to institutionalize time bound affirmative action programmes to bring on board women in the service to bridge the 25% gap on representation.
Develop appropriate affirmative action programmes
Proportion of women in public service
PSC, All Public institutions, CC&IOs
June 2017
Public institutions to institutionalize time bound affirmative action programmes to bring on board more youths into the service to meet the 29% proportionate representation.
Develop appropriate affirmative action programmes
Proportion of youth in public service
PSC, All Public institutions, CC&IOs
June 2017
Public institutions to institutionalize time bound affirmative action programmes to enhance proportionate representation of the 19 under-represented communities in the Public institutions survey.
Develop appropriate affirmative action programmes
Proportion of underrepresented communities in public service
PSC, All Public institutions, CC&IOs
June 2017
Public institutions to maintain disaggregated and updated records on gender, ethnicity - including minority and marginalized communities, PWDs and age.
Establish and update disaggregated data Submit reports to relevant
Data inventories All Public institutions June 2017
Fast track implementation of the projects under equalization fund to facilitate affirmative action initiatives.
Prioritize implementation of the projects under equalization fund
% completion of the projects under the equalization fund
County Governments CRA National Treasury
Economic use of resources and sustainable development
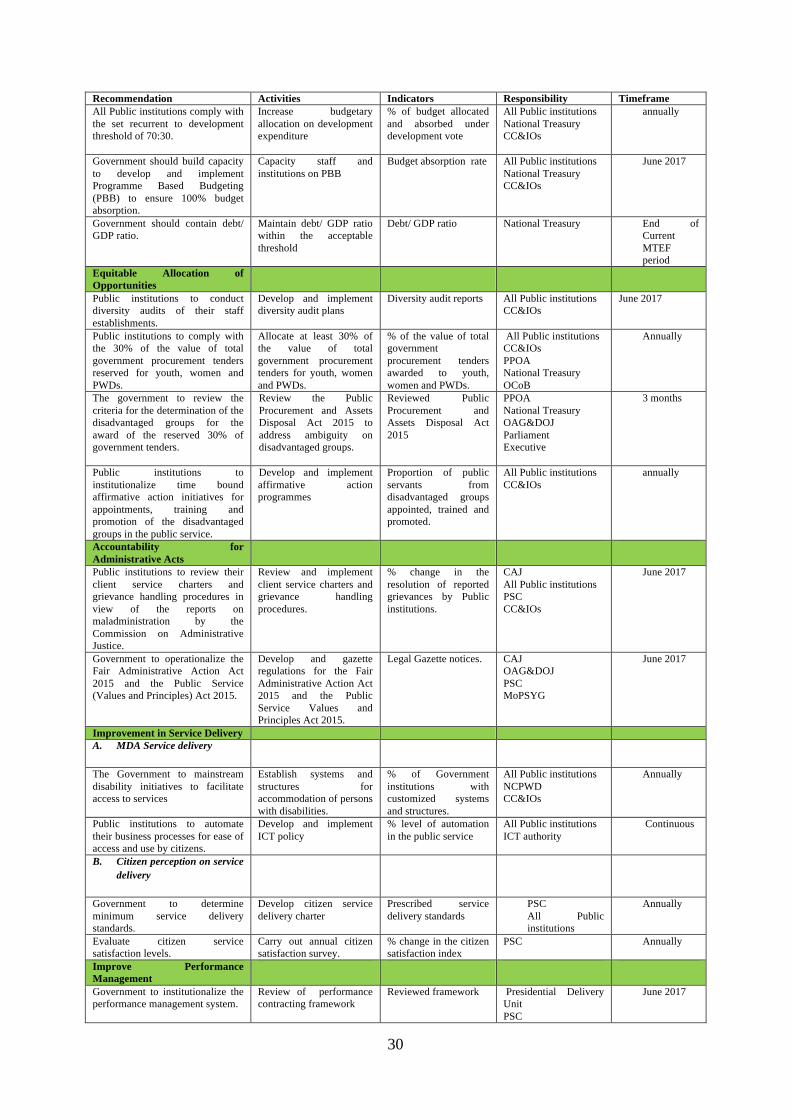
30
Recommendation Activities Indicators Responsibility Timeframe All Public institutions comply with the set recurrent to development threshold of 70:30.
Increase budgetary allocation on development expenditure
% of budget allocated and absorbed under development vote
All Public institutions National Treasury CC&IOs
annually
Government should build capacity to develop and implement Programme Based Budgeting (PBB) to ensure 100% budget absorption.
Capacity staff and institutions on PBB
Budget absorption rate All Public institutions National Treasury CC&IOs
June 2017
Government should contain debt/ GDP ratio.
Maintain debt/ GDP ratio within the acceptable threshold
Debt/ GDP ratio National Treasury
End of Current MTEF period
Equitable Allocation of Opportunities
Public institutions to conduct diversity audits of their staff establishments.
Develop and implement diversity audit plans
Diversity audit reports All Public institutions CC&IOs
June 2017
Public institutions to comply with the 30% of the value of total government procurement tenders reserved for youth, women and PWDs.
Allocate at least 30% of the value of total government procurement tenders for youth, women and PWDs.
% of the value of total government procurement tenders awarded to youth, women and PWDs.
All Public institutions CC&IOs PPOA National Treasury OCoB
Annually
The government to review the criteria for the determination of the disadvantaged groups for the award of the reserved 30% of government tenders.
Review the Public Procurement and Assets Disposal Act 2015 to address ambiguity on disadvantaged groups.
Reviewed Public Procurement and Assets Disposal Act 2015
PPOA National Treasury OAG&DOJ Parliament Executive
3 months
Public institutions to institutionalize time bound affirmative action initiatives for appointments, training and promotion of the disadvantaged groups in the public service.
Develop and implement affirmative action programmes
Proportion of public servants from disadvantaged groups appointed, trained and promoted.
All Public institutions CC&IOs
annually
Accountability for Administrative Acts
Public institutions to review their client service charters and grievance handling procedures in view of the reports on maladministration by the Commission on Administrative Justice.
Review and implement client service charters and grievance handling procedures.
% change in the resolution of reported grievances by Public institutions.
CAJ All Public institutions PSC CC&IOs
June 2017
Government to operationalize the Fair Administrative Action Act 2015 and the Public Service (Values and Principles) Act 2015.
Develop and gazette regulations for the Fair Administrative Action Act 2015 and the Public Service Values and Principles Act 2015.
Legal Gazette notices. CAJ OAG&DOJ PSC MoPSYG
June 2017
Improvement in Service Delivery A. MDA Service delivery
The Government to mainstream disability initiatives to facilitate access to services
Establish systems and structures for accommodation of persons with disabilities.
% of Government institutions with customized systems and structures.
All Public institutions NCPWD CC&IOs
Annually
Public institutions to automate their business processes for ease of access and use by citizens.
Develop and implement ICT policy
% level of automation in the public service
All Public institutions ICT authority
Continuous
B. Citizen perception on service delivery
Government to determine minimum service delivery standards.
Develop citizen service delivery charter
Prescribed service delivery standards
PSC All Public institutions
Annually
Evaluate citizen service satisfaction levels.
Carry out annual citizen satisfaction survey.
% change in the citizen satisfaction index
PSC Annually
Improve Performance Management
Government to institutionalize the performance management system.
Review of performance contracting framework
Reviewed framework Presidential Delivery Unit PSC
June 2017

31
Recommendation Activities Indicators Responsibility Timeframe All Public institutions CC&IOs
Government to adopt and deploy quality management framework in service delivery.
Implement quality management systems.
% of Public institutions certified
All Public institutions CC&IOs
June 2019
Public Participation in Policy Making
Government to institutionalize public participation in policy making.
Public institutions to customize policy guidelines on public participation issued by PSC.
Number of public participation initiatives undertaken % of Public institutions who have undertaken public participation initiatives
All Public institutions CC&IOs
June 2017
Data management and monitoring
Government to establish an inter-agency forum for monitoring the implementation of values and principles in the public service.
Develop a national framework for monitoring and evaluating national and public service values and principles.
National framework for the monitoring of national and public service values and principles.
PSC CC&IOs MoDP MoPSYG Council of Governors
Annually