evaluation research feb. 2, 2004 up504 prof. campbell piet mondrian counterfactual control...
TRANSCRIPT

Evaluation Research
Feb. 2, 2004
UP504
Prof. Campbell
Piet Mondrian
counterfactual
Control groupExperimental group
“but for …”
Random assignment
rival explanation
Program theoryUn
inte
nd
ed c
onse
qu
ence
s (s
ide
-eff
ects
)
Placebo effect
Regression

Housing Project
Vacancy Rate
1 33%2 33%3 18%4 23%5 28%6 19%7 32%8 20%9 15%
10 32%11 19%12 19%13 25%14 29%15 17%16 25%17 5%18 28%19 19%20 26%21 15%22 8%23 11%24 30%25 14%26 27%27 21%28 13%29 21%30 31%
Passersby walk past the Bromley-Heath Housing Complex in the Jamica Plain district of Boston, Monday, Nov. 2, 1998. What began as a 1960's experiment in self-government ended this past weekend when management of Bromley-Heath Housing Complex, Boston's only tenant-run public housing, was seized by the city after a number of drug related arrests. (AP Photo/Steven Senne)
Example:A city has 30 low-income housing projects.
A large number of vacant units in these projects creates a wide variety of problems (reduced revenues, vandalism, lower morale of existing tenants, etc.)
There is a wide range of vacancy rates, from less than 10 percent to over 30 percent.
The city officials believe that drug trafficking in the housing projects is discouraging people from either moving into or staying in the projects.
http://accuweather.ap.org/cgi-bin/aplaunch.pl
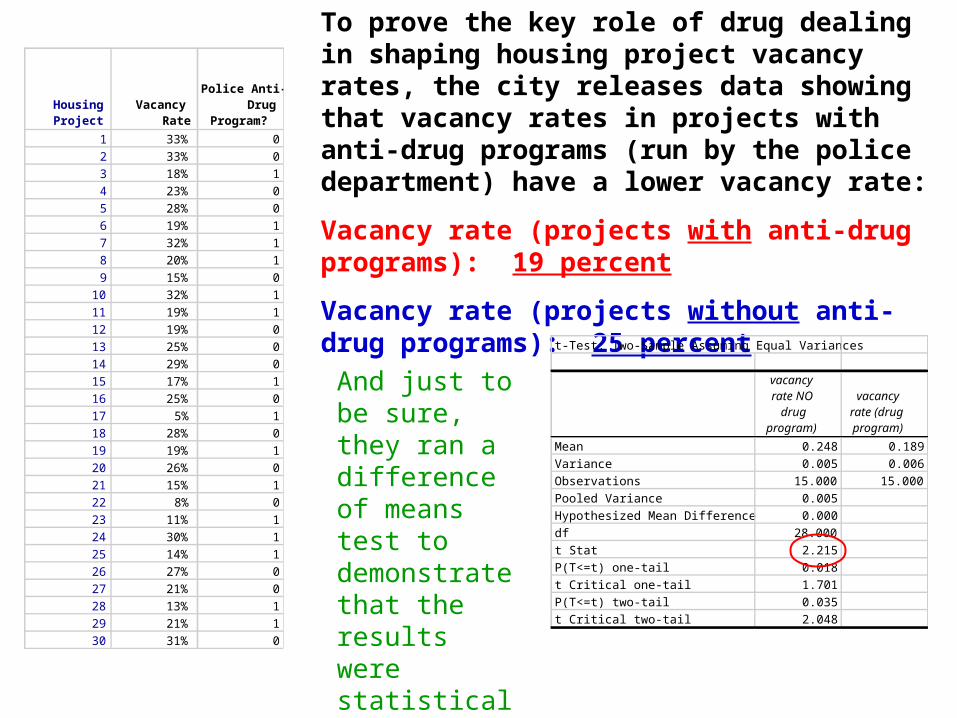
To prove the key role of drug dealing in shaping housing project vacancy rates, the city releases data showing that vacancy rates in projects with anti-drug programs (run by the police department) have a lower vacancy rate:
Vacancy rate (projects with anti-drug programs): 19 percent
Vacancy rate (projects without anti-drug programs): 25 percent
Housing Project
Vacancy Rate
1 33%2 33%3 18%4 23%5 28%6 19%7 32%8 20%9 15%
10 32%11 19%12 19%13 25%14 29%15 17%16 25%17 5%18 28%19 19%20 26%21 15%22 8%23 11%24 30%25 14%26 27%27 21%28 13%29 21%30 31%
Police Anti-Drug
Program?
001001110110001010101011100110
t-Test: Two-Sample Assuming Equal Variances
vacancy rate NO
drug program)
vacancy rate (drug program)
Mean 0.248 0.189Variance 0.005 0.006Observations 15.000 15.000Pooled Variance 0.005Hypothesized Mean Difference 0.000df 28.000t Stat 2.215P(T<=t) one-tail 0.018t Critical one-tail 1.701P(T<=t) two-tail 0.035t Critical two-tail 2.048
And just to be sure, they ran a difference of means test to demonstrate that the results were statistically significant at the 0.05 level.
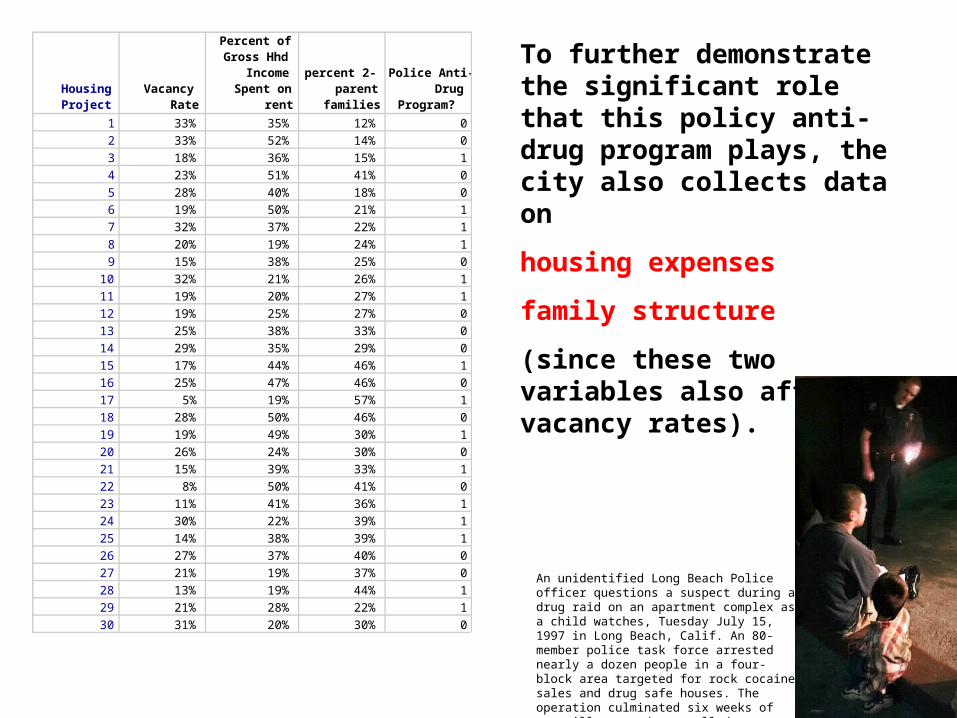
To further demonstrate the significant role that this policy anti-drug program plays, the city also collects data on
housing expenses
family structure
(since these two variables also affect vacancy rates).
Housing Project
Vacancy Rate
Percent of Gross Hhd
Income Spent on
rent
percent 2-parent
families
Police Anti-Drug
Program?
1 33% 35% 12% 02 33% 52% 14% 03 18% 36% 15% 14 23% 51% 41% 05 28% 40% 18% 06 19% 50% 21% 17 32% 37% 22% 18 20% 19% 24% 19 15% 38% 25% 0
10 32% 21% 26% 111 19% 20% 27% 112 19% 25% 27% 013 25% 38% 33% 014 29% 35% 29% 015 17% 44% 46% 116 25% 47% 46% 017 5% 19% 57% 118 28% 50% 46% 019 19% 49% 30% 120 26% 24% 30% 021 15% 39% 33% 122 8% 50% 41% 023 11% 41% 36% 124 30% 22% 39% 125 14% 38% 39% 126 27% 37% 40% 027 21% 19% 37% 028 13% 19% 44% 129 21% 28% 22% 130 31% 20% 30% 0
An unidentified Long Beach Police officer questions a suspect during a drug raid on an apartment complex as a child watches, Tuesday July 15, 1997 in Long Beach, Calif. An 80-member police task force arrested nearly a dozen people in a four-block area targeted for rock cocaine sales and drug safe houses. The operation culminated six weeks of surveillance and was called, "Operation Clean Streets."(AP Photo/MIchael Caulfieldhttp://accuweather.ap.org/cgi-bin/aplaunch.pl

The city then releases the results of their own in-house multiple regression analysis, controlling for these two variables.
SUMMARY OUTPUT
Regression StatisticsMultiple R 0.8067R Square 0.6508Adjusted R Square 0.6105Standard Error 0.0448Observations 30
ANOVA
df SS MS FSignificance F
Regression 3 0.0974 0.0325 16.1513 0.0000Residual 26 0.0523 0.0020Total 29 0.1496
Coefficients
Standard Error t Stat P-value
Intercept 0.4925 0.0443 11.1171 0.0000Percent of Gross Hhd Income Spent on rent -0.3746 0.0862 -4.3448 0.0002percent 2-parent families -0.3860 0.0776 -4.9768 0.0000Police Anti-Drug Program? -0.0593 0.0166 -3.5711 0.0014
Even controlling for the other two variables, the police anti-drug program is statistically significant, and seems to reduce the vacancy rate by 6 percentage points -- and then asks for more money for the program.

Housing Project
Vacancy Rate
Percent of Gross Hhd
Income Spent on
rent
percent 2-parent
families
Police Anti-Drug
Program?
Active Tenants
Group? (1 = yes; 0 =
no)
1 33% 35% 12% 0 02 33% 31% 14% 0 03 18% 25% 15% 1 14 23% 22% 41% 0 05 28% 34% 18% 0 06 19% 51% 21% 1 17 32% 42% 22% 1 08 20% 29% 24% 1 19 15% 33% 25% 0 1
10 32% 37% 26% 1 011 19% 46% 27% 1 112 19% 45% 27% 0 113 25% 31% 33% 0 014 29% 25% 29% 0 015 17% 18% 46% 1 116 25% 39% 46% 0 017 5% 23% 57% 1 118 28% 21% 46% 0 019 19% 29% 30% 1 120 26% 49% 30% 0 021 15% 27% 33% 1 122 8% 47% 41% 0 123 11% 21% 36% 1 124 30% 46% 39% 1 025 14% 51% 39% 1 126 27% 27% 40% 0 027 21% 40% 37% 0 128 13% 24% 44% 1 129 21% 18% 22% 1 130 31% 23% 30% 0 0
http://www.nhi.org/online/issues/95/phorg.html
NOT SO FAST, cries a tenants organization, which has been skeptical of the police anti-drug program’s effectiveness, and instead argues that the strong presence of organized tenants groups makes the difference in keeping vacancy rates lower.
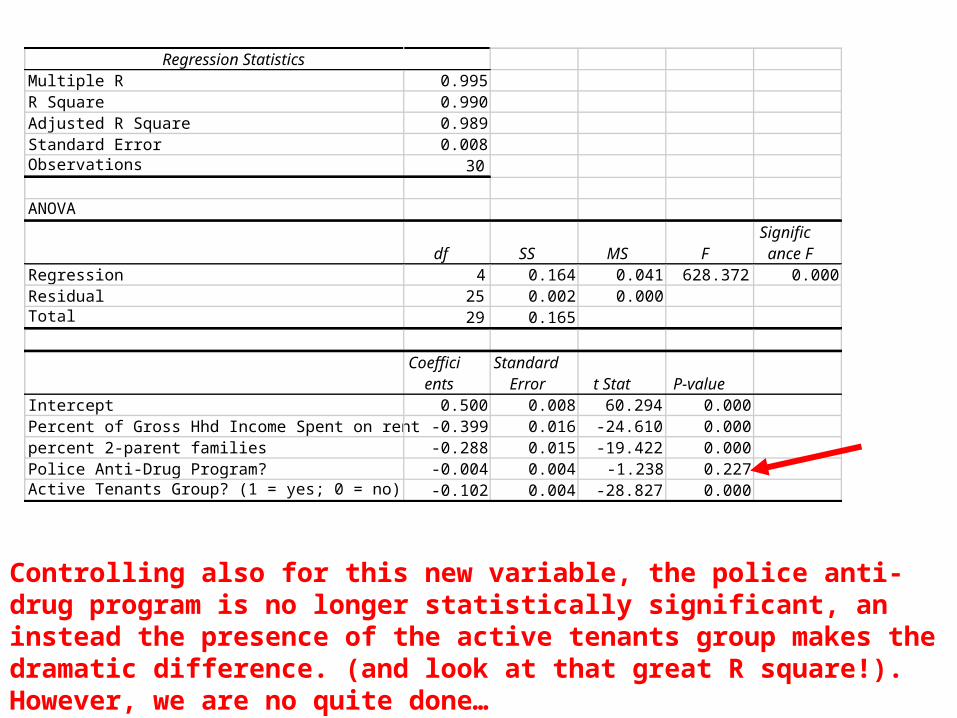
Controlling also for this new variable, the police anti-drug program is no longer statistically significant, an instead the presence of the active tenants group makes the dramatic difference. (and look at that great R square!). However, we are no quite done…
Regression StatisticsMultiple R 0.995R Square 0.990Adjusted R Square 0.989Standard Error 0.008Observations 30
ANOVA
df SS MS FSignificance F
Regression 4 0.164 0.041 628.372 0.000Residual 25 0.002 0.000Total 29 0.165
Coefficients
Standard Error t Stat P-value
Intercept 0.500 0.008 60.294 0.000Percent of Gross Hhd Income Spent on rent -0.399 0.016 -24.610 0.000percent 2-parent families -0.288 0.015 -19.422 0.000Police Anti-Drug Program? -0.004 0.004 -1.238 0.227Active Tenants Group? (1 = yes; 0 = no) -0.102 0.004 -28.827 0.000

Since the police variable now has a statistically insignificant t-score, we remove it from the model. (We also remove the income variable, since it also becomes insignificant after we remove the police variable.) We are left with two independent variables: percent of 2-parent families and active tenants group.
SUMMARY OUTPUT
Regression StatisticsMultiple R 0.928R Square 0.861Adjusted R Square 0.850Standard Error 0.030Observations 30
ANOVAdf SS MS F Significance F
Regression 2 0.149 0.074 83.484 0.000Residual 27 0.024 0.001Total 29 0.173
Coefficients
Standard Error t Stat P-value BETA
Intercept 0.36582 0.017 20.908 0.000percent 2-parent families -0.2565 0.051 -5.017 0.000 -0.362Active Tenants Group? (1 = yes; 0 = no) -0.1246 0.011 -11.347 0.000 -0.821
Write out the equation:Predicted vacancy rate = + 0.366 - 0.256 [percent 2-parent families]- 0.125 [active tenants group]
Example (50% 2-parent & active tenants group]:Predicted vacancy rate = + 0.366 - 0.256 [.50]- 0.125 [1] = .113 or 11.3 percent

Vacancy Rate
Percent of Gross Hhd
Income Spent on
rent
percent 2-parent
families
Active Tenants
Group? (1 = yes; 0 =
no)
Police Anti-Drug
Program?Vacancy Rate 1.00Percent of Gross Hhd Income Spent on rent 0.10 1.00percent 2-parent families -0.44 0.20 1.00Active Tenants Group? (1 = yes; 0 = no) -0.86 0.12 0.10 1.00Police Anti-Drug Program? -0.39 -0.08 0.03 0.53 1.00
Looking at a correlation matrix can help understand the interrelationships between variables.
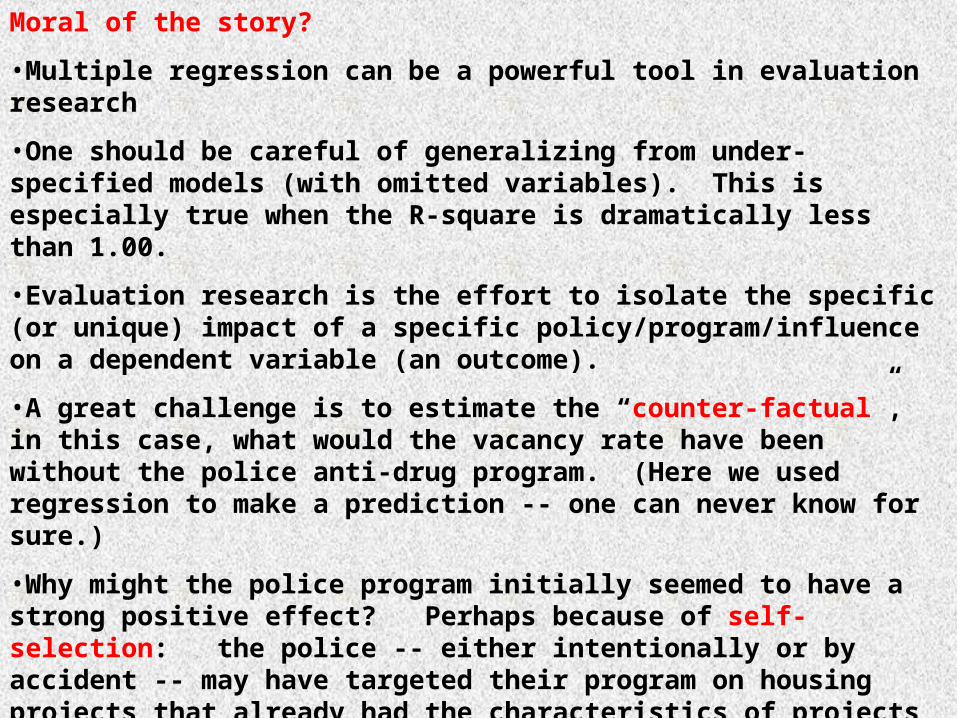
Moral of the story?
•Multiple regression can be a powerful tool in evaluation research
•One should be careful of generalizing from under-specified models (with omitted variables). This is especially true when the R-square is dramatically less than 1.00.
•Evaluation research is the effort to isolate the specific (or unique) impact of a specific policy/program/influence on a dependent variable (an outcome).
•A great challenge is to estimate the “counter-factual”, in this case, what would the vacancy rate have been without the police anti-drug program. (Here we used regression to make a prediction -- one can never know for sure.)
•Why might the police program initially seemed to have a strong positive effect? Perhaps because of self-selection: the police -- either intentionally or by accident -- may have targeted their program on housing projects that already had the characteristics of projects with lower vacancy rates.
•How do you get around this self-selection bias: use random assignment (a sometimes difficult but powerful approach in evaluation research).
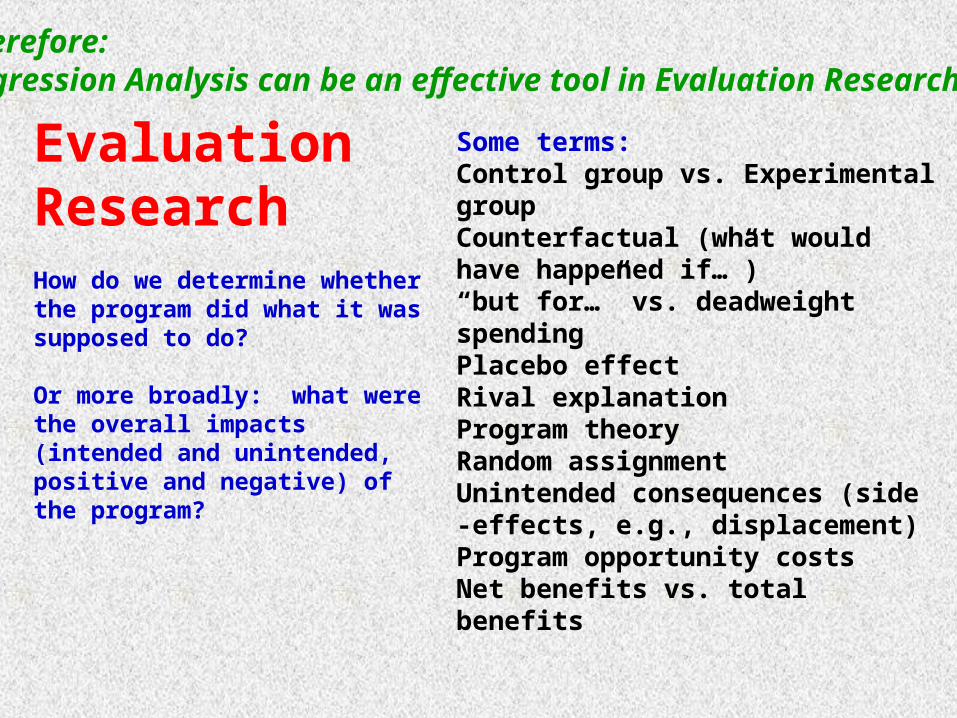
Evaluation Research How do we determine whether the program did what it was supposed to do?
Or more broadly: what were the overall impacts (intended and unintended, positive and negative) of the program?
Some terms:Control group vs. Experimental groupCounterfactual (what would have happened if…”)“but for…” vs. deadweight spendingPlacebo effectRival explanationProgram theoryRandom assignmentUnintended consequences (side -effects, e.g., displacement)Program opportunity costsNet benefits vs. total benefits
Therefore:Regression Analysis can be an effective tool in Evaluation Research
Why do evaluation?
To answer the basic question:
Did the program (plan, intervention, treatment) do what it was supposed to do?

Several basic questions of evaluation research
What is the program theory? (the causal logic implicit in the program, such as an enterprise zone will lower the cost of doing business in an area and thus attract a greater number of businesses -- or -- higher gas taxes will encourage greater transit ridership.)
•you do not have to believe in the theory.•a hypothesis: program x leads to outcome y, etc. •often set up to be rejected. (like a null hypothesis)•if the theory connects concept x and y, then one needs measures of both. (Example: if you hypothesize that greater entrepreneurship leads to greater innovation and thus more businesses with growth potential, you will need measures of all three concepts.)
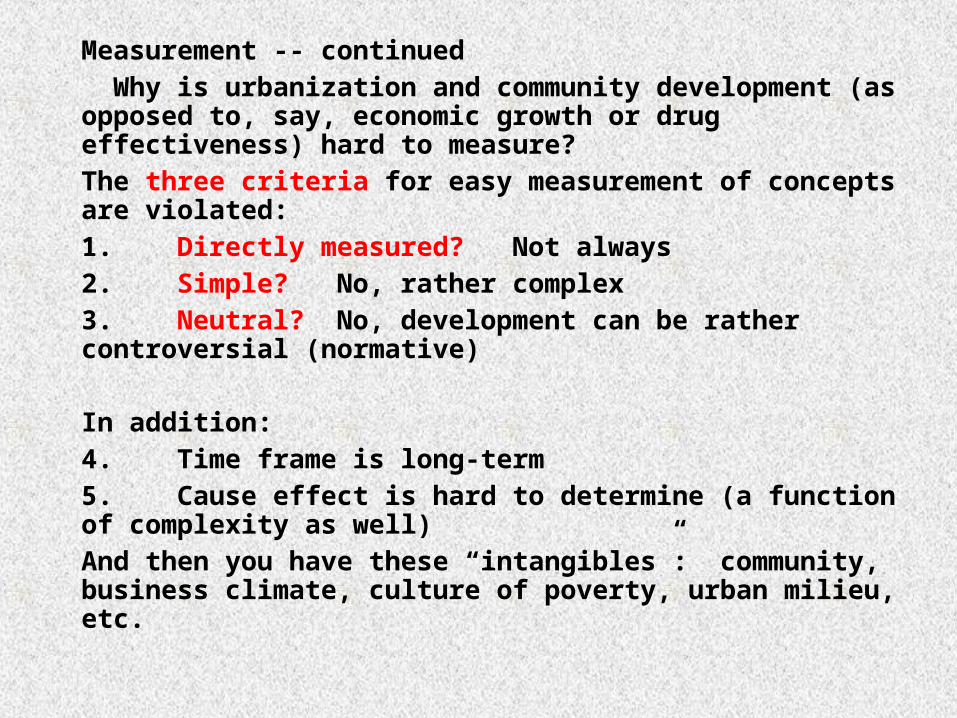
Measurement -- continued Why is urbanization and community development (as opposed to, say, economic growth or drug effectiveness) hard to measure?The three criteria for easy measurement of concepts are violated:1. Directly measured? Not always2. Simple? No, rather complex3. Neutral? No, development can be rather controversial (normative)
In addition:4. Time frame is long-term5. Cause effect is hard to determine (a function of complexity as well)And then you have these “intangibles”: community, business climate, culture of poverty, urban milieu, etc.
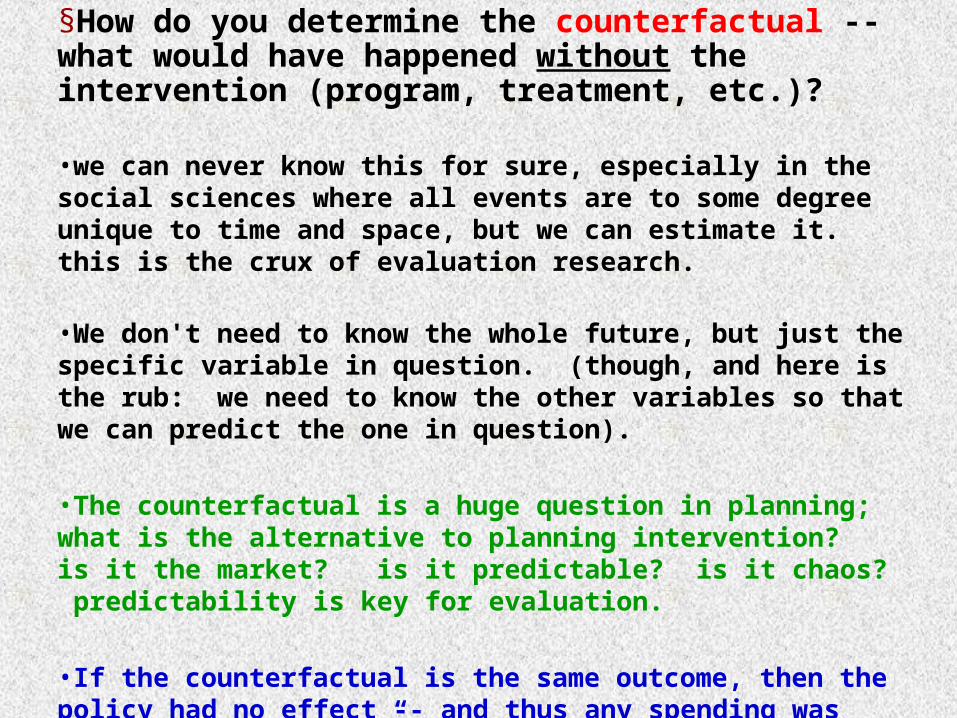
§How do you determine the counterfactual -- what would have happened without the intervention (program, treatment, etc.)?
•we can never know this for sure, especially in the social sciences where all events are to some degree unique to time and space, but we can estimate it. this is the crux of evaluation research.
•We don't need to know the whole future, but just the specific variable in question. (though, and here is the rub: we need to know the other variables so that we can predict the one in question).
•The counterfactual is a huge question in planning; what is the alternative to planning intervention? is it the market? is it predictable? is it chaos? predictability is key for evaluation.
•If the counterfactual is the same outcome, then the policy had no effect -- and thus any spending was “deadweight spending” (it would have happened anyway).

§How do we determine the counterfactual?
Is it an improvement over time, or instead simply the prevention of further deterioration/decline?
An example from economic development ----

§Is the counterfactual job loss or simply no job creation (or both)?
before after before after
Job creation
Counterfactual is no change
Job retention
Counterfactual is job loss
Note: job retention can be equally as effective as job creation (remember: a “job saved is a job earned,” to paraphrase Ben Franklin). Retention can in fact at times be even more important, because it often provides employment for an existing resident at risk, rather than for a potential new resident. However, capitalist economies -- and political careers -- are built on growth, so “mere” retention is often neglected.
Also: be cause of exaggerated claims for successful job retention (e.g., this tax break prevented an entire firm and its 8,000 employees from leaving).
Note: this is a reminder that the counterfactual is NOT necessarily the status quo (I.e., continuation of the same pattern).
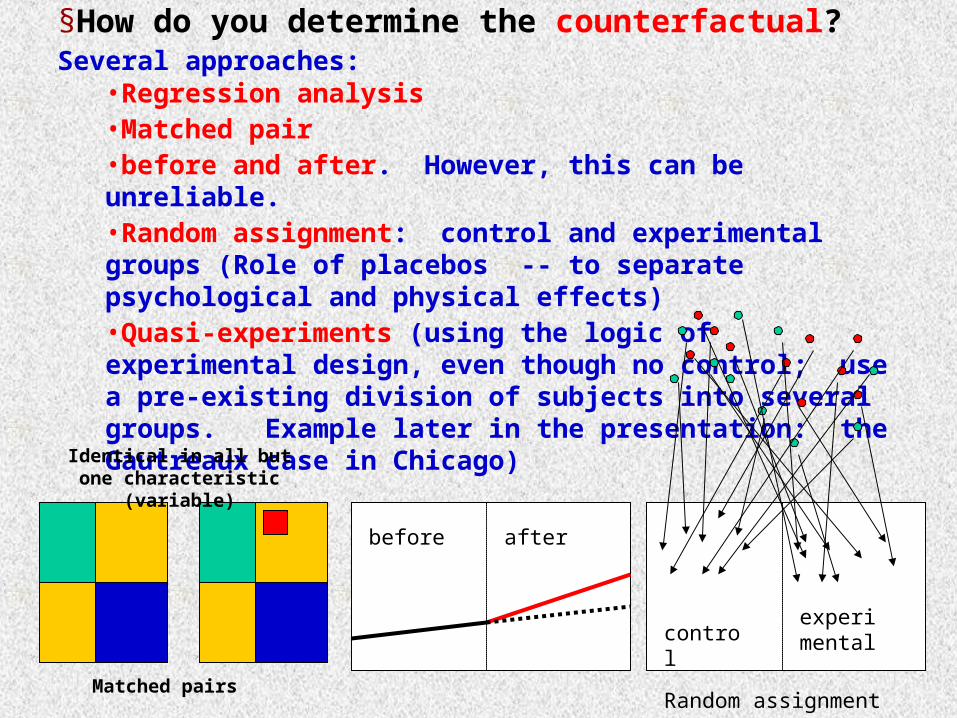
§How do you determine the counterfactual? Several approaches:
•Regression analysis •Matched pair•before and after. However, this can be unreliable.•Random assignment: control and experimental groups (Role of placebos -- to separate psychological and physical effects)•Quasi-experiments (using the logic of experimental design, even though no control; use a pre-existing division of subjects into several groups. Example later in the presentation: the Gautreaux case in Chicago)
before after
Matched pairs
controlexperimental
Random assignment
Identical in all but one characteristic (variable)
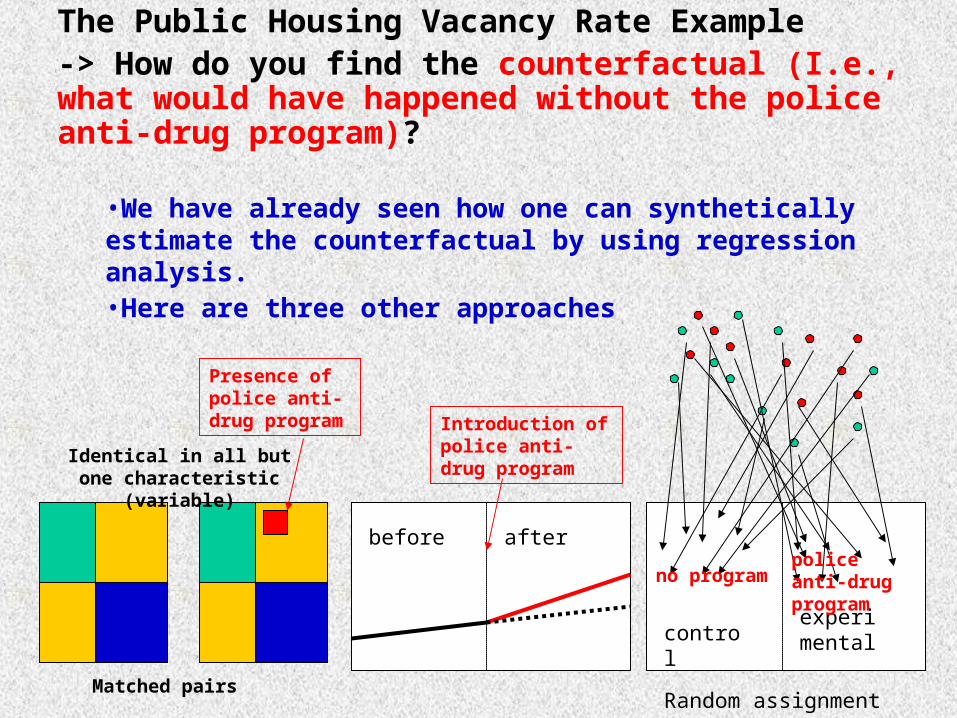
The Public Housing Vacancy Rate Example-> How do you find the counterfactual (I.e., what would have happened without the police anti-drug program)?
•We have already seen how one can synthetically estimate the counterfactual by using regression analysis.•Here are three other approaches
before after
Matched pairs
controlexperimental
Random assignment
Identical in all but one characteristic (variable)
Presence of police anti-drug program Introduction of
police anti-drug program
police anti-drug programno program
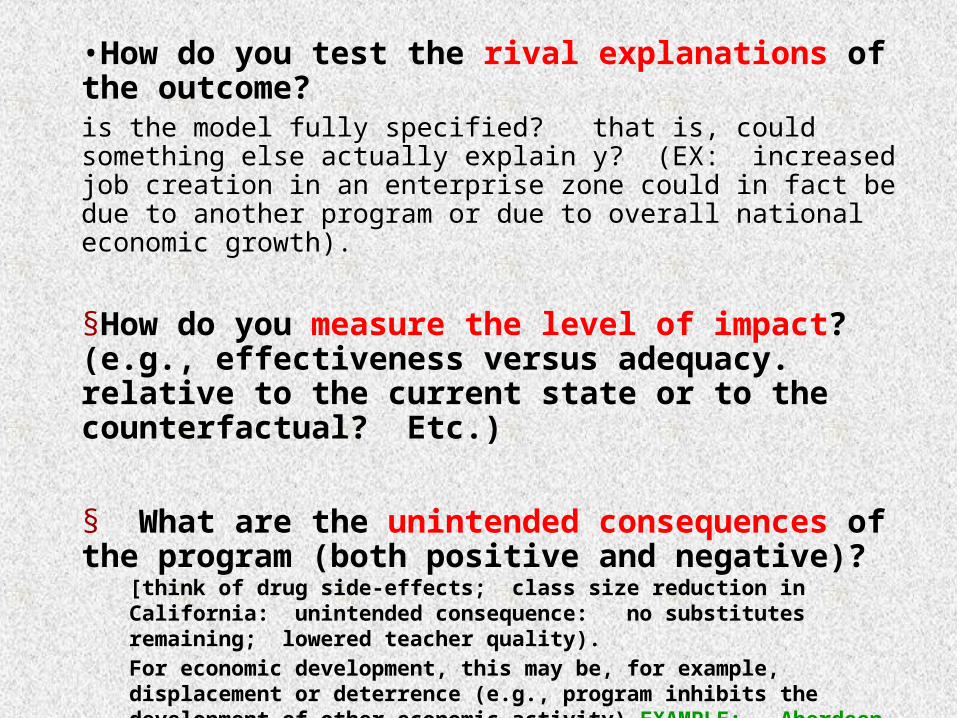
•How do you test the rival explanations of the outcome?is the model fully specified? that is, could something else actually explain y? (EX: increased job creation in an enterprise zone could in fact be due to another program or due to overall national economic growth).
§How do you measure the level of impact? (e.g., effectiveness versus adequacy. relative to the current state or to the counterfactual? Etc.)
§ What are the unintended consequences of the program (both positive and negative)?
[think of drug side-effects; class size reduction in California: unintended consequence: no substitutes remaining; lowered teacher quality). For economic development, this may be, for example, displacement or deterrence (e.g., program inhibits the development of other economic activity) EXAMPLE: Aberdeen, Scotland: North Sea Oil Boom deterred other local development.

Variable x2 Variable y
Variable x1
Variable x3
Focus:
•To find all the significant explanatory variables
•To maximize the amount of variation in y explained (R2 )
Beta weights (path coefficients)
+.42
+.27
-.21

Evaluation research models may seem quite similar to regression models -- and often evaluation researchers in fact use regression models.
The distinction is often in the way evaluation researchers use models to isolate the cause -> effect relationship of a specific intervention / treatment (e.g., an education program) on a specific goal (e.g., student test scores).

Variable x
Another causeof y (not in the model)
a side effectof x
Variable y
12
3
Another causeof y (and moreeffective than x)
4
Focus:
•To isolate the specific impact of an intervention (x) on a desired outcome (y)
•To discover rival explanations and unintended consequences
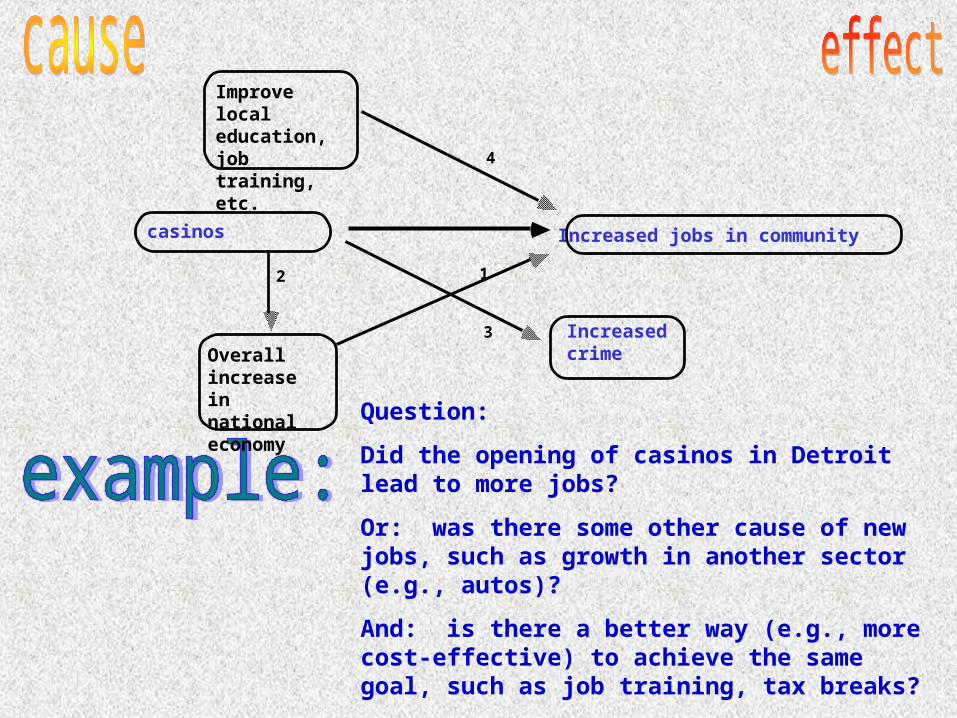
casinos Increased jobs in community
12
3
4
Question:
Did the opening of casinos in Detroit lead to more jobs?
Or: was there some other cause of new jobs, such as growth in another sector (e.g., autos)?
And: is there a better way (e.g., more cost-effective) to achieve the same goal, such as job training, tax breaks?
Any side-effects (good or bad?)
Improve local education, job training, etc.
Overall increase in national economy
Increased crime

Other Issues: OPPORTUNITY COSTS
•Program opportunity costs: what benefits have been foregone due to other programs not funded? (e.g., funding casinos may lead to job creation, but it means that other programs may lack funding)
•Labor opportunity costs: people would have found jobs elsewhere (this can be seen as another form of displacement). So: net benefit = marginal increase in wages.
•Land opportunity costs: what were the benefits of other possible uses of the land (especially important if a large site in a city with limited land resources).
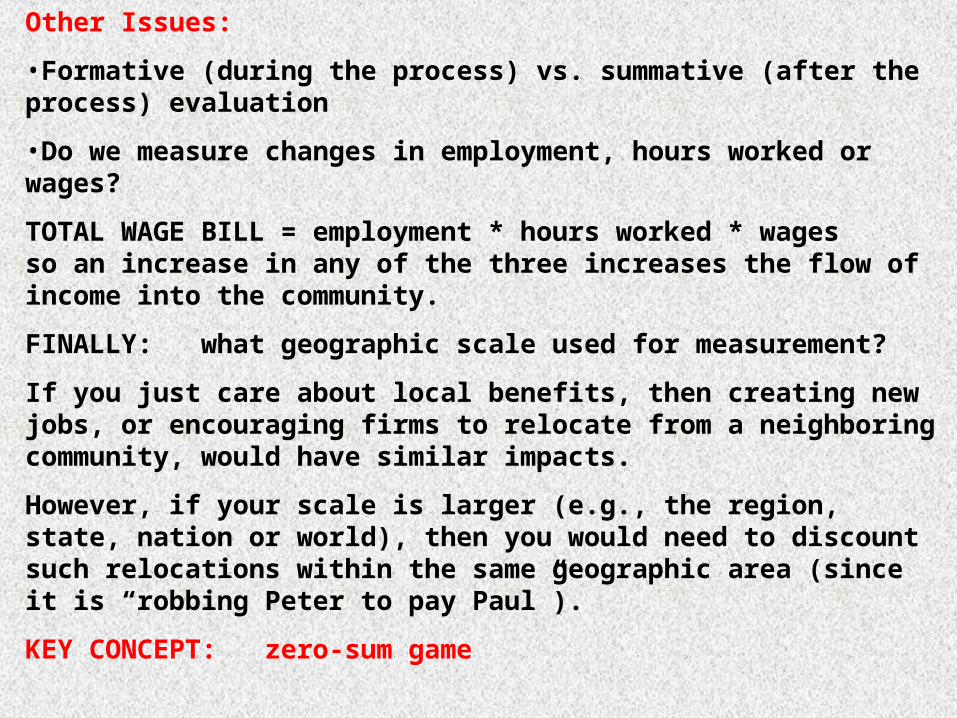
Other Issues:
•Formative (during the process) vs. summative (after the process) evaluation
•Do we measure changes in employment, hours worked or wages?
TOTAL WAGE BILL = employment * hours worked * wagesso an increase in any of the three increases the flow of income into the community.
FINALLY: what geographic scale used for measurement?
If you just care about local benefits, then creating new jobs, or encouraging firms to relocate from a neighboring community, would have similar impacts.
However, if your scale is larger (e.g., the region, state, nation or world), then you would need to discount such relocations within the same geographic area (since it is “robbing Peter to pay Paul”).
KEY CONCEPT: zero-sum game

Cabrini-Green public housing project, foreground and mid-photo high-rises, is seen against the Chicago Skyline in May 1996. Cabrini-Green, for decades one of the nation's least desirable addresses, has become the target of a massive redevelopment project becoming one of the city's most coveted pieces of real estate. (AP Photo/Beth A. Keiser)http://accuweather.ap.org/cgi-bin/aplaunch.pl
Case Study: the Gautreaux Program and the Chicago Housing Authority

A young boy crosses a snow-covered field at 48th and State Streets on Chicago's South Side Saturday, Jan. 17, 1998. The field is the site where civil rights leader Dr. Martin Luther King, Jr. spoke on July 24, 1965, to housing project residents. The Robert Taylor Homes was a model of modern public housing in 1965, but today it is considered one of the nation's worst examples of public housing. Gangs, drugs, violence and poorly maintained buildings are the reality to thousands who live in the Taylor homes. On Monday, Jan. 19, the nation will celebrate Martin Luther King day. (AP Photo/Top photo, File, Bottom photo, Beth A. Keiser)http://accuweather.ap.org/cgi-bin/aplaunch.pl
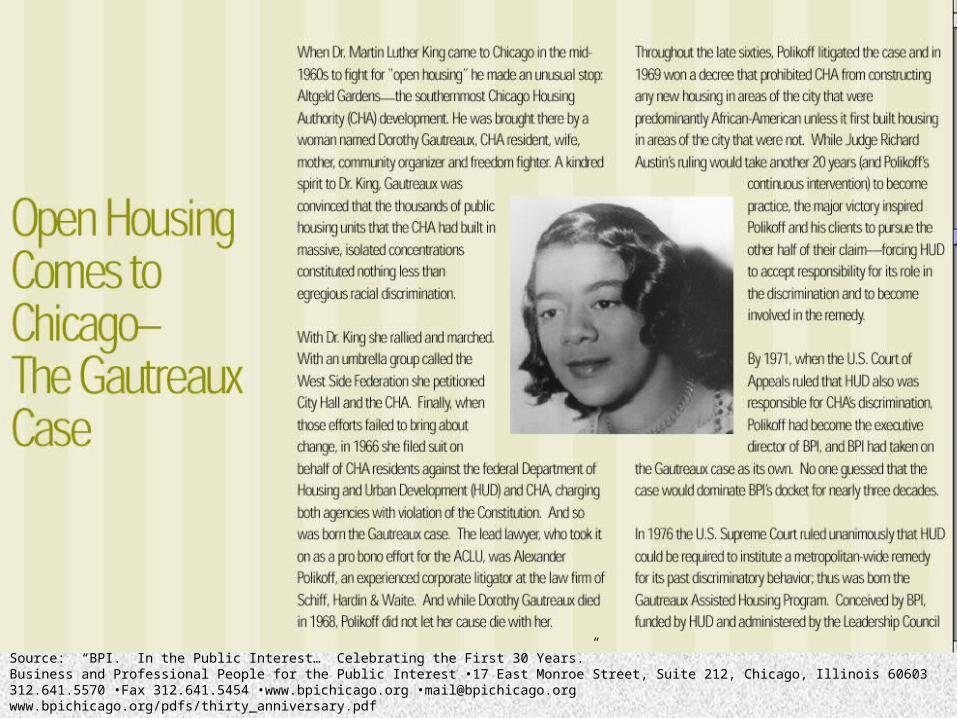
Source: “BPI. In the Public Interest… Celebrating the First 30 Years.” Business and Professional People for the Public Interest •17 East Monroe Street, Suite 212, Chicago, Illinois 60603312.641.5570 •Fax 312.641.5454 •www.bpichicago.org •[email protected]/pdfs/thirty_anniversary.pdf

EXAMPLE:James Rosenbaum, Changing the Geography of opportunity by Expanding Residential Choice: Lessons from the Gautreaux Program. Housing Policy Debate 6 (1): 231-68.
A legal decision against the Chicago Housing Authority (1976) for racial discrimination led to a housing voucher program (Section 8): Low income blacks randomly assigned to either urban neighborhoods or white, middle class areas.
Appeal of studying program: •Quasi-experimental situation•Random assignment (a rare and great opportunity)•overall strategy: compare the outcomes of two groups: the experimental group and the control group.

The appeal of Gautreaux for social scientists:
“Because of its design, the Gautreaux program presents an unusual opportunity to test the effect of helping low-income people move to better labor markets, better schools, and better neighborhoods.” [233]
BY CONTRAST - in most situations, one faces the confounding influence of self-selection:…
“…it is hard to tell whether the suburbs increased black employment or whether the blacks who happen to live in suburbs are different, perhaps moving to the suburbs after getting a job…” [233]
Better jobs and educational outcomes
Suburban, middle class location
More ambitious and successful people
Black arrows: geography shapes opportunity
red arrows: more successful people move to better
neighborhoods
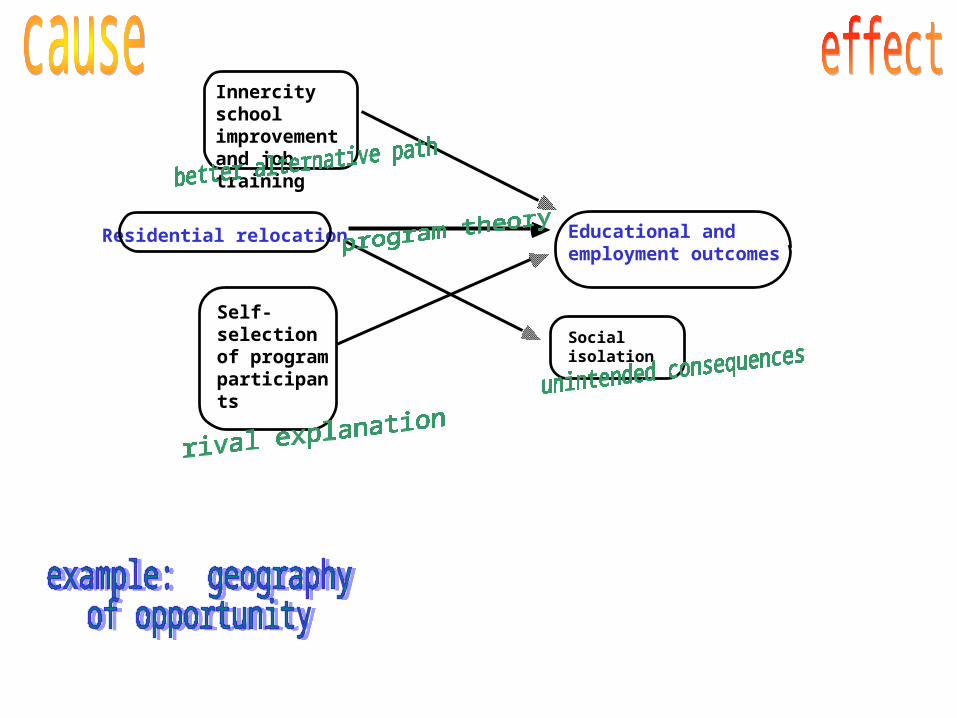
Residential relocation
Social isolation
Educational and employment outcomes
Innercity school improvement and job training
Self-selection of program participants

Criteria for reviewing this article:• program theory• defining and measuring the counterfactual• unit(s) of analysis• types and sources of evidence• number and selection of cases• the use of a large statistical analysis vs. in-depth case studies• accounting/controlling for rival explanations of the impact• measurement issues• short-term vs. long-term impacts• unintended consequences (side-effects)• generalizing the results to other cases
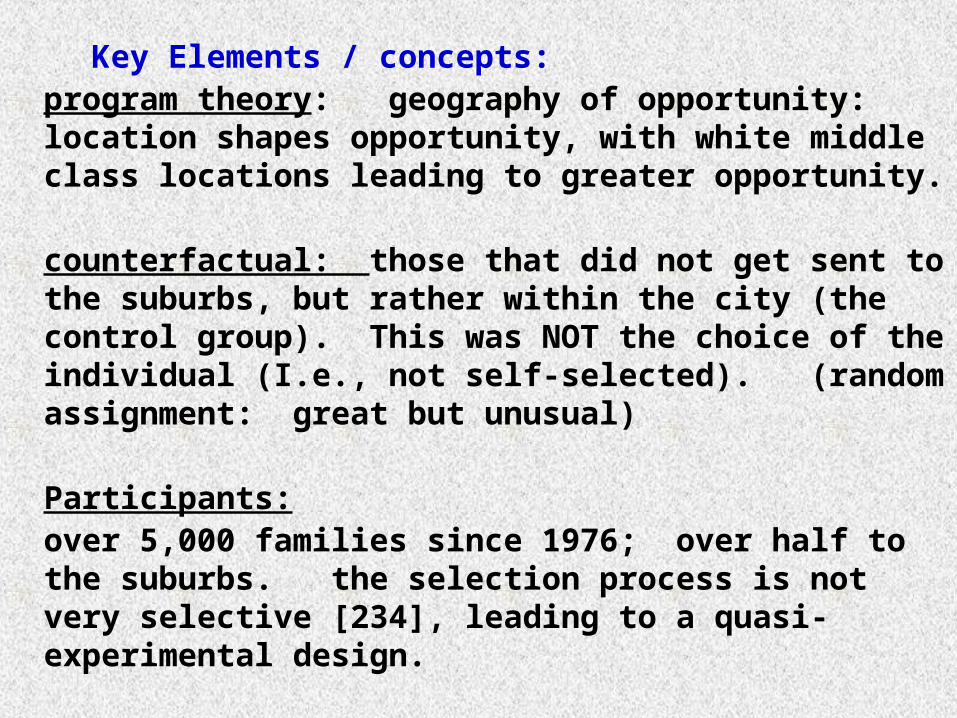
Key Elements / concepts:program theory: geography of opportunity: location shapes opportunity, with white middle class locations leading to greater opportunity.
counterfactual: those that did not get sent to the suburbs, but rather within the city (the control group). This was NOT the choice of the individual (I.e., not self-selected). (random assignment: great but unusual)
Participants:over 5,000 families since 1976; over half to the suburbs. the selection process is not very selective [234], leading to a quasi-experimental design.
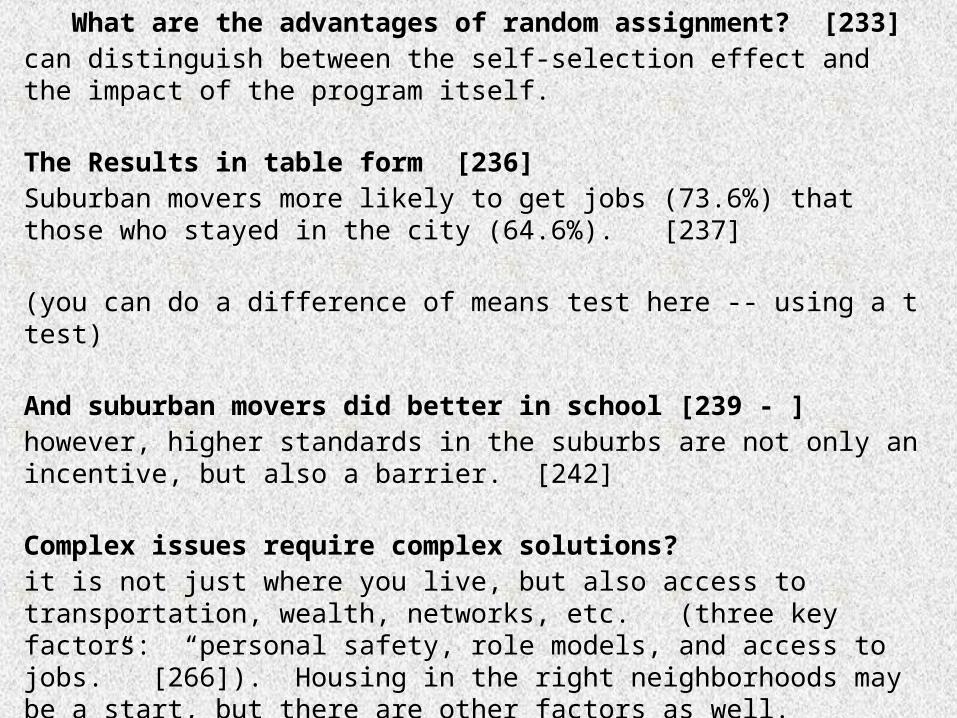
What are the advantages of random assignment? [233]can distinguish between the self-selection effect and the impact of the program itself.
The Results in table form [236]Suburban movers more likely to get jobs (73.6%) that those who stayed in the city (64.6%). [237]
(you can do a difference of means test here -- using a t test)
And suburban movers did better in school [239 - ]however, higher standards in the suburbs are not only an incentive, but also a barrier. [242]
Complex issues require complex solutions?it is not just where you live, but also access to transportation, wealth, networks, etc. (three key factors: “personal safety, role models, and access to jobs.” [266]). Housing in the right neighborhoods may be a start, but there are other factors as well.

Finally: links between evaluation research and community organizing / communicative action:
One sees a shift from an evaluation as simply “objective, neutral analysis of a program” to one that is politically, organizationally effective.
•Communicates well
•Is understandable
•Shows both shortcomings and possibilities of success
•Is discussed, incorporated into the political debate
•Shapes the language and structure of the political discussion
•And thus allows for conflict resolution over policies
Last slide