evaluation results of op4l learning environment and services in slovenia maribor, may 2012 bar,...
TRANSCRIPT
Evaluation Results of OP4L Learning Environment and
Services in SloveniaMaribor, May 2012
Bar, Montenegro, 25th – 26th June
Ines Kožuh, prof. dr. Matjaž Debevc
Research detailes
• The aim of our study: test OP4L learning environment and its services, assess students‘ relationship with collaborative learning
• evaluation:• before testing OP4L learning environment
• after testing OP4L learning environment
Company LOGO
Participants
• Computer Science students -1st year (Faculty of Electrical Engineering and Computer Science),
• volunteers signed consent form,
• 62 participants • all male,
• age in years (Mdn = 20, Mean = 20.73, Min = 19, Max = 25),
• experience in programming.
Company LOGO
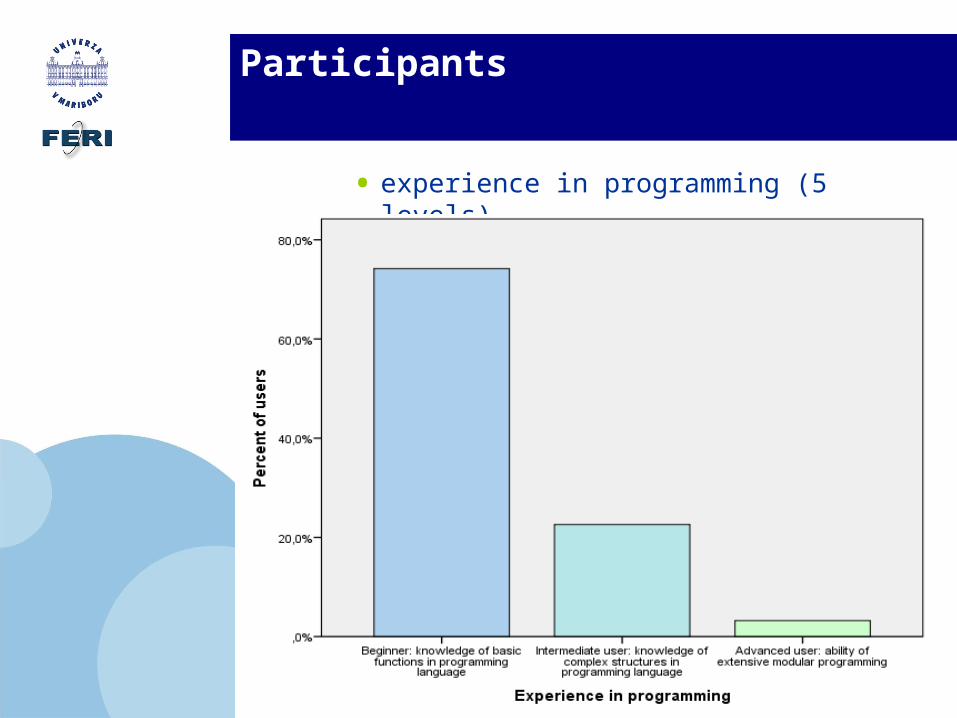
Participants
• experience in programming (5 levels)
Company LOGO
Procedure
• Three weeks in May 2012
• Two classroom meetings:• 1st meeting: before testing, instructions were given,
questionnaires were filled in,
• 2nd meeting: after testing, questionnaires were filled in,
• The task:• brainstorming,
• submission of proposed idea,
• programming,
• submission of the program,
• assessment of the program.
Company LOGO
Measures
• Quantitative research metod (questionnaires),
• Evaluation before testing OP4L:• A questionnaire on the habits of using Facebook,
Facebook chat and Web resources,
• Evaluation after testing OP4L:• A questionnaire on the habits of using Facebook,
Facebook chat and Web resources (the same as before testing),
• A questionnaire on the experience in OP4L learning environment,
• A questionnaire on collaborative learning and using Facebook in favor of collaborative learning,
• A questionnaire on the usability of OP4L learning environment (SUS),
• Motivated strategies on learning questionnaire (MSLQ).
Company LOGO
Measures
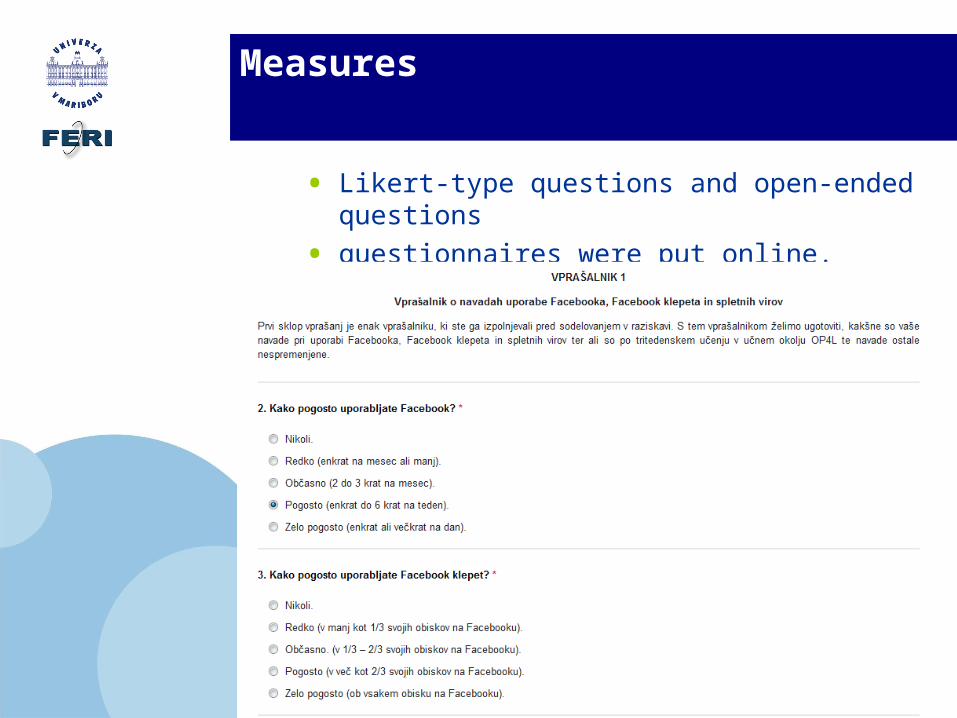
• Likert-type questions and open-ended questions
• questionnaires were put online.
Company LOGO
Statistical analysis
• Descriptive statistics,
• definition of statistically significant relationships (Spearman‘s Rho coefficient),
• Kruskal-Wallis Test (differences among independent samples),
• SPSS 20.0.
Company LOGO
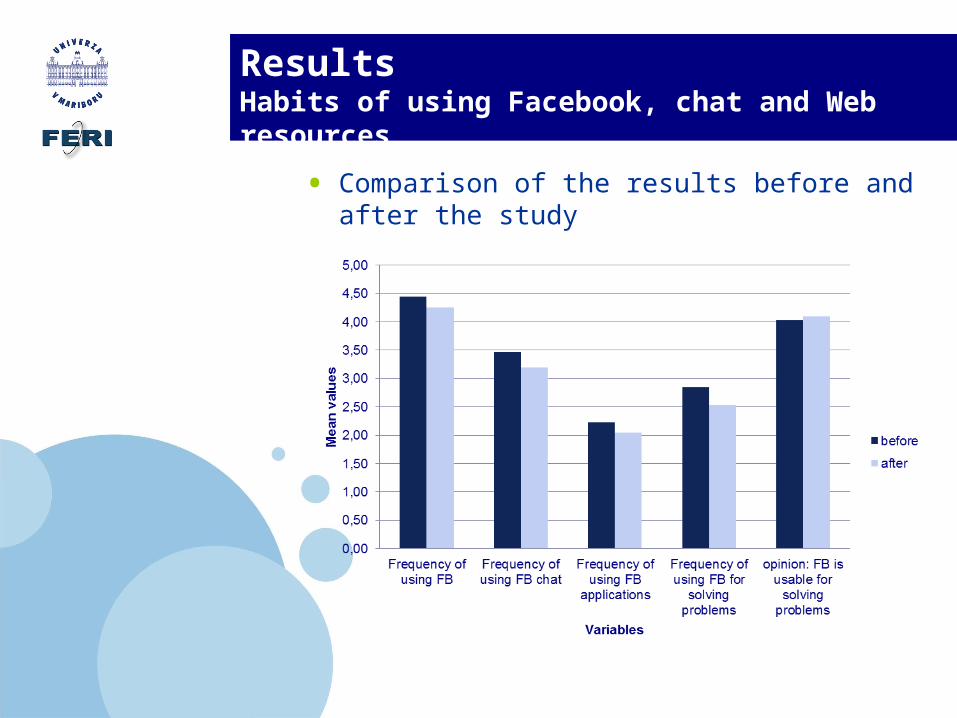
Results Habits of using Facebook, chat and Web resources
• Comparison of the results before and after the study
Company LOGO
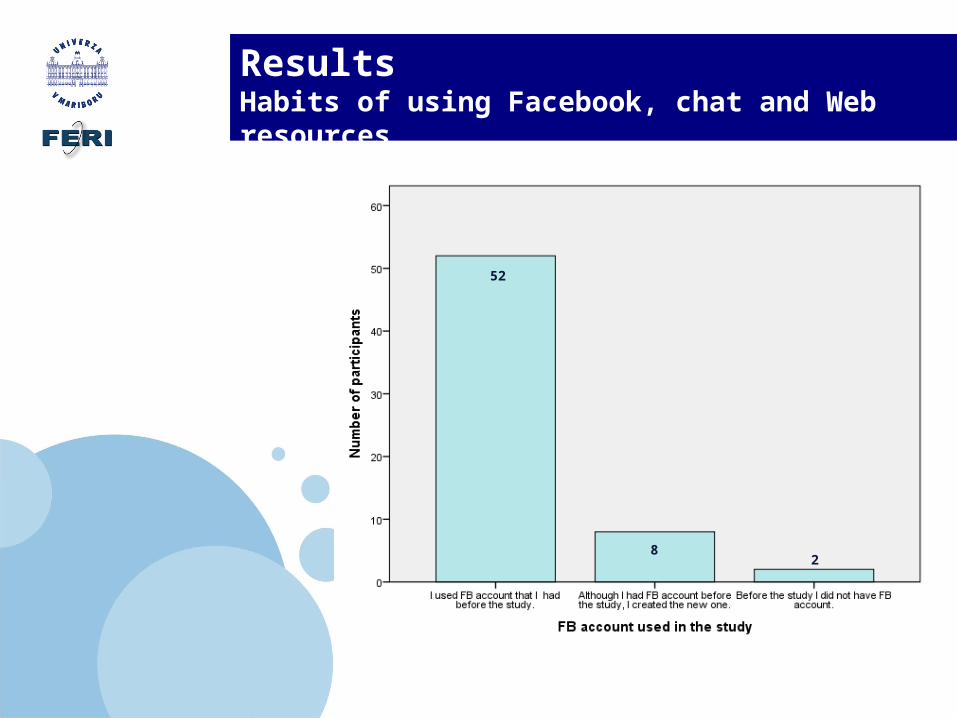
Results Habits of using Facebook, chat and Web resources
Company LOGO
52
82
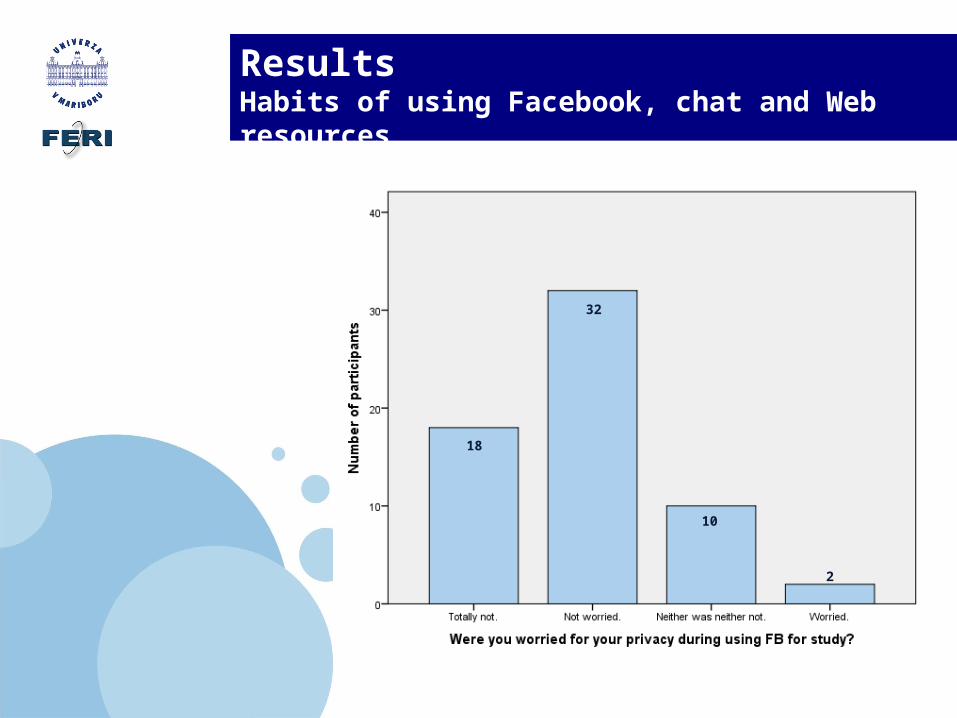
Results Habits of using Facebook, chat and Web resources
Company LOGO
18
32
10
2
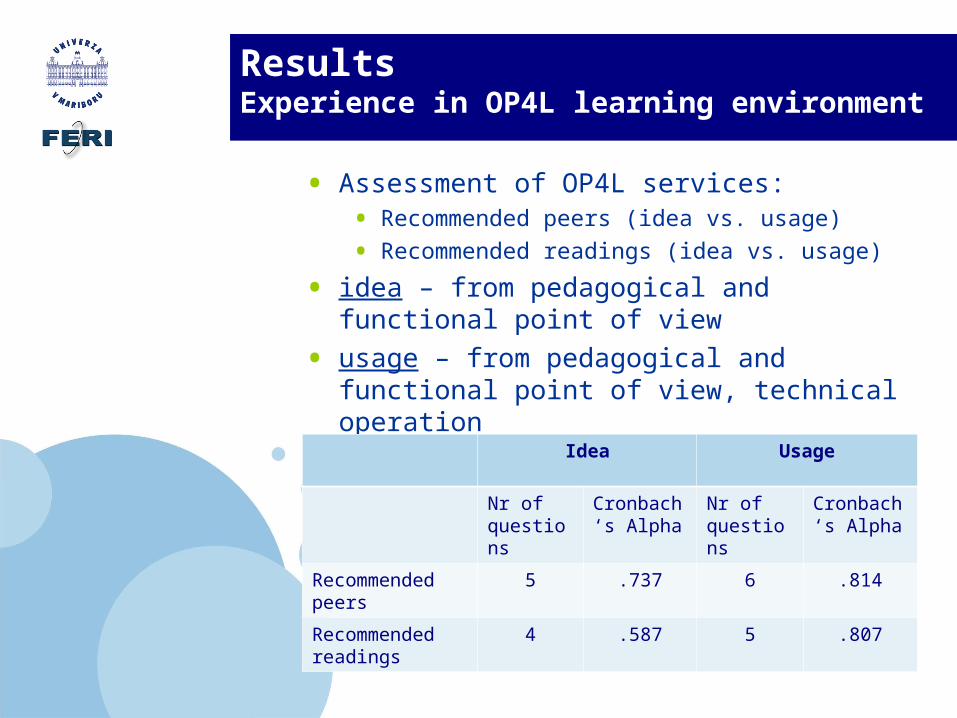
Results Experience in OP4L learning environment
• Assessment of OP4L services:• Recommended peers (idea vs. usage)
• Recommended readings (idea vs. usage)
• idea – from pedagogical and functional point of view
• usage – from pedagogical and functional point of view, technical operation
Idea Usage
Nr of questions
Cronbach‘s Alpha
Nr of questions
Cronbach‘s Alpha
Recommended peers
5 .737 6 .814
Recommended readings
4 .587 5 .807
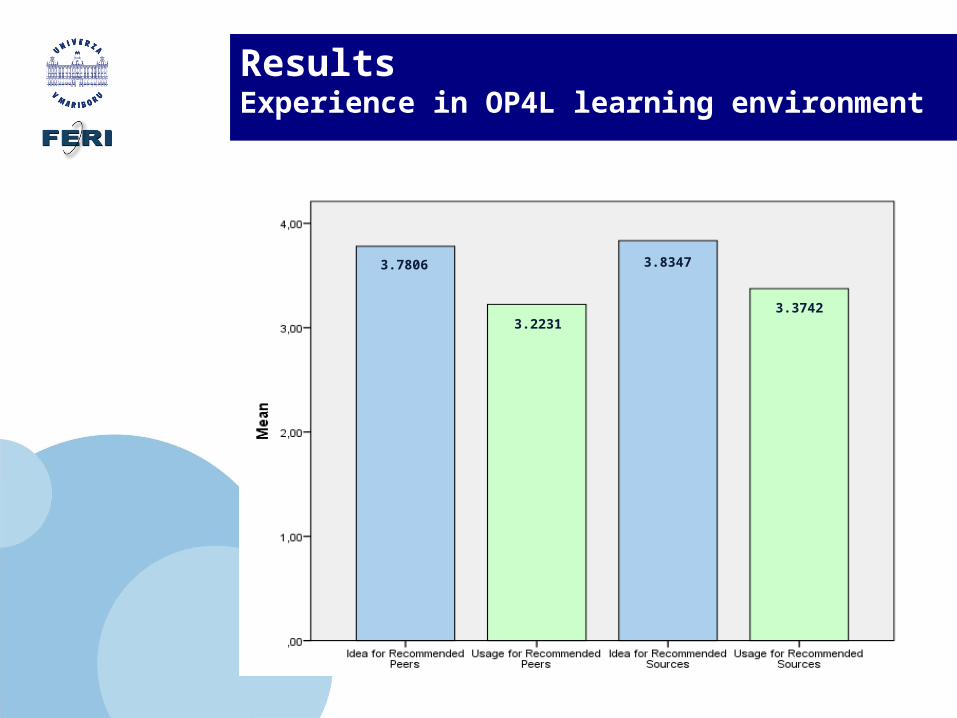
Results Experience in OP4L learning environment
Company LOGO
3.7806
3.2231
3.8347
3.3742

Results Usability of OP4L learning environment (SUS)
• SUS score = 67.38
Company LOGO
Source: A. Bangor, P. Kortum, J.A. Miller, The System Usability Scale (SUS): An Empirical Evaluation, International Journal of Human-Computer Interaction, 24, (2008), 6, pp. 574‒594.

Results Opinions on usability of OP4L learning environment
• Bad responsiveness of the system.
• Too many clicks were needed to be able to come to the task.
• Problems with submitting and assessing the tasks.
• Communication with others was too complicated.
Company LOGO

Results Correlations between usability and OP4L services
Company LOGO
Correlations
(1) (2) (3) (4) (5)
(1) System usabilityCorrelation Coefficient 1,000 .529** .505** .465** .581**
Sig. (2-tailed) . .000 .000 .000 .000
(2) Idea Recommended Peers
Correlation Coefficient 1.000 .620** .449** .401**
Sig. (2-tailed) . .000 .000 .001
(3) Usage Recommended Peers
Correlation Coefficient 1,000 .411** .656**
Sig. (2-tailed) . .001 .000
(4) Idea Recommended Readings
Correlation Coefficient 1.000 .504**
Sig. (2-tailed) . .000
(5) Usage Recommended Readings
Correlation Coefficient 1,000
Sig. (2-tailed) .
**. Correlation is significant at the 0.01 level (2-tailed).

ResultsCollaborative learning and using FB in learning
• assessment of collaborative learning,
• assessment of using Facebook in learning,
Company LOGO
Number of questions
Cronbach‘s Alpha
Collaborative learning 7 .869
Facebook in learning 4 .868
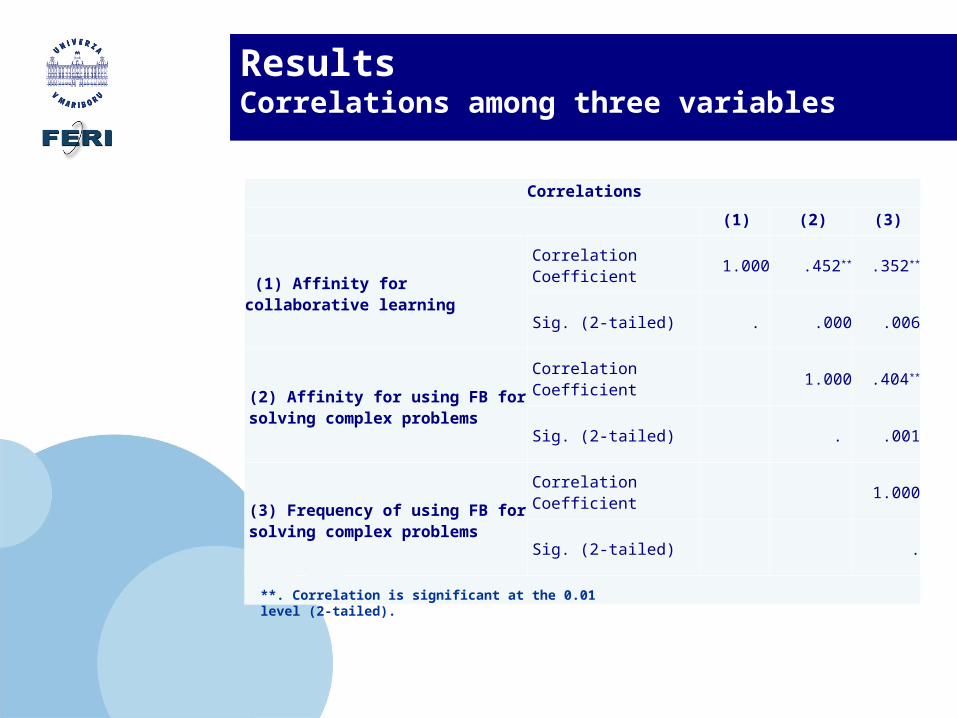
Results Correlations among three variables
Company LOGO
Correlations
(1) (2) (3)
(1) Affinity for collaborative learning
Correlation Coefficient 1.000 .452** .352**
Sig. (2-tailed) . .000 .006
(2) Affinity for using FB for solving complex problems
Correlation Coefficient 1.000 .404**
Sig. (2-tailed) . .001
(3) Frequency of using FB for solving complex problems
Correlation Coefficient 1.000
Sig. (2-tailed) .
**. Correlation is significant at the 0.01 level (2-tailed).

Results Dispersion of data for two variables
Company LOGO
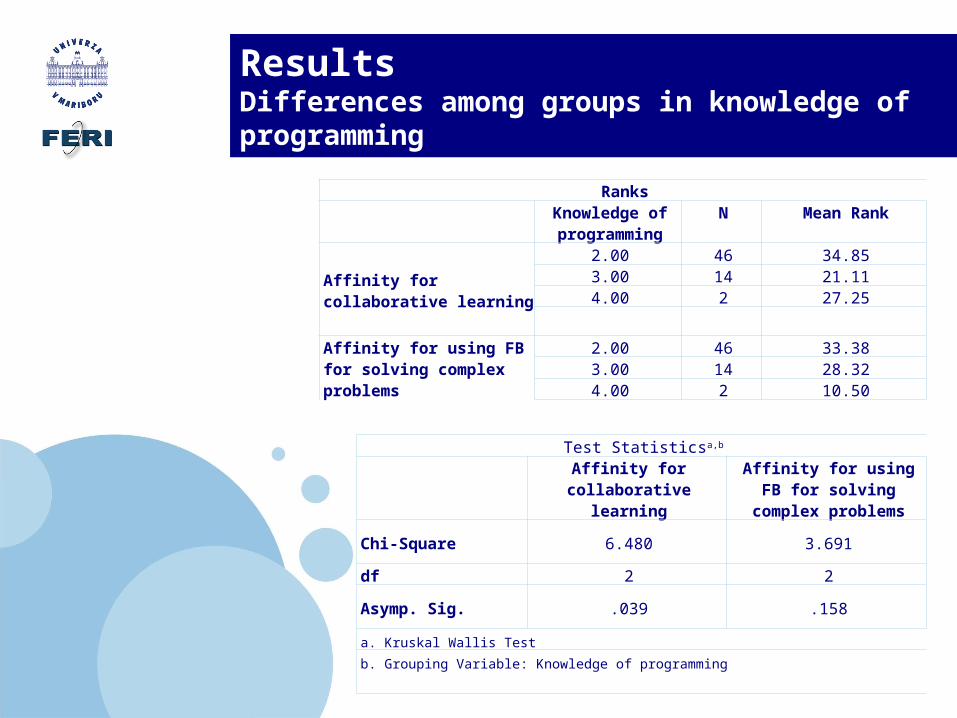
Results Differences among groups in knowledge of programming
Company LOGO
Ranks
Knowledge of programming
N Mean Rank
Affinity for collaborative learning
2.00 46 34.853.00 14 21.114.00 2 27.25
Affinity for using FB for solving complex problems
2.00 46 33.383.00 14 28.324.00 2 10.50
Test Statisticsa,b
Affinity for collaborative learning
Affinity for using FB for solving complex
problems
Chi-Square 6.480 3.691
df 2 2
Asymp. Sig. .039 .158
a. Kruskal Wallis Test
b. Grouping Variable: Knowledge of programming

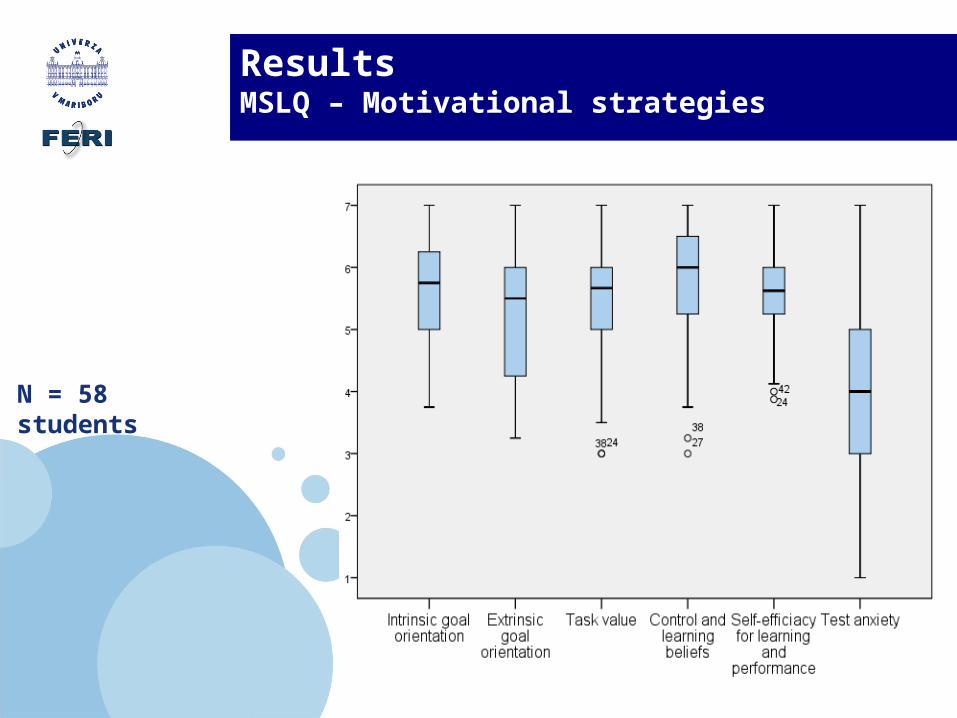
ResultsMSLQ – Motivational strategies
Company LOGO
N = 58 students
ResultsMSLQ – Motivational strategies
Company LOGO
N = 58 students

ResultsMSLQ – Learning strategies
Company LOGO
N = 58 students

ResultsMSLQ – Learning strategies
Company LOGO
N = 58 students
Contact
University of Maribor,
Faculty of Electrical Engineering and
Computer Science,
Smetanova 17, 2000 Maribor
www.feri.uni-mb.si
Ines Kožuh
e-mail: [email protected]
prof. dr. Matjaž Debevc
e-mail: [email protected]
Company LOGO