evaluations and measurements of a single frequency network with drm+
TRANSCRIPT
Evaluations and Measurements of a SingleFrequency Network with DRM+
Friederike Maier∗, Andrej Tissen∗, Albert Waal†∗Institute of Communications Technology, Leibniz University of Hanover, Germany, Hanover, Appelstrasse 9A
†RFmondial GmbH, Germany, Hanover, Appelstrasse 9A
Abstract - This paper presents the first DRM+ (Digital RadioMondiale, Mode E) Single Frequency Network (SFN) in the air.A field trial has been conducted to evaluate the performance indifferent environments. Due to it’s relatively small bandwidth, flatfading in the overlapping area can become a problem. Differentsolutions to overcome this problem are evaluated in this paper.Adding different delays to transmitters side-by-side is a solutionto overcome the flat fading. In the field trial the error rates in theoverlapping area in a two TX setup with delay were significantlysmaller than without delay, the probability of deep fades wasbecoming smaller. This paper provides parameters for applyinga Single Frequency Network with DRM+.
Keywords - Digital Radio Mondiale; DRM+ ; Single FrequencyNetwork; SFN; digital broadcasting; COFDM; field trial
I. INTRODUCTION
DRM+ is an extension of the long, medium and shortwaveDRM standard up to the upper VHF band. It has been approvedin the ETSI (European Telecommunications Standards Insti-tute) DRM standard [1] and added to the ITU recommendedDigital Radio standards above 30 MHz [2] in 2011.
As a digital COFDM radio system, DRM+ is capableof transmitting in a Single Frequency Network (SFN) withseveral transmitters working on the same frequency. Due to aguard interval added after every symbol, differences in timeof arrival from the different transmitters are not resulting inIntersymbol Interference (ISI) as long as they are within theguard interval duration. Attenuation of carriers due to the timedelay often can be compensated by the SFN gain. This offersthe possibility of covering a big area with several transmitterson only one frequency which saves bandwidth and simplifiesfrequency planning significantly. It also enhances the receptionquality in areas with obstacles as buildings, hills or mountains.Other uses for SFN are gap filling transmitters and coverageextenders. First studies and simulations about using a DRM+SFN are described in [3] and [4].
This principle is already highly used in other digital broad-casting systems as DVB-T or DAB. Principles on SFN plan-ning for DAB and DVB-T are given in [5] and [6].
Recent studies about Single Frequency Networks for Broad-casting systems focus on planning optimization as in [7] ortaking advantage of hierarchical modulation as in [8].
As the DRM+ signal bandwidth of 96 kHz, in contrastto DVB-T (7-8 MHz) and DAB (≈1.5 MHz) is quite small,flat fading in the overlapping area can degrade the receptionquality. Adding a delay at one transmitter station was proposed
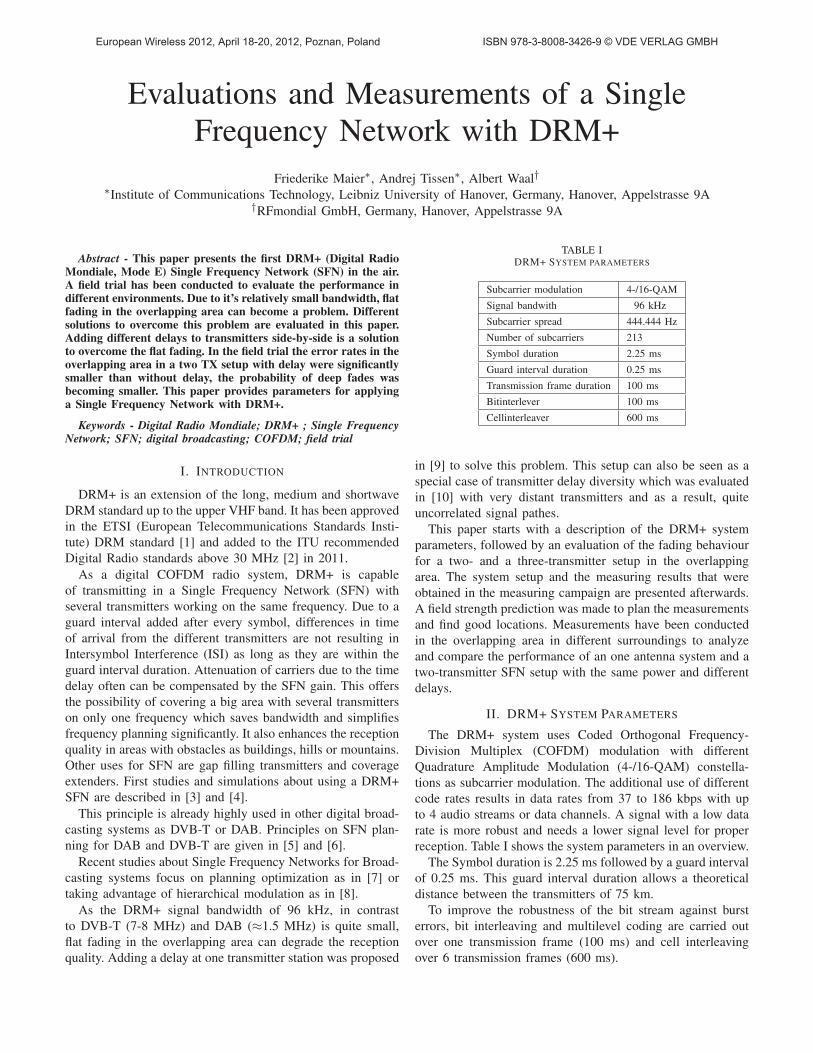
TABLE IDRM+ SYSTEM PARAMETERS
Subcarrier modulation 4-/16-QAM
Signal bandwith 96 kHz
Subcarrier spread 444.444 Hz
Number of subcarriers 213
Symbol duration 2.25 ms
Guard interval duration 0.25 ms
Transmission frame duration 100 ms
Bitinterlever 100 ms
Cellinterleaver 600 ms
in [9] to solve this problem. This setup can also be seen as aspecial case of transmitter delay diversity which was evaluatedin [10] with very distant transmitters and as a result, quiteuncorrelated signal pathes.
This paper starts with a description of the DRM+ systemparameters, followed by an evaluation of the fading behaviourfor a two- and a three-transmitter setup in the overlappingarea. The system setup and the measuring results that wereobtained in the measuring campaign are presented afterwards.A field strength prediction was made to plan the measurementsand find good locations. Measurements have been conductedin the overlapping area in different surroundings to analyzeand compare the performance of an one antenna system and atwo-transmitter SFN setup with the same power and differentdelays.
II. DRM+ SYSTEM PARAMETERS
The DRM+ system uses Coded Orthogonal Frequency-Division Multiplex (COFDM) modulation with differentQuadrature Amplitude Modulation (4-/16-QAM) constella-tions as subcarrier modulation. The additional use of differentcode rates results in data rates from 37 to 186 kbps with upto 4 audio streams or data channels. A signal with a low datarate is more robust and needs a lower signal level for properreception. Table I shows the system parameters in an overview.
The Symbol duration is 2.25 ms followed by a guard intervalof 0.25 ms. This guard interval duration allows a theoreticaldistance between the transmitters of 75 km.
To improve the robustness of the bit stream against bursterrors, bit interleaving and multilevel coding are carried outover one transmission frame (100 ms) and cell interleavingover 6 transmission frames (600 ms).
European Wireless 2012, April 18-20, 2012, Poznan, Poland ISBN 978-3-8008-3426-9 © VDE VERLAG GMBH

Fig. 1. A ’Single Frequency Network’ of two transmitters
III. PROPAGATION CONDITIONS IN A SFN
In an ideally synchronized two TX-SFN as seen in Figure 1,the vertical polarized E-field as the interference of signalE1(r1) arriving from TX1 and E2(r2) arriving from TX2 canbe derived from the well known wave equation for one carrierat frequency f0 +Δf at reception point r:
E(r, t) = E(r)ej2π(f0+Δf)(t+ r
co) (1)
With E12(r1, r2, t) = E1+E2 and assuming constant levelswithin one symbol duration the mean sum power level is givenby [9]:
|E12|2 ∼ E1(r1)2 + E2(r2)
2 (2)
+ 2E1(r1)E2(r2) cos
(2π
(f0 +Δf)
c0(r2 − r1)
)
The power level of the interference of all carriers within theOFDM bandwidth B is then given to:
P12 =
∫ +B
2
−
B
2
|E12|2dΔf (3)
which leads to the following equation:
P12
B∼ E1(r1)
2 + E2(r2)2+
+ 2E1(r1)E2(r2) cos
(2π
f0c0
(r2 − r1)
)·
· si(πB
c0(r2 − r1)
)(4)
In Figure 2 the sum power level is plotted together withthe power level of the single transmitters, assuming freespace loss (|E(r)|2 ∼ 1/r2). The DRM+ signal bandwidthof 96 kHz, f0 = 100 MHz and a distance of 10 km betweenthe transmitters was used for the calculation. TX1 is locatedat 0 m , TX2 at 10000 m. It shows clearly that additiveinterference as well as deep fades up to -40 dB can occurbetween the two transmitters, where the power level from bothtransmitters are similar and the signals from both transmittersare arriving simultaneously. Adding a delay at TX1, the regionof simultaneous arrival of the signals is shifted to the delayedTX where the power level of both transmitters are not equalanymore and as a result the fading is not as distinctive asshown in Figure 3 for delays of 15 μs and 30 μs.
Adding a third transmitter, the sum power level can becalculated as:
0 500 1000 1500 2000 2500 3000 3500 4000 4500 5000−40
−30
−20
−10
0
10
20
30
40
pow
erle
vel [
dB]
distance from TX1 [m]
sum power levelpowerlevel TX1powerlevel TX2
Fig. 2. Sum power level in an ideal SFN
0 500 1000 1500 2000 2500 3000 3500 4000 4500 5000−40
−30
−20
−10
0
10
20
30
40
pow
erle
vel [
dB]
distance from TX1 [m]
sum power level delay: 15 μssum power level delay: 30 μspowerlevel TX1powerlevel TX2
Fig. 3. Sum power level with different delays added to TX1
P123
B∼ E1(r1)
2 + E2(r2)2 + E3(r2)
2+
+ 2E1(r1)E2(r2) cos
(2π
f0c0
(r2 − r1)
)·
· si(πB
c0(r2 − r1)
)+
+ 2E2(r2)E3(r3) cos
(2π
f0c0
(r3 − r2)
)·
· si(πB
c0(r3 − r2)
)+
+ 2E1(r1)E3(r3) cos
(2π
f0c0
(r3 − r1)
)·
· si(πB
c0(r3 − r1)
)(5)
Figure 4 shows the sum power level of a three transmittersetup with a distance of 10 km between each TX without anydelay added. The TX are located at [0, 0] (TX1), [10000, 0](TX2) and [5000,
√3/2 ·10000] (TX3). From red to green the
power level decreases. The dark blue moire pattern betweenthe three transmitters shows fades of more than 6 dB comparedto the mean power level.
In Figure 5 the sum-power-level of the three TX setup witha delay of 15 μs added to TX1 and 30 μs added to TX2 isshown. The deep fades are no longer present due to the addeddelay.
European Wireless 2012, April 18-20, 2012, Poznan, Poland ISBN 978-3-8008-3426-9 © VDE VERLAG GMBH

[m]
[m]0 1000 2000 3000 4000 5000 6000 7000 8000 9000 10000
0
1000
2000
3000
4000
5000
6000
7000
8000
Fig. 4. Sum power level in a 3 TX SFN
[m]
[m]0 1000 2000 3000 4000 5000 6000 7000 8000 9000 10000
0
1000
2000
3000
4000
5000
6000
7000
8000
Fig. 5. Sum power level in a 3 TX SFN with different a delay of 15 μs
added to TX1 and 30 μs added to TX2
Further evaluations with different delays show that withsmaller delays, the areas of the fading pattern increases. Higherdelays are also not recommended, because the delays haveto be substracted from the guard interval resulting in lessrobustness against multipath propagation and restricting themaximum distance between the transmitters.
Tests made with more transmitters have shown that the delaybetween two TX side-by-side should to be higher than 15 μs.A descriptive interpretation of this value is that the coherencybandwidth, which is the reciprocal of the delay spread [11] for15 μs is approx. 66 kHz. Within the signal bandwidth of 96kHz in the frequency response there is at least one maximumand one minimum.
Another possibility to prevent the flat fading can be usingdifferent power levels at the transmitters or using directionalantennas.
The applied single-ray model simplifies the situation, asin a real setup, multipath propagation is taking place. Butas multipath propagation is adding additional delay spread
Fig. 6. Field strength prediction and measuring routes and envi-ronments (Map data (c) OpenStreetMap and contributors, CC-BY-SA,http://www.openstreetmap.org)
and the pathes from both transmitters are quite uncorrelateddue to the distant locations, the regularity of the fading willbe destroyed and less fading due to the interference can beexpected. To get an impression of what can happen in theworst cast in the overlapping area, the single-ray model givesa good overview.
IV. FIELD TEST
A. Hardware Setup
For the test, two synchronized transmitters had to be devel-oped. This was realized with a FPGA based ’Realtime Board’ .The ’Realtime Board’ is synchronized via GPS and the FPGAis driven by a stable 10 MHz clock which offers hard real-timestability and a constant delay of the signals. One transmitter(TX1) was located at the University of Hanover (height: 70 mabove ground), the other one (TX2) at the headquarters of theTrade Fair Hanover (height: 100 m above ground) at a distanceof 9.2 km from the university. The transmission frequency was95.2 MHz. For the measurements a robust 4-QAM modulationwith protection level 1 (49.7 kbps) was chosen.
Some test measurements were conducted to look for rea-sonable places and a proper power level. To get some errorsto compare, the transmitter power was set to 1 W at eachtransmitter in the SFN mode and 2 W in the single transmittermode.
B. Field strength prediction and measurement locationsoverview
A field strength prediction was calculated with the freeradio propagation simulation program ’Radio Mobile’. ’RadioMobile’ is based on the ITS (Longley-Rice) propagationmodel. The program uses topographic data (SRTM data fromthe Space Shuttle Radar Terrain Mapping Mission), but noMorphology (buildings, woods, etc.).
European Wireless 2012, April 18-20, 2012, Poznan, Poland ISBN 978-3-8008-3426-9 © VDE VERLAG GMBH

01020304050607080
field
stre
ngth
MU1W D6 B3.rsA anfang rcv:rfm 0M1080
mean fs: 36.9227std fs: 3.7084
10−9
10−7
10−5
10−3
10−1
BE
R
mean BER: 0.004365
0
10
20
30
SN
R
0 50 100 150 200 250 300 3500
0.5
1
time [sec.]
RS
TA
err
ors
FAC CRC, mean:0.020274SDC CRC mean:0.039452Audio mean:0.072603
Fig. 7. Heigh velocity measurement with a delay (31 μs) added to TX1
The prediction was conducted with 1 W power at eachtransmitter. In the map in Figure 6 the different measurementlocations are marked. One route on a city highway (’B3’) tomake tests with height speed (≈100 km/h). Two routes inurban area in the overlapping area were choosen (’Bult’ and’Ricklingen’). Here the trial was conducted with low speed(≈10 km/h) to analyze especially the flat fading. Additionallyone route outside the overlapping are in a mixed surrounding(city highway/urban) was measured (’Limmer’) with velocitiesof 50-70 km/h.
C. Height velocity measurements
As the route to the north-east (B3) lies in the overlappingarea, the reception with and without delay was measured here.Figure 7 shows the results with a delay of 6 samples (31 μs)added to TX1. The reception parameters field strength, biterror rate (BER), signal-to-noise ratio (SNR), the mean FAC(Fast Access Channel) error rate, the mean SDC (ServiceDescription Channel) error rate and the mean audio error rateare plotted over the time in seconds.
In Figure 8 the same route in the other direction is plottedwithout delay. As the B3 lies mostly in the overlapping area, asexpected the standard deviation and the errors increase withoutadded delay. An overview of the measurement results is givenin Table II.
D. Low velocity urban measurements
Measurements on two different routes have been conductedin urban areas with low speed. Both places are located withinthe overlapping area, thus the SFN mode was tested with andwithout delay to test the effect of fading in the overlappingarea. The measurements were conducted, driving slowly (≈10km/h) by car, the results are shown in Table II.
The results in ’Bult’ show a good enhancement of receptionquality for the SFN mode with a delay of 6 samples comparedto the one transmitter modes. Besides the BER and audio error
01020304050607080
field
stre
ngth
MU1W D0 B3.rsA anfang rcv:rfm 0M1080
mean fs: 36.4608std fs: 3.9429
10−9
10−7
10−5
10−3
10−1
BE
R
mean BER: 0.0057808
0
10
20
30
SN
R
0 50 100 150 200 250 300 3500
0.5
1
time [sec.]
RS
TA
err
ors
FAC CRC, mean:0.046685SDC CRC mean:0.071547Audio mean:0.12597
Fig. 8. Heigh velocity measurement without delay
TABLE IIMEASUREMENT RESULTS
Location/ Median Standard Mean Mean
Mode field deviation BER audio
strength of the field error
[dBμV/m] strength [dB] rate
City heighway (’B3’), heigh velocity test in overlapping area
with delay 36.9 3.7 0.0043 0.073
no delay 36.5 3.9 0.0057 0.126
Urban area (’Bult’), low velocity test in overlapping area
TX1 only 40.3 5.7 0.0063 0.103
TX2 only 39.5 4.8 0.0017 0.057
SFN delay 40.1 3.4 0.0002 0.029
SFN no delay 37.9 4.9 0.0025 0.059
Urban area (’Ricklingen’), low velocity test in overlapping area
TX1 only 35.3 4.9 0.021 0.233
TX2 only 42.9 5.4 0.0005 0.224
SFN delay 40.9 4.3 5 · 10−6 0.011
SFN no delay 38.6 4.9 0.004 0.072
Mixed surrounding (’Limmer’), outsite overlapping area
TX1 only 34.26 7.9 0.0023 0.056
TX2 only 37.15 9.0 0.0077 0.14
SFN delay 36.5 8.2 0.0004 0.007
rate, also the standard deviation decreases significantly. Thelast measurement was conducted in the SFN mode withoutadding delay. Here the reception quality decreases comparedto the SFN mode with delay. The standard deviation is higher,which indicates more flat fading.
At the measurement location ’Ricklingen’ some more powerof TX2 arrived, since the antenna at the university is quitedirectional and the location is not located in the main beam.Nevertheless the SFN setup with delay enhances the receptionquality significantly as summarized in Table II. Due to thedifference in the median field strength of over 7 dB in the
European Wireless 2012, April 18-20, 2012, Poznan, Poland ISBN 978-3-8008-3426-9 © VDE VERLAG GMBH

−35 −30 −25 −20 −15 −10 −5 010
−4
10−3
10−2
10−1
100
Normalised powerlevel g [dB]
Pro
babi
lity
(pow
erle
vel <
g)
TX1TX2SFN delaySFN nodelay
Fig. 9. Cumulative distribution function in ’Bult’
single transmitter modes, the SFN modes result in a lowermedian field strength than with only TX2. However the SFNmode with delay still enhances the reception quality. With nodelay added in the SFN mode, the standard deviation is gettinghigher, reception quality is getting worse here compared to theSFN mode with delay.
E. Measurements in mixed surrounding
On the route in ’Limmer’ measurements have been con-ducted with only TX1 and only TX2 and in the SFN mode withdelay. The results in Table II show clearly the enhancementof reception in the SFN mode. Although the median receptionfield strength was not equal from both transmitters, the biterror rate (BER) and audio error rate decrease with bothtransmitters switched on at half power. Due to the differentmedian field strength the standard deviation of the SFN modeis in between the ones with one transmitter. However thesecond transmitter could fill deep fades which occur in thepropagation path from one side.
Additional details on the measurement results are given in[12].
F. Cumulative distribution function
As the median field strength levels from each transmitter atthe location ’Bult’ are almost equal, a cumulative distributionfunction (CDF) of the field strength levels was calculated asseen in Figure 9. This shows clearly that while the CDF of theSFN without delay is even worse than the CDF of the singletransmitter modes, the CDF of the SFN with delay shows alower probability of deep fades.
V. CONCLUSION
In this paper the first DRM+ SFN setup in the air waspresented. Comparing the reception of the SFN with the resultsof an one transmitter setup with equal power in differentenvironments, the SFN enhanced the reception performancesignificantly.
Results show that due to the small bandwidth of the DRM+system, care has to be taken in the planning to avoid flat fadingin the overlapping area when transmitting with the same powerfrom each TX. Adding a different delay to transmitters lyingside-by-side is one solution to overcome the flat fading. Adelay > 15 μs showed good results in the calculations. In thefield trial conducted with two TX, the reception performancein the SFN could be enhanced, adding a delay of 31 μs toone of the transmitters, the probability of deep fades becamesmaller.
REFERENCES
[1] ETSI. ES 201 980, Rev.3.1.1., Digital Radio Mondiale (DRM), SystemSpecification. 2009.
[2] ITU. ITU-R BS.1114, Recommended Digital Radio Standards above 30MHz. 2011.
[3] L. Yang, R. Lv, and Z. Yang. Optimizing quality of service of DRMsingle frequency network. In Circuits and Systems for Communica-tions, 2008. ICCSC 2008. 4th IEEE International Conference on, page450–454.
[4] J. Lehnert. First results on compatibility and coverage analyses of DRM+single frequency networks (SFN) in the VHF band II. In 10th Workshopon Digital Broadcasting, 2010.
[5] A. Ligeti and J. Zander. Minimal cost coverage planning for singlefrequency networks. Broadcasting, IEEE Transactions on, 45(1):78–87,1999.
[6] R. Brugger and K. Mayer. RRC-06 — Technical Basis and PlanningConfigurations for T-DAB and DVB-T. EBU TECHNICAL REVIEW –April 2005.
[7] J. R. Perez, J. Basterrechea, J. Morgade, A. Arrinda, and P. Angueira.Optimization of the coverage area for DVB-T single frequency networksusing a particle swarm based method. In Vehicular Technology Confer-ence, 2009. VTC Spring 2009. IEEE 69th, page 1–5, 2009.
[8] Hong Jiang, Paul A. Wilford, and Stephen A. Wilkus. Providinglocal content in a hybrid single frequency network using hierarchicalmodulation. IEEE Transactions on Broadcasting, 56(4):532–540, 2010.
[9] B. Muller and J. Philipp. Flat Fading in Mittelwellen-DRM-Gleichwellennetzen. Advances in Radio Science Vol. 5, pages 359–365,2007.
[10] F. Maier, A. Tissen, and A. Waal. Evaluations and measurements of atransmitter delay diversity system for DRM+. In Wireless Communica-tions and Networking Conference,2012. IEEE-WCNC, 2012.
[11] S. R. Saunders and A. Aragon-Zavala. Antennas and Propagation forWireless Communication Systems. Wiley, 2007.
[12] International Telecommunications Union - Radiocommunication StudyGroups, ’DRM Single Frequency Network Field Test Results’, ITU-RDocument 6E/504E, May 2011.
European Wireless 2012, April 18-20, 2012, Poznan, Poland ISBN 978-3-8008-3426-9 © VDE VERLAG GMBH