evaluative feedback: how k-12 teachers respond
TRANSCRIPT
Walden UniversityScholarWorks
Walden Dissertations and Doctoral Studies Walden Dissertations and Doctoral StudiesCollection
2016
Evaluative Feedback: How K-12 Teachers RespondDeEtta Lorick AndersenWalden University
Follow this and additional works at: https://scholarworks.waldenu.edu/dissertations
Part of the Educational Administration and Supervision Commons, Educational Assessment,Evaluation, and Research Commons, and the Education Policy Commons
This Dissertation is brought to you for free and open access by the Walden Dissertations and Doctoral Studies Collection at ScholarWorks. It has beenaccepted for inclusion in Walden Dissertations and Doctoral Studies by an authorized administrator of ScholarWorks. For more information, pleasecontact [email protected].

Walden University
College of Education
This is to certify that the doctoral dissertation by
DeEtta Andersen
has been found to be complete and satisfactory in all respects,
and that any and all revisions required by
the review committee have been made.
Review Committee
Dr. Ruby Burgess, Committee Chairperson, Education Faculty
Dr. Wade Smith, Committee Member, Education Faculty
Dr. Gary Lacy, University Reviewer, Education Faculty
Chief Academic Officer
Eric Riedel, Ph.D.
Walden University
2016
Abstract
Evaluative Feedback: How K-12 Teachers Respond
By
DeEtta Andersen
MS, University of Iowa, 1984
BS, Iowa State University, 1981
Dissertation Submitted in Partial Fulfillment
of the Requirements for the Degree of
Doctor of Philosophy
Education
Walden University
June 2016
Abstract
This sequential mixed methods study addressed the need for research that both described
and explained how teachers of varying experience respond to administrative evaluative
feedback. Formative evaluation theory of Scriven and professional growth models of
Steffy and Fessler served as theoretical models for data analysis. An online survey asking
teachers how they changed their practices and what accounted for their response was
received from 270 teachers in 1 Midwestern state. Of these, 9 teachers of varying
experience were interviewed. The quantitative data showed that most teachers do not
change practices on the 8 state teaching standards in response to feedback. An
independent sample t test revealed statistically significant differences between teachers of
varying experience in 3 standards: support of district goals, classroom management, and
instruction. . An ANOVA found no significant effect between teaching experience and
the length of time since the feedback was provided to the teacher. Qualitative data found
a variety of social, personal, organizational, and student-based needs that accounted for
teachers’ response to feedback. In teachers that made changes to practices, administrator
suggestion was the most important factor, but conversations with colleagues were also
important. However, most teachers did not receive formative feedback. Organizational
factors such as state initiatives to change instruction influenced teachers of more
experience than novice teachers. These findings can help administrators improve the
formative effect of their feedback. Understanding how evaluative feedback leads to
changes in teaching practices should improve feedback systems in schools across the
nation which subsequently should lead to in more effective teaching practices.

Evaluative Feedback: How K-12 Teachers Respond
by
DeEtta Lorick Andersen
MS, University of Iowa, 1984
BS, Iowa State University, 1981
Dissertation Submitted in Partial Fulfillment
of the Requirements for the Degree of
Doctor of Philosophy
Education
Walden University
May 2016

Dedication
This study is dedicated to my husband, Philip Andersen.
Acknowledgments
I want to acknowledge the support of Dr. Burgess and Dr. Smith on the Walden
faculty.
I also want to acknowledge the support of my family. My husband, to whom this
work is dedicated, and my children, Lorick, Eva, and Alex all who recognized that I had
to do this even if it meant vacations and camping trips had to have internet connections!
i
Table of Contents
List of Tables .......................................................................................................................v
Chapter 1: Introduction to the Study ....................................................................................1
Background ....................................................................................................................3
Problem Statement .........................................................................................................6
Purpose ...........................................................................................................................6
Research Questions and Hypotheses .............................................................................7
Research Questions ................................................................................................. 8
Theoretical Framework ................................................................................................11
Nature of Study ............................................................................................................14
Definitions....................................................................................................................17
Assumptions .................................................................................................................18
Ethical Considerations .................................................................................................19
Scope and Delimitations ..............................................................................................20
Delimitations ......................................................................................................... 20
Limitations ............................................................................................................ 22
Significance..................................................................................................................23
For Evaluation Research and Educators ............................................................... 23
For Practice and Policy ......................................................................................... 23
To Society ............................................................................................................. 24
Summary ......................................................................................................................25
Chapter Two: Literature Review .......................................................................................26

ii
Literature Search Strategies .........................................................................................27
History..........................................................................................................................28
Theoretical Foundations...............................................................................................29
Formative Evaluation Theory ............................................................................... 29
Professional Growth Models................................................................................. 39
Model Selection Rationale ...........................................................................................48
Summary ......................................................................................................................49
Chapter 3: Methodology ....................................................................................................51
Setting............................................................................. .............................................51
Research Design and Rationale ...................................................................................52
Research Questions ............................................................................................... 52
Research Design...........................................................................................................56
Role of the Researcher .................................................................................................60
Methodology ................................................................................................................61
Participant Selection and Recruitment .................................................................. 61
Instrumentation ............................................................................................................62
Qualitative Component ......................................................................................... 62
Quantitative Component ....................................................................................... 64
Data Analysis Plan .......................................................................................................68
Quantitative Data Analysis ................................................................................... 68
Qualitative Data Analysis ..................................................................................... 69
Integration of Qualitative and Quantitative Data .................................................. 70
iii
Threats to Validity .......................................................................................................71
Issues of Trustworthiness .............................................................................................73
Ethical Considerations .................................................................................................75
Summary ......................................................................................................................75
Chapter 4: Results ..............................................................................................................76
Data Analysis ...............................................................................................................79
Results............................................................. .............................................................80
Figure 1. Frequency of Teachers Reporting Changes .......................................................84
Test for Interaction between independent variables ............................................. 91
Conclusion .................................................................................................................116
Chapter 5 ..........................................................................................................................117
Interpretation of the Findings.....................................................................................118
Research Question One: Do teachers make changes to practices in
response to evaluative feedback? ............................................................ 118
Research Question Two: Does experience play a role in teachers’
responses to Feedback? ........................................................................... 121
Qualitative Research Question: What factors account for teacher responses
to Feedback? ........................................................................................... 124
Limitations...........................................................................................................126
Recommendations for Further Research..............................................................132
Implications for Social Change.............................................. ..............................134
Conclusions..........................................................................................................138
iv
References ........................................................................................................................140
Appendix A. Response to Evaluation Survey ..................................................................161
Appendix B. Invitation and Consent for Response to Evaluation Survey and
Invitation for Participation in Interview ..............................................................164
Appendix C. Interview Protocol ......................................................................................167
Appendix D. Consent Form for Interviews......................................................................172

v
List of Tables
Table 1. Years of experience ............................................................................................ 77
Table 2. Months since last evaluative feedback ................................................................ 78
Table 3. Frequency of teachers interviewed in each experience level .............................. 79
Table 4. Numeric Response to evaluative feedback in the eight Iowa Teaching Standards
of all teachers ............................................................................................................ 82
Table 5. Weighted average of responses for all standards ................................................ 83
Table 6. Means and Standard Deviations for each Standard ............................................ 85
Table 7. Means and Standard Deviations for the Eight Standards ................................... 88
Table 8. Means and Standard Deviations for Standard 1 Support of District Goals ........ 92
Table 9. Means and Standard Deviations for Standard 2 Content Knowledge ................ 93
Table 10. Means and Standard Deviations for Standard 3. Planning ............................... 94
Table 11. Means and Standard Deviations for Standard 4. Instruction ............................ 95
Table 12. Means and Standard Deviations for Standard 5. Assessments ......................... 96
Table 13. Means and Standard Deviations for Standard 6. Classroom Management ....... 97
Table 14. Means and Standard Deviations for Standard 7 Professional Growth .............. 98
Table 15. Means and Standard Deviations for Standard 8. Professional Responsibility .. 99
Table 16. Test of Interaction between Time since Last Evaluation (Eval) and Experience
(Exper) .................................................................................................................... 100
Table 17. List of formative and non-formative responses in each of the categories ...... 104

vi
List of Figures
Figure 1. Frequency of Teachers Reporting Changes ........................................................95
Figure 2. Percent of Teachers Reporting Change and No Changes to Each Standard ......95
Figure 3. Reasons Teachers Change Their Practices in Each Category of Response......113
Figure 4. Formative Factors: Top Three Percentages ......................................................116
Figure 5. Non-formative Factors: Top Three Percentages ...............................................116
1
Chapter 1: Introduction to the Study
Educators, legislators, and parents have charged that evaluative feedback
provided to teachers does not contribute toward improved teaching practices (Darling-
Hammond, 2013; Marzano, 2012; Weisberg, 2009). These groups advocate for evaluative
feedback that both indicates if teachers are meeting basic proficiency standards
established by states and fosters professional growth by providing suggestions for
improvements to practices (Darling-Hammond, 2013; Donaldson, 2012; Marzano, 2012;
Ramirez, 2010). For the purposes of this study, evaluative feedback is defined as written
or oral assessment of teaching skills provided by administrators. However, at this time,
research that indicates if teachers change their practices in response to evaluative
feedback is needed. Without this data, the efficacy of evaluation systems cannot be
adequately determined. It is the intent of this study to fulfill the need for research that
determines if teachers respond to administrative evaluative feedback by changing
teaching practices
Current research on evaluative feedback predominantly measures teachers’
perceptions to feedback and has not examined changes to teaching practices (Despain,
2012; Donaldson, 2012; Mahar, 2010; Marzano, 2012; Weisberg, 2009). Most research
focuses on teacher responses to administrative feedback since this is the primary source
of evaluative feedback in elementary and secondary schools in the United States
(Gallagher, 2011). However, few studies exist that examine changes to specific teaching
practices and how the responses to feedback may change over the course of a teacher’s
2
career. The results of this study add to the literature by describing and explaining
changes to teaching practices that teachers make in response to administrative feedback.
Teaching practices in this study are defined as the teaching standards established by the
state under study (Iowa Department of Education, 2013a).
While this study focuses on only one state in the United States, the data should
apply to all states across the country since evaluative feedback is part of every state’s
evaluation system. The findings of this study are ultimately directed toward improving
evaluative feedback nationwide by establishing if feedback affects teaching practices and
what factors account for the way teachers respond to feedback. Improved feedback that
leads to changes in teaching practices should lead to improved instruction and, ultimately,
increased student learning. The field of teacher evaluation will benefit from additional
data to support the development of various evaluation models that provide feedback from
multiple sources. Researchers in the field will be able to use this data as they continue to
investigate how peer and administrative feedback contribute to changes in teaching
practices. Understanding the connection between feedback and change, or lack thereof, is
another critical part of the research focus that will be useful to the field.
In this chapter, the background literature will be summarized, the problem
statement will be defined, and the purpose of this study will be explained. The research
questions will be stated along with the accompanying hypotheses. The theoretical
framework will be briefly summarized and established as the basis from which the
research questions and hypotheses were formed. The rationale for conducting a mixed
3
methods study along with the plan for data analysis will be included. Finally, relevant
definitions, assumptions, delimitations, and limitations will be defined and described.
Background
Most teachers desire formative evaluative feedback (Marzano, 2012), but find the
evaluative feedback they get irrelevant and not useful to their practices (Anast-May,
2011; Benedict, 2013; Darling-Hammond, 2013; Looney, 2011; Mahar, 2010, OECD,
2009; Weisberg, 2009). Typically, teachers receive feedback that is more summative than
formative containing few suggestions for improvement (Gallagher, 2011). While
feedback that is formative is intended to improve instruction, feedback that is summative
is typically used to ensure that the teachers are meeting state requirements (Marzano,
2012). Formative feedback, for example, might provide a teacher with a specific teaching
strategy to try in the classroom, while summative feedback might merely report on
teaching strategies observed. While both types of feedback are necessary, Scriven (1993)
wrote that it is the formative evaluative feedback that plays a role in improving
individuals within an organization. The extent to which evaluative feedback from
administrators and peers is formative can be determined by examining if teaching
practices change as a result of this feedback (Scriven, 1993). In an attempt to understand
if feedback is formative, researchers have examined teacher perceptions of feedback or
student achievement after feedback is received. Mahar (2010) and Anast-May (2011) in
their survey and observational studies, found that teachers perceive feedback as irrelevant
and lacking in specificity. These researchers use this data to infer that teachers may not
4
change their practices as a result (Anast-May, 2011; Mahar, 2010). Daley and Kim
(2010), in observational studies of over 1400 teachers in ten states, found modest
improvements in student achievement after feedback was received, leading them to
hypothesize that teachers might improve their teaching in response to feedback.
However, few studies exist that have focused on changes to specific teaching practices in
response to evaluative feedback.
Most schools in the United States use a single source evaluation model that relies
on administrative observation of teaching practices in the classroom on a periodic basis
(Weisberg, 2009; Gallagher, 2011; Ramirez, 2010). In this model, teachers are evaluated
once or twice a year (sometimes every three to five years) by their principal (Gallagher,
2011). Evaluative observations typically last from twenty to sixty minutes (Darling-
Hammond, 2013). Typically, these evaluations are summative; that is, they are used to
determine if the teacher meets minimum job standards and expectations and not linked to
suggestions for growth (Weisberg, 2009). Reforms in teacher evaluation systems in
response to recent changes to the No Child Left Behind legislation moved states to
include multiple sources of feedback in teacher evaluation systems (Darling-Hammond,
2013; Gallagher, 2011; Hazi, 2009; Humphrey, 2011). In these reformed systems,
administrative feedback is supplemented with peer feedback, student test scores, and
feedback from parents and students (Shackman, 2012; Darling-Hammond, 2012; Hensel,
2008; Ho, 2013). Without data on how administrative feedback affects teaching practices
over the course of a career, these new systems have little baseline data use to compare the

5
formative effect of the additional feedback sources. Thus, there is a need for data that
indicates if evaluative feedback affects changes in teaching practices.
A few recent studies have asked teachers to report on changes they make in their
work, but these have not focused on specific practices (Despain, 2012; Donaldson, 2012;
Mahar, 2010). These few teacher survey studies indicate that focused feedback from an
experienced and respected evaluator who engages in dialog with the teacher results in
change (Anast-May, 2011; Daley & Kim, 2010; Donaldson & Peske, 2010; Rathel, 2008;
Taylor & Tyler, 2012). In addition, these studies indicate that novice teachers respond
differently to feedback than experienced teachers (Daley & Kim, 2010; Papay & Johnson,
2012).
Because the studies noted here do not focus on specific changes teachers make to
their teaching practices, research is needed that focuses on these. While studies exist that
examine how teaching skills and attitudes change over time, little is known about how
they respond to evaluative feedback over the course of their career. This study addresses
these gaps in the literature by providing data that tells the profession about how teachers
changes their practices in response to administrative feedback as well as data that account
for teacher responses to feedback.
In summary, there is a lack of connection between evaluative feedback and
growth in the teaching profession. Donaldson (2012) and Marzano (2012) found that
teachers desire feedback that assists in improving practice while Despain (2012) and
Mahar (2010) found that most feedback is considered by teachers to be irrelevant and not

6
useful in promoting growth. Due to the lack of data that connects evaluative feedback to
growth within the teaching profession, Mahar (2010) suggested that improvements be
made to the evaluative feedback process that might increase its formative impact.
Marzano (2011) found that little is known about if feedback leads to changes in practices
and how evaluative feedback can achieve this effect. While the social, organizational, and
personal factors that influence teacher behavior have been studied in the past (Al-Ahdal,
2014; Maskit, 2011; Richter, 2011; Taylor & Tyler, 2012), few studies have examined
how these might account for teacher responses to evaluation (Weisberg, 2009). Marzano
(2010) emphasized that data is needed that can be used to improve the link between
feedback and improvements to teaching.
Problem Statement
Little is known if teachers make changes to teaching practices in response to
administrative feedback, or what accounts for their response. The aim of this research
was to better understand if teachers make changes to teaching practices in response to
administrative feedback and, if they do, what accounts for their response. Understanding
if and how evaluative feedback leads to changes in teaching practices is critical to school
personnel who establish evaluative feedback systems. These findings provide data that
can be used to improve evaluative feedback in similar situations across the nation.
Purpose
The purpose of this mixed methods study was to examine how teachers respond to
administrative feedback and to understand what accounts for their responses. The
7
quantitative data was collected in an online survey (see Response to Evaluation survey in
Appendix A) and the qualitative data was obtained from both open-ended questions on
the survey and teacher interviews. For the quantitative component teachers rated the
amount of change they made in response to administrative feedback (as defined on the
eight state teaching standards for the state under study) on a four-point scale on the
Response to Evaluation survey. For example, a four represented adding or deleting a
teaching practice added, while a zero represented no changes made in response to
feedback. Thus, the independent variables were 1) the time since the teacher last received
feedback (within the last year, last two years, and last three years), and 2) the experience
of the teacher (0-3 years, 4-9, 10-14, 15 or more). The dependent variable was the
amount of reported change on each State Teaching Standard. The data was analyzed to
determine if a significant relationship existed between teachers’ responses to each
standard and the years since their evaluation and their experience. For the qualitative
component, the factors that account for teachers’ responses to evaluative feedback were
explored using responses on both the open ended questions at the end of the survey and
from teacher interviews. These include the personal, social, and organizational factors
that support or inhibit change. An additional factor, student needs was added as the data
was analyzed.
Research Questions and Hypotheses
A mixed methods approach was used in this study which asked both qualitative
and quantitative questions.
8
Research Questions
Does administrative evaluative feedback change teaching practices in teachers in
the state under study? What determines how teachers respond to evaluative feedback?
Quantitative questions and hypotheses.
RQ1 Do teachers change practices in response to evaluative feedback from
administrators?
H01: There will be no significant relationship between subjects’ change in teaching
practices and evaluative feedback on Standard One.
Ha1: There will be a significant relationship between subjects’ change in teaching
practices and evaluative feedback on Standard One.
H02: There will be no significant relationship between subjects’ change in teaching
practices and evaluative feedback on Standard Two.
Ha2: There will be a significant relationship between subjects’ change in teaching
practices and evaluative feedback on Standard Two.
H03: There will be no significant relationship between subjects’ change in teaching
practices and evaluative feedback on Standard Three.
Ha3: There will be a significant relationship between subjects’ change in teaching
practices and evaluative feedback on Standard Three.
H04: There will be no significant relationship between subjects’ change in teaching
practices and evaluative feedback on Standard Four.

9
Ha4: There will be a significant relationship between subjects’ change in teaching
practices and evaluative feedback on Standard Four.
H05: There will be no significant relationship between subjects’ change in teaching
practices and evaluative feedback on Standard Five.
Ha5: There will be a significant relationship between subjects’ change in teaching
practices and evaluative feedback on Standard Five.
H06: There will be no significant relationship between subjects’ change in teaching
practices and evaluative feedback on Standard Six.
Ha6: There will be a significant relationship between subjects’ change in teaching
practices and evaluative feedback on Standard Six.
H07: There will be no significant relationship between subjects’ change in teaching
practices and evaluative feedback on Standard Seven.
Ha7: There will be a significant relationship between subjects’ change in teaching
practices and evaluative feedback on Standard Seven.
H08: There will be no significant relationship between subjects’ change in teaching
practices and evaluative feedback on Standard Eight.
Ha8: There will be a significant relationship between subjects’ change in teaching
practices and evaluative feedback on Standard Eight.
RQ 2 Does the amount of change to practices each of the eight State Teaching Standards
vary in relation to the number of years of teachers’ experience?

10
H09: There is no significant relationship between the degree of reported change on
Standard One and years of teacher’s experience.
Ha9: There is a significant relationship between the degree of reported change on
Standard One and years of teacher’s experience.
H010: There is no significant relationship between the degree of reported change on
Standard Two and years of teacher’s experience,
Ha10: There is a significant relationship between the degree of reported change on
Standard Two and years of teacher’s experience.
H011: There is no significant relationship between the degree of reported change on
Standard Three and years of teacher’s experience.
Ha11: There is a significant relationship between the degree of reported change on
Standard Three and years of teacher’s experience.
H012: There is no significant relationship between the degree of reported change on
Standard Four and years of teacher’s experience.
Ha12: There is a significant relationship between the degree of reported change on
Standard Four and years of teacher’s experience.
H013: There is no significant relationship between the degree of reported change on
Standard Five and years of teacher’s experience.
Ha13: There is a significant relationship between the degree of reported change on
Standard Five and years of teacher’s experience.
11
H014: There is no significant relationship between the degree of reported change on
Standard Six and years of teacher’s experience.
Ha14: There is a significant relationship between the degree of reported change on
Standard Six and years of teacher’s experience.
H015: There is no significant relationship between the degree of reported change on
Standard Seven and years of teacher’s experience?
Ha15: There is a significant relationship between the degree of reported change on
Standard Seven and years of teacher’s experience.
H016: There is no significant relationship between the degree of reported change on
Standard Eight and years of teacher’s experience?
Qualitative question.
What do teachers report as factors that account for the changes, or lack thereof, in
teaching practices as a result of administrative evaluative feedback?
Theoretical Framework
Notably referred to as one of the three founders of modern evaluation theory, the
work of Michael Scriven (1991, 1993, 2013) set forth the branch of evaluation that Alkin
(2013) labeled as the valuing branch. Influenced by the philosopher of science, Thomas
Kuhn, Scriven advocated a paradigm shift in what he felt was a fundamental erroneous
assumption in evaluation- that evaluators could, if they tried, produce feedback that is
values-free (Alkin, 2013; Scriven, 1993). Reacting to German sociologist Max Weber’s
values-free doctrine, Scriven (1993) believed that merit and worth are inescapable
12
contextual properties of people and things. As a result, Scriven criticized evaluators such
as Guba and Lincoln’s (1989) descriptive evaluative feedback which he considered too
relativistic (Scriven, 1993).
Scriven’s insistence that evaluative feedback could not be values-free led him to
make a clear distinction between formative and summative feedback, both of which he
found essential to the practice of evaluation. In this insistence, he debated with noted
evaluator and statistician, Lee Cronbach, who argued that summative evaluative feedback
was secondary in importance to formative feedback (Alkin, 2013; Scriven, 1993). Scriven
argued that value judgments in the form of summative feedback were essential on both
practical and philosophical grounds (Alkin, 2013; Scriven, 1993). Much of Scriven’s
theory on formative evaluation was developed in reaction to the criterion-referenced,
objective tests developed by educational evaluators Thorndike and Tyler whom he felt
ignored inherent problems with validity and reliability in such tests (Alkin, 2013;
Scriven, 1993). Significant to this dissertation, is his criticism of teacher evaluative
feedback which he felt served only a summative purpose because he viewed them as
primarily criterion-referenced (Scriven, 1993).
Evaluation theory of Scriven (1991) posits that feedback is formative if changes
are made by the evaluatee in response to the evaluation. While organizational change was
the primary focus of Scriven’s work, personnel evaluations were part of the process as
well (Scriven, 1993). Formative evaluative feedback, according to Scriven, results in
changes to the practices of the teacher (Scriven, 1993). Scriven noted that feedback

13
provided by an evaluator is only effective if it is useful to and utilized by the evaluatee in
achieving organizational goals (Scriven, 1993). This consumer-based approach defined
Scriven’s work as he aligned himself with the CIPP (Content, Input, Process, and
Product) model of Stufflebeam (2007) and the utilization-focused model of Patton (Alkin,
2013; Patton, 2002). This theory will be detailed in the next chapter and will serve as the
basis for determining if evaluative feedback from administrators is formative.
Models of professional growth in teaching (Fessler, 1992; Steffy, 2000) set forth
the proposition that experience influences teachers’ responses to evaluative feedback.
Specifically, the Life Cycle of the Career Teacher of Steffy (2000) and the Career Cycle
(Fessler, 1992) both describe factors that influence teachers’ motivation to change over
the span of their careers. These models of teacher growth were based on the descriptive
theories of human growth by both Erikson (1960) and Maslow (1943). Both Erickson
(1960) and Maslow (1943) described the personal and social contexts which moderate
human development. Maslow (1943), described growth as a result of met or unmet needs,
while Erikson (1960) described growth as a resolutive response to psychosocial crises. In
addition to the works just mentioned, Steffy (2000) cited the writings of John Dewey on
teacher motivation as an influence on her Life Cycle model. Fessler (1992) credited
developers of adult stage models such as Levinson (Levinson, as cited in Steffy, 2000)
and Sheehy (as cited in Steffy, 2000) with setting the foundation for his Career Cycle.
The Steffy (2000) and Fessler (1992) teacher growth models are similar in that they
describe growth in a series of stages in which teachers are motivated by personal and
14
social needs. Additionally, like the Erikson (1960) theory, these models link growth to
experience. Both the Steffy (2000) and Fessler (1992) models will serve as explanatory
frameworks from which to examine how social relationships, organizational pressures,
and personal motivation and experience influence teacher responses to evaluative
feedback.
Scriven’s (1991) theory and the Steffy (2000) and Fessler (1992) models served
as the theoretical frameworks for this study and are detailed in chapter two. These
theories and models served as the basis from which the qualitative and quantitative data
was analyzed. The quantitative questions listed above utilized both the Scriven (1991)
theory and the professional growth models of Steffy (2000) and Fessler (1992). The
qualitative research question addressed teacher responses to evaluative feedback. The
Fessler (1992) and Steffy (2000) growth models served as frameworks for analyzing and
interpreting data from teacher interviews.
Nature of Study
This study was conducted using mixed methods research. In mixed methods
research, qualitative and quantitative methods are combined and integrated in a single,
multiphase study (Hanson et al. as cited in Hesse-Biber, 2010). Mixed methods allow
quantitative, numerical data to be combined with words, pictures, and narrative
increasing the generalizability of the findings (Hesse-Biber, 2010). There are a number of
reasons to utilize mixed methods data collection and analysis. First, mixed methods
studies are useful for understanding complex situations involving human interactions
15
because they provide both depth and breadth of information such as that which comes
from analyzing teacher responses to evaluative feedback (Salehi, 2010). Second, mixed
methods research is useful in studies that assess or evaluate program effectiveness which
is the focus of formative feedback (Powell et al., 2008). Third, by integrating both
qualitative and quantitative data, the researcher can both compare data and develop
explanations as will be done in this mixed methods study (Tashakkori & Teddlie, 2003;
Frels & Onwuegbuzie, 2013). Thus, mixed methods was appropriate for this study
because it aims to assess the impact of evaluative feedback on teaching practices and
provide explanations for teacher responses through both survey and interview data.
In this research, teachers in one Midwestern state were asked in a survey to rate
the extent to which they changed their teaching practices (as defined by their state’s
teaching standards) in response to their most recent administrative feedback. In addition,
teachers were interviewed to determine what factors accounted for their response to
evaluative feedback. Responses were compared between the eight standards. In addition,
responses were compared between teachers of varying experience. This mixed methods
study allowed for both a quantitative analysis of teacher responses and yielded qualitative
data that explained these responses.
The Response to Evaluation survey was sent online to 5700 teachers whose email
addresses were publically available in the state under study. A consent form was provided
to all participants. In this forced choice survey, a list of the eight teaching standards
(Iowa Department of Education, 2013a) were listed along with a scale for teachers to rate
16
the amount of change they made to each practice. The first eight hypotheses were tested
using a two-tailed t-test and the last eight were subjected to a 3 X 2 ANOVA. The
independent variables were 1) years of teaching experience, clustered into four groups
(Group 1: 0-3 years, Group 2: 4-9, Group 3: 10-14, and Group 4: over 15), and 2) timing
of evaluative feedback clustered into three groups (Group 1: less than a year ago, Group
2: between one year and two years ago, Group 3: between two years and three years ago).
However, due to the uneven response rate in the four experience groups, data was
aggregated into two groups (less than ten years of experience and more than ten years)
resulting in a 3 X 2 ANOVA. A combination of descriptive statistics, and tests of
significance thus were used to determine: 1) the extent to which teachers changed their
practices in response to evaluative feedback, and 2) if there is a relationship between the
extent of changes to practices and years of experience, and 3) if the time since the last
evaluation was a factor in the reported changed for each level of experience in each
standard.
Teachers who received the email invitation to participate in the study were given
the opportunity to participate in the survey and the interviews (Appendix B). By clicking
on one provided link, teachers were sent to SurveyMonkey to take the survey. By
clicking on another link, they had the opportunity to provide contact information to be
interviewed. Interview were schedules and informed consent was obtained (Appendix D).
In the interviews, teachers were asked to tell what factors affected their responses to
evaluative feedback. To find patterns or consistencies in the interview data and the open
17
ended questions on the survey, content analysis was used (Patton, 2002; Fink, 2002).
Qualitative analysis of the open-ended survey questions and the interview or focus group
data was done to understand relationships between reported changes in teaching practices
and feedback from administrative evaluations. Both inductive content analysis (Patton,
2002; Fink, 2002) and contextualizing data into themes as suggested by Wolcott (1994)
was done to analyze the qualitative data. The themes were contextualized by connecting
them to the evaluation theory of Scriven (1993) to determine the extent to which the two
evaluative sources (administrative and peer) are formative. In addition, since the
receptivity of a teacher to change varies with experience (Steffy, 2000; Fessler, 1992),
qualitative data was compared among teachers in the same experience groups. Qualitative
data was compared to the quantitative data by comparing trends and tendencies
(Creswell, 2013).
Definitions
For the purposes of this research, terminology will be defined as follows:
Administrative evaluation-evaluative feedback specifically regarding teaching
practices from an administrator (Danielson & McGreal, 2000).
Evaluand-the person, organization, or process being evaluated (Stufflebeam &
Shinkfield, 2007).
Evaluatee-the person, organization, or process being evaluated (Shadish, Cook, &
Leviton, 1991).

18
Evaluative feedback-systematic, formal written comments that are a product of a
formal personnel evaluation system (The Joint Committee, 2009)
Formative feedback- evaluative comments specifically regarding teaching
practices written for the purpose supporting teacher growth and development
(Danielson & McGreal, 2000).
Iowa Teaching Standards- a set of knowledge and skills that reflects the best
evidence available regarding quality teaching (Iowa Department of Education,
2013a).
Response to Evaluation Survey-the survey instrument used in this research for the
purpose of determining if any Teaching Standards in the state under study are
affected by evaluative feedback from administrators (adapted from Blank, 2001;
Weisberg, 2009).
Teaching practices- set of knowledge and skills that reflects the best evidence
available regarding quality teaching (Iowa Department of Education, 2013a).
These are the teaching standards that will be used in the survey in this study.
Summative evaluation- evaluative feedback specifically regarding teaching
practices that is used to determine the extent to which evaluatees are in
accordance with the institutions purposes and goals (Darling-Hammond, 2013;
The Joint Committee, 2009).
Assumptions
In this research, the following assumptions were made:

19
1. Teachers are knowledgeable about the Iowa Teaching Standards.
2. The respondents answered honestly and accurately in the survey and
interviews. This affects the accuracy of the findings.
3. The principals completed the evaluation forms in a professional manner based
upon the Iowa Teaching Standards.
Ethical Considerations
Ethical conduct is important in any research project, especially one involving
humans (Creswell, 2013). Ethics must be considered in every stage of the research
process (Creswell, 2013). In this study, teachers were surveyed in an online survey. Some
of the teachers were interviewed face-to-face, others on the phone or computer. All
participation was voluntary, participants signed an informed consent form, and no one
was compensated for their participation. All participants were assured that their responses
would remain of anonymous and confidential. Online participants took the survey on
SurveyMonkey (SurveyMonkey.com) which uses enhanced security measures to protect
anonymity. Interviewees were not referred to by name and only by experience level or
grade level at which they taught.
Interviews were conducted in convenient locations for the interviewees in secure
spaces with comfortable conditions for conversation. Because formal evaluative feedback
is confidential, the participating teachers were assured that the data would be only used to
answer the research questions and not for any other purpose. All participants were given

20
the opportunity to review transcripts and emerging themes, and understood that the data
could be reported in public.
Scope and Delimitations
Scope
Teachers in public schools in the state under study were surveyed and
interviewed. Teachers invited into this study had to have received an administrative
evaluation within the last three years. The interviewees were selected from those that
volunteered and as many as time allowed were interviewed.
Delimitations
There are a number of delimitations to this study. Only teachers in the state under
study were participants. Teachers in pre-school or college faculty were be part of this
study. Only teachers who received administrative feedback in the last three years were
able to complete the survey and participate in interviews. Teachers in both public and
parochial school were conducted since both are subject to state requirements for teaching.
Teacher responses in larger or smaller districts might yield different results due to the
closeness of their relationship with their administrators and colleagues. Teachers in small
districts may have the opportunity to work more closely with their administrator in the
feedback process. In addition, the size of the district may influence the ability of a teacher
to change or be supported in changing their teaching practices.
Because the sample of teachers was a convenience sample, the responses did not
necessarily represent a balanced number of respondents in demographic variables such as
21
experience. A broader sample would be more representative of the populations of
teachers in the United States, in Iowa. Since teacher salaries in the state under study are
not tied to evaluative judgments, the motivation of Iowa teachers to change practices
might differ from teachers in states whose salary is dependent on evaluation results.
Further, this study did not address the accuracy of the evaluations. If the
evaluative feedback was considered inaccurate by teachers, they would be less inclined to
change. The study did not address the various types of evaluation forms or rubrics that
schools use for the administrative evaluations. Some evaluation rubrics may explicitly
address all of the teaching standards of the state under study, and some may do so
tangentially. Differences in the observation criteria, the proficiency scales, and the
discussions (or lack thereof) accompanying the evaluations might yield different results.
Respondents might have been motivated to participate in the study because they have
received either significantly positive or negative evaluative feedback.
Finally, teachers who were not familiar with the state’s teaching standards might
have had difficulty interpreting the survey questions. The greater the familiarity with the
standards upon which they are evaluated, the more closely aligned their responses might
be with the intent of the Response to Evaluation survey questions. Of course, the extent
to which teachers are familiar with the state teaching standards can considerably due to a
variety of factors including experience.

22
Limitations
This research had a number of methodological limitations. The Response to
Evaluation survey is a self-report survey. While self-report surveys can provide insight
into the teacher’s thinking and actions based on their reflections about their own practices
in the classroom (Looney, 2011), they rely on the subjective perceptions of the teacher.
Interviews will be used to triangulate survey responses with responses on the survey in an
effort to improve the reliability of the findings. Convenience samples such as the one to
be used in this study can a source of bias (Teddlie & Tashakkori, 2010). As such, the
sample demographics were compared to that of all teachers in Iowa and teachers in the
United States to analyze generalizability of the findings.
A variety of factors can influence the quality of the data collected and the
inferences that can be made from the data. These include the following:
Various interpretations exist among teachers of what change to teaching practice
means.
Various interpretations exist among teachers of the meanings of the criteria listed
under the eight Iowa Teaching Standards.
The length of time between the feedback and the survey or interviews might
influence the teacher’s memory of either the feedback or any changes made to
their practices.
While the State Teaching Standards are the same for all teachers in this particular
state, administrative evaluative feedback formats are not identical. Thus, some teachers

23
might receive feedback on all the Standards while others might receive feedback on an
only those that were observable at the time of the evaluation. In addition, some teachers
might get marked as proficient or not proficient, while others might get rated on a 5-point
scale (or other non-dual scale). The implications of these limitations will be addressed in
the final chapter of this dissertation.
Significance
For Evaluation Research and Educators
The findings from this study add to the literature that measures the efficacy of
evaluative feedback in promoting changes to teaching practices. Specifically, the data
should assist educators and researchers in understanding if administrative evaluative
feedback is formative. The findings indicated the extent to which teachers change
practices as a result of evaluative feedback. Evaluation systems researchers will benefit
from information about how evaluative feedback can be made efficacious for teachers of
all levels of experience and subject matter, varying experience, and specialties. Finally,
the Response to Evaluation survey, can be used a basis to develop instruments to measure
the effects of evaluative feedback on teaching practices as it will provide the first
teaching practices inventory that specifically relates to responses to evaluative feedback.
For Practice and Policy
The findings should assist administrators and other evaluators (peers, outside
observers, etc.) in providing feedback that is formative. Data should help evaluators
determine what type of feedback results in the most change and what factors account for
24
changes. In addition, educators will learn how feedback may affect teachers of varying
experience and subject matter. Legislators who craft bills that require certain types of
evaluation practices can use the data to better understand how feedback accomplishes its
formative goal. In Iowa, this data can inform the future of evaluation policy and funding
Results will have implications for training programs that evaluators are required to take.
To Society
The need to prepare students in the United States for the challenges presented in
this increasingly technical world, propelled legislators to enact laws aimed at
strengthening teacher quality through evaluative feedback (United States Department of
Education, 2004). To comply with the legislation and receive federal funds, states are re-
designing old evaluative feedback systems as a result (Ramirez, 2010). However, until
data is available that ties evaluative feedback to professional growth, states may be
implementing new systems without knowing if they are any better than the old system.
Evaluative feedback that fosters professional growth benefits all stakeholders-the school,
teachers, and students. Evaluative feedback that does not result in changes in teaching
practice becomes a waste of time for both the evaluator and the teacher (Steele et al.,
2010; Ramirez, 2010; Donaldson, 2012). The intent in Iowa is that evaluations change
teaching practice. However, whether or not evaluations lead to change is not known.
Evaluation systems that are not evaluated for the efficacy of the feedback affect student
achievement and consume administrator time and critical school resources. If
professional growth is an outcome of the evaluative feedback, schools are strengthened,

25
teachers are better able to instruct, and student achievement may increase. Ultimately, all
students will benefit from an evaluation system that improves teaching practices.
Summary
While teachers express a desire for evaluative feedback that assists them in
making changes to their practices, research indicates that current evaluation systems fail
to provide this. Feedback systems aimed at effecting formative changes in teaching
practices have not been adequately researched to determine if they achieve their
purposes. To address this issue, the proposed study will describe and explain teacher
responses to evaluative feedback from administrators. In this chapter, the need for this
study was established by presenting it implications for social changes as well as the gap
in the literature. Thus, once the problem was defined, the purpose of the study along with
the research questions and hypotheses were listed. The theoretical framework for the
study was described. The rationale for conducting a mixed methods study was
established, and the variables for the quantitative and qualitative components were
identified. This was followed by a brief summary of the methodology and data analysis
plan. In chapter two, the literature and theory that supports this study will be presented in
greater detail.

26
Chapter Two: Literature Review
Evaluative feedback is provided to teachers in the public schools in the United
States by administrators as a matter of policy in all states (Gallagher, 2010). Some of that
feedback is summative, reporting on the status of the teacher’s work, while some is
formative, providing suggestions to improve practices (Darling-Hammond, 2013). While
there is a plethora of quantitative research on best methods of providing the feedback and
the accuracy of the feedback (Daley & Kim 2010; Hensel, 2010; Ho, 2013), there are few
studies that connect the feedback to changes in teaching practices. In other words, little is
known if the feedback is formative and results in improvements to teaching (Marzano,
2010; Weisberg, 2009). Further, while experience along with social, organization, and
personal factors that influence teaching practices have been studied (Al-Ahdal, 2014,
Eros, 2013; Gaudreault & Woods, 2013; Maskit, 2011, Richter, 2011, Taylor & Tyler,
2012), little research exists that connects these factors to teachers’ responses to evaluative
feedback. For example, data that describes how experience influences teachers’ responses
to feedback is lacking (Harris, 2014; Marzano, 2010; Weisberg, 2009). The purpose of
this mixed methods study was to examine how teachers respond to administrative
feedback and to understand what accounts for their responses. For the purposes of this
study, evaluative feedback is defined as written and oral feedback provided to teachers by
administrators regarding observations of teaching practices. Evaluation theory of Scriven
(1991) which established the need for feedback that effects change was used as the
27
theoretical basis for this study. In addition, models of professional growth in teaching
(Fessler, 1992; Steffy, 2000) were used to understand the social, emotional, and
organizational pressures on teachers which can influence their ability and inclination to
change.
In this chapter, the search history methods used by this researcher will be
explained. A brief historical perspective on the topic of formative teacher evaluative
feedback will follow. The major theorists to be used in this research will be introduced
and both their theories and the data that supports their work will be presented. A case will
be made for the applicability of these theories to this particular study. A review of the
literature will present what is currently known about the formative effects of evaluative
feedback from administrators well as factors that account for teacher responses to
feedback throughout the span of their careers.
Literature Search Strategies
Research was accessed from the Walden Library and the University of Iowa
Library. Databases in these libraries included ERIC, Academic Search Premier,
Education Research Complete, ProQuest, and Psych INFO. Google Scholar was used
when these databases were limited. Literature was searched in the fields of education,
industrial organization, sociology, and psychology. Bibliography branching was a
technique used to locate additional resources for this review. Many preselected
descriptors were used to search each data base including teacher evaluation, formative
evaluations, adult growth, teacher growth, summative evaluations, administrative

28
evaluative feedback, evaluation systems, supervision, professional learning communities,
school culture, and teacher’s perspectives of evaluation. Searches were limited to peer-
reviewed articles within the last five years. However, some seminal studies earlier than
this were used as they were foundational to the study.
History
Historically, evaluative feedback has been what educators termed summative
(Darling-Hammond, 2013). That is, it was intended to report on the status of teaching
rather than provide suggestions for improving teaching (Darling-Hammond, 2013; The
Joint Committee, 2009). In short, summative feedback was and still is currently used as a
means of making sure teachers meet pre-determined job performance expectations
(Darling-Hammond, 2013; Gallagher, 2011). Formative evaluation theory predicts that
summative feedback will not necessarily produce changes or improvements to the
evaluatee while formative feedback (that which aims to change the evaluatee) will
promote change (Scriven, 1991). Even though formative evaluation theory was proposed
by Scriven in the 1980s, it has been slow to make its way into the established evaluation
systems already in place in education. However, changes spurred by national legislation
at the end of the twentieth century shifted the emphasis from measuring teacher quality to
improving teacher quality (Odden, 2011).
With the emphasis on teacher quality in the No Child Left Behind legislation at
the end of the last century, the focus on teacher evaluations was renewed. As a result of
this legislation, feedback systems were revised in many states to include multiple
29
evaluators (Marzano, 2010). The intent was to make the evaluations more accurate,
differentiate between low and high performing teachers, and to effect changes in
practices (Norman, 2010). A common addition to teacher evaluation systems was the
addition of a peer feedback system to supplement that typical administrator feedback
(Gallagher, 2011; Marzano, 2010). Feedback models also expanded to include
conferencing with teachers in addition to traditional written feedback (Darling-
Hammond, 2013; Danielson & McGreal, 2000). These multi-source dialogic models of
evaluation were intended to produce changes to teaching which, in turn, would lead to
improved student learning outcomes. However, few studies have examined if teaching
practices change in response. This study examined the most prevalent feedback source,
administrative.
Theoretical Foundations
Formative Evaluation Theory
Research shows that teachers desire formative feedback that leads to improved
teaching practices. Marzano (2012), in a study of over 3000 teachers found that teachers
believed the purpose of their evaluative feedback was to measure and develop skills with
76% favoring feedback that fostered development over measurement. Marzano (2012)
concluded that of the two purposes of teacher evaluation, measurement and development,
that teachers wanted evaluative feedback systems that lead to improved teaching
practices. Similarly, Parker and Volante (2009) found that most pre-service teachers
desired formative feedback because they felt it improved teaching skills more than

30
summative feedback. Scriven (1967, 1991, 1993) defined formative feedback as that
which leads to changes in the evaluatee. Scriven’s (1967, 1991, 1993) evaluation theory
posits that all evaluation must contain both summative and formative feedback because
the purpose of evaluative feedback is twofold: to express the inherent value in the
evaluatee (summative feedback) and to benefit the evaluatee (formative feedback). Thus,
formative feedback is differentiated from summative in that formative feedback is that
which leads to improved instruction, while summative feedback is that which assesses the
status of current instructional practices (Scriven, 1967). It is the formative feedback that
is the subject of this study.
Research indicating that formative feedback improves teaching supports Scriven’s
theory. For example, formative evaluations were found to be critical in improving
teaching in medical schools (Berk, 2009), instruction in environmental education
programs (Richardson et al., 2014), and in instruction in undergraduate programs
(Kealey, 2010, Parker & Volante, 2009). While studies in undergraduate and graduate
schools exist, few exist that focus on how teachers of grades K-12 change their practices
in response to evaluative feedback.
Research on the efficacy of summative and formative feedback confirm Scriven’s
(1991, 1993) theory that both are necessary. Both formative and summative evaluative
feedback was noted to be useful to professors in higher education settings (Kealey, 2010).
Formative assessments (written or oral) of K-12 students have been used to determine
both what the student understands and to inform future instruction (Popham, 2011).
31
Bakula (2010), in a qualitative study with seventh-grade science students, found that she
adjusted her teaching practices in response to frequent formative assessments of her
students. Popham (2011) believed that formative assessments serve as feedback that lead
to improvements in teaching practices and student learning. Even though Popham’s belief
is supported by research in terms of student understanding (Bubb et al., 2013; Clark,
2012; Hudesman et al., 2013), few studies exist that indicate how teachers adjust
practices in response to these assessments. Further, because assessments of student
learning stimulate self-reflection and do not provide specific feedback on teaching
practices, the work of Popham is only applicable in this context because it addresses
formative feedback. Scriven’s theory has been put to the test primarily in higher
education settings. Research that examines the formative effect of evaluative feedback on
teachers of grades K-12 is lacking (Despain, 2012; Donaldson, 2012).
Even though Scriven’s (1967, 1991, 1993) theory has been applied successfully in
improving instruction in higher education, researchers find that teachers in grades K-12
are not getting formative feedback in their evaluations (Despain, 2012; Donaldson, 2012;
Mahar, 2010; Marzano, 2012). Research documents multiples reasons for this. Most
assessment systems are designed to provide only single source summative feedback
which research indicates could be problematic in effecting change (Darling-Hammond,
2013; Gallagher, 2011). Gallagher (2011), in an exhaustive review of all teacher
evaluation programs in the United States, found that single source administrative
32
feedback predominates. Darling-Hammond (2013) noted that limits on administrators’
time allow for evaluation of only minimal competence.
In additions, most systems in the United States rely on brief observations of
instructional practice that are too short to determine if the teacher is meeting pre-
determined standards of practice (Darling-Hammond, 2013). These observations are not
frequent, with the average occurring every three to five years (Gallagher, 2011). Lack of
observation time and lack of observation frequency decrease the opportunity for
evaluators to provide formative feedback. While teachers in a Northeastern school system
perceived feedback to be useful in goal setting, the majority said that the evaluative
feedback did not affect their pedagogy because it was not specific enough to be useful
(Donaldson, 2012). Similarly, teachers in a New York school system reported that the
administrative feedback was vague, irrelevant, and not connected to student achievement
(Mahar, 2010).
Even though it is the norm in the United States, written evaluative feedback alone
is not sufficient to enable teachers to make changes (Darling-Hammond, 2013; Jewett,
2012). Written feedback accompanied by dialog is perceived as more effective than
written feedback alone (Danielowich, 2012; Darling-Hammond, 2013).
Further complicating the ability of feedback to achieve its formative goal is the
concern that administrator evaluators are not always trained for this purpose nor are they
experts in pedagogy in all disciplines (Despain, 2012; Donaldson & Peske, 2012).
Research supports this claim. In a mixed methods study in a school in Texas, Despain

33
(2012) found that teachers perceived feedback as inaccurate. This, in turn, affects
teacher’s response to feedback. Donaldson & Peske (2010), found that teacher
perceptions of evaluator expertise determined how inclined they were to accept the
feedback and change their practices.
Scriven (1991, 1993) wrote that the formative effects of feedback increase if the
evaluator is an expert in the field. In addition, Scriven believed that feedback was more
effective if more than one evaluator is utilized. Research has shown this to be the case
(Daley & Kim, 2010, Hensel et al., 2010; Ho, 2012). Hensel (2010), in a small study,
found that administrator and peer evaluators agreed only 50% of the time on ratings of
teachers’ personal characteristics. Ho (2012) found single source feedback to be
unreliable, but found that administrative evaluators showed less in-group variation than
groups of peer evaluators. Others have found that multiple raters are preferable. Mahar
(2010) found that teachers found multiple feedback sources more helpful than single
source.
Scriven (1991) noted that the evaluator, in trying to provide both summative and
formative feedback, finds themselves in the conflicting role of both coach and judge.
Scriven (1993) wrote that evaluators can be ineffective if they are not empathetic, or if
they limit feedback to only positive findings to avoid conflict. Indeed, Parker and Volante
(2009) found that evaluators struggled in their role while feeling that their formative role
was more important than the summative role. Both novice and experienced principals
struggle to balance their role as manager of instructional operations with their role as
34
instructional leader or coach (Balyer, 2014; Harris, 2014). Weisberg (2009) also
confirmed Scriven’s postulate in his survey of teachers across the United States.
Weisberg (2009) found that 99% of teachers received a satisfactory rating on their most
recent evaluation, he determined that principals had difficulty making fair and consistent
assessments of performances. Weisberg (2009) further concluded that administrators
struggle to provide differentiated feedback and support (Weisberg, 2009).
As noted earlier, teachers desire formative feedback, but do not perceive that they
are receiving it for a variety of reasons such as evaluation frequency and duration,
evaluator expertise, and lack of reliability with single source feedback (Darling-
Hammond, 2013; Despain, 2012; Donaldson, 2012; Gallagher, 2012; Hensel, 2010).
Most studies have focused only on teacher perceptions. However, a few studies have
examined more than teachers’ perceptions of feedback. These studies attempted in a
variety of ways to measure the formative effect of administrative feedback on instruction
at the K-12 level (Anast-May, 2011; Daley & Kim, 2010; Rathel, 2008; Taylor & Tyler,
2012) Descriptions of these studies follows.
Rathel (2008), in a small study of communication skills of teachers, found that
feedback that focused just on communication skills improved teacher behavior in this
area. This study was limited, however, to observations of just two teachers and did not
look at the long-term maintenance of the behaviors. Anast-May (2011) determined that
teachers were more inclined to adopt changes to practices if written feedback was
accompanied by post evaluation conferences. Specifically, conferencing improved

35
teacher’s abilities to set goals in this study. Daley and Kim (2010), in a quantitative
study, measured general teaching skills and found that scores improved after feedback
was provided. While this study did indeed measure teaching practices, it focused on one
specific evaluation system: The Teacher and Student Advancement Program (known as
TAP). Approximately twelve large school systems in the United States use the TAP
program, affecting approximately 20,000 teachers. Taylor and Tyler (2012) found similar
results in a longitudinal study of teachers in the Cincinnati public school system.
Teachers increased their productivity (as measured in student achievement and a skills
inventory) the year in which their evaluation occurred and in the year following. Of the
studies noted here, only the Rathel (2008) and Anast-May (2011) research measured
changes to specific teaching practices.
The state under study requires that administrative feedback be provided once
every three years (State of Iowa, 2013d). The feedback from the teacher’s administrator
is considered a formal part of the teacher’s personnel file in this state. (Iowa Department
of Education, 2013a; Iowa Education Association, 2013).
Scriven’s evaluation theory is important to this study because it addresses the
need for both summative and formative evaluative feedback. The efficacy of formative
feedback, according to Scriven, is related in part on the expertise of the evaluator.
Scriven’s theory of evaluation developed in reaction to prior evaluation theories of Guba
and Lincoln (1989) and Tyler (1967) that did little to address the nature of the evaluative
process (Scriven, 1967, 1993; 2013). Scriven criticized Guba and Lincoln (1989) for their
36
relativistic theory of evaluation, and Tyler (1969) for relying too heavily on criterion-
referenced summative tests to modify curricula (Scriven, 1993). Likewise, he criticized
teacher evaluation systems for relying too much on criterion-referenced approaches
which provided summative feedback without formative feedback (Scriven, 1993).
Because the foundation of his theory is that evaluation is not values-free (Scriven, 1967,
1991, 1993), he found that summative evaluative feedback was inescapable. This
summative feedback, according to Scriven, reflects a judgment on the part of the
evaluator on the essential merit or worth of the evaluand (Scriven, 1967; 1993). Drawing
from the work of Hume on the distinction between facts and values, Scriven articulated a
theory of evaluation that posited that evaluation is a process of establishing the contextual
value of people and things. In doing so, he directly reacted to the value-free doctrine of
German sociologist, Weber (Scriven, 2013) which was later used by Guba and Lincoln
(1989). Most evaluative feedback for teachers in the United States provides this type of
summative feedback in which one person makes a judgment of value on the work of the
teachers as observed in the classroom (Gallagher, 2011).
Even with this emphasis on the essential nature of summative evaluation, Scriven
(1967, 1991, 1993) realized the deficit in summary judgments alone. As a result of dialog
with the statistician and evaluator, Cronbach, he realized that summary judgments were
subject to evaluator bias, and that attempts to resolve this via statistical methods were
themselves subject to bias (Scriven, 1991). In addition to relying on the work of
Cronbach, Scriven was influenced by the Content, Input, Process, and Product (CIPP)

37
evaluation model developed by Stufflebeam (Scriven, 1991; 1993). The CIPP model of
providing evaluative feedback successfully integrated both summative and formative
feedback through an iterative cycle of feedback, discussion, and goal setting (Stufflebeam
& Shinkfield, 2007). Through this iterative process, the evaluator discerns the needs of
the organization as well as what might be done to meet these needs (Stufflebeam &
Shinkfield, 2007). The outcome is both summative and formative feedback that was, as
Scriven (1991) noted was consumer-based. In the case of schools, the consumer of the
feedback is the teacher, and the outcome is improved teaching practices and increased
student achievement. Using Scriven’s theory as a starting point, other evaluation theorists
and action researchers developed their own systems of providing evaluative feedback to
effect changes in both the evaluatee and the beneficiaries of the product or organization.
Michael Patton (2002) and Fetterman (Donaldson, 2010) used the consumer-based,
formative model of Scriven in developing their models of evaluation applying them
improving the evaluatee and the social value of the evaluatee. Examples of their work
include working with hospitals and medical school to ultimately improve delivery of
healthcare to the patient (Donaldson, 2012). For this study, formative evaluative feedback
is that which intends to improve instruction with the ultimate benefit going to the students
who are the recipients of instruction.
To improve instruction and student achievement, teacher evaluation programs
across the United States have started to incorporate formative feedback (Darling-
Hammond, 2013; Marzano, 2012). By clarifying teaching standards and incorporating

38
peer evaluators, evaluation models such as the Danielson and MacGreal, TAP, PAR, and
the Iowa Peer Mentoring Program state that their aim is to improve instruction and
student learning (Danielson & MacGreal, 2000, Daley & Kim, 2010; Iowa Department of
Education, 2013e; Papay & Johnson, 2012). Even so, the formative effect of this
feedback on instruction has been little documented other than data that documents teacher
perception of feedback. While research in higher education has applied Scriven’s theory
to teaching (Berk, 2009, Kealey, 2010, Pan, 2009), it has yet to be applied to determining
the formative effect of feedback in PreK-12 schools. Further, while the formative purpose
of evaluative feedback has been stated as a goal of school districts (Daley & Kim, 2010;
Papay & Johnson, 2012; State of Iowa, 2011), there is little evidence that it is achieving
this purpose. Thus, Scriven’s theory was used in this study to determine the extent to
which teachers respond to evaluative feedback from administrators by reporting on
specific changes they might make in their teaching practices.
In summary, teacher response to both administrative and has been studied but
much more data is needed. Specifically, studies that measure teacher perceptions of
feedback predominate over studies that measure actual changes to teaching practices.
Only a few studies to date have compared the two sources of feedback, and these have
not examined specific teaching practices. Even fewer studies attempt to explain why
teachers respond to evaluative feedback as they do. This study fills the gap in the
literature by measuring changes to specific teaching practices. Specifically, teachers in
the state under study were asked to report if they changed their practices in any of the
39
eight State Teaching Standards in response to evaluative feedback. These State Teaching
Standards require that teachers demonstrate appropriate content knowledge, classroom
management skills, planning skills, attend to individual student needs, engage in
professional growth, further the goals of the district, use a variety of assessments of
student learning, and fulfill professional responsibilities (Iowa Department of Education,
2012b). In addition, in this study, teachers were asked to account for their responses to
evaluative feedback to better understand what influences teachers to change their
standards of practice in response to feedback over the course of their career.
Professional Growth Models
While Scriven’s (1991) theory lays the foundation for examining if feedback is
formative, it does not examine if formative feedback is accepted by teachers. The
professional growth models of Steffy (2000) and Fessler (1992) assist in understanding if
and why teachers respond to formative feedback. These theories posit that feedback
intended to effect formative changes in teaching may not do so due to a myriad of
personal, social, and organizational factors that influence teaching practices (Steffy,
2000; Fessler, 1992). Indeed, research has shown this to be the case.
The personal disposition of the teacher influences their motivation to change
behaviors (Eros, 2013; Meister & Ahrens, 2011). Meister and Ahrens (2011) found that a
teacher’s personal disposition improves their motivation to change even in the presence
of negative influences from the organization environment, peers, and the administration.
Teachers indicate that an internal sense of empowerment and a positive attitude affect
40
their inclination to grow and change (Meister & Ahrens, 2011). Teachers with high self-
confidence are more likely to remain enthusiastic over the course of their careers (Eros,
2013). Similarly, teachers who seek support systems both within the school and outside
the school are more likely to remain enthusiastic about changing across their career span
(Meister, & Ahrens, 2011). Involvement in a personal avocation such as a hobby
increases the chance that teachers will resist stagnation and be more inclined to change
(Meister & Ahrens, 2011). Both the Steffy (2000) and Fessler (1992) models describe
how a teacher’s disposition operates to effect changes in practices. Steffy (2000) related
self–reflection, patience, energy, self-reflective capacity, and a sense of self-efficacy to
teacher behavior. Fessler (1992) listed the personal environment as one of the three hubs
of his model (organization influences and experience being the other two) which included
personality traits such as motivation and sense of self-efficacy as well as out of school
hobbies. Even so, while research supports the influence of personal disposition on
motivation and enthusiasm, data that relate this to response to evaluative feedback are
lacking (Eros, 2013; Meister & Ahrens, 2011). In the study proposed here, personal
dispositions of teachers will be examined to determine their influence on the formative
effects of evaluative feedback.
In addition to personal disposition, both Steffy (2000) and Fessler (1992) noted
that teachers’ social relationships influence their behavior. Both the Fessler (1992) and
the Steffy (2000) models predict that the relationships teachers have with their
colleagues, administrators, out of school contacts will impact the decisions they make in

41
the classroom. Research indicates that these relationships do indeed influence teacher
growth (Anast-May, 2011; Gaudreault & Woods, 2013; Meister & Ahrens, 2011; Richter,
2011). Physical education teachers cited difficult relationships with principals as a reason
for frustration that leads to stagnation in growth (Gaudreault & Woods, 2013). Similarly,
positive relationships with administrators increase the motivation of teachers to grow
professionally (Meister & Ahrens, 2011). Anast-May (2011) found the face to face
conferences between teachers and administrators promoted changes in teacher behavior.
Likewise, both models state that relationships with colleagues influence teacher behavior.
Teachers report relationships with colleagues to be useful in acquiring resources and
making changes (Gaudreault & Woods, 2013). Negative relationships with colleagues
have been found to negatively influence teacher motivation (Gaudreault & Woods, 2013).
Interestingly, at some stages in the teacher’s career, peer relationships are less important
than at others. Richter (2011) for example, found that teachers depended less on peer
feedback as careers progressed (Richter, 2011). A final social connection, to the family,
was cited by both models as influencing teacher behavior. Research supports this.
Teachers cited family support as an influence their motivation (Meister & Ahrens, 2011).
While research supports the relationship between positive social networks and teachers’
motivation and ability to access resources for instructional change (Anast-May, 2011;
Gaudreault & Woods, 2013; Meister & Ahrens, 2011; Richter, 2011), data do not
document how social networks influence teachers’ response to evaluative feedback.
Studies on social relationship and personal disposition support the predictions made in
42
the Steffy (2000) and Fessler (1992) models that describe the psychosocial factors that
influence teacher behavior (Anast-May, 2011; Eros, 2013; Gaudreault & Woods, 2013;
Meister & Ahrens, 2011; Richter, 2011). However, for these changes to take place, the
organization has to support change.
Organizational change is supported by a change-enabling organizational
environment (Fessler, 1992; Steffy, 2000). The organizational environment is a general
term that applies to the rules, regulations, and policies that influence how able and willing
a teacher is to make changes to practices (Fessler, 1992; Steffy, 2000). The management
style of the administration is included in this category. While Steffy (2000) focused on
the management style of administrators, Fessler (1992) noted that organizational support
also comes in the form of school policies that enable growth, union support or pressure,
professional organizations, and public trust. Teachers with administrators that increase
the demands of the job without allowing teachers to have the time or resources needed to
meet these demands find themselves declining in motivation (Gaudreault & Woods,
2013). Others have found that opportunities for teachers to engage in leadership
opportunities within the school positively influence their attitude toward change (Meister
& Ahrens, 2011). Similarly, Bracken (2011) found that opportunities for teacher
leadership improved the inclination of teachers to adopt changes. The absence of systems
that provide formal praise or systematic feedback negatively influence teachers’
inclination to change (Meister & Ahrens, 2011). While teachers progress through stages
of cognition and skills as they construct meaning from experience and training, most

43
research has decontextualized their work (Antoniou, 2013; Creemers, 2013). Antoniou
(2013) noted that a supportive context is critical to promoting growth and that contextual
influences such as organizational support must be included in data on instructional
change. However, these studies did not examine teacher responses to evaluative feedback
in this context. Further, while they explored teacher perceptions, no data exists that
quantifies instructional change and relates it to organizational influences. These data are
especially relevant to this study as evaluative feedback from administrators is part of
every school system’s evaluation program (Gallagher, 2011). In this study, teachers were
interviewed to determine how organizational support, along with psychosocial factors,
influences their responses to evaluative feedback.
Inextricably linked to these psychosocial and organizational influences on teacher
behavior is the experience of the teacher. Both Steffy (2000) and Fessler (1992) described
how these factors influence the teacher at different stages of their career. The stages
described by these theorists were based on the work of other psychosocial developmental
theorists such as Erikson (1963). Steffy (2000) noted that teachers grappling with
Erikson’s (1963) conflict of intimacy versus isolation might find it difficult to move
forward with professional goals. Fessler (1992) listed personal crises and consequent
efforts to cope as a significant part of his model. In addition to Erikson, both Steffy
(2000) and Fessler (1992) incorporated the ego development model of Loevinger (as
cited in Fessler, 1992) into their models. Fessler, for example, noted that the Loevinger
(as cited in Fessler, 1992) model of growth appropriately related to teacher development
44
because the stages of growth are not necessarily hierarchical. While both theorists argued
that teachers increase in expertise with time, they also recognized the organizational
structures that support or inhibit change along the way, leading some to grow and others
to stagnate. Like Erikson (1963) and Loevinger (as cited in Fessler, 1992), both Steffy
and Fessler divided development into a series of stages that were differentiated by inner
personal desires, social support systems, organizational support, and experience. Steffy
(2000) and Fessler (1992) used these models as a basis to develop their own that applied
specifically to the teaching profession. Through teacher observation and interviews,
Steffy (2000) and Fessler (1992) developed and names a series of stages through which
teachers typically progressed. These stages and the research supports the role of
experience in these models will be described next.
In 1992, Fessler proposed a model of teacher growth called the Career Cycle. He
suggested that the teachers proceed through eight stages during their career: pre-service,
induction, competency building, enthusiastic and growing, frustration, stability, wind-
down, and exit. Supported by data from interviews with teachers and case studies, Fessler
(1992) devised this model to describe the typical teacher at each stage Less experienced
teachers in the induction phase are typically overwhelmed by the demands of the new job
and less inclined to add new practices as they strive to establish basic skills (Fessler,
1992). Teachers in the competency building stage, however, are eager to learn and seek
out learning experiences (Antoniou, 2012; Fessler, 1992; Maskit, 2011). Maskit (2011),
in a study of 520 primary and secondary teachers, found significant differences between

45
teachers at various stages of Fessler’s Career Cycle in attitudes toward change. In this
study, teachers were more positive toward making changes in the competency and
enthusiasm stages with a decline thereafter to the wind down stage (Maskit, 2011).
Antoniou (2013) found a similar non-linear trajectory of teaching skills over time where
experienced teachers (over three years) showed improved relationships with students but
did not make significant changes in teaching skills. In fact, Fessler’s model predicted that
a teacher’s ability and inclination to change will vary over time as these studies indicate.
Teachers in Fessler’s (1992) wind-down and exit stages were found to be more
influenced by family and personal health concerns than less experienced teachers and be
less inclined to adopt new teaching practices (Fessler, 1992). Thus, Fessler’s model
predicts that the teachers change over the course of their careers in their inclination to
adopt new teaching practices (Fessler, 1992). The intent of formative evaluative feedback
is to improve instruction (Darling-Hammond, 2013; Scriven, 1991; 1993). Fessler’s
(1992) model will be used in this study to determine if experience affects teachers’
responses to evaluative feedback as well as to account for teacher responses.
Steffy (2000) posited a teacher growth model called the Life Cycle of the Career
Teacher. This model has six stages: novice, apprentice, professional, expert,
distinguished, and emeritus. The Steffy (2000) model, like the Fessler (1992) model, is
both an age and stage model in which a teacher’s desire to improve and grow is a
function of both experience and outside influences. The Steffy (2000) model, like
Fessler’s, is also based on extensive teacher interview data and case studies. Steffy’s
46
model, like Fessler’s, is supported by research that indicates that experience acts as an
agent for growth (Al-Ahdal, 2014; Richter, 2011). A descriptive study of English
language teachers in Saudi Arabia, Al-Ahdal (2014) found that experience was a
significant influence on teachers’ growth. Al-Ahdal noted that the promotion of these
teachers was dependent on meeting professional growth standards and, in turn, dependent
on years of experience. Similarly, Richter (2011) found that experience affected whether
or not teachers made changes to teaching practices, with teachers in the mid-career stage
more likely to change compared to other stages. These studies did not examine how
teachers responded to evaluative feedback and asked teachers to make generalizations
about their growth without mention of specific teaching practices.
These experience-based models of teacher growth are not without criticism.
Taylor and Tyler (2012), for example, found that the largest gains in teacher effectiveness
occurred in the first three to five years on the job. Antoniou (2013), in a longitudinal
study of teaching stages, found the greatest growth occurred in the first three years. The
existence of a stability stage was confirmed by this research, but Antoniou (2013) found
it occurred earlier than Steffy (2000) predicted. Steffy (2000) and Fessler (1992)
acknowledged that teachers grow in this period but indicated that gains in effectiveness
were more likely to be noticed well past the pre-service and novice stages. In addition,
since many studies on teaching stages have been cross sectional, it is possible that
different growth trajectories might be observed if longitudinal studies were more
common (Antoniou, 2013; Creemers, 2013). Longitudinal studies, Antoniou (2013)
47
asserted, might produce a different picture of professional development. In this study, the
explanation of any observed relationship between experience and teachers’ responses to
feedback will need to take into account these varying ideas on when greatest growth is
expected.
Steffy (2000) found that teachers in the expert stage use student feedback
(assessment results or individual student learning styles) to monitor and adjust their
instruction. Bakula (2010), in a qualitative study of seventh-grade science students, found
that student responses to formative assessments could be used to modify instruction.
Congruently, Kyriakides and colleagues (2009) found that more experienced teachers
were able to differentiate instruction based on what they learn as they work with
individual students. Fessler (1992) also noted that more experienced teachers plan
instruction based student feedback.
Teachers in Steffy’s (2000) professional stage were highly influenced by social
factors including relationships with peers. In the professional stage teachers
characteristically seek new curriculum ideas, are open to reforms, and seek counsel from
peers (Antoniou, 2013; Gaudreault & Woods, 2013; Steffy, 2000). Gaudreault and
Woods (2013) found that relationships were indeed important to teachers in this stage and
critical to their progression from one stage to the next. While the Fessler (1992) model
described teachers as less interested in changing as they approached the end of their
career, the Steffy (2000) model focused on factors that enabled continued growth even
into retirement. Fessler posited that after a period of growth, teachers in the last stages
48
make decisions to retire based on frustration with their job and increased interest in
avocations and family. Steffy (2000), on the other hand, developed a model that predicted
that more experienced teachers will engage in education as advocates and reformers as
they reach the last stages and continue into their retirement years. This difference in these
models is critical to note when data from more experienced teacher interviews are
analyzed. Teachers in Steffy’s (2000) emeritus phase stayed involved in education as
volunteers and policy advocates. In this study, only active teachers were participants so
no emeritus stage teachers were surveyed or interviewed.
Model Selection Rationale
As noted above, Scriven’s (1991) formative evaluation theory was used to
determine if evaluative feedback from administrators is formative. While studies cited
above describe the need for formative feedback and the desire of teachers to receive the
feedback, they have not quantified the changes to teaching practices. Instead, researchers
have used surveys and interviews to ascertain qualitative data on teachers’ general
perceptions of the usefulness of evaluative feedback. In this study, the changes to
teaching practices were quantified by asking teachers to rate the change they made to
their practices on a four-point scale (no change, minor change, significant change to an
existing practice, or added an existing practice). The Steffy (2000) and Fessler (1992)
models will be used to explain why teachers responds to feedback as they do. The studies
that supported the stage models of teaching and the influences on teaching were primarily
from teacher interviews. These qualitative data add a depth of understanding to these
49
studies. Thus, qualitative data were added to and integrated with the quantitative data in
this study. Thus, this mixed methods study both quantified changes to teaching practices
and explained what influences teachers to make changes. Data from the teacher survey
was used to quantify changes made to teaching practices and interview data helped form
explanations for why teacher responded to evaluative feedback as they did. Because these
teacher growth models emphasize the personal, social, and organizational factors that
influence teacher action over the span of their career, they address both experience and
context. Because they provide a general model of professional growth over time, they can
be readily applied to specific practices of Iowa teachers. In the Response to Evaluation
survey, responses of teachers among various levels of experience were compared. In the
teacher interviews, the researcher asked teachers how personal, social, and organizational
contexts influence their response to evaluative feedback. As noted above, Scriven’s
(1991) formative evaluation theory was used to determine if evaluative feedback is
formative. The Steffy (2000) and Fessler (1992) models were used to explain why
teachers responds to feedback as they do.
Summary
In this chapter, the literature that relates to this study was reviewed. The work of
the authors of the theories upon which this study is founded were described along with
research the supports these theories. The relationship of these theories to this study was
explicated. Literature that related specifically to teacher responses to administrative
evaluative feedback was reviewed, and the strengths and weaknesses of these studies

50
were noted. Critical to this study is the lack of research that specifically examines
teaching practices in response to evaluative feedback. Thus, the formative effect of
evaluative feedback is not known. This review of the literature showed that data are
needed that will provide a quantitative picture of teacher responses to feedback. In
addition, the literature indicates that the formative effect of feedback over the course of a
teacher’s career has not been examined. This research fills that gap. As previously
suggested, although research supports stage models of teacher growth no research has
applied these models to describe and explain why teachers respond to evaluative
feedback as they do. Teacher responses to the Response to Evaluation survey for this
study were used to quantify changes teachers make in response to evaluative feedback to
determine its formative effect. The interviews with teachers in the qualitative part of this
study provided an understanding of why teachers respond to feedback as they do by
applying the professional growth models of Steffy (2000) and Fessler (1992). Thus, data
that applies these models to evaluative feedback adds to the understanding of factors that
influence teacher growth over the span of their career. The review of the literature
indicated that both quantitative and qualitative data are needed to understand if and how
evaluative feedback promotes growth. In the next chapter the rationale for utilizing a
mixed methods approach for this research will be presented.
51
Chapter 3: Methodology
The purpose of this study was to investigate the effect of administrative evaluative
feedback on teaching practices of teachers in one Midwestern state. The quantitative data
ascertained if teachers change their practices in response to evaluative feedback on the
eight State Teaching Standards as well as the extent of the changes. This data was used to
determine if teachers’ responses to evaluative feedback varied among the eight State
Teaching Standards. Further, the data showed changes to teaching practices varied in
response to feedback vary according to the teacher’s experience. The qualitative data
explained what accounts for teachers’ responses to feedback. In this chapter, the research
design will be explained in detail. Specifically, the rationale for the methodology and
sample selection will be described as well as the details of the proposed research design
and data analysis plan. The threats to reliability and validity will be detailed along with
the role of the researchers in ensuring that the study meets all research ethical standards.
Setting
The study was conducted in the Midwestern state in which the researcher lives,
with the participants being PK-12 teachers who have received administrative feedback
within the last three years. This Midwestern state, like every state in the United States,
requires administrative feedback (Gallagher, 2011Iowa Department of Education, 2013b,
2013b). In the state under study, administrative feedback is mandated every three years.
52
Administrative evaluative feedback in this state focuses on the State’s eight teaching
standards (State Department of Education, 2013a). The goal of evaluative feedback is
both summative and formative (Iowa Department of Education, 2013a). That is,
evaluations are conducted to determine if teachers are meeting the standards and to assist
teachers in setting goals for professional growth. While administrators do not explicitly
classify their feedback as summative or formative, the feedback can be considered
formative if it results in changes to teaching practices (Scriven, 1991, 1993, 2013). The
responses of teachers on the Response to Evaluation survey (Appendix A) was used to
determine the extent to which evaluative feedback is formative, resulting in professional
growth. The open-ended questions at the end of the survey and the interviews with
teachers yielded data that explained their responses to this feedback.
Research Design and Rationale
A mixed methods approach was used in this study that asks both qualitative and
quantitative questions.
Research Questions
Does administrative evaluative feedback change teaching practices in teachers in
the state under study? What determines how teachers respond to evaluative feedback?
Quantitative questions and hypotheses.
RQ1 Do teachers change practices in response to evaluative feedback from
administrators?

53
H01: There will be no significant relationship between subjects’ change in teaching
practices and evaluative feedback on Standard One.
Ha1: There will be a significant relationship between subjects’ change in teaching
practices and evaluative feedback on Standard One.
H02: There will be no significant relationship between subjects’ change in teaching
practices and evaluative feedback on Standard Two.
Ha2: There will be a significant relationship between subjects’ change in teaching
practices and evaluative feedback on Standard Two.
H03: There will be no significant relationship between subjects’ change in teaching
practices and evaluative feedback on Standard Three.
Ha3: There will be a significant relationship between subjects’ change in teaching
practices and evaluative feedback on Standard Three.
H04: There will be no significant relationship between subjects’ change in teaching
practices and evaluative feedback on Standard Four.
Ha4: There will be a significant relationship between subjects’ change in teaching
practices and evaluative feedback on Standard Four.
H05: There will be no significant relationship between subjects’ change in teaching
practices and evaluative feedback on Standard Five.
Ha5: There will be a significant relationship between subjects’ change in teaching
practices and evaluative feedback on Standard Five.

54
H06: There will be no significant relationship between subjects’ change in teaching
practices and evaluative feedback on Standard Six.
Ha6: There will be a significant relationship between subjects’ change in teaching
practices and evaluative feedback on Standard Six.
H07: There will be no significant relationship between subjects’ change in teaching
practices and evaluative feedback on Standard Seven.
Ha7: There will be a significant relationship between subjects’ change in teaching
practices and evaluative feedback on Standard Seven.
H08: There will be no significant relationship between subjects’ change in teaching
practices and evaluative feedback on Standard Eight.
Ha8: There will be a significant relationship between subjects’ change in teaching
practices and evaluative feedback on Standard Eight.
RQ 2 Does the amount of change to practices each of the eight State Teaching Standards
vary in relation to the number of years of teachers’ experience?
H09: There is no significant relationship between the degree of reported change on
Standard One and years of teacher’s experience.
Ha9: There is a significant relationship between the degree of reported change on
Standard One and years of teacher’s experience.
H010: There is no significant relationship between the degree of reported change on
Standard Two and years of teacher’s experience,
55
Ha10: There is a significant relationship between the degree of reported change on
Standard Two and years of teacher’s experience.
H011: There is no significant relationship between the degree of reported change on
Standard Three and years of teacher’s experience.
Ha11: There is a significant relationship between the degree of reported change on
Standard Three and years of teacher’s experience.
H012: There is no significant relationship between the degree of reported change on
Standard Four and years of teacher’s experience.
Ha12: There is a significant relationship between the degree of reported change on
Standard Four and years of teacher’s experience.
H013: There is no significant relationship between the degree of reported change on
Standard Five and years of teacher’s experience.
Ha13: There is a significant relationship between the degree of reported change on
Standard Five and years of teacher’s experience.
H014: There is no significant relationship between the degree of reported change on
Standard Six and years of teacher’s experience.
Ha14: There is a significant relationship between the degree of reported change on
Standard Six and years of teacher’s experience.
H015: There is no significant relationship between the degree of reported change on
Standard Seven and years of teacher’s experience?

56
Ha15: There is a significant relationship between the degree of reported change on
Standard Seven and years of teacher’s experience.
H016: There is no significant relationship between the degree of reported change on
Standard Eight and years of teacher’s experience?
Qualitative question.
What qualitative factor(s) account for the changes, or lack thereof, in teaching
practices as a result of administrative evaluative feedback according to teachers?
Research Design
This research aimed to assess the formative effect of evaluative feedback and
explain what social, personal, and organizational factors account for teachers’ responses
to feedback. This study was conducted using a sequential mixed methods research in
which qualitative and quantitative methods are combined and integrated in a single,
multiphase study (Castro, 2010; Tashakkori & Teddlie 2008; Hanson et al. as cited in
Hesse-Biber, 2010). Quantitative research, rooted in the positivistic paradigm, relies on
deductive reasoning based on numerical data (Tashakkori & Teddlie, 2008). Quantitative
data is statistically analyzed and typically aims to employ large sample sizes for the
purposes of improving external validity (Castro, 2010; Creswell, 2013). Quantitative
research methods can yield information from a large number of people providing data
that can be statistically compared (Castro et al., 2010). Qualitative research, on the other
hand, is based in the constructivist paradigm, and relies on inductive logic derived from
typically narrative data (Tashakkori & Teddlie, 2008). Data in qualitative research is

57
typically transformed into themes within the research and theoretical context (Tashakkori
& Teddlie, 2008). Qualitative data can provide a depth of understanding that quantitative
data alone may not (Castro, 2010; Patton, 2002; Frankfort–Nachmias & Nachmias,
2014).
Because research questions in the social sciences are often multi-faceted, more
complex methods, such as mixed methods, are often required (Tashakkori & Teddlie,
2013). Mixed methods are what Tashakkori and Teddlie (2010) call a pragmatic
paradigm of research. Mixed methods research allows quantitative, numerical data to be
combined with words, pictures, and narrative increasing the generalizability of the
findings (Hesse-Biber, 2010). There are a number of reasons to utilize mixed methods
data collection and analysis. First, mixed methods studies are useful for understanding
complex situations involving human interactions because they provide both depth and
breadth of information (Salehi, 2010). Second, mixed methods research is useful in
studies that assess or evaluate program effectiveness (Powell et al., 2008; USAID, 2013).
In fact, the United States Agency for International Development (2013) recommended
that evaluation research, such as is proposed here, use a mixed methodology. Thirdly, by
integrating both qualitative and quantitative data, the researcher can both compare data
and develop explanations (Tashakkori & Teddlie, 2008; Frels & Onwuegbuzie, 2013).
Finally, mixed methods can provide a deeper understanding of why change is or is not
occurring (USAID, 2013). Thus, mixed methods are appropriate for a study such as this
that aims to quantify the impact of evaluative feedback on teaching practices and explain
58
why teachers respond to feedback as they do. The survey in this study provided
quantitative data on teacher responses to feedback as well as some qualitative data on
what accounted for teacher responses to feedback. The structured interview data
accounted teachers’ responses to feedback.
This mixed methods study determined the impact of evaluative feedback by
asking teachers in the state under study (grades PK-12) to report changes they made to
their teaching practices in response to evaluative feedback from administrators via an
online survey titled, Response to Evaluation (Appendix A). The survey provided a list of
the Teaching Standards for the state under study (State Department of Education, 2013a)
and asked respondents to rate the extent to which they changed their practices as a result
of evaluative feedback from their administrator. The choices ranged from “added or
deleted a practice” to “no changes were made.” Respondents also had the option to tell if
they could not remember if changes were made as well as tell if they did not receive
feedback on the particular standard. A forced choice survey such as this is one in which
respondents are required to select from a set of given responses (Tashakkori & Teddlie,
2008; Wivagg, 2008). This forced choice survey provided quantitative data. In addition,
two open-ended questions at the end of the survey asked teachers to account for their
responses to evaluative feedback.
The sequential mixed methods approach is suitable for this study for a number of
reasons. Sequential mixed method designs use data from one phase of the study to plan
and conduct the other phases (Tashakkori & Teddlie, 2008). As such, the data from the

59
open-ended questions at the end of the survey was used to modify the questions in the
interview protocol. The numerical data from the survey indicated if teachers change
practices in response to evaluative feedback and the extent to which they change (from no
change to added or deleted an existing practice). Because this research focused on the
formative effect of evaluative feedback, based on Scriven’s (1993) formative theory, this
quantitative data addressed the question of how feedback changes teaching practices. The
second component of the research explored the reasons teachers respond to feedback as
they do with questions developed from the models of teacher growth by Steffy (2000)
and Fessler (1992). In mixed methods research, one set of data can expand or enhance the
significant findings from the other (Salehi, 2010). The qualitative data was integrated
with the quantitative data to provide both descriptions and explanations of how evaluative
feedback influences teaching practices. Data from interviews questions in this study, for
example, were compared to the survey data to determine the degree of convergence and
established a measure of reliability via triangulation (Creswell, 2013; Salehi, 2010).
Further, data from the answers to the open-ended questions on the survey were
triangulated with the interview data to improve the reliability of this data. Mixed methods
researchers sometimes assign priority to one component of the research (Creswell, 2013).
In this study, both sets of data had equal weight as they served to complement each other
in developing a more complete picture of teacher response to evaluative feedback.

60
Role of the Researcher
The researcher distributed the Response to Evaluation survey online, collected the
responses online, and statistically analyzed the data. The researcher conducted the
interviews in the qualitative component of the study (Interview Protocol in Appendix C).
All interviewees were thoroughly briefed on the purpose of the study, their roles as
interviewees, and every effort was made to ensure that they were physically comfortable.
While the teachers that participated in the survey were not known to the researcher, a few
of the teachers interviewed were ones that the researcher previously knew. While this
introduced the potential for bias (Creswell, 2013), a well-developed interview protocol
reduced this potential. Included in the protocol, was audio recording of interviews so that
the words of the interviewees could be transcribed verbatim. The researcher transcribed
the interview recordings. In addition, the researcher invited the interviewees to review the
transcripts of their interview to ensure that the transcriptions were accurate (Tashakkori
& Teddlie, 2008). The interview protocol established prior to the interviews ensured that
all participants were treated similarly and were asked the same questions. The researcher
was also to be responsible for coding of the qualitative data and synthesizing this data
with the quantitative data. Member checking is one way to improve the validity of the
data and conclusions (Creswell, 2013). In this study, interview participants were invited
to examine both the transcripts from their interview, and the emergent themes. In all
phases of the study, respondent privacy was carefully guarded. The survey, distributed
via a link on SurveyMonkey, provided the assurance of anonymity. Any identifying

61
information on the open-ended questions or the interview data was extracted. This
included reference to school names and names of colleagues or administrators.
Methodology
Participant Selection and Recruitment
In a mixed methods study, sampling strategies for both qualitative and
quantitative methods apply (Castro et al., 2010). In this study, the population was all
public school teachers in the Midwestern state under study who received administrative
feedback within the last three years. The teacher email addresses were collected from
those that were publically available on school websites. Teachers were under no
obligation to participate. This convenience, voluntary sampling technique resulted in a
non-representative sample, but was one way to try to generate a large enough sample size
for the quantitative component of the study (Tashakkori & Teddlie, 2010). The invitation
to participate had a link to the survey and a note telling teachers that, by clicking on the
link, they provided their consent to participate (Appendix B).
The invitation to participate in the interview was linked to the survey invitation
(Appendix B). Teachers that were willing to participate in interviews will clicked on a
separate link that will provided an opportunity for consent followed by a request for
contact information (Appendix D). By using separate links, no survey responses were
linked to interviewees, ensuring anonymity. Further, participating in the interviews was
not contingent upon completion of the survey. Teachers who provided contact
information were called or emailed to schedule the structured interview. From those who

62
provided consent, a purposive sample of teachers with varying years of experience was
used to achieve comparability (Tashakkori & Teddlie, 2008). Two to three teachers from
each category of experience (0-3 years, 4-9, 10-14, over 15) were contacted, but only one
teacher in the 10-14-year category could be scheduled. Saturation occurs when further
sampling of the population does not yield any new information (Tashakkori & Teddlie,
2010). As many teachers as possible in each category were interviewed to achieve
saturation. Because of the difficulty of locating teachers that were willing to participate,
the sample size could not be estimated ahead of time. The current population of
employed K-12 teachers in the state under study is approximately 36,000. It was the
intent of the researcher to have as many teachers as possible participate in the survey for
the quantitative portion of the study and to have enough teachers interviewed so that all
categories of experience (as defined earlier as 0-3, 4-9, 10-15, over 15 years) are
represented. In actuality, 270 teachers responded to the survey and nine teachers were
interviewed.
Instrumentation
Qualitative Component
Interview data is often used in qualitative research to provide rich, detailed
explanations of phenomena (Tashakkori & Teddlie, 2008). In studies of evaluative
feedback, interviews are used to query teachers about the usefulness of the feedback
(Anast-May, 2011; Danielowich, 2012; Donaldson, 2012; Jewett, 2012; Papay &
Johnson, 2012). In their models of professional growth, Steffy (2000) and Fessler (1992)
63
used interview data to develop descriptions of the personal, social, and organizational
influences on teachers’ behavior. From these data, they developed models that describe
how these factors influence teacher behavior over the course of their professional careers.
Research based on these models confirms that these factors influence behavior, but none
have explored these in the context of evaluative feedback (Al-Ahdal, 2014, Eros, 2013;
Gaudreault & Woods, 2013; Maskit, 2011, Richter, 2011, Taylor & Tyler, 2012). It is
these factors and the relationship to years of experience that were explored in the
interviews. Interview questions were developed that asked teachers to describe why
evaluative feedback may or may not have achieved its formative effect. These data were
combined with answers to open-ended questions at the end of the survey that asked
teachers for the same information.
Questions for the interview protocol are found in Appendix D. The purpose of the
questions was to encourage the teachers to more fully explicate the rationale(s) for their
responses to evaluative feedback from administrators by specifically exploring how
social, personal, and organizational factors influence them. In this protocol, interviewees
were introduced to the study and data collection methods, and signed an informed
consent form (Appendices D). The interview followed the general interview approach as
described in Tashakkori and Teddlie (2008) in which topics and questions are determined
in advance with the sequence and wording to be determined in the course of the
interview. In this study, the topics were the social, organizational, and personal factors
64
that influence teachers’ professional growth as defined in the Steffy (2000) and Fessler
(1992) research.
Teachers that agreed to be interviewed were contacted by phone or email, and a
location and time for the interview was established. Interviews were conducted at a
neutral location, by phone, or via Google Hangouts. The interviews were approximately
30 minutes in length. The interviews were recorded using a voice recorder and field notes
were taken. The recorded interviews were downloaded onto my personal computer that is
password protected. Once the data was coded and organized thematically, all
interviewees were sent transcripts and themes and were asked to provide feedback about
the appropriateness and accuracy of what they read. Any identifying information in
interview data was removed to ensure confidentiality. All participants were assured that
they would have access to the completed study via an email link.
Quantitative Component
Quantitative data in the study was obtained from responses to a Response to
Evaluation survey sent via email to teachers in the selected state (see Appendix A). A
descriptive comparative survey such as this allowed for comparisons between different
groups (Lodico, 2010). This survey asked teachers to estimate the amount of change they
made in response to evaluative feedback. The matrix/rating scale design on
SurveyMonkey allowed the researcher to assign a numerical value to each choice from
four (added or deleted a practice) indicating the most change, to zero, indicating no
feedback was received. With this design, total change and average chance scores were

65
calculated for each teacher and for each standard. This allowed the researcher to
determine the relative formative effect of the feedback, to compare each standard, and to
compare teachers of varying years of experience. The quantitative part of the survey
included the State Teaching Standards (State Department of Education, 2013a). For each
Standard, teachers were asked to report if they received feedback on their most recent
administrative evaluation. If feedback was received, they were asked to rate the amount
of change they made to their practice as a result (did not receive feedback, no changes
were made, minor changes were made, significantly changed what I was already doing,
added a new practice or deleted a current practice). For example, teachers were asked if
they received feedback on the extent to which they used student performance data to
make instructional decisions (one of the State Teaching Standards). If they did, they were
asked rate the amount of change to their practice in this standard. As mentioned above,
responses were assigned a numerical rating from four to zero. Similar surveys have been
used to determine changes in teacher practices (Albright et al., 2013; Despain & Torres,
2012; DeStefano et al., 2006; Kleiger & Yakobovitch, 2011; Penuel, 2008; Tennessee
Department of Education, 2012; Weisberg, 2009). Four point forced choice scales such as
the one used in the Response to Evaluation Survey strike a balance between reliable
response discrimination and survey length (Fox & Contractor, 2008; Wivagg, 2008).
Previous research on teacher change used four to seven point scales with high reliability
(Parise & Spillane, 2010). Reliability in this study will be strengthened by using such a
scale. Given that no other surveys exist that measure the implementation of the Iowa

66
Teaching Standards, other standards based surveys were used in determining the format
and scale (Albright et al., 2013; Despain & Torres, 2012; DeStefano et al., 2006; Kleiger
& Yakobovitch, 2011; Penuel, 2008; Tennessee Department of Education, 2012).
Surveys similar to this have been used to assess the efficacy of evaluative
feedback (Weisberg, 2009; Stecher, 2012; Mahar, 2010). However, this research differed
from other surveys in that the goal was to examine how teachers change specifically
defined teaching practices (The State Teaching Standards, in this case) in response to
evaluative feedback.
The survey was available via SurveyMonkey which uses enhanced security
measures to assure confidentiality of the respondents. Participant’s consent was obtained
when they elected to follow the link to the SurveyMonkey site to complete the survey.
The survey link was available to teachers for one month, and a reminder will be sent once
prior to the closing of the link. All participants were given the email link to the completed
study data in the invitation to participate.
Rationale for use of a self-report survey.
Self- report surveys can be a can provide insight into the teacher’s thinking and
actions based on their reflection specifically about their practices in the classroom
(Looney, 2011). Since subjective information (such as the extent to which a teacher
changes practices) cannot be known to any person other than the teacher, a self-report
survey is one way to ascertain what the teacher does (Giuseppe, 2006). In this case, a
self-report survey was used to determine changes to teaching practices that could not
67
easily be determined by a researcher via observations in the classroom. For example,
changes to planning, communication with families, or ethical conduct are teaching
standards that are not readily observable can be better determined with teacher self-
reports.
Self-report surveys are not without criticism in terms of their reliability (Porter,
2002). Despite opposing views, the self-report survey was found to be reliable in a study
on how well standards were implemented (Desimone, 2010; Mayer, 1999). Mayer (1999)
used self-report surveys to determine the degree to which teachers implement state
standards. In the Mayer (1999) study, the surveys had a reliability of .69 and a correlation
with observational data of .85 (Mayer, 1999). Reliability with open-ended responses was
found to be high (open-ended responses showed 100% fidelity with forced choice
responses) in a survey of math teachers’ practices (Gagnon, 2007). Porter (2002) found
self-report data correlated .7 to .8 with observational data and teacher daily logs. Similar
agreement was found between teachers’ self-report of instructional practices and
observational data from trained observers (Desimone, 2010; Kaufman, 2012). Data from
a self-report survey of principals on school health programs were found to be consistently
reliable in all constructs when compared to direct observation of the same programs
(Nathan, 2013). In addition, internet provided self-report surveys were found to be as
reliable as paper and pencil self-report surveys in a multiphase quantitative study
measuring a variety of constructs including personality profiles and measures of self-
efficacy (Weigold et al., 2013).
68
The issues of reliability with self-report surveys need to be balanced with the
usefulness of obtaining subjective information. Reliability of self-report data is improved
with the use of focus groups prior in initial stages of the survey design (Desimone, 2010).
Ensuring that responses remain anonymous reduces social desirability bias (Desimone,
2010).
Data Analysis Plan
Quantitative Data Analysis
Quantitative analysis of the Response to Evaluation survey addressed the two
research questions and accompanying hypotheses. This first eight hypotheses will be
tested using a two-tailed t-test. The independent variables were 1) years of teaching
experience, clustered into two groups (Group 1 was less than 10 years, and group 2 was
teachers with over 10 years), and 2) timing of evaluative feedback clustered into three
groups (Group 1: within the last year, Group 2: within the last 2 years, Group 3: within
the past three years). A combination of descriptive statistics and a two-tailed t-test was
used to determine: 1) the extent to which teachers changed their practices in response to
evaluative feedback, and 2) if there was a relationship between the extent of changes to
practices and years of experience. Because the survey site only allows some surveys to be
submitted that were not complete, such surveys were deleted prior to the statistical
analyses. Because this was a forced choice online survey, respondents had clear choices
and there was no need for data screening and cleaning.
69
The analysis of variance is used when comparing means of more three or more
groups (Lodico, 2010). This analysis is valid if three conditions are met for the groups in
question: 1) independence of observations, 2) normality in population distributions, and
3) homogeneity of population variances (DeCuir–Gunby. 2008). Since the survey results
of one teacher are independent of any other, the first conditions were met in this study.
Since the group sizes were uneven, the four experience groups were aggregated into two
groups as noted above. Since no significant results were found in the ANOVA test, no
post hoc tests were performed. All data calculations were performed using SPSS (version
21) software.
Qualitative Data Analysis
Inductive content analysis involves review of the data to find both common and
uncommon themes (Apostolos et al., 2014, Castro et al., 2010; Lodico, 2010). This
process includes determining word frequency, looking for common phrases, and inducing
themes (Apostolos, 2014). Wolcott (1994) suggested that patterned regularities be
located in the data. To this end, Castro and colleagues (2010) suggested that strong
themes are present when at least 20% of the codes contain the theme. This type of
analysis has been used in to analyze interview transcripts in a number of studies in which
teachers were interviewed about their practices (Bayler, 2014; Donaldson, 2012,
Danielowich, 2012). For this study, both the interview transcripts and the open ended
questions on the survey were subject to rigorous content analysis. Discrepant data was
noted in the analysis and conclusions. The content analysis for this study was done to
70
understand relationships between feedback from administrative evaluations and changes
teacher make to their practices.
Contextualizing data into a broader analytical framework was suggested by
Wolcott (1994) and Castro (2010). The themes were contextualized by connecting them
to the evaluation theory of Scriven (1993) to determine the extent to which the feedback
was formative. Themes were also organized according to the factors that influence
teacher behavior (social, personal, and organizational) as described in the professional
growth models of Steffy (2000) and Fessler (1992). In addition, since teacher receptivity
to change varies with experience (Steffy, 2000; Fessler, 1992), qualitative data was
compared among teachers in the same experience groups.
Integration of Qualitative and Quantitative Data
Mixed methods research is characterized by integration of qualitative and
quantitative data (Castro, 2010; Heyvaert et al., 2013). In this study, parallel data analysis
was used. Tashakkori & Teddlie (2008) define parallel analysis as that in which data
analyses are independent of each other but work together to answer the research
questions. In this study, both sets of data were necessary to answer how and why teachers
respond to evaluative feedback. The quantitative component provided data to determine
the extent to which evaluative feedback produces a formative effect, and the qualitative
data accounted for the teachers’ responses to feedback. Data from the open-ended
questions in the survey was combined with the data from the interviews as both were
designed to determine the factors that account for teachers’ responses. In addition, trends

71
in the quantitative data were compared to those in the qualitative data especially across
experience groups. To improve validity, theory was used to guide interpretations
(Tashakkori & Teddlie, 2010). In this study, the theories of Scriven (1967; 1991; 1993),
Steffy (2000), and Fessler (1982) were used in the interpretive process.
Threats to Validity
The reliability of self-report surveys was addressed above (Powell, 2002; Reliable
results are those that can be replicated (Creswell, 2013; Tashakkori & Teddlie, 2008).
The validity of self-report surveys was also discussed above. Valid results are those that
reflect the accuracy of the data against a measure of true value (Creswell, 2013).
Inferences made from the quantitative data took into consideration the sample size and
the degree to which it represented the population of teachers in Iowa and the United
States. Threats to external validity include those that inhibit applying findings to a larger
population (Creswell, 2013). A number of issues can arise in this study in this regard.
First, a low response rate on the survey will threaten the validity of the statistical
inferences. Secondly, sometimes respondents who have extreme viewpoints are more
likely to respond (Lodico, 2010). This might also apply to those who elected to
participate in the interviews. Teacher responses to the survey could also be affected by
their attitudes toward evaluative feedback in general. Teachers who have received
negative feedback may respond differently than teachers who have received positive
feedback. Analysis included triangulation of the Response to Evaluation survey results

72
with interview data to develop a more complete understanding of the extent to which
teachers change practices in response to evaluative feedback and address these issues.
In addition, the time between the most recent evaluative feedback and the
responses to the survey was taken into account. Teachers may forget specifics of the
feedback or their responses to it. Further, they may attribute changes to their practices to
the feedback that were possibly due to other pressures. For example, a teacher might be
told in an evaluation to use more formative assessments and then participate in a
workshop on this topic. They may begin to use more formative assessments, but one may
not be able to separate which factor was responsible for the change. It may be that a
combination of factors account for changes to practices. All inferences from the data
were done by comparing and contrasting the responses to both the theoretical constructs
and the most recent literature to improve inference quality (Tashakkori & Teddlie, 2008).
Threats to construct validity of the survey were addressed above. In brief, testing
the survey with a group of teachers to determine both construct validity and scale
appropriateness was done. Disconfirming evidence was carefully examined. Finally,
triangulation of open-ended survey questions (in which teachers tell what influences their
response to evaluative feedback) with interview data on the same concept added to the
validity of interview data. These considerations helped address statistical conclusion
validity and internal validity (Tashakkori & Teddlie, 2008).
73
Issues of Trustworthiness
Guba and Lincoln (1985) suggested that the term credibility should be used to
differentiate the concept of validity in qualitative work from positivistic, quantitative
research. Guba and Lincoln (1985) noted that qualitative data can be made more credible
by use of triangulation, prolonged engagement in the field, and identification of
disconfirming evidence. The interview data was compared to the quantitative findings in
the triangulation process. Interviews were designed to obtain as much information as
possible while still respecting the participants’ time. The plan was to have enough
interviewees to have saturation of data as mentioned in the above section on sampling.
However, in one group (10 to 14 years), only one consenting teacher could be
interviewed. Disconfirming evidence was noted. In this study, no interviewees seemed to
represent extreme views toward their evaluations, either positively or negatively
(compared to the entire sample). To achieve what Patton (2002) called empathic
neutrality, the researcher refrained from expressing opinions about the interviewees’
responses. Finally, field notes on interviewee demeanor and situational events during the
interview were recorded. Thus, reliability was increased by making both procedures and
data known to the reader.
To determine content validity, one must assess the sincerity of the interviewees to
determine if any indication of reporting bias might be present (Flick, 2007). All
interviewees appeared to represent the changes they made in response to evaluation
honestly and openly. In addition, content validity can be ensured by cross checking-a
74
process by which multiple people review the data and interpretations (Tashakkori &
Teddlie, 2008). The interviewees were given the transcripts of their interview as well as
the themes that the researcher detected to provide input to the researcher on the accuracy
of the transcriptions and interpretations (Tashakkori & Teddlie, 2008).
Transferability is the degree to which the findings and inferences can be applied
to others within the population and outside the population (Tashakkori & Teddlie, 2008).
In this case, the sample demographics and size determined this. It was hoped that enough
data would be generated so that findings apply to teachers in the United States in general.
However, the sample size was smaller than expected and represented teachers with over
15 years of experience more than any other category.
Dependability in qualitative data is similar to reliability in quantitative data. To
ensure dependability, all interview data were transcribed verbatim, an interview protocol
(Appendix C) was used. A reflexive journal was kept by the researcher to make sure that
the biases of the researcher and the rationale for decisions were made transparent
(Tashakkori & Teddlie, 2008). All interviews were recorded and transcribed verbatim. In
this case, extended quotes from the transcripts and the open ended responses were
included in the findings section of the paper. Efforts were made to provide thick, rich
descriptions in the findings. Reliability can also be established by making methods
transparent (Flick, 2007). Included in the data were the interview questions, the setting in
which the interview was conducted, and the length of the interviews. The researcher
followed the interview protocol.
75
Ethical Considerations
Attending to the well-being of the participants is of paramount concern to
researchers. In this study, all persons contacted to participate were given the chance to
sign an informed consent (Appendices B and D). They were told that their participation
was voluntary and could be stopped at any time. All responses were kept confidential,
and the survey responses were anonymous. Interviewees were not identified by name or
with any other identifying information in the data presentation. The study was not
conducted until final approval from the IRB had been established (approval number12-
29-15-0310539 expires on 12/28/2016).
Summary
In this chapter, the rationale for this proposed mixed methods study was presented
along with the details of the methodology. Strategies for sampling, details of
instrumentation, and implementation of the study were outlined. In addition, methods of
establishing data reliability and validity were presented. Details of the data analysis were
presented for both the quantitative and qualitative components of the study. Finally, the
ethical considerations for this study were outlined. In the next chapter, the data from the
study will be presented.

76
Chapter 4: Results
The purpose of this mixed methods study was to determine if administrative
feedback was significantly related to changes made to teaching practices of K-12 Iowa
teachers and to examine- factors that accounted for teacher responses. Iowa teachers of
varying years of experience were both surveyed and interviewed to determine how they
might have changed their practices in response to administrative feedback on each of
Iowa’s eight teaching standards. They were also asked to tell what accounted for their
responses or lack thereof. The theoretical foundation established that experience should
influence teaching practices but no studies as of yet have related this to administrative
feedback. Because teachers in this study were asked to recall information, the number of
years since their last evaluation was used in establishing the reliability of the data. In this
chapter, the setting will be described, and the demographics of the sample will be
presented. The process of data collection and analysis will be detailed. Both the
quantitative and qualitative data will be presented and evidence of trustworthiness will be
evaluated.
Setting
An invitation to participate in an online survey was sent to 5700 Iowa K-12
teachers (see Appendix A for survey) in January, 2016. The survey was sent to all sizes
of districts from the largest in the state to the smallest. Invited teachers were those whose
email addresses were publically available on the district website. The response rate may
have been influenced by the time of year since most schools in the state were changing
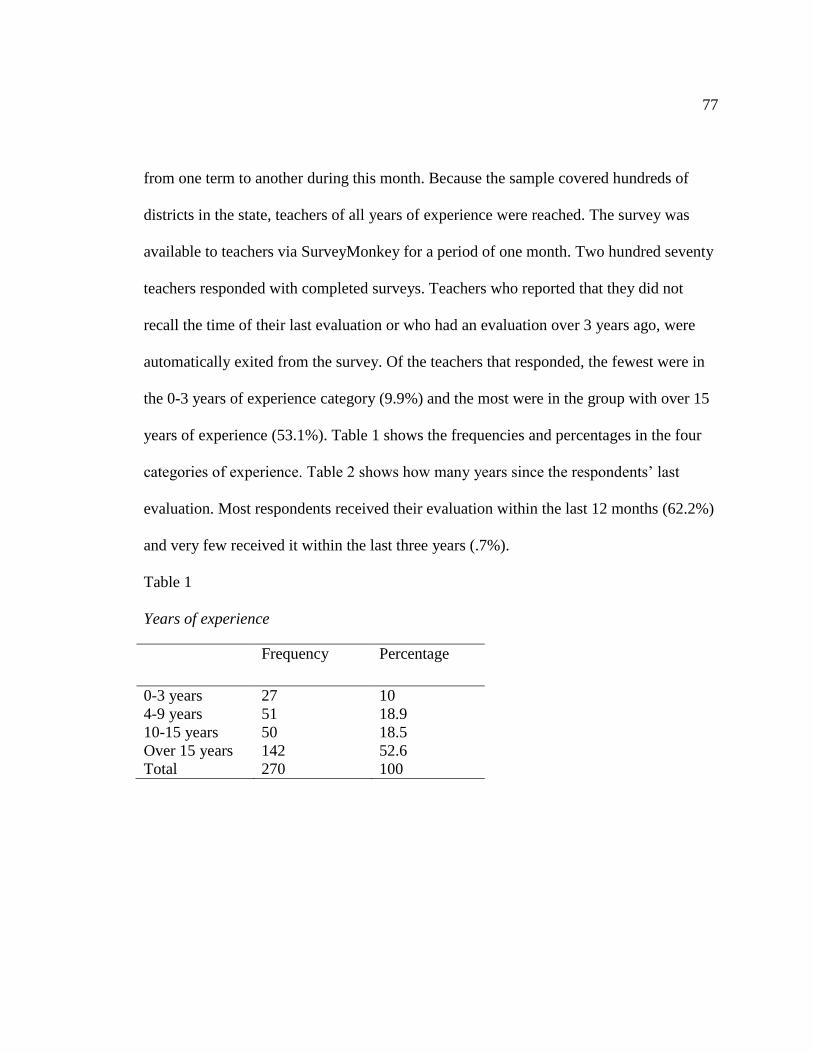
77
from one term to another during this month. Because the sample covered hundreds of
districts in the state, teachers of all years of experience were reached. The survey was
available to teachers via SurveyMonkey for a period of one month. Two hundred seventy
teachers responded with completed surveys. Teachers who reported that they did not
recall the time of their last evaluation or who had an evaluation over 3 years ago, were
automatically exited from the survey. Of the teachers that responded, the fewest were in
the 0-3 years of experience category (9.9%) and the most were in the group with over 15
years of experience (53.1%). Table 1 shows the frequencies and percentages in the four
categories of experience. Table 2 shows how many years since the respondents’ last
evaluation. Most respondents received their evaluation within the last 12 months (62.2%)
and very few received it within the last three years (.7%).
Table 1
Years of experience
Frequency
Percentage
0-3 years 27 10
4-9 years 51 18.9
10-15 years 50 18.5
Over 15 years 142 52.6
Total 270 100

78
Table 2
Months since last evaluative feedback
Frequency
Percentage
Within 12 171 63.3
Within 24 66 24.4
Within 36 33 12.2
Total 270 100
Approximately two weeks after the survey went out, teachers who indicated willingness
to be interviewed were contacted. Fifteen teachers volunteered to be interviewed for the
qualitative part of the study. However, not all these teachers responded to a follow up
email sent to schedule the interview. Of those who responded, the researcher contacted at
least two in each category of experience. If more teachers in each category were willing
to be interviewed, the researcher interviewed as many as time allowed. Therefore, nine
teachers were interviewed to determine what accounted for the changes they made in
response to their feedback. Six interviews were conducted face to face and three were
conducted over the phone. Table 3 shows the number of teachers in each category.
Teachers were interviewed face to face, via Google Hangouts, or on the phone. Although
every opportunity was provided for face to face interviews, a few explicitly preferred the
phone interview. Some preferred to be interviewed in their classroom, others met the
researcher at a coffee shop. Because most teachers preferred remote interviews, fewer

79
were interviewed face to face than expected. Interviews lasted for approximately 30
minutes each and all interviews were recorded digitally. Field notes were kept each time.
All interviews were recorded digitally and transcribed verbatim. Interviewees were sent a
transcript to review for accuracy. All of these teachers had their most recent evaluation
within the past two years. Other than finding a low response rate in the category of
novice teachers, the data collection plan went as planned in Chapter Three.
Table 3
Frequency of teachers interviewed in each experience level
Frequency
0-3 years 2
4-9 years 3
10-15 years 1
Over 15 years 3
Total 9
Data Analysis
As planned in Chapter Three, the ratings of change made in response to feedback
were subject to quantitative analysis. The open-ended questions and interview data were
subject to qualitative analysis. In the quantitative analysis, numeric values (from four to
one) represented the amount of change in each of the eight teaching standards. Average
values and percentages of each value for each standard were compared. Then, tests of
significance determined if the amount of reported change related to teachers’ experience
and the time since their last feedback was received. Because sample sizes for each level

80
of experience varied significantly, the ANOVA was not done as expected. Instead, a two-
tailed t-test was performed for research question one which addressed if teachers made
significant changes in response to feedback. An ANOVA was performed to determine if
there was any interaction between the reported change and the time since the last
feedback as well as experience.
Qualitative data was subject to inductive content analysis. Data were first
organized by experience. Then, responses were coded into four categories that
represented those which both Steffy (2000) and Fessler (1991) wrote were those that
influence teaching practices: personal, social, and organizational. As analysis continued,
it appeared that a fourth category, the needs of the student, emerged that did not fit
categorically into the first three groups. One teachers said, “I would hope that all teachers
would take this into consideration.” Another noted that her practices were influenced by
the personal needs of the students, most of whom came from impoverished families.
Thus, a fourth category of factors that influence teaching practices, student needs,
emerged. Because these codes were broad, teacher responses were easily categorized.
However, some teachers noted factors that influenced their practices that no other teacher
mentioned. These discrepant cases are listed below.
Results
The quantitative data addressed the first two research questions: 1) Do teachers
change their practices in response to evaluative feedback, and 2) Does experience
influence the amount of reported change? The Response to Evaluation Survey (Appendix

81
A) listed the eight teaching standards and provided six weighted response choices. The
most weight was given to “added or deleted a practice” (weight of four) since that
represented the most change. The other response choices in descending order were: made
significant change (weight of three), made minor change (weight of two), made no
change (weight of one), did not receive feedback (zero weight), and do not recall (zero
weight). Table 4 shows the total number of responses in each category for each of the
eight standards, and Table 5 shows the weighted averages for each standard. The
weighted averages for each standard ranged from 1.17 for Standard 8 (Professional
Responsibility) to 1.58 for Standard 5 (Assessments).
Because the zero values affect the mean, they were subsequently removed from
the rest of the statistical analyses. Teachers reporting a zero value either did not get
feedback or do not recall the feedback. In either option, their response to that standard
does not reflect the formative effect of their most recent evaluative feedback.
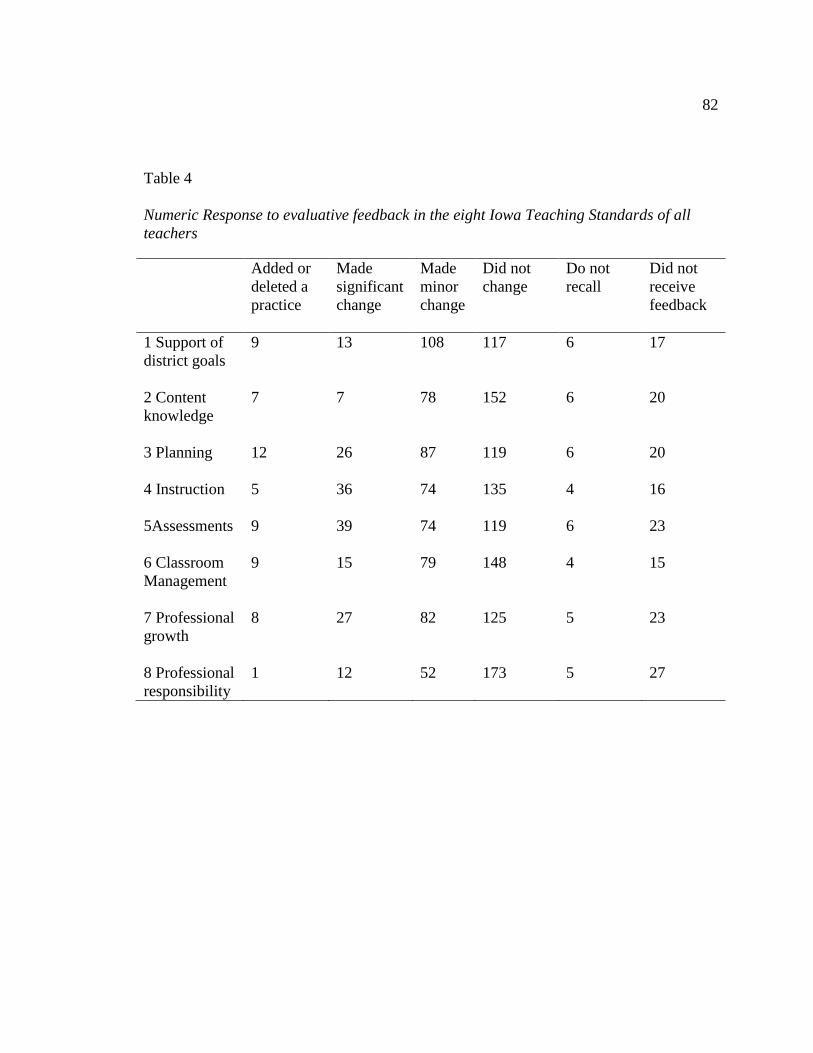
82
Table 4
Numeric Response to evaluative feedback in the eight Iowa Teaching Standards of all
teachers
Added or
deleted a
practice
Made
significant
change
Made
minor
change
Did not
change
Do not
recall
Did not
receive
feedback
1 Support of
district goals
9 13 108 117 6 17
2 Content
knowledge
7 7 78 152 6 20
3 Planning
12 26 87 119 6 20
4 Instruction
5 36 74 135 4 16
5Assessments
9 39 74 119 6 23
6 Classroom
Management
9 15 79 148 4 15
7 Professional
growth
8 27 82 125 5 23
8 Professional
responsibility
1 12 52 173 5 27
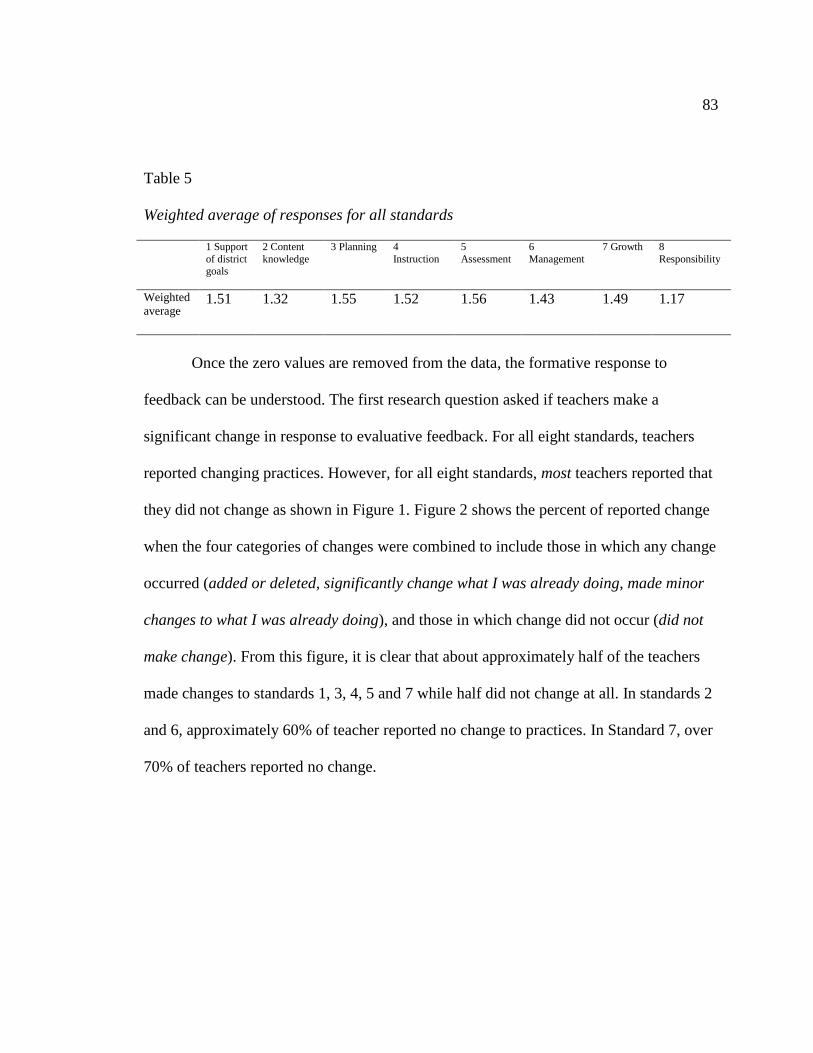
83
Table 5
Weighted average of responses for all standards
1 Support
of district goals
2 Content
knowledge
3 Planning 4
Instruction
5
Assessment
6
Management
7 Growth 8
Responsibility
Weighted
average
1.51 1.32 1.55 1.52 1.56 1.43 1.49 1.17
Once the zero values are removed from the data, the formative response to
feedback can be understood. The first research question asked if teachers make a
significant change in response to evaluative feedback. For all eight standards, teachers
reported changing practices. However, for all eight standards, most teachers reported that
they did not change as shown in Figure 1. Figure 2 shows the percent of reported change
when the four categories of changes were combined to include those in which any change
occurred (added or deleted, significantly change what I was already doing, made minor
changes to what I was already doing), and those in which change did not occur (did not
make change). From this figure, it is clear that about approximately half of the teachers
made changes to standards 1, 3, 4, 5 and 7 while half did not change at all. In standards 2
and 6, approximately 60% of teacher reported no change to practices. In Standard 7, over
70% of teachers reported no change.
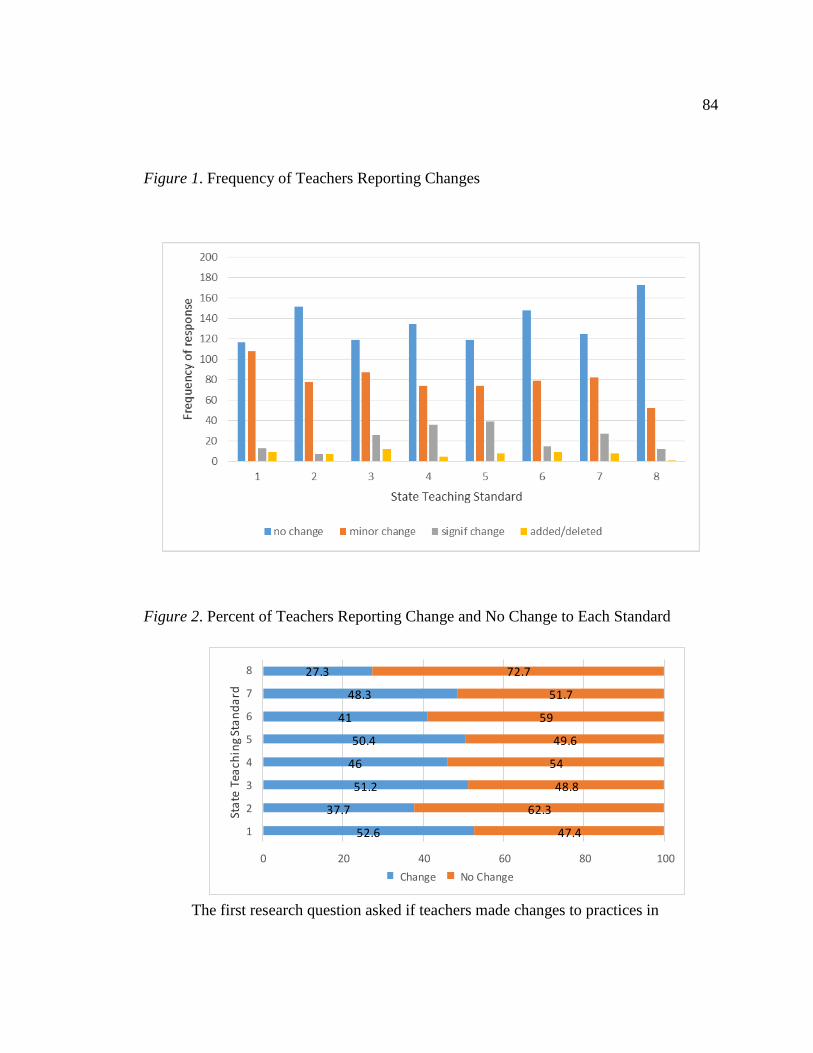
84
52.6
37.7
51.2
46
50.4
41
48.3
27.3
47.4
62.3
48.8
54
49.6
59
51.7
72.7
0 20 40 60 80 100
1
2
3
4
5
6
7
8
Sta
te T
each
ing
Sta
nd
ard
Change No Change
Figure 1. Frequency of Teachers Reporting Changes
Figure 2. Percent of Teachers Reporting Change and No Change to Each Standard
The first research question asked if teachers made changes to practices in
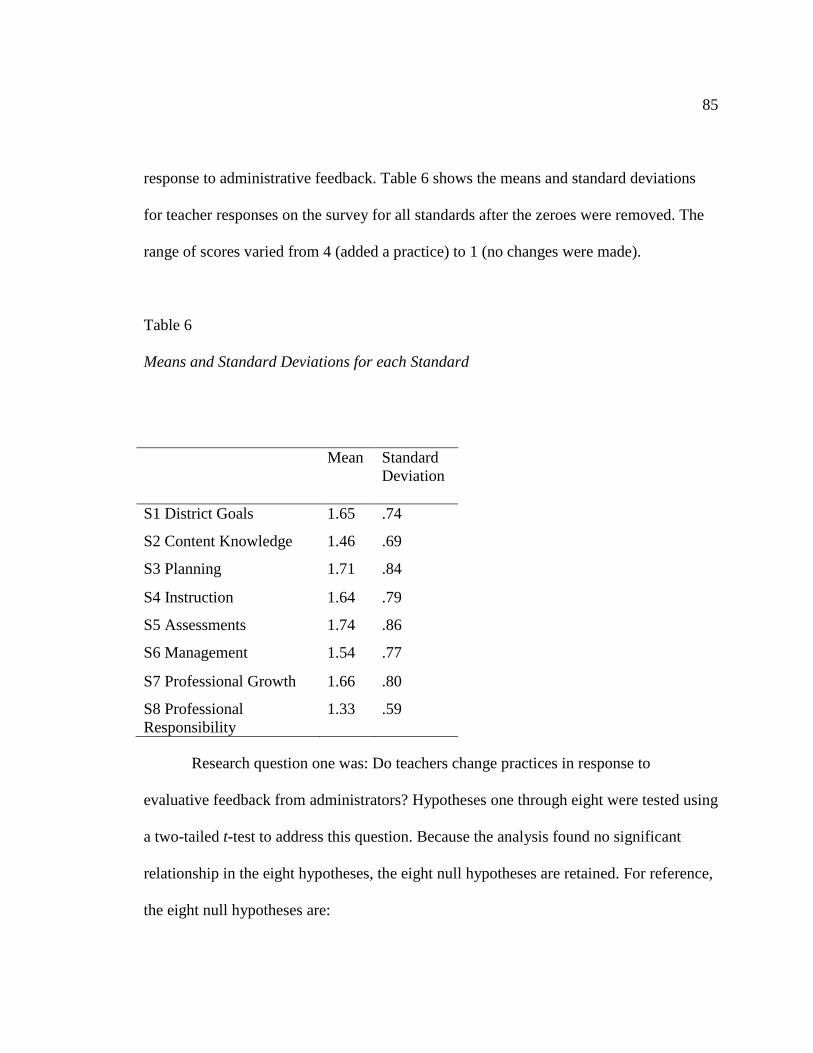
85
response to administrative feedback. Table 6 shows the means and standard deviations
for teacher responses on the survey for all standards after the zeroes were removed. The
range of scores varied from 4 (added a practice) to 1 (no changes were made).
Table 6
Means and Standard Deviations for each Standard
Research question one was: Do teachers change practices in response to
evaluative feedback from administrators? Hypotheses one through eight were tested using
a two-tailed t-test to address this question. Because the analysis found no significant
relationship in the eight hypotheses, the eight null hypotheses are retained. For reference,
the eight null hypotheses are:
Mean
Standard
Deviation
S1 District Goals 1.65 .74
S2 Content Knowledge 1.46 .69
S3 Planning 1.71 .84
S4 Instruction 1.64 .79
S5 Assessments 1.74 .86
S6 Management 1.54 .77
S7 Professional Growth 1.66 .80
S8 Professional
Responsibility
1.33 .59
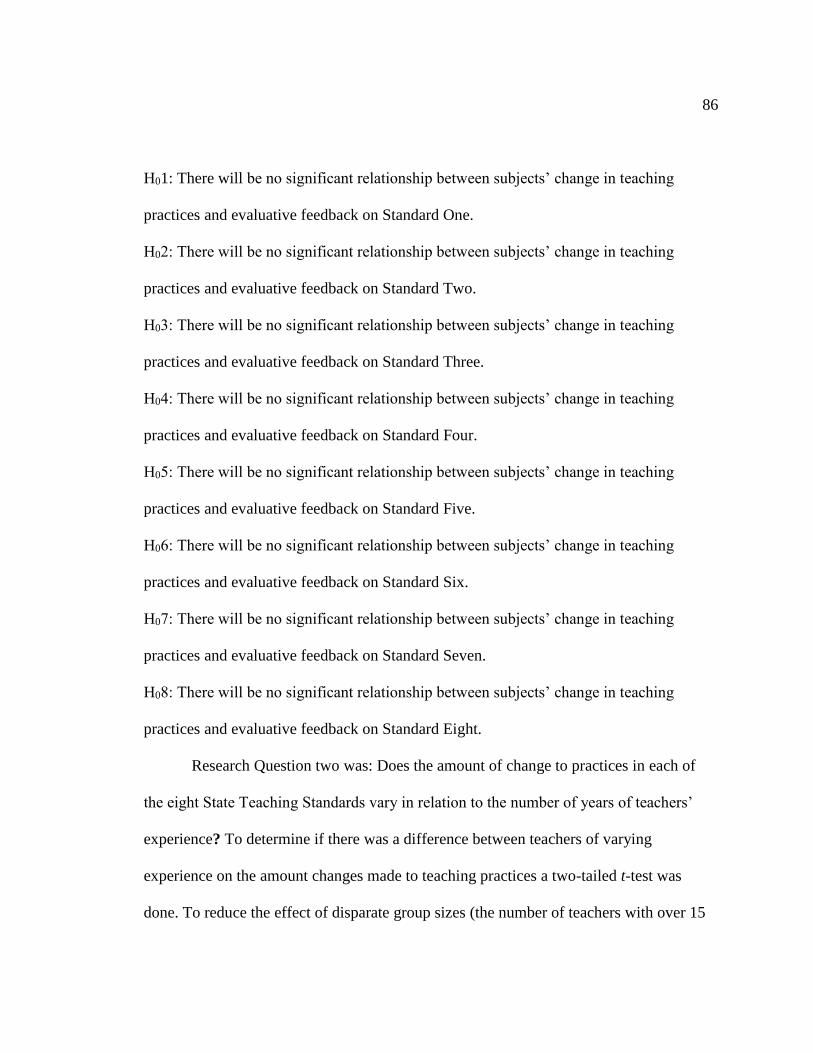
86
H01: There will be no significant relationship between subjects’ change in teaching
practices and evaluative feedback on Standard One.
H02: There will be no significant relationship between subjects’ change in teaching
practices and evaluative feedback on Standard Two.
H03: There will be no significant relationship between subjects’ change in teaching
practices and evaluative feedback on Standard Three.
H04: There will be no significant relationship between subjects’ change in teaching
practices and evaluative feedback on Standard Four.
H05: There will be no significant relationship between subjects’ change in teaching
practices and evaluative feedback on Standard Five.
H06: There will be no significant relationship between subjects’ change in teaching
practices and evaluative feedback on Standard Six.
H07: There will be no significant relationship between subjects’ change in teaching
practices and evaluative feedback on Standard Seven.
H08: There will be no significant relationship between subjects’ change in teaching
practices and evaluative feedback on Standard Eight.
Research Question two was: Does the amount of change to practices in each of
the eight State Teaching Standards vary in relation to the number of years of teachers’
experience? To determine if there was a difference between teachers of varying
experience on the amount changes made to teaching practices a two-tailed t-test was
done. To reduce the effect of disparate group sizes (the number of teachers with over 15

87
years of experience far outweighed the number of teachers in the other experience
groups, being 52% of the respondents), the experience groups were reorganized into less
than ten years of experience (group 1) and more than ten years of experience (group 2).
See the means and standard deviations for all standards in the two groups of experience
in Table 7.
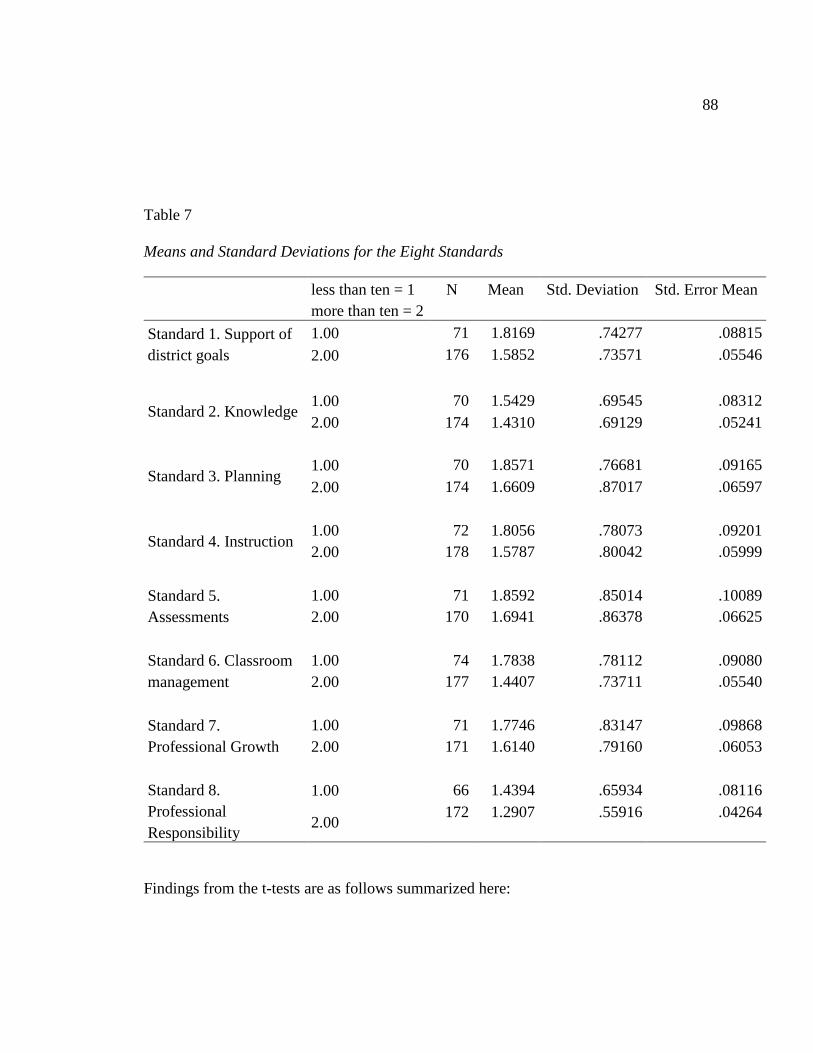
88
Table 7
Means and Standard Deviations for the Eight Standards
less than ten = 1
more than ten = 2
N Mean Std. Deviation Std. Error Mean
Standard 1. Support of
district goals
1.00 71 1.8169 .74277 .08815
2.00 176 1.5852 .73571 .05546
Standard 2. Knowledge 1.00 70 1.5429 .69545 .08312
2.00 174 1.4310 .69129 .05241
Standard 3. Planning 1.00 70 1.8571 .76681 .09165
2.00 174 1.6609 .87017 .06597
Standard 4. Instruction 1.00 72 1.8056 .78073 .09201
2.00 178 1.5787 .80042 .05999
Standard 5.
Assessments
1.00 71 1.8592 .85014 .10089
2.00 170 1.6941 .86378 .06625
Standard 6. Classroom
management
1.00 74 1.7838 .78112 .09080
2.00 177 1.4407 .73711 .05540
Standard 7.
Professional Growth
1.00 71 1.7746 .83147 .09868
2.00 171 1.6140 .79160 .06053
Standard 8.
Professional
Responsibility
1.00 66 1.4394 .65934 .08116
2.00 172 1.2907 .55916 .04264
Findings from the t-tests are as follows summarized here:

89
On Standard One, Support of District Goals, there was a significant difference
between teachers of less than 10 years of experience and teachers with more than 10
years of experience. Teachers with less experience implemented more change than
teacher with more experience, t(245)=2.23, p=.026. Hypothesis nine, there is a significant
relationship between the degree of reported change on Standard One and years of
teacher’s experience is supported.
One Standard Two, there was not a significant difference between teachers of less
than ten years of experience and teachers with more than 10 years of experience,
t(242)=1.141, p=.255. Hypothesis ten, there is a significant relationship between the
degree of reported change on Standard Two and years of teacher’s experience is not
supported.
On Standard Three, there was not a significant difference between teachers of less
than ten years of experience and teachers with more than 10 years of experience,
t(242)=1.647, p=.101. Hypothesis eleven, there is a significant relationship between the
degree of reported change on Standard Three and years of teacher’s experience is not
supported.
On Standard Four, Instruction, there was a significant difference between teachers
of less than ten years of experience and teachers with more than 10 years of experience,
t(248)=2.044, p=.042. Teachers with less experience reported more changes to practices
than teachers with more experience. Hypothesis twelve, there is a significant relationship

90
between the degree of reported change on Standard Four and years of teacher’s
experience is supported.
On Standard Five, there was not a significant difference between teachers of less
than ten years of experience and teachers with more than 10 years of experience,
t(242)=1.647, p=.101. Hypothesis thirteen, there is a significant relationship between the
degree of reported change on Standard Five and years of teacher’s experience is not
supported.
On Standard Six, Management, there was a significant difference between
teachers of less than ten years of experience and teachers with more than 10 years of
experience, t(249)=3.303, p=.001. Teachers with less experience reported more changes
to practices than teachers with more experience. Hypothesis fourteen, there is a
significant relationship between the degree of reported change on Standard Six and years
of teacher’s experience is supported.
On Standard Seven, there was not a significant difference between teachers of less
than ten years of experience and teachers with more than 10 years of experience,
t(240)=1.416, p=.158. Hypothesis fifteen, there is a significant relationship between the
degree of reported change on Standard Seven and years of teacher’s experience is not
supported.
On Standard Eight, there was not a significant difference between teachers of less
than ten years of experience and teachers with more than 10 years of experience,
t(236)=1.745, p=.082. Hypothesis sixteen, there is a significant relationship between the

91
degree of reported change on Standard Eight and years of teacher’s experience is not
supported. Because the group sizes were evened out by aggregation, no additional tests or
post-hoc analyses were performed.
Test for Interaction between independent variables
To determine if the time since the last evaluative feedback was received impacted
the reported changes to practices, a 2 X 3 ANOVA was run with two groups of
experience (less than ten years and more than 10 years) and three groups of time since the
last evaluation (12 months, 24 months, 36 months). The means for the analysis for each
standard are shown in Tables 9-16. The results of this analysis are shown in Table 17. As
shown in Table 17, the interaction between times since the last evaluation and years of
experience was not significant for any of the eight teaching standards.

92
Table 9
Means and Standard Deviations for Standard 1 Support of District Goals
Approximate time since your last
administrative evaluation.
less than ten = 1
more than ten = 2
Mean Std. Deviation N
Within the past 12 months
1.00 1.7414 .71477 58
2.00 1.6250 .77819 104
Total 1.6667 .75593 162
Within the past 24 months
1.00 2.3000 .82327 10
2.00 1.6122 .73076 49
Total 1.7288 .78412 59
Within the past 36 months
1.00 1.6667 .57735 3
2.00 1.3478 .48698 23
Total 1.3846 .49614 26
Total
1.00 1.8169 .74277 71
2.00 1.5852 .73571 176
Total 1.6518 .74369 247

93
Table 10
Means and Standard Deviations for Standard 2 Content Knowledge
Approximate time since your last
administrative evaluation.
less than ten = 1
more than ten = 2
Mean Std. Deviation N
Within the past 12 months
1.00 1.4909 .63458 55
2.00 1.4804 .67090 102
Total 1.4841 .65638 157
Within the past 24 months
1.00 1.8182 .98165 11
2.00 1.3958 .73628 48
Total 1.4746 .79559 59
Within the past 36 months
1.00 1.5000 .57735 4
2.00 1.2917 .69025 24
Total 1.3214 .66964 28
Total
1.00 1.5429 .69545 70
2.00 1.4310 .69129 174
Total 1.4631 .69290 244

94
Table 11
Means and Standard Deviations for Standard 3. Planning
Approximate time since your
last administrative evaluation.
less than ten = 1
more than ten = 2 Mean Std. Deviation N
Within the past 12 months
1.00 1.8393 .75743 56
2.00 1.7767 .94901 103
Total 1.7987 .88432 159
Within the past 24 months
1.00 1.8182 .60302 11
2.00 1.5106 .74811 47
Total 1.5690 .72818 58
Within the past 36 months
1.00 2.3333 1.52753 3
2.00 1.4583 .65801 24
Total 1.5556 .80064 27
Total 1.00 1.8571 .76681 70
2.00 1.6609 .87017 174
Total 1.7172 .84495 244

95
Table 12
Means and Standard Deviations for Standard 4. Instruction
Approximate time since your
last
administrative evaluation.
less than ten = 1
more than ten = 2
Mean Std. Deviation N
Within the past 12 months
1.00 1.7458 .77889 59
2.00 1.6346 .83675 104
Total 1.6748 .81561 163
Within the past 24 months
1.00 2.1000 .73786 10
2.00 1.5306 .71011 49
Total 1.6271 .74042 59
Within the past 36 months
1.00 2.0000 1.00000 3
2.00 1.4400 .82057 25
Total 1.5000 .83887 28
Total
1.00 1.8056 .78073 72
2.00 1.5787 .80042 178
Total 1.6440 .79989 250

96
Table 13
Means and Standard Deviations for Standard 5. Assessments
Approximate time since your last
administrative evaluation.
less than ten = 1
more than ten = 2
Mean Std. Deviation N
Within the past 12 months
1.00 1.7895 .77314 57
2.00 1.7374 .88739 99
Total 1.7564 .84527 156
Within the past 24 months
1.00 2.1000 .99443 10
2.00 1.6875 .85443 48
Total 1.7586 .88477 58
Within the past 36 months
1.00 2.2500 1.50000 4
2.00 1.5217 .79026 23
Total 1.6296 .92604 27
Total
1.00 1.8592 .85014 71
2.00 1.6941 .86378 170
Total 1.7427 .86132 241

97
Table 14
Standard 6. Classroom Management
Approximate time since your
last
administrative evaluation.
less than ten = 1
more than ten = 2
Mean Std. Deviation N
Within the past 12 months
1.00 1.7627 .77324 59
2.00 1.4951 .75243 103
Total 1.5926 .76860 162
Within the past 24 months
1.00 2.0000 .89443 11
2.00 1.4167 .73899 48
Total 1.5254 .79559 59
Within the past 36 months
1.00 1.5000 .57735 4
2.00 1.2692 .66679 26
Total 1.3000 .65126 30
Total
1.00 1.7838 .78112 74
2.00 1.4407 .73711 177
Total 1.5418 .76501 251
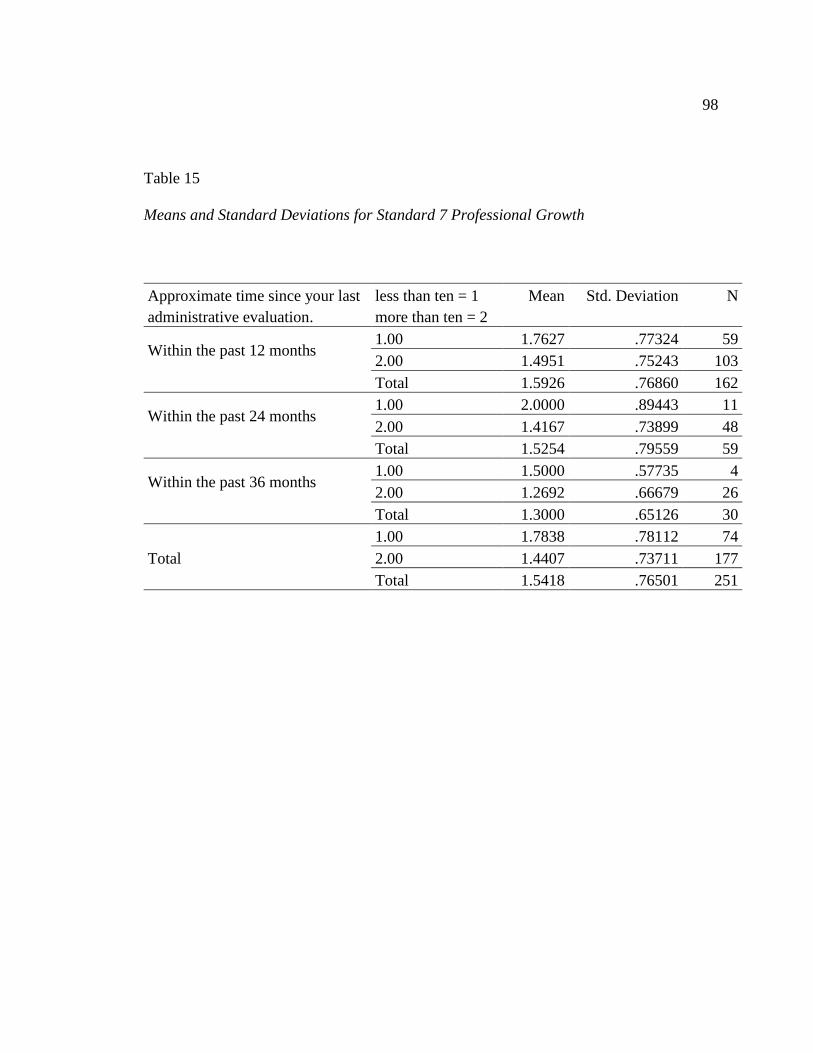
98
Table 15
Means and Standard Deviations for Standard 7 Professional Growth
Approximate time since your last
administrative evaluation.
less than ten = 1
more than ten = 2
Mean Std. Deviation N
Within the past 12 months
1.00 1.7627 .77324 59
2.00 1.4951 .75243 103
Total 1.5926 .76860 162
Within the past 24 months
1.00 2.0000 .89443 11
2.00 1.4167 .73899 48
Total 1.5254 .79559 59
Within the past 36 months
1.00 1.5000 .57735 4
2.00 1.2692 .66679 26
Total 1.3000 .65126 30
Total
1.00 1.7838 .78112 74
2.00 1.4407 .73711 177
Total 1.5418 .76501 251

99
Table 16
Means and Standard Deviations for Standard 8. Professional Responsibility
Approximate time since your last
administrative evaluation.
less than ten = 1
more than ten = 2
Mean Std. Deviation N
Within the past 12 months
1.00 1.4815 .69338 54
2.00 1.4000 .63564 100
Total 1.4286 .65537 154
Within the past 24 months
1.00 1.2222 .44096 9
2.00 1.1702 .43335 47
Total 1.1786 .43095 56
Within the past 36 months
1.00 1.3333 .57735 3
2.00 1.0800 .27689 25
Total 1.1071 .31497 28
Total
1.00 1.4394 .65934 66
2.00 1.2907 .55916 172
Total 1.3319 .59099 238

100
Table 17
Test of Interaction between Time since Last Evaluation (Eval) and Experience (Exper)
Standard Degrees of
freedom
F Significance
1 Support of District Goals
Time since last Eval 2, 247 2.365 .096
Experience 1,247 4.492 .035
Time X Exper 2,247 2.092 .126
2 Content Knowledge
Time since last Eval 2,244 .612 .543
Experience 1,244 1.985 .160
Time X Exper 2,244 1.308 .272
3 Planning
Time since last Eval 2,244 .516 .598
Experience 1,244 4.281 .040
Time X Exper 2,244 1.350 .261
4 Instruction
Time since last Eval 2,250 .337 .714
Experience 1,250 4.669 .032
Time X Exper 2,250 1.395 .250
5 Assessments
Time since last Eval 2,241 .391 .677
Experience 1,241 4.340 .038
Time X Exper 2,241 1.381 .253
6 Management
Time since last Eval 2,251 .932 .395
Experience 1,251 4.859 .028
Time X Exper 2,251 .666 .515
7 Professional Growth
Time since last Eval 2,242 .979 .377
Experience 1,242 3.468 .064
Time X Exper 2,242 1.137 .322
8 Professional Responsibility
Time since last Eval 2,238 2.749 .066
Experience 1,238 .831 .363
Time X Exper 2,238 .125 .882
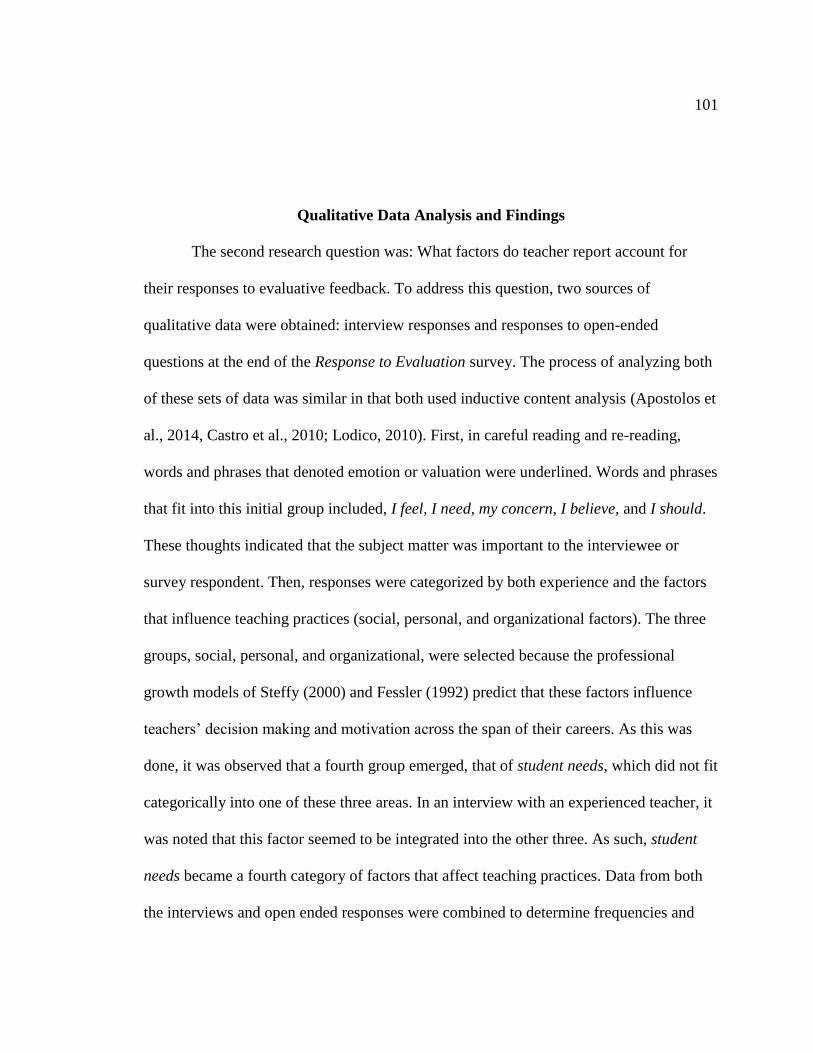
101
Qualitative Data Analysis and Findings
The second research question was: What factors do teacher report account for
their responses to evaluative feedback. To address this question, two sources of
qualitative data were obtained: interview responses and responses to open-ended
questions at the end of the Response to Evaluation survey. The process of analyzing both
of these sets of data was similar in that both used inductive content analysis (Apostolos et
al., 2014, Castro et al., 2010; Lodico, 2010). First, in careful reading and re-reading,
words and phrases that denoted emotion or valuation were underlined. Words and phrases
that fit into this initial group included, I feel, I need, my concern, I believe, and I should.
These thoughts indicated that the subject matter was important to the interviewee or
survey respondent. Then, responses were categorized by both experience and the factors
that influence teaching practices (social, personal, and organizational factors). The three
groups, social, personal, and organizational, were selected because the professional
growth models of Steffy (2000) and Fessler (1992) predict that these factors influence
teachers’ decision making and motivation across the span of their careers. As this was
done, it was observed that a fourth group emerged, that of student needs, which did not fit
categorically into one of these three areas. In an interview with an experienced teacher, it
was noted that this factor seemed to be integrated into the other three. As such, student
needs became a fourth category of factors that affect teaching practices. Data from both
the interviews and open ended responses were combined to determine frequencies and
102
percentages of the four groups and most common themes. The percent of teacher
responses in these four categories are shown in figure 3. These data show that student
needs were a formative factor for the three most experienced teacher groups. However,
this category was noted less as experience increased. Personal factors were noted by the
least experienced teachers and teachers of ten to fifteen years more than for the other two
groups. Organizational factors showed an increase over experience with the most
experienced teachers responding that it influenced their practices more than any other
group of experience. The mention of social factors was highest for new teachers and
lowest for teachers of ten to fifteen years.
Figure 3. Reasons Teachers change their practices in each category of experience
In addition, out of all responses, two groups emerged: factors the accounted for
changes to practices (i.e. formative factors) and factors that accounted for why teachers

103
did not change practices. Scriven (1991) determined that feedback is formative if it
changes the practices of the evaluatee. The formative factors were those listed in the
first open-ended question that specifically asked teachers to account for the changes they
made in response to evaluative feedback. The non-formative factors were those listed in
the second open-ended response that asked teachers to account for why they did not
change practices in response to feedback. The interview data were combined with the
survey responses to compile the list shown in Table 18.

104
Table 18.
List of formative and non-formative responses in each of the categories
Formative
Non-formative
Personal New role
Personal beliefs
Desire to move up on pay scale
Courses taken
Desire to move on pay scale
Demands of family
Do not know the standards
No need
I can do it myself
Social Formative administrative feedback
Interaction with colleagues
Negative feedback was formative
Do not have support
No colleagues in my area
Value colleague input more
No formative feedback given
Evaluator lacks expertise
Evaluator lacks experience
Do not see value in feedback
Feedback not timely
Lack of rapport with
colleagues
Do not respect evaluator
Organizational Writing new assessments
Implementing standards based
grading
Implementing standards/Common
Core
Data collected by school
Building goals
Professional development
Communication with family
Access to technology
Change in curriculum
Need education on school
initiative
Location of room in building
Parent expectations
Ineffective district initiatives
No access to technology
Lack of funding
No time in contract
Student needs Learning needs Emotional/behavioral needs

105
0
2
4
6
8
10
12
14
16
18
20
PersonalMotivation
FormativeFeedback fromAdmininstrator
Interactionwith Collagues
Per
cen
t o
f R
esp
on
ses
0
5
10
15
20
25
30
35
40
Need need tochange
No FormativeFeedbackReceived
No time
Per
cen
t o
f R
esp
on
ses
Emergent themes that appeared in at least 20% of the data as suggested by Castro
and colleagues (2010) were to be considered significant. However, no one theme had this
percentage. Figures Four and Five show themes that appeared in over 10% of the open-
ended responses for both the formative and the not formative groups. For each group,
three factors appeared in the over 10% categories.
Figure 4. Formative Factors: Top Three Percentages Figure 5. Non-formative Factors: Top Three Percentages
Since the survey explicitly asked teachers if they made changes to practices in
response to evaluative feedback, it is not surprising that teachers who changed, list
administrative feedback as a factor related to their change. This occurred for just over
18% of the teachers who reported that they made changes. Comments such as: “My
evaluator suggested changes for the better,” and “I asked for help from my administrator
and got it,” were common in this category. However, nearly 20% of teachers said they
106
did not receive formative feedback. “Standards were not discussed,” was a common
phrase used in the open-ended responses in this category. Approximately 15% of
teachers who made changes did so as a result of collegial interactions, while
approximately 11% did so solely out of personal motivation to change. One teacher
wrote, “I am passionate about finding new strategies and resources to give them my best
every day. It is part of my professional fabric.” If teachers did not make changes to
practices, over 35% said it was because they did not need to change. One teacher,
reflecting similar comments from others in this group, said, “There was nothing in my
evaluation that would guide me to make changes. It was, ‘Everything looks good. Sign
here.’” Approximately 23% said they did not have time to enact change.
Discrepant responses were those that did not appear in more than two persons. For
formative factors, these included personal hobby, personal belief, desiring to move up on
the pay scale, negative feedback, respect of the administrator, and access to technology.
Discrepant factors that were listed as reasons that teacher did not change included: not
understanding the feedback, lack of colleagues in content area, parent expectations,
feedback was not received in a timely fashion, lack of funding, and demands of family
life.
Details from the Interviews.
In the course of the interviews, in-depth discussion of how various personal,
social, and emotional factors influenced teaching practices yielded further information.
While many of the same themes that were in the survey responses appeared in these
107
interviews, the teachers provided greater detail that helped in understanding how various
factors influenced their practices. The most common themes that emerged included the
desire to meet student needs, personal motivation, the need for or lack of high quality
professional development, and positive collegial support. These themes will be addressed
in this section.
The needs of students were formative factor and noted by all teachers in the
interviews, with more experienced teachers stressing the importance of differentiating
curriculum than less experienced teachers. For example, a teacher with two years of
experience shrugged when asked about this, and said that he would occasionally discuss
strategies with other teachers on how to help individual students. A teacher with over 15
years of experience leaned forward and emphatically noted that she tailors her instruction
for each class of students. “I teach completely differently to my third block students than
I do to my first,” she said.
More experienced teachers discussed that their motivation to improve instruction
was intrinsic. An experienced middle school teacher said she had doesn’t rely on the
evaluative feedback as much as she learns on her own through reading and taking
workshops. She mentioned that if she does not have the chance to learn, she feels that she
is letting her school down. A language arts teacher enthusiastically talked about a book
she recently read to improve reading strategies. Other teachers mentioned the courses
they had taken or the additional degrees they obtained. Newer teachers mentioned in-
school professional development (PD) as formative. More experienced teachers,
108
however, were divided on the formative effect of in-school professional development
opportunities. “We get no quality PD,” one 20-year veteran stated flatly. Another
experience teacher said, “I get ideas from professional development,” but, she
emphasized, “We have had some PD with people that I don’t so much respect.”
While teachers in a number of open ended responses noted that learning
communities were formative, interview data exposed the nuance in this theme. One
experienced teacher said that she was “blessed” to have the configuration in her schedule
to meet with her eighth grade team every day. However, a teacher in her first year who
was not particularly expressive in the majority of the interview, said that the interaction
with staff was “overwhelming.” She noted that since she was part of two teacher teams,
she felt that she was constantly trying to understand established patterns and practices.
Even so, this same teacher described the benefits of one on one interaction with two
instructional coaches who could address her needs as a new teacher better. “They have
helped tremendously,” she stated.
Most teachers discussed district initiatives that were designed to improve
practices, but were not working to this end. These were noted as not formative. Primarily
organizational initiatives, these factors included inadequate functioning of collaborative
teams, not enough professional development, and lack of time to implement the myriad
of district initiatives designed to improve instruction. A high school physics teacher spent
ten minutes in the interview detailing the district initiatives that were rolled out at a quick
pace with no training or support for the staff. He stressed, “There’s a critical mass of
109
people in the district office who want this radical change in education and they want it
fast. No professional learning. No discussion among teachers...just carte blanche.”
It was clear from the interviews that the least experienced teachers found the
feedback formative while the most experienced teachers did not. “I trust what they say
because I’m very new within the profession,” a second year physical education teacher
said. Both new teachers that were interviewed listed specific feedback that they found
helpful or formative. One said, “I was doing a soccer unit and she (evaluating
administrator) had experience with that. So, I asked for help. It was very helpful.” The
other new teacher said that she appreciated that the administrator had insight into how she
could help a particular group of students. In general, almost no experienced teacher could
cite any specific item of administrative feedback that changed their practices. “It’s just a
joke,” a seven-year teacher said sharply, “They don’t talk to you, then you get an email
and you set up a time with them...it only happened once.” A twelve-year veteran said,
“The feedback I got was telling me what I did well. No room for improvement. It was a
pretty short observation. So, I didn’t change anything.” Another admitted, “The
administrator doesn’t know much about music to give a fair evaluation. So, our post-
conference was me telling them why I do different things. I haven’t gotten much feedback
that was useful.” Overall, of the nine teachers, six found the feedback non-formative and
three found it formative (two of these were the least experienced teachers).
Less common themes that emerged from the interviews included amount of
contract time, family demands, money, expectations of the parents, and demands of the

110
district to form instruction around student test results. Discrepant interview data included
a lack of follow-up on the evaluative observation and a room location that prohibited
collegial interaction. For example, a first grade teacher in a large school district with
twelve years of experience was angry because her evaluator never followed up on the
post conference meeting, so she only received an email with the feedback. A music
teacher noted that the band room was too far away from the rest of the classrooms to
promote collegial interactions.
Integrating the Qualitative and Quantitative Data.
In both sets of data, the majority of teachers found evaluative feedback as not
formative to their teaching practices. The largest weighted average on Standard Six,
Assessments, correlated to the movement towards standards based grading noted by
teachers in interviews and open-ended questions. This initiative is an organizational
movement in the state under study. When the zero responses were removed, Standard Six
again had the highest average. The number and percentage of teachers who said they did
not make changes in response to evaluative feedback was supported by the interview
data. Experience was found to be significant in Standards One, Four, and Six which was
supported in part by qualitative data. In these areas (support of district goals, instruction,
and classroom management), less experienced teachers reported more change than more
experienced teachers. While interviewed teachers also reported this, the specific areas of
change do not necessarily correlate. The teachers who did respond formatively to
evaluative feedback did so in instruction and classroom management, but did not mention
111
Standard One, Support of District Goals. In fact, no novice teacher in the interviews
made any reference to the organizational factors that more experienced teachers noted
were formative. While organizational factors were significantly related to experience in
the survey, they were not in information derived from the interviews.
Evidence of Trustworthiness and Credibility
In this study, threats to validity included the reliability of the Response to
Evaluation survey, the sample size, the response rate, the probability that respondents
have extreme viewpoints, and the time since the last feedback was provided. Each of
these issues will be addressed in this section with references to the plan proposed in
Chapter Three.
There are about 35,000 K-12 teachers in the state under study. The survey was
sent via email to 5700 of them and 270 responded with completed responses. While it
was hoped that more would respond to improve the strength of the inferences from the
statistics, this did not happen. The email invitation may have landed in the teachers’ spam
folders. In addition, the survey was sent around the time most schools change terms,
making it a busy time for teachers. The open-ended responses, which most teachers
completed (even though this was optional) might be a clue to the extent to which the
survey represented extreme viewpoints of respondents. While some wrote long
explanations fraught with frustration about how their evaluative feedback system was
ineffective, most gave simple responses telling what factors were most formative to their
practices. Further, if the feedback was provided longer than a year prior, the teacher’s
112
memory of the feedback and the changes implemented as a result could be called into
question. Approximately 63% of the teachers, however, had their last feedback within the
12 months prior to the survey. Only 12% had the feedback within 36 months of the
survey. These data improve the reliability of the results. In addition, the ANOVA was
found that the time since the last feedback did not influence the response to feedback on
any of the standards.
The qualitative and quantitative data were triangulated in the results section. Data
that were similar and dissimilar were noted. The qualitative data generally supported the
quantitative findings. In other words, teachers primarily did not change practices in
response to feedback and listed factors that accounted for this.
Threats to construct validity were addressed by having four of the researcher’s
colleagues view the survey and provide feedback on how well it expressed the intent of
the State Teaching Standards and how appropriate the response scale was. All of the
teachers that tested the survey format found it accurate and easy to use. In addition, they
found the response choices adequate for what they wanted to express in terms of changes
made in response to evaluative feedback. The construct validity was further strengthened
as not one emailed teacher negatively critiqued the survey or its response choices. Open-
ended survey responses were compared to interview responses and many similarities
were found, further strengthening validity of the design. However, differences in these
qualitative data sets were noted. For example, while experienced teachers noted that
students needs were formative in the interviews, they did not mention this in the open-
113
ended responses. In addition, collaborative learning teams were noted as particularly
formative in teachers who responded to the survey, but teachers who were interviewed
found that the formative goals of these collaborative groups were not being met
consistently.
Threats to external validity include those that inhibit applying findings to a larger
population (Creswell, 2013). There is no question that the results primarily apply to
evaluative feedback in the state under study. Responses from teachers willing to be
interviewed indicated that teachers from all over the state in both large and small schools
responded to the survey. The results showed that teachers’ responses to feedback were
similar to those found in other states in terms of not being formative. Cite literature from
chapter 2? Initiatives in the state under study may not be the same as other states so
organizational influences on teaching practices would be expected to differ. Collaborative
learning teams, well-established in many of the state’s schools, may not be as well-
established in other states. This would affect the importance that was placed on social
factors on teaching practices.
Guba and Lincoln (1985) suggested that the term credibility should be used to
differentiate the concept of validity in qualitative work from positivistic, quantitative
research. Guba and Lincoln (1985) noted that qualitative data can be made more credible
by use of triangulation, prolonged engagement in the field, and identification of
disconfirming evidence. The interview data was compared to the quantitative findings in
a triangulation process. The interviews were long enough to get information from the

114
teachers while respecting their time. At the end of every interview, teachers were asked if
they had anything further to say about their response to evaluative feedback. Some
teachers did, others could think of nothing else to say. Saturation of data was partially
achieved in the interviews. In one category of experience, ten to fifteen years, only one
teacher was interviewed because no other teacher in that category volunteered. In all
groups of experience, some teachers who initially volunteered to be interviewed did not
respond to repeated requests by the researcher to schedule a time. Thus, it was difficult to
get enough people to achieve complete saturation of data. Even so, in two groups of
experience, three people were interviewed which exceeded expectations.
Surprisingly, only two of the interviewees seemed to have extreme viewpoints,
one very negative about the feedback and her ability to change, and one the complete
opposite. These data were compared to the entire sample and noted as extremes. Other
disconfirming data were noted throughout the results sections. To achieve what Patton
(2002) called empathic neutrality, the researcher refrained from expressing opinions
about the interviewees’ responses. This is clearly documented in the transcripts. Finally,
field notes on interviewee demeanor and situational events during the interview were
recorded. These notes were critical in the analysis of the data since the vocal tone and
body language of the teachers played a role in further interpreting the meaning of their
words.
To determine content validity, the sincerity of the interviewees was assessed to
determine if any indication of reporting bias might be present. Interviewed teachers were
115
open to speaking to the researcher, but began the interviews somewhat hesitantly. Sharing
information with a stranger was most likely not comfortable for them. Some were eager
to talk once they got started, other warmed into the interview slowly. Content validity
was strengthened by a cross checking process by which the interviewees were given the
transcripts of their interview as well as the themes that emerged.
Transferability is the degree to which the findings and inferences can be applied
to others within the population and outside the population (Tashakkori & Teddlie, 2008).
In this case, the sample demographics included teachers of all categories of experience.
The survey was sent to both the largest and smallest school districts in the state, so data
can be applied to schools of all sizes. However, the state under study, has some initiatives
that may not apply to other states. Standards based grading, collaborative learning
communities, and aligning instruction to the State Core Standards all impacted how
teachers responded to feedback. These organizational influences on teaching practices
may not apply to other states.
Dependability in qualitative data is similar to reliability in quantitative data. To
ensure dependability, all interview data were transcribed verbatim, an interview protocol
(Appendix B) was followed strictly. A reflexive journal was kept by the researcher to
make sure that the biases of the researcher and the rationale for decisions made were
transparent. Extended quotes from the transcripts and the open ended responses have
been included in the findings section of this chapter. Efforts were made to provide thick,
rich descriptions in the findings. Reliability can also be established by making methods
116
transparent (Flick, 2007). The interview protocol ensured that all interviewed teachers
knew the purpose of the study, had assurances of confidentiality, and that they would
have access to the transcripts and data. All survey respondents were given a link to access
the data in October, 2016.
Conclusion
In this chapter, the results were presented. The setting of the study and
demographics of the sample were described. The data analysis strategy for both the
quantitative and qualitative data was reviewed and compared to the planned strategy as
presented in the proposal. The quantitative and qualitative data were presented in table,
figure, and narrative form. Discrepant data was noted. Qualitative and quantitative data
were integrated. Finally, issues of trustworthiness and credibility were analyzed. In the
next chapter, the findings will be discussed and inferences based on the data will be
presented. The significance of the findings will be critiqued.
117
Chapter 5
In this chapter, the data will be analyzed and interpreted. Claims that are
supported by evidence will be outlined with explanations offered. All claims will be
integrated with the current literature and theory that was presented in Chapter Two. The
possible inferences and limitations to the inferences will be presented. Finally, the
significance of this study to the body of literature and stakeholders in education who are
connected with teacher evaluation will be established.
This purpose of this mixed methods study was to see if teachers made significant
changes to their teaching practices in response to evaluative feedback, to determine if the
amount of change was influenced by experience, and to determine what factors account
for teachers’ responses. In brief, the data show that teachers make few changes in
response to evaluative feedback. In fact, in most of the eight State Teaching Standards,
only half of the teachers reported making any changes at all. Further, experience was not
significantly related to change in five of the eight standards. It was significant in three
standards: instruction, classroom management, and support of district goals. Finally, no
significant relationship was found between the amount of reported change and the time
since the last feedback was received in any of the eight standards.

118
Interpretation of the Findings
Research Question One: Do teachers make changes to practices in response to
evaluative feedback?
This study addressed the lack of quantitative data on changes made to teaching
practices in response to evaluative feedback. The first research question focused on
whether or not the evaluative feedback was formative. Scriven (1991) defined formative
feedback as that which leads to improvements in practices. While no cutoff point was
established in this study to differentiate between formative and summative feedback,
teachers did have the opportunity to say categorically if they changed or did not. In this
study, evaluative feedback was not found to be formative. For example, most teachers in
six of the eight State Teaching Standards did not change in response to feedback. Further,
if they did change, they reported making minor changes to existing practices.
To understand this response, it is necessary to listen to what teachers said in the
survey and interviews. For example, teachers said the number one reason teachers that
they did not change, was that neither they nor their administrator saw a need for change.
In other words, no formative suggestions were provided nor were any seen as necessary.
This response was seen particularly in reference to Standard Eight, Professional
Responsibility (follows codes of conduct), where teachers noted that they should not be
employed if they were not already meeting this standard. The conceptual models of
professional growth cited in this paper are relevant in understanding part of this response.
Most teachers who responded had over 15 years of experience, and these teachers are
119
grouped by Fessler (1991) in the competency stage or by Steffy (2000) in the professional
stage. It is at this stage that teachers, having experimented with multiple practices
through the years, found those that work best for them and their students. Other
researchers have found that evaluative feedback is primarily summative in schools in the
United States. Darling-Hammond (2013) documented that most feedback in the United
States is summative. Teachers have noted across the United Sates have said that feedback
was vague or not relevant and not useful for improving practices (Donaldson, 2012,
Mahar, 2010). This type of feedback is considered not formative. Weisberg (2009) found
that 99% of the teachers in the United States get a satisfactory rating. No suggestions are
provided for improvement. Weisberg (2009) noted that the high percentage of teachers
with satisfactory ratings does not reflect the reality of the workplace where almost
everyone performs without need to improve. Thus, it is clear from the data that schools in
this particular state are providing mostly summative feedback despite the expressed goal
of the state (State of Iowa, 2013b) that their evaluation system is formative.
Why didn’t teachers change in response to feedback? First, as mentioned above,
they did not receive formative feedback. However, many said they did. This was
especially noted in the responses of novice teachers and rarely mentioned by more
experienced teachers. If teachers did receive formative suggestions, they viewed them as
changes that they and their administrator found relevant. However, nearly a quarter of the
teachers noted that, even if the feedback was formative, they did not have enough
contracted time to implement the changes. If teachers do not have enough time to
120
implement the suggested changes, then the formative intent of the feedback becomes
moot. Anast-May (2011) found the post-observation conferences between the teacher and
the administrator were important in facilitating change, but few teachers in this study
mentioned these meetings.
It appears from their responses that the feedback is summative and that other
factors, such as interaction with colleagues, are more formative to their practices than the
feedback itself. Schools in the state are providing mostly summative feedback despite the
expressed goal of the state (State of Iowa, 2013b) to have an evaluation system that is
formative. If teachers do not have enough time to implement the suggested changes, then
the formative intent of the feedback becomes moot.

121
Research Question Two: Does experience play a role in teachers’ responses to
Feedback?
The second research question addressed whether or not experience related
significantly to the amount of reported change. Steffy (2000) and Fessler (1991)
developed professional growth models that posit that experience influences how teachers
implement changes to their practices. Multiple studies support these models (Antoniou,
2012; Maskit, 2011, Richter, 2011, Taylor & Tyler, 2012). The findings of this study
clearly show that experience influences teachers in the areas of support of district goals,
instruction, and classroom management with less experienced teachers changing more
than experienced teachers and that experience is not a factor in the other five standards
(content knowledge, planning, assessment, professional growth, and professional
responsibility). Significant differences were found between teachers of less than 10 years
of experience and more than 10 years of experience in these three of the eight standards
(support of district goals, instruction, and classroom management).
Why might just three standards vary in relationship to teaching experience? First,
the nature of the evaluation systems might make some practices more observable than
others. Because the feedback in this state is provided after one or two brief classroom
observations, it is possible that standards regarding classroom management and
instructional practices are focused on with greater intensity than alignment and
differentiation of assessments and professional growth. It is difficult to address the sub-
criteria in the standards on professional growth and responsibility in one or two

122
classroom observation. Secondly, the standard addressing support of district goals would
be one on which administrators would focus since those goals are ones set by the
administrators. Thus, if a district has decided to implement a new assessment strategy and
wants all the teachers to do this, administrators would have this in the fore of their minds
as they observe the teacher. This standard includes organizational initiatives such as
standards based grading, new science standards, establishment of collaborative data
teams, and development of common formative assessments. Of course, the easiest
standards to evaluate in classroom are instruction and classroom management since this is
directly observable when the administrator is in the room. Teachers, knowing that the
administrator is coming in to observe, would try to highlight their best practices in these
areas. Standards seven and eight, Professional Growth and Responsibility, may be less
observable.
Finally, unless the administrator has expertise in the teacher’s content area, he or
she may not be able to provide feedback on Standard 2, Content Knowledge. This may be
more applicable at the high school level than lower grades. For instance, in specialty
subjects, such as physics or Spanish, the administrator may not know enough to
determine if the teacher is competent or teaching using current pedagogical research for
the content area, much less provide suggestions. Lack of administrator expertise in the
discipline was cited by some as a reason for not changing practices and has been cited by
researchers (Despain, 2012; Darling-Hammond, 2013; Fessler, 1991; Weisberg, 2009).
123
Finding no relationship between experience and changes to practices in most of
the standards might be explained by examining the nature of the sample. Over 50% of the
respondents were teachers with 15 or more years of experience. More experienced
teachers may be resistant to these changes, having endured many such initiatives over the
course of their career (Steffy, 2000). More experienced teachers said that they rely more
on their own judgment or colleagues than that of an outside observer. In fact, these two
factors were listed in the top three formative factors. Research has shown that novice
teachers respond differently to feedback compared to experienced teachers (Daley &
Kim, 2010; Papay & Johnson, 2012). Experienced teachers in the wind-down stage as
described in the Fessler (1991) model, are not interested in adding to their practices
despite what the district puts forward. Inexperienced teachers, on the other hand, were
found in this study to be more open to formative feedback. Steffy and Fessler predict that
teachers in the less experienced stages are open to and experiment with new teaching
practices. This also confirms what Taylor and Tyler (2012) found that the most growth
occurs in the first three to five years of the teacher’s career. Finally, more experienced
teachers, having experimented over the years, have found practices that work best for
them and their students. They make minor adjustments as student needs demand.
Antoniou (2013) noted that experienced teachers improved relationships with students
over time, but made only minor changes to teaching skills.
Another reason that experience was not found as significant in this study was the
nature of the study itself. The teachers were asked how they responded to evaluative

124
feedback from their administrator. They were not directly asked if they made changes in
response to suggestions from colleagues or at their own initiative. In the qualitative
portion of this study, they noted these factors, but the study specifically asked them about
feedback from their administrators. Thus, while teachers have been found to change their
practices over time (Fessler, 1991; Maskit, 2011; Steffy, 2000), their response to
administrative feedback does not show any trend.
Qualitative Research Question: What factors account for teacher responses to
Feedback?
The professional growth models of Steffy (2000) and Fessler (1991) account for
teacher behavior by situating practices in the personal, social, and organizational contexts
in which they work. Research has supported that these factors influence teaching
practices (Anast-May, 2011; Eros, 2013; Gaudreault & Woods, 2013; Meister & Ahrens,
2011). This study found that these factors did indeed affect teaching practices. In
addition, an additional group, student needs, emerged that influenced practices of
experienced teachers. In fact, Kyrkiades (2009) found that experienced teachers were
able to differentiate based on what they did with individual students. Steffy (2000) said
that teachers in the expert stage were able to use student feedback to monitor and adjust
their instruction. Likewise, Fessler (1991) wrote that experienced teachers were able to
plan instruction based on student feedback.
The findings of this study indicate that personal, social, and organizational
influences on teaching practices vary with experience. However, the percent of these
125
factors listed by each group of teachers varied with social factors generally becoming less
formative and organizational factors increasing in formative value over time. Fessler
(1991) emphasized that his Career Cycle model was not linear and that teachers will
experience differences in influences over time. Steffy’s (2000) Life Cycle of the Career
Teacher model indicates that personal, social, and organizational influences will change
over the course of the career. Past research supports this finding. An increased sense of
self-efficacy, changes in the depth of relationships with colleagues, and relationships with
administrators have all been found to change over the course of a career (Anast-May,
2011; Eros, 2013; Gaudreault & Woods, 2013; Meister & Ahrens, 2011).
In this research, it was found that social influences on teaching practices decline
over the first fifteen years of practice and increase after that. Factors such as relationships
with colleagues, suggestions from administrators, and perception of evaluator expertise
were cited as important. Of the factors that influenced teaching practices, social
influences were reported in 48% of the novice teachers, 40% of the teachers of four to
nine years of experience, and 30% of teachers in the next group. However, this
percentage increased to 36% in the most experienced group. The professional growth
models support this finding. While reliance on colleagues is important for newer teachers,
it becomes less important for experienced teachers (Fessler, 1991; Steffy, 2000).
Teachers become increasingly self-reliant as they try strategies and find what works for
them and their students (Fessler, 1991; Steffy, 2000). These more experienced teachers
also rely less on administrative feedback and more on collegial support in the form of
126
collaborative learning teams or departmental discussions as was noted in the qualitative
data in this study. Teachers in mid-career begin shift social relationships as they start to
rely on social networks including classmates in courses, and connections made in
professional organizations (Fessler, 1991; Steffy, 2000).
In this study, organizational influences on teaching practices were found to
increase in importance over time. Factors in this category included initiatives to write
new assessments, implementing standards based grading, data collection by the district,
access to technology or lack thereof, and the need to implement the Common Core
Standards. Of the factors that influenced teaching practices, only 28% of novice teachers
listed organizational factors, while 37% of experienced teachers reported organizational
influences. Increases in this percentage were seen over time in all groups of experience.
Both the Steffy (2000) and Fessler (1991) models predict that teachers learn to live within
the organizational structure and might be dulled by institutional routines. However,
teachers in this study report that district goals are distinct influence on their practices. As
noted earlier, state initiatives mandate changes in teaching practices in this state.
The data indicate that the influence of students on teaching practices is not
formative in novice teachers. Student needs were not mentioned by novice teachers at all.
They were noted by 12% of teachers in the next group, 9% in the ten to 15-year group,
and 8% of teachers in the over 15-year group. Novice teachers tend to use strategies they
learned in pre-service education and feel stress as they embark on trying these practices
with new students (Fessler, 1991; Steffy, 2000). As teachers gain experience in managing

127
the classroom, they expand their ability to develop relationships with students (Fessler,
1991; Steffy, 2000). Because experienced teachers have tried and succeeded with
teaching strategies, they have a variety of strategies they can use to differentiate
instruction. Teachers in the enthusiastic stage of Fessler’s (1991) model and the expert
stage of Steffy’s model use intuition to differentiate instruction based on student needs.
Both cognitive and behavioral needs were listed as influential to teachers in this study.
The data show that social influences are primarily non-formative while
organizational influences are formative. Of the factors that were listed as formative, most
were in the organizational group. Examples included writing new assessments,
implementing standards based grading, implementing standards, building goals, district-
based professional development, and data collection by district. Of the factors that were
listed as not formative, the most were in the social group. In this category, any in-school
personal relationship was grouped. This included relationships with administrators and
the feedback received from administrators as well as relationships with colleagues. In this
group, the following were listed: no support for change, no formative feedback received,
evaluator lacks expertise and experience, lack of respect and rapport with administrator,
and lack of rapport with colleagues. Because administrative feedback was grouped into
the social category, and because most teachers found the feedback non-formative, the
prevalence of this factor is not surprising. As stated earlier, because of statewide
initiatives that schools are required to implement, the organizational pressure would
necessarily force teachers to change.

128
In summary, for teachers to make changes to teaching practices, they need to feel
efficacious by having self-confidence, peer support, administrative support, and
organizational support. Formative feedback from administrators was found to be the most
important factor that determines if teachers make changes to practices even though most
teachers said they did not receive this. This study showed that when the formative
feedback is provided, it is effective in achieving its goal of having teachers change.
Limitations of the Study
With a mixed methods study, the limitations to making inferences and
generalizing the data apply to both the quantitative data collection and analysis and the
qualitative data collection and analysis. There are many areas in this study that must be
critiqued so that appropriate conclusions can be made.
First, a critique of the sample. The respondent groups were not even for each
category of experience. In fact, the response rate of experienced teachers were five times
greater than novice teachers. If the groups were more evenly distributed, then different
conclusions might be drawn. This most experienced teachers not only had highest
response rate on the survey, they were the group that had the highest interest in being
interviewed. The uneven response rate was the reason that the four experience groups
were compressed into two groups. This made the inferences from the statistics more
reliable. However, aggregating data limits the inferences that can made about how
experience affects teachers inclinations to change. For example, these data cannot be used
to determine if the research that indicated that teachers in the mid-career stage make more
129
changes than other stages (Richter, 2011) is confirmable. In fact, aggregation of the data
limits all inferences in relation to experience.
Besides sample sizes, the sample represents the views of teachers in only one
Midwestern state. Practices of teachers in other states might yield different results. This is
especially true when evaluating the social and organizational structures in place that
support teachers in the state under study. These structures may or may not be in place in
other states.
The instrument used for the survey also has a number of limitations. A self-report
survey can be affected by teacher memories and varying perceptions of the amount of
change. While the self-report survey provided insight into how teachers responded to
feedback (Giuseppe, 2006; Looney, 2011), the instrument did ask teachers to recall
information that was not necessarily provided in the current school year. While self-
report surveys have generally been found to be reliable in studies where standards were
implemented (Desimone, 2010), no quantitative test of reliability was conducted for this
survey. Because reliability is improved with the use of focus groups (Desimone, 2010),
the interviews were conducted.
The survey did not ask teachers to report on the actual feedback they received,
only their responses to the feedback. A more accurate, but timely study, would measure
teachers’ responses to the actual feedback they received. This type of study would require
teachers to divulge information that is in their personnel files and they may be reticent to
130
do this. Thus, this study relied on teacher reflections on both the feedback they received
with some of it, for some respondents being three years prior.
In addition, there are limitations to the conclusions because the feedback system
is not uniform in the state. For instance, the instrument used for administrative evaluative
feedback is not the same throughout all schools in the state. Some instruments may be
designed to provide only summative feedback while others may have a space to write
formative suggestions. Also, the implementation of the evaluation systems (number of
observations, the length of observations, the amount of feedback, the timeliness of
feedback, and existence of post-observation conferences) is not the same in all schools.
Some teachers reported that they did not get any feedback at all, while others reported
multiple administrative observations and follow-u conferences.
While teachers were asked to report changes made in response to evaluative
feedback, it is possible that, as they proceeded through the survey, they reported changes
that were actually a result of other influences. Because teachers make changes to
practices in response to social, personal, and organizational factors (Fessler, 1991; Steffy,
2000), a number of these groups might have influenced their response to feedback. For
instance, they may have received a suggestion from their administrator that a colleague
later helped them implement. In responding to the survey, they may have reported that
they changed in response to the administrative suggestion, or they may have attributed
their change to their colleague’s help. It might even be hard for them to dissect the
difference and accurately report which factor most influenced their change.

131
The sample size was smaller than anticipated. An online survey such as the one
sent has the chance to be filtered by school systems and be sent to spam files. There are
over 35,000 teachers in the state and 5700 were sent surveys. Only 270 responded in the
month in which the survey was open. A larger sample size certainly could yield different
results. If the subgroups of experience were more even, different conclusion might be
made. For example, teachers with the most experience, have tested teaching strategies
and found those that work best. Thus, they are less inclined to make additional changes
(Fessler, 1991; Steffy, 2000). These types of teachers responded more than any other
group. Even though the sample size was small, the interview data provided the thick, rich
descriptive information that supplemented the quantitative data and the findings.
The way in which the qualitative data were grouped influenced the trends
observed. Because social factors administrative feedback, and this was the topic of this
study, this factor may have been elevated in importance. If administrative feedback was
removed from the social group and regrouped into the organizational group, then
organizational influences would predominate as both formative and non-formative. Steffy
(2000) and Fessler (1991) grouped the relationship with the administrator as a social
factor, but it became clear as the study progressed that the feedback might be separated
from the personal or working relationship. Even so, the survey did not ask for this level
of detail, so no conclusions can be made about how best to group the data in this
category.

132
Due to time constraints in their personal schedules while responding to the
survey, teachers may not have considered the range of influences that affected their
practices in the open-ended questions. For example, while other studies found that
perceptions of evaluator expertise were important to teachers (Mahar, 2010), this study
had only a few mentions of this factor. Teachers in all groups of experience may have
provided a partial list. This was apparent in interviews where more details emerged as the
researcher asked follow-up questions. Adding a list of influences with the option to check
as many as apply might have provided different data.
Recommendations for Further Research
Many other approaches to the research questions should be considered for future
research on evaluative feedback. Prior to this study, only teacher perception of how their
practices changed existed (Mahar, 2010). This study provided quantitative data that
addressed specific teaching practices. Even so, the data came from reflections of the
teachers and not from direct observation. A quantitative direct observation study would
be an appropriate next step.
Focusing on one or two teaching practices rather than eight may provide more
precise information on how feedback is connected to changes in practices. Other studies
have approached the research in this way (Rathel, 2008). Because the list of practices in
this study covered all of the State Teaching Standard with multiple sub-criteria, it
required that teachers be familiar with the standards, be familiar with all the sub-criteria,
remember their feedback, and remember their response. Certainly, this requires high
133
levels of recall made more difficult if the feedback was received more than a year ago. A
study that directly links feedback on one or two standards to changes would be
appropriate to address the limitations of this research. Research that focuses on feedback
received within the past year rather than the past three years might be beneficial.
The qualitative portion of the study provided a depth of understanding to the data
that numeric responses only would not. Even so, there are different ways to approach the
study of what accounts for teacher responses to feedback. A case study might be
appropriate for this purpose. This could directly link specific feedback to changes over
time. If a survey was used again, having a drop-down menu of choices might provide
greater diversity of answers. For instance, some responses that were found as discrepant
in this study were found in past research to be significant reasons teachers change or do
not change in response to feedback. It is possible that respondents to this study simply did
not have time to think about all the possible factors that accounted for their response.
Because the respondents in this research did not all receive feedback in the same
way or thought the same format, a study that focuses on one evaluative feedback system
would be beneficial. This has been done by other researchers (Papay, 2012; Shackman,
2012). Even though the State Teaching Standards are the same for all districts, the way in
which the feedback is provided (the feedback form, number of observations, or existence
of a post-evaluation conference) differs. While this study did not ask about how the
feedback was provided, separating these variables out would provide data that would help
administrators and teachers improve the formative effects of the feedback. In addition,

134
research is needed to establish how administrators provide feedback on standards that
they do not directly observe (professional growth, as an example) in typical classroom
observations.
Finally, this study looked at how social, personal, and organizational factors
affected teachers’ responses to feedback. Focusing on one of these factors in reference to
change in practice might yield information that would help teachers change. For instance,
knowing how personal factors such as desire and motivation account for changes might
help teachers be more self-reflective. Social factors such as collaborative learning teams
have been studied extensively, but a case study or phenomenological study that links the
work in these teams to changes in practices is needed.
Implications for Social Change
The purpose of this study was to determine if evaluative feedback was formative
to teaching practices and what factors accounted for changes teachers made in response
to feedback. The findings have implications for how to improve the formative effect of
feedback and how school districts can support teachers in responding to feedback. Based
on the data, it is clear that the feedback is primarily not accomplishing the formative goal
set by the state (Iowa Department of Education, 2013b, Scriven, 1991). Further this study
illuminated areas in the feedback system that could be strengthened to improve its
formative nature. These areas include changing the scope, implementation,
differentiation, evaluator expertise, and adding effective support systems.
135
The state under study has teachers and administrators focus on eight standards,
with many criteria under each. This wide scope had its advantages and disadvantages.
Addressing all eight standards in one year requires time to observe, prepare, and follow-
up on the part of both the administrator and the teacher. Rathel (2008) found that
feedback was more effective if it focused on one instructional practice at a time. It is
possible that by having a broad set of evaluative criteria, what the state gains in
thoroughness, it loses in focus. If evaluators were less pressured to provide a summative
rating of all eight standards, they might be able to provide specific formative feedback
that is immediately useful on any of the sub-criteria. Thus, limiting the scope of the
criteria may improve the efficacy of the feedback.
In the responses on both the survey and in interviews, it was clear that teachers
who received formative feedback made changes to their practices. However, the majority
of teachers did not receive this type of feedback. In fact, one of the top reasons that
teachers did not change was that they did not receive suggestions for improvement.
Teachers noted that the short observation time that occurs once or twice every three years
is not adequate to get an accurate picture of their practices. Thus, the classroom
observations, standard in most systems across the United States, may not be adequate if
feedback is to be formative. More formative feedback might be provided if more time
was allowed for the evaluator to observe and collaborate with the teacher. In interviews,
teachers that changed their practices did so after the administrator sat down with them
and discussed the observation and ways in which to improve. This post-observation
136
conferring was noted as important in other research (Anast-May, 2011) and by teachers in
this study.
Further, the feedback format needs to support formative comments. If the
evaluation form has spaces to mark proficient or not proficient only, then administrators,
strapped for time in an already busy schedule will merely fill out what is there. One
teacher summed up the feelings of others when they said, “The evaluator basically, says,
‘Yep, you sure are teaching to all these standards’, or ‘Nope, you are not teaching the
standards’. It takes them all of about 30 minutes of observation and 10 minutes of writing
up the evaluation form.”
Because this study found that experience influences teacher responds to feedback
in some practices, it is worth examining if differentiating feedback based on experience
might be useful. While responses in only three of the eight standards showed a significant
relationship to teaching experience, evaluative feedback that takes experience into
account in instructional practices, classroom management, and support of district goals
may be more formative than a one size fits all system. The state under study addressed
this need by asking evaluators to provide comprehensive feedback to first year teachers.
However, this feedback is described as summative and nowhere in the guidelines is
formative feedback mentioned (State of Iowa, 2015). However, a mentoring system that
is not dependent on administrators is in place that provides one on one colleague support
to new teachers. This system may be as effective in changing practices as administrative
feedback and demands no time on the part of the administrator. Finally, having peer
137
mentors addresses the problem of lack of evaluator expertise that some teachers in this
study noted. Scriven (1991, 1993) wrote that the formative effects of feedback increase if
the evaluator is an expert in the field. In addition, Scriven believed that feedback was
more effective if more than one evaluator is utilized. Because administrators are not
expected to have suggestions for pedagogical changes in all content areas, same content
colleagues many be a better way to provide formative feedback. However, this type of
feedback has limitations in that it cannot be part of a formal personnel file (State of Iowa,
2015).
Lastly, for teachers to make changes to teaching practices, feedback with support
structures in place to assist with change is critical. Teachers need to feel empowered to
change, have self-confidence, peer support, administrative support, and organizational
support. If feedback is to accomplish its formative goal, these influences need to be
contextualized (Antoniou, 2013, Creemers, 2013). Administrative feedback needs to be
accompanied by an assessment of the support structures that are available to the teacher
with knowledge that these factors vary across the span of a career. In addition, evaluating
administrators need to be cognizant that the amount of organizational change in a district
may affect the fidelity of implementation due teacher needs for time and training. This, in
turn, influences the ability of teachers to act on suggestions in the feedback. Structures
such as collaboration learning teams and opportunities for professional development were
noted by teachers in this study as formative. These contextual supports are necessary for
feedback to achieve its formative effect.
138
The feedback system, to meet its explicit goal of being formative, needs to
change. It is possible that the intended system is not the implemented system. In other
words, the goals of the evaluation systems may not match with the actual outcomes.
Conclusion
The findings from this study add to the literature that measures the efficacy of
evaluative feedback in promoting changes to teaching practices. Specifically, the data
should assist educators and researchers in understanding if administrative evaluative
feedback is formative. The findings should assist administrators and other evaluators
(peers, outside observers, etc.) in providing feedback that is formative by recognizing the
social, emotional, and organizational factors that support change as well as how
experience affects teacher responses to feedback. Evaluator and teachers will benefit
from information about how evaluative feedback can be made efficacious for teachers of
all levels of experience, and specialties. Evaluative feedback that fosters professional
growth benefits all stakeholders-the school, teachers, and students. Evaluative feedback
that does not result in changes in teaching practice becomes a waste of time for both the
evaluator and the teacher (Steele et al., 2010; Ramirez, 2010; Donaldson, 2012).
However, whether or not evaluations lead to change in specific practices has not until
now been known. Evaluation systems that are not evaluated for the efficacy of the
feedback affect student achievement and consume administrator time and critical school
resources. If professional growth is an outcome of the evaluative feedback, schools are
strengthened, teachers are better able to instruct, and student achievement may increase.

139
Ultimately, all students will benefit from an evaluation system that improves teaching
practices.
140
References
Al-Ahdal, A. (2014). High school English teacher professional life cycle: A study in an
EFL context. Theory and Practice in Language Studies, 4(1), 30-38. doi:
10.4303/tpls.4.1.30-38.
Alao, I. (2014). Teacher effectiveness among female teachers in primary and secondary
schools in Nigeria. Journal of Educational Leadership in Action, ISSN 2164-
1102. Retrieved from http://www.lindenwood.edu/ela/issue02/alao.html.
Albright, J., Knezevic, L., & Farrell, L. (2013). Everyday practices of teachers of
English: A survey at the outset of national curriculum implementation. Australian
Journal of Language & Literacy, 36(2), 111-120. ISSN: 10381562.
Alkin, M. (2013). Evaluation roots: A wider perspective of theorists’ views and
influences. Thousand Oaks, CA: Sage.
Anast-May, L., Penick, D. Schroyer, R., & Howell, A. (2011). Teacher conferencing and
feedback: Necessary but missing! International Journal of Educational
Leadership Preparation, 6 (2), ISSN 2155-9635.
Antoniou, P. (2013). A longitudinal study investigating relations between stages of
effective teaching, teaching experience and teacher professional development
approaches. Journal of Classroom Interaction, 48(2), 25-40. ISSN: 0/49-4025.
Association of Supervisors and Curriculum Directors. (2013). Evaluating teachers: A
snapshot. Retrieved from
141
http://www.ascd.org/ASCD/pdf/siteASCD/publications/policypoints/policypoints
_feb13.pdf.
Bakula, N. (2010). The benefits of formative assessments for teaching and learning.
Science Scope, 34(1), 37-43.
Benedict, A. E., Thomas, R. A., Kimerling, J., & Leko, C. (2013). Trends in teacher
evaluation. Teaching Exceptional Children, 45(5), 60-68. ISSN: 00400599.
Berk, R. A. (2009). Using the 360° multisource feedback model to evaluate teaching and
professionalism. Medical Teacher, 31(12), 1073-1080.
doi:10.3109/01421590802572775.
Blank, R., Porter, A., & Smithson, J. (2001). New tools for analyzing teaching,
curriculum and standards in mathematics & science: Results from survey of
enacted curriculum project, 2001. ISBN: 1-884037-73-9.
Bracken, D., & Rose, D. (2011). When does 360-degree feedback create behavior
change? And how would we know it when it does? Journal of Business &
Psychology, 26(2), 183-192. doi: 10.1007/s10869-011-9218-5.
Bubb, D. K., Schraw, G., James, D. E., Brents, B. G., Kaalberg, K. F., Marchand, G. C.,
& Cammett, A. (2013). Making the case for formative assessment: How it
improves student engagement and faculty summative course evaluations.
Assessment Update, 25(3), 8-12. doi:10.1002/au.
Charner-Laird, M. (April, 2007). Ready and willing: Second-stage teachers and
professional collaboration. Paper presented at the Annual Meeting of the

142
American Educational Research Association, Chicago, IL. Retrieved from
http://isites.harvard.edu/fs/docs/icb.topic1240460.files/CLK%20aera%202007%2
0paper%20to%20post.pdf.
Cincinnati Public Schools. (2010). Cincinnati Public Schools 2010–2011 general
operating budget. Retrieved from http://www.cps-k12.org/sites/www.cps-
k12.org/files/pdfs/BdgtBk1011.pdf.
Clark, I. (2012). Formative assessment: Assessment is for self-regulated learning.
Educational Psychology Review, 24(2), 205-249. doi:10.1007/s10648-011-9191-
6.
Clark, S. K., & Byrnes, D. (2012). Through the eyes of the novice teacher: perceptions of
mentoring support. Teacher Development, 16(1), 43-54.
doi:10.1080/13664530.2012.666935.
Claremont University. (2013). Scriven biography. Retrieved from
http://www.cgu.edu/pages/4745.asp.
Creemers, B. (2013). Using the Dynamic Model of Educational Effectiveness to identify
stages of effective teaching. Journal of Classroom Interaction, 48(2), 4-10. ISSN:
0749-4025.
Creswell, J. (2013). Research design. Thousand Oaks, CA: Sage.
Cubberley, E. (1947). Public education in the United States. Retrieved from
https://archive.org/stream/publiceducationi032029mbp/publiceducationi032029m
bp_djvu.txt.
143
Daley, G., & Kim, L. (2010). A teacher evaluation system that works. Retrieved from
http://www.tapsystem.org/publications/wp_eval.pdf.
Danielson, C. (2012). Observing classroom practice. Educational Leadership, 70(3), 32-
37.
Danielson, C., & McGreal, T. (2000). Teacher evaluation. Alexandria, VA: Association
for Supervision and Curriculum Development.
Danielowich, R. M. (2012). Other teachers' teaching: understanding the roles of peer
group collaboration in teacher reflection and learning. Teacher Educator, 47(2),
101-122. doi:10.1080/08878730.2012.660373
Darling-Hammond, L. (2010). Evaluating teacher effectiveness. Retrieved from
http://www.americanprogress.org/issues/education/report/2010/10/19/8502/evalua
ting-teacher-effectiveness/.
Darling-Hammond, L. (2013). Getting teacher evaluation right. Teachers College Press:
New York.
DeCuir–Gunby, J. (2008). Mixed methods research in the social sciences. In J. Osborne
(Ed.), Best practices in quantitative methods. (pp. 125-137). Thousand Oaks, CA:
Sage Publications, Inc. Retrieved from
http://dx.doi.org.ezp.waldenulibrary.org/10.4135/9781412995627.d11.
Despain, J. & Juarez-Torres, R. (2012). Teachers’ and administrators’ perceptions of
observation and evaluation as affecting teacher performance. Shepperd Journal of
Practical Leadership, 6(1). Retrieved from http://aa.utpb.edu/jbs-leadership-
144
institute/the-john-ben-shepperd-journal-of-practical-leadership/2012-journal-
archives/.
DeStefano, L, Hammer, V., Fiedler, E., & Downs, H. (2006). The impact of the standards
–aligned classroom initiative on the implementation of the Illinois learning
standards during 2005-2006. Retrieved from
http://www.isbe.state.il.us/ils/pdf/05_sac_final_rev1.pdf.
Dewey, J. (1938/1997). Experience and education. New York, NY: Touchstone Press.
Donaldson, M. (2012). Teachers’ perspectives on evaluation reform. Retrieved from
Center for American Progress.com.
Donaldson, M., & Peske, H. (2010). Supporting effective teaching through evaluation: A
study of teacher evaluation in five charter schools. Retrieved from
http://www.americanprogress.org/issues/education/report/2010/03/10/7381/suppo
rting-effective-teaching-through-teacher-evaluation/.
Donaldson, S. (2013). The future of evaluation in society: A tribute to Michael Scriven.
Charlotte, N.C.: Information Age Publishing.
Donaldson, S., Patton, M., Fetterman, D., & Scriven, M. (2010). The 2009 Claremont
debates: The promise and pitfalls of utilization-focused and empowerment
evaluation. Journal of Multidisciplinary Evaluation, 6(13), 15-57. ISSN: 1556-
8180.
Erikson, E. (1963). Childhood and society. New York, NY: Norton Publishing.
145
Eros, J. (2013). Second-stage music teachers’ perceptions of their professional
development. Journal of Music Teacher Education, 22(2), 20-33.
doi:10.1177/1057083712438771.
Fessler, R. (1992). Teacher career cycle. Boston, MA: Allyn and Bacon.
Fink, A. (2002). The Survey Handbook. Thousand Oaks, CA: SAGE Publications. doi:
http://dx.doi.org.ezp.waldenulibrary.org/10.4135/9781412986328.n4.
Fink, A. (2003). How to manage, analyze and interpret survey data. Thousand Oaks, CA:
Sage Publications.
Flick, U. (2007). Managing Quality in Qualitative Research. London, England: Sage
Publications.
Fox, R., & Contractor, S. (2008). An investigation of the relationship between the
number of response categories and scale sensitivity. AMA Winter Educators'
Conference Proceedings, 19, 419-420.
Frankfort-Nachmias, C., & Nachmias, D. (2008). Research methods in the social
sciences. New York: Worth Publishing.
Frels, R. K., & Onwuegbuzie, A. J. (2013). Administering quantitative instruments with
qualitative interviews: A mixed research approach. Journal of Counseling &
Development, 91(2), 184-194. doi:10.1002/j.1556-6676.2013.00085.x.
Gagnon, J., & Maccini, P. (2007). Teacher-reported use of empirically validated and
standards-based instructional approaches in secondary mathematics. Remedial
and Special Education, 28(1), 43-56.
146
Gallagher, C., Rabinowitz, S., & Yeagley, P. (2011). Measuring teacher effectiveness: An
overview of state policies and practices related to pre-K-12 teacher effectiveness
or teacher evaluation. Retrieved from http://eric.ed.gov/?id=ED524220.
Gaudreault, L., & Woods, A. (2013). Factors leading to career frustration and exit: A case
of a veteran physical educator. Journal of Physical Education and Sports
Management, 4(4), 51-61. doi: 10.5897/JPESM2012.0159.
Goe, L., Bell, C., & Little, O. (2008). Approaches to evaluating teacher effectiveness: A
research synthesis. Retrieved from
http://www.educationsector.org/publications/waiting-be-won-over.
Guba, E., & Lincoln, Y. (1989). Fourth generation evaluation. Newbury Park, CA: Sage.
Guerra-Lopez, I. (2007). The impact evaluation process, part 1: Building a case for
demonstrating the worth of performance improvement interventions. Retrieved
from www.ispi.org.
Hazi, H. M., & Rucinski, D. (2009). Teacher evaluation as a policy target for improved
student learning: A fifty state review of statute and regulatory action since NCLB.
Education Policy Analysis Archives, 17(5), 1-19. ISSN: 1068–2341.
Heneman, H., Milanowski, A. (2003). Continuing assessment of teacher reactions
towards standards-based teacher evaluation systems. Journal of Personnel
Evaluation in Education, 17(2), 173-195.
Hensel, R., Meijers, F., van der Leeden, R., &Kessels, J. (2010). 360 degree feedback:
How many raters are needed for reliable ratings on the capacity to develop

147
competences, with personal qualities as developmental goals? International
Journal of Human Resource Management, 21(15), 2813-2830.
doi:10.1080/09585192.2010.528664.
Hesse-Biber, S. (2010). Mixed methods research: Merging theory with practice. New
York, NY: Guildford Press.
Ho, A. D., &Kane, T. J. (2013). The reliability of classroom observations by school
personnel. Retrieved from
http://www.metproject.org/downloads/Preliminary_Finding-Policy_Brief.pdf.
Hudesman, J., Crosby, S., Flugman, B., Issac, S., Everson, H., & Clay, D. B. (2013).
Using formative assessment and metacognition to improve student achievement.
Journal of Developmental Education, 37(1), 2-13. ISSN: 0894-3907.
Humphrey, D., Koppich, J., Bland, J., & Bosetti, K. (2011). Peer review: Getting serious
about teacher evaluation. Menlo Park, CA: SRI International.
Iowa Department of Education (2013a). Iowa teaching standards. Retrieved from
http://educateiowa.gov/index.php?option=com_content&task=view&id=1684&Ite
mid=2486.
Iowa Department of Education. (2013b). Teacher evaluation. Retrieved from
http://educateiowa.gov/index.php?option=com_content&view=article&id=538&It
emid=3316.
Iowa Department of Education. (2015). Beginning Teachers Comprehensive Evaluation
Form. Retrieved from
148
https://www.educateiowa.gov/sites/files/ed/documents/0506_tq_beginningteacher
comprehensiveevaluation.pdf.
Giuseppe, I. (2006). Power of survey design: A user’s guide for managing surveys,
interpreting results, and influencing respondents. Herndon, VA: World Bank
Publications.
Hesse-Biber, S. (2010). Mixed methods research: Merging theory with practice. New
York, NY: Guildford Press.
Jacob, B. A., & Lefgren, L. (2008). Can principals identify effective teachers? Evidence
on subjective performance evaluation in education. Journal of Labor Economics,
26(1), 101-136.
Jewett, P., & MacPhee, D. (2012). Adding collaborative peer coaching to our identities.
The Reading Teacher, 66(2); 105-110. doi: 10.1002/TRTR.01089.
Johnson, S., Papay, J., Fiarman, S., Munger, M., & Qazilbash, E. (2010). Teacher to
teacher: Realizing the potential of the Peer Assistance Review Program. Retrieved
from http://www.americanprogress.org/wp-
content/uploads/issues/2010/05/pdf/par.pdf.
Kealey, E. (2010). Assessment and evaluation in social work education: Formative and
summative approaches. Journal of Teaching in Social Work, 30(1), 64-74.
doi:10.1080/08841230903479557.
149
Kleiger, A., & Yakobovitch, A. (2011). Perception of science standards’ effectiveness
and their implementation by science teachers. Journal of Science Education
Technology, 20, 286-299. doi: 10.1007/s10956-010-9253-4.
Kyriakides, L., Creemers, B., & Antoniou, P. (2009). Teacher behavior and student
outcomes: Suggestions for research on teacher training and professional
development. Teaching and Teacher Education, 25(1), 12-23. doi:
10.1016/j/tate/2008/06.001.
Lavrakas, P. (2008). Encyclopedia of survey research. Retrieved from
http://dx.doi.org.ezp.waldenulibrary.org/10.4135/9781412963947.
Laswell, T. A., Pace, N. J., & Reed, G. A. (2008). Weighing in: Rural Iowa principals'
perceptions of state-mandated teaching evaluation standards. Rural Educator,
29(3), 40-44.
Lee, E., & Forthofer, R. (2006). Analyzing complex survey data. Thousand Oaks, CA:
Sage Publications.
Lincoln, Y., & Guba, Y. (1985). Naturalistic inquiry. Thousand Oaks, CA: Sage
Publications.
Lodico, M. G., Spaulding, D. T., & Voegtle, K. H. (2010). Methods in educational
research. San Francisco, CA: Jossey-Bass Publishers.
Lotter, C., Singer, J., & Godley, J. (2009). The influence of repeated teaching and
reflection on preservice teachers’ views of inquiry and nature of science. Journal
of Science Teacher Education, 20(6), 553-582. doi:10.1007/s10972-009-9144-9.

150
Looney, J. (2011). Developing high-quality teachers: Teacher evaluation for
improvement. European Journal of Education, 46(4), 440-455.
doi:10.1111/j.1465-3435.2011.01492.x.
Mascia, M., Pailler, S., Thieme, M., Rowe, A., Bottrill, M., & Danielson, F. (2014).
Commonalities and complementarities among approaches to conservation
monitoring and devaluation. Biological Conservation, 169, 258-267.
doi:10.1016/j.biocon.2013.11.017.
Mahar, J., & Strobert, B. (2010). The use of 360-degree feedback compared to traditional
evaluative feedback for the professional growth of teachers in K-12 education.
Planning and Changing, 41(3-4), 147-160. Retrieved from
http://ezp.waldenulibrary.org/login?url=http://search.proquest.com/docview/8632
40720?accountid=14872.
Marzano, R. J. (2012). The two purposes of teacher evaluation. Educational Leadership,
70(3), 14-19.
Marzano, R., Frontier, T., & Livingston, D. (2011). Effective Supervision. Alexandria,
VA: ASCD.
Maskit, D. (2011). Teachers’ attitudes toward pedagogical changes during various stages
of professional development. Teaching and Teacher Education 27(5), 851-860.
doi: 10.1016/j.tate.2011.01.009.
Maslow, A. H. (1943). A theory of human motivation. Psychological Review, 50(4), 370-
396. doi:10.1037/h0054346

151
Masters J. R. (1974). The relationship between number of response categories and
reliability of Likert-type questionnaires. Journal of Educational Measurement, 11
(1), 49–53. Retrieved f rom
http://dx.doi.org.ezp.waldenulibrary.org/10.1111/j.1745-3984.1974.tb00970.x.
Mayer, D. (1999). Measuring instructional practice: Can policymakers trust survey data?
Educational Evaluation and Policy, 21(1), 29-45. doi:
10.3102/01623737021001029.
McDonald, J. H. (2009). Handbook of Biological Statistics. Sparky House Publications:
Baltimore, MD.
Meister, D., & Ahrens, P. (2011). Resisting plateauing: Four veteran teachers’ stories.
Teaching and Teacher Education, 27, 770-778. doi: 10.1016/j.tate.2011.01.002.
Measures of Effective Teaching. (2010). Learning about teaching: Initial findings from
the Measures of Effective Teaching Project. Retrieved from
http://www.metproject.org/downloads/Preliminary_Finding-Policy_Brief.pdf.
Measures of Effective Teaching. (2012). Gathering feedback for teaching: Combining
high quality observations with student surveys and achievement gains. Retrieved
from
http://www.metproject.org/downloads/MET_Gathering_Feedback_Practioner_Bri
ef.pdf
152
Measure of Effective Teaching. (2013). Ensuring fair and reliable measures of effective
teaching: Culminating findings from the MET Project's three-year study.
Retrieved from http://files.eric.ed.gov/fulltext/ED540958.pdf.
Multon, K. (2010). Test–retest reliability. In Neil J. Salkind (Ed.), Encyclopedia of
research design. (pp. 1496-1499). Thousand Oaks, CA: Sage Publications, Inc.
doi: http://dx.doi.org.ezp.waldenulibrary.org/10.4135/9781412961288.n457.
Murphy, K. R. (2008). Perspectives on the relationship between job performance and
ratings of job performance. Industrial and Organizational Psychology:
Perspectives on Science and Practice, 1(2), 197-205. doi:10.1111/j.1754-
9434.2008.00039.x
National Board for Professional Teaching Standards. (2013). Certificate areas. Retrieved
from http://www.nbpts.org/certificate-areas.
National Center for Educational Statistics (2000). NAEP 1999: Trends in academic
progress. Retrieved from
http://nces.ed.gov/nationsreportcard/pubs/main1999/2000469.asp.
National Center for Educational Statistics (2012). U.S. states in a global context: Results
from the 2011 NEAP-TIMSS linking. Retrieved from
http://nces.ed.gov/pubsearch/pubsinfo.asp?pubid=2013460.
Norman, A. D. (2010). Assessing accomplished teaching: Good strides, great challenges.
Theory into Practice, 49(3), 203-212. doi:10.1080/00405841.2010.487755.

153
Odden, A. (2011). Strategic management of human capital in education. New York, NY:
Routledge.
OECD. (2009). Creating effective teaching and learning environments: First results from
TALIS. Retrieved from www.oecd.org/publishing/corrigenda.
Papay, J. P., & Johnson, S. M. (2012). Is PAR a good investment? Understanding the
costs and benefits of teacher peer assistance and review programs. Educational
Policy 26(5), 696.
Parise, L. & Spillane, J. (2010). Teacher learning and instructional change: how formal
and on-the-job learning opportunities predict change in elementary school
teachers’ practice. The Elementary School Journal, 110(3), 323-346.
Parker, D., & Volante, L. (2009). Responding to the challenges posed by summative
teacher candidate evaluation: A collaborative self-study of practicum supervision
by faculty. Studying Teacher Education, 5(1), 33-44. doi:
10.1080/17425960902830385.
Partee, G. (2012). Using multiple evaluation measures to improve teacher effectiveness.
Retrieved from americanprogress.org.
Patton, M. (2002). Qualitative research and evaluation methods (3rd ed.). Thousand
Oaks, CA: Sage Publications, Inc.
Penuel, W., Fishman, B., Gallagher, L. (2008). Is alignment enough? Investigating the
effects of state policies and professional development on science curriculum
154
implementation. Retrieved from www. Interscience.wiley.com. doi:
10.1002/sce.20321.729.
Pennington, J. (2012). Feedback for our most important investment: Educators. Retrieved
from https://www.educateiowa.gov/annual-condition-education-report-pk-12.
Popham, J. (2008). Transformative assessment. Alexandria, VA: ASCD.
Porter, A. (202). Measuring the content of instruction: Uses in research and practice.
Educational Researcher, 31(7). doi: 10.3102/0013189X031007003.
Powell, H., Mihalas, S., Onwuegbuzie, A. J., Suldo, S., & Daley, C. E. (2008). Mixed
methods research in school psychology: A mixed methods investigation of trends
in the literature. Psychology in the Schools, 45, 291–309. doi:10.1002/pits.20296.
Ramirez, L., Lamphere, M., Smith, J., Brown, S., Pierceall-Herman, J. (2010). Teacher
development and evaluation: A study of policy and practice in Colorado. Paper
presented at the American Evaluators Research Association meeting, May 2010.
Range, B., Scherz, S., Holt, C., & Young, S. (2011). Supervision and evaluation: The
Wyoming perspective. Educational Assessment, Evaluation & Accountability,
23(3), 243-265. doi:10.1007/s11092-011-9123-5.
Rathel, J., Drasgow, E., & Christie, C. (2008). Effects of supervisor performance
feedback on increasing preservice teachers' positive communication behaviors
with students with emotional and behavioral disorders. Journal of Emotional and
Behavioral Disorders 16(67). doi: 10.1177/1063426607312537.
155
Richardson, R., Kalvaitis, D., Delparte, D. (2014). Using systematic feedback and
reflection to improve adventure education teaching skills, Journal of Experiential
Education, 37(2), 187-206. doi: 10.1177/1053825913503116.
Richter, D., Kunter, M., Dlusmann, U., Ludtke, O., & Baumert, J. (2011). Professional
development across the teaching career: Teachers’ uptake of formal and informal
learning opportunities, Teaching and Teacher Education, 27(1), 116-126.doi:
10.1016/j.tate.2010.07.008.
Ross, J., McDougall, D., Hogaboam-Gray, A. (2003). A survey measuring elementary
teachers’ implementation of standards based mathematics teaching. Journal for
Research in Mathematics Education, 34(4), 344-363.
Ross, J. A., Barkaoui, K., & Scott, G. (2007). Evaluations that consider the cost of
educational programs: The contribution of high-quality studies. American Journal
Of Education, 28(4), 477-492. doi:10.2307/30034787.
Salehi, K., & Golafshani, N. (2010). Using mixed methods in research studies: An
opportunity with its challenges. International Journal of Multiple Research
Approaches, 4, 186-191.
Sapsford, R. (2007). Survey research. London, England: Sage Publications.
Sartain, L., Stoelin, S., & Brown, E. (2011). Rethinking teacher evaluation in Chicago.
Retrieved from http://www.joycefdn.org/assets/1/7/Teacher-Eval-Report-
FINAL1.pdf.
156
Schmitt, N. (2012). The Oxford handbook of personnel assessment and selection.
Retrieved from
http://www.oxfordhandbooks.com.proxy.lib.uiowa.edu/view/10.1093/oxfordhb/9
780199732579.001.0001/oxfordhb-9780199732579-e-1. doi:
10.1093/oxfordhb/9780199732579.013.0001.
Scriven, M. (1967). The methodology of evaluation. In R.W. Tyler, R.M. Gagne, and M.
Scriven (Eds.), Perspectives of curriculum evaluation, Volume 1. Chicago, IL:
Rand McNally.
Scriven, M. (1990). Can research-based teacher evaluation be saved? Journal of
Personnel Evaluation in Education, 4, 19-32. Retrieved from
http://download.springer.com/static/pdf/353/art%253A10.1007%252FBF0017712
7.pdf?auth66=1410827214_c8b5b6e8660f9dbd7dcc8293765c7b82&ext=.pdf.
Scriven, M. (1991). Evaluation thesaurus. Thousand Oaks, CA: Sage Publications.
Scriven, M. (1993). Hard-won lesson in program evaluation. In New directions for
program evaluation, San Francisco, CA: Jossey-Bass.
Scriven, M. (1994). Duties of the teacher. Journal of Personnel Evaluation in Education,
8, 151-184. Retrieved from
http://link.springer.com.proxy.lib.uiowa.edu/article/10.1007/BF00972261.
Scriven, M. (1995). A unified theory approach to teacher evaluation. Studies in
Educational Evaluation, 21(2), 111-129.
157
Scriven, M. (1996). Types of evaluation and types of evaluator. Evaluation Practice,
17(2), 151.
Scriven, M. (2010). Rethinking evaluation methodology. Journal of Multi-Disciplinary
Evaluation, 6(13), ISSN: 1556-8180.
Scriven, M. (2013). Conceptual revolutions in evaluation: Past, present, and future. In M.
Alkin (Ed.), Evaluation Roots: A wider perspective of theorists’ views and
influences. Thousand Oaks, CA: Sage.
Scriven, M. (March, 2013). The good old days and the schizophrenic break in the history
of evaluation. Webinar recorded at Claremont Evaluation Center, Claremont, CA.
Retrieved from http://www.cgu.edu/pages/10257.asp.
Shackman, K., DeMeo Cook, K., Riordan, J. Sanchez, M., Bret, J. (2012). An
examination of performance-based teacher evaluation systems in five states.
Retrieved from http://ies.ed.gov/pubsearch/pubsinfo.asp?pubid=REL2012129.
Shadish, W., Cook, T., and Leviton, L. (1991). Foundations of program evaluation.
Thousand Oaks, CA: Sage Publications,
Staiger, D., & Rockoff, J. (2010). Searching for perfect teachers with imperfect
information. Journal of Economic Perspectives, 24(3), 97-118.
doi:10.1257/jep.24.3.97.
Stecher, B., Garet, M., Holtzman, D., & Hamilton, L. (2012). Implementing measures of
teacher effectiveness. Phi Delta Kappan, 94(3), 39-43.
158
Steele, Jennifer L., Hamilton, L., & Stecher, B. (2010). Incorporating student
performance measures into teacher evaluation systems. Retrieved from
http://www.rand.org/pubs/technical_reports/TR917.
Steffy, B. (2000). Life cycle of the career teacher. Thousand Oaks, CA: Corwin Press.
Stufflebeam, D., & Shinkfield, A. (2007). Evaluation theory, models, and applications.
San Francisco, CA: Jossey-Bass.
Supovitz, J., Sirinides, M., & May, H. (2010). How principals and peers influence
teaching and learning. Educational Administration Quarterly, 46(1), 31-56. doi:
10.1177/1094670509353043.
Tashakkori, A., & Teddlie, C. (2003) The past and future of mixed methods research:
From data triangulation to mixed model designs. In A. Tashakkori & C. Teddlie
(Eds.), Handbook of mixed methods in social and behavioral research. Thousand
Oaks, CA: Sage.
Tashakkori, A., & Teddlie, C. (2008). Foundations of mixed methods research:
Integrating quantitative, qualitative research in the social and behavioral sciences.
Thousand Oaks, CA: Sage.
Taylor, Eric S., & Tyler, J., (2012). The effect of evaluation on teacher performance.
American Economic Review, 102(7), 3628-51. doi: 10.1257/aer.102.7.3628.
Tennessee State Department of Education. (2012). Teacher evaluation in Tennessee: A
report on year one implementation. Retrieved from
http://www.tn.gov/education/doc/yr_1_tchr_eval_rpt.pdf.

159
Theall, M. (2010). Evaluating teaching: From reliability to accountability. New
Directions for Teaching and Learning, 123, 85-95. doi: 10.1002/tl.412.
The Joint Committee on Standards for Educational Evaluation. (2009). The personnel
evaluation standards. Thousand Oaks, CA: Corwin.
Thyer, B. (2001). The handbook of social work research methods. Thousand Oaks, CA:
Sage Publications, Inc. Retrieved from
http://dx.doi.org.ezp.waldenulibrary.org/10.4135/9781412986182.n15.
Tyler, R. W. (1967). Perspectives of Curriculum Evaluation. Chicago, IL: Rand McNally
& Company.
Trobia, A. (2008). Sampling. In Paul J. Lavrakas (Ed.), Encyclopedia of survey research
methods. (pp. 784-785). Thousand Oaks, CA: Sage Publications, Inc. Retrieved
from http://dx.doi.org.ezp.waldenulibrary.org/10.4135/9781412963947.n508.
United States Department of Education. (2004). Helping practitioners meet the goals of
No Child Left Behind. Retrieved from
http://www2.ed.gov/about/offices/list/os/technology/reports/help-pract.pdf.
United States Department of Education. (2011). Improving teacher quality state grants.
Retrieved from www2.ed.gov/about/inits/ed/edfacts/eden/xml/x166-7-6.doc.
United States Department of Education. (2014). Teacher incentive funds. Retrieved from
http://www2.ed.gov/about/offices/list/oese/programs.html#aitq.
Weems, D., & Rogers, C. Are US teachers making the grade? Management in Education,
24(1), 19-24. doi: 10.1177/0892020609354959.
160
Weisberg, D., Sexton, S., Mulhern, J., & Keeling, D. (2009). The widget effect.
Education Digest, 31-35.
Wise, A. E., & Darling-Hammond, L. (1984). Teacher evaluation and teacher
professionalism. Educational Leadership, 42(4), 28-33.
Wivagg, J. (2008). Forced choice. In Paul J. Lavrakas (Ed.), Encyclopedia of survey
research methods. (pp. 290-291). Thousand Oaks, CA: Sage Publications, Inc.
doi: http://dx.doi.org.ezp.waldenulibrary.org/10.4135/9781412963947.n193.
Wolcott, H. (1994). Transforming qualitative data. Thousand Oaks, CA: Sage
Publications.
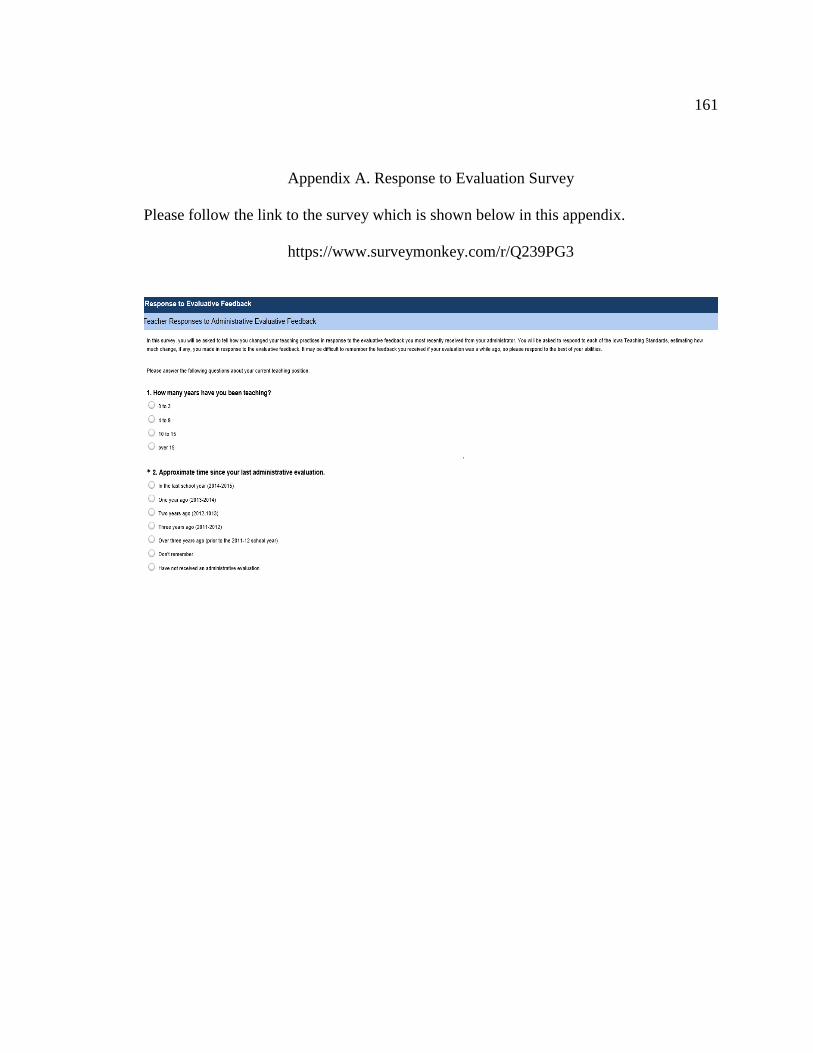
161
Appendix A. Response to Evaluation Survey
Please follow the link to the survey which is shown below in this appendix.
https://www.surveymonkey.com/r/Q239PG3
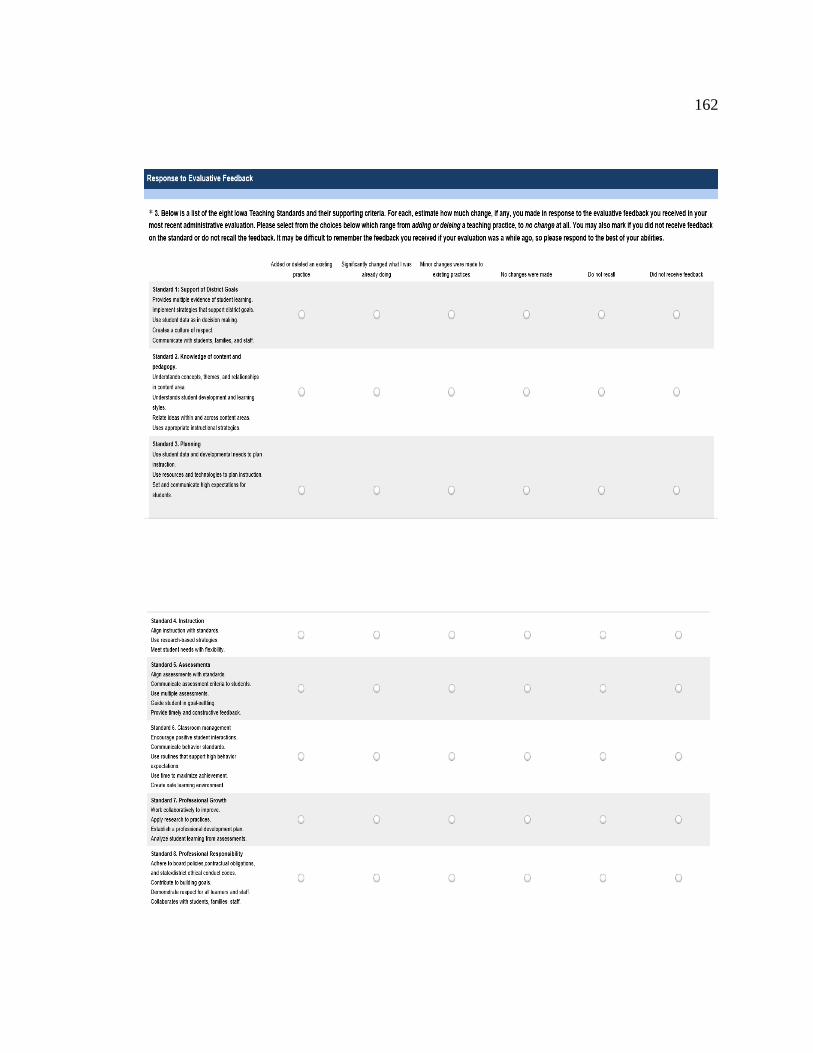
162
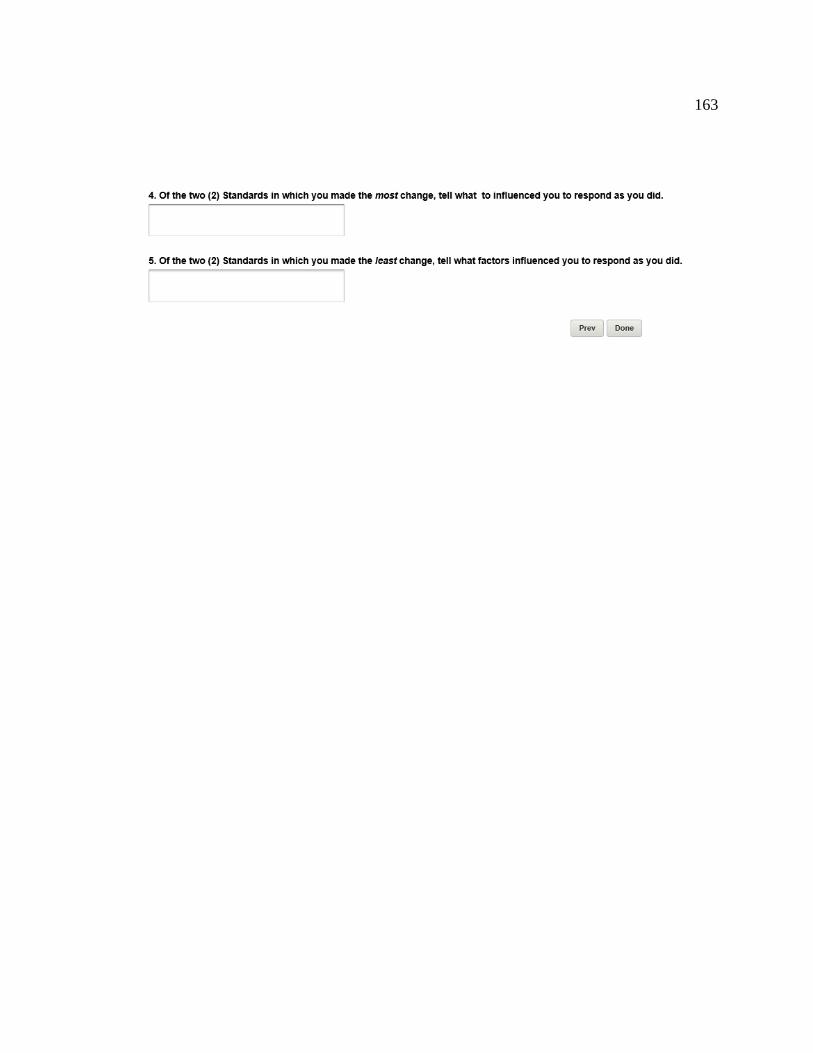
163

164
Appendix B. Invitation and Consent for Response to Evaluation Survey and Invitation for
Participation in Interview
Dear teaching colleague,
I am asking you to participate in a brief survey of current K-12 Iowa teachers who have
had an administrative evaluation in the last three years to determine the extent to which
evaluative feedback from administrators affects teaching practices. This research project
is part of my doctoral work in Curriculum, Instruction, and Assessment at Walden
University and should take about 15 minutes of your time. Participation in this study is
voluntary, and all responses from the survey will be anonymous.
The survey is available via the link below. Once the survey opens, you will see a list of
the Iowa Teaching Standards and be asked to tell which criteria you changed, if any, as a
response to the feedback you received on your most recent administrative evaluation.
The results of the survey will help in the continued assessment Iowa’s evaluation
practices and policies. This data should help improve teacher evaluations so that they lead
to improved teaching practices and student learning.
Further, this study will examine why teachers respond to evaluative feedback as they do.
I also invite you to participate in a phone or face to face interview during which I will ask
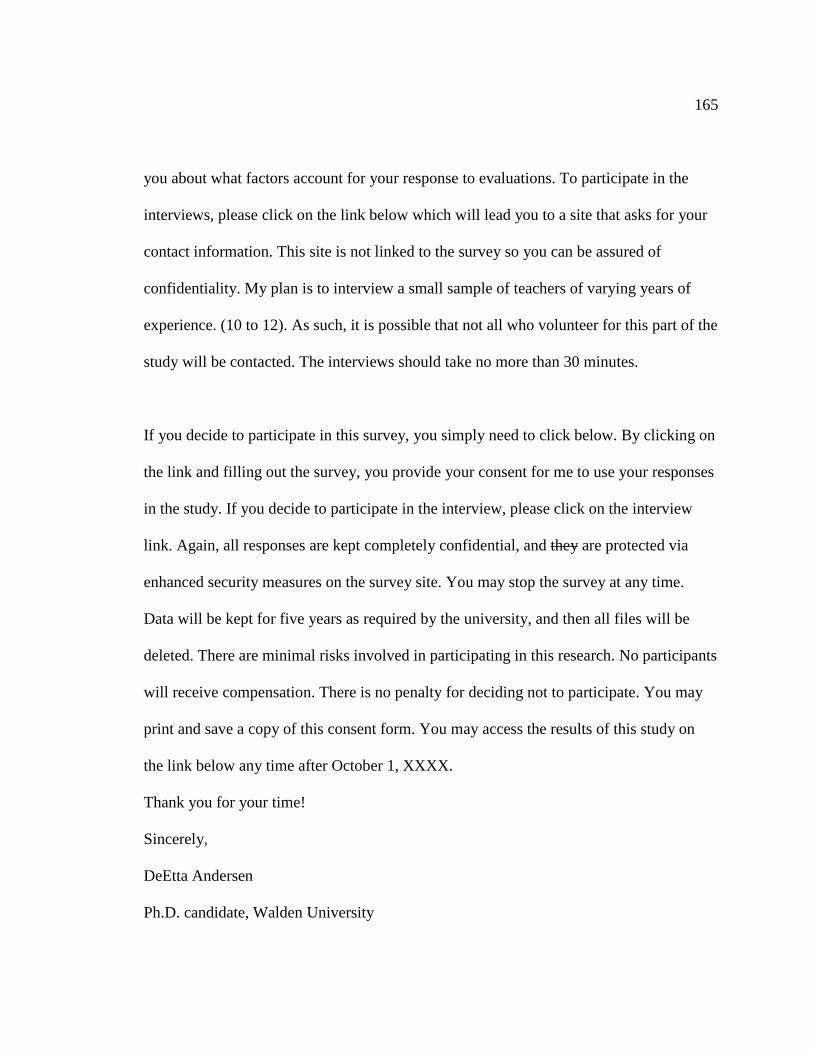
165
you about what factors account for your response to evaluations. To participate in the
interviews, please click on the link below which will lead you to a site that asks for your
contact information. This site is not linked to the survey so you can be assured of
confidentiality. My plan is to interview a small sample of teachers of varying years of
experience. (10 to 12). As such, it is possible that not all who volunteer for this part of the
study will be contacted. The interviews should take no more than 30 minutes.
If you decide to participate in this survey, you simply need to click below. By clicking on
the link and filling out the survey, you provide your consent for me to use your responses
in the study. If you decide to participate in the interview, please click on the interview
link. Again, all responses are kept completely confidential, and they are protected via
enhanced security measures on the survey site. You may stop the survey at any time.
Data will be kept for five years as required by the university, and then all files will be
deleted. There are minimal risks involved in participating in this research. No participants
will receive compensation. There is no penalty for deciding not to participate. You may
print and save a copy of this consent form. You may access the results of this study on
the link below any time after October 1, XXXX.
Thank you for your time!
Sincerely,
DeEtta Andersen
Ph.D. candidate, Walden University

166
Center Point Urbana High School, Science Teacher
To take the survey, click here: XXXX
To participate in interview, click here: ZZZZZ
To access the results of the survey and interviews after October 1, 20XX, return to
the link listed above.
If you have questions, you may contact me at [email protected] or at (319)
849-1102 extension 92230. If you want to talk privately about your rights as a participant,
you can call Dr. Leilani Endicott at Walden University. Her phone number is 1-612-312-
1210. Walden University’s approval number for this study is 12-29-15-0310539, and it
expires on 12/28/2016. Please save this consent form for your records.

167
Appendix C. Interview Protocol
Interviewer: DeEtta Andersen
Interviewees
Teachers in one Midwestern state who have consented to participate in the study.
All interviewees will have signed an informed consent form that includes intent to keep
responses confidential.
Purpose of interview
To acquire qualitative data related to reason(s) that teachers changed or did not
change their teaching practices as a result of evaluative feedback.
Type of interview
The researcher will interview teachers one on one.
Location
It is expected that the interviews will be conducted at a neutral location away
from the workplaces of the teachers. The room will be selected by the interviewer.
Efforts will be made to ensure that the room is private, comfortable, and free of
interruptions.
Method of data recording
The interviewer will have a voice recorder and take field notes.
Procedure
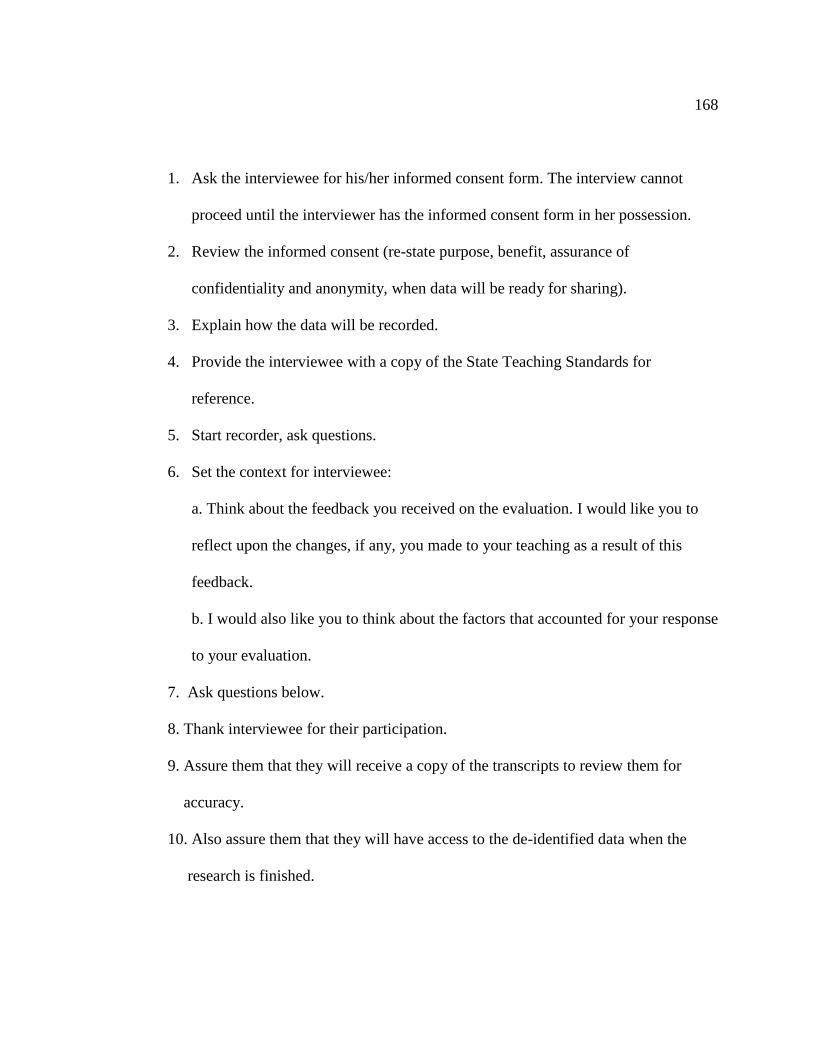
168
1. Ask the interviewee for his/her informed consent form. The interview cannot
proceed until the interviewer has the informed consent form in her possession.
2. Review the informed consent (re-state purpose, benefit, assurance of
confidentiality and anonymity, when data will be ready for sharing).
3. Explain how the data will be recorded.
4. Provide the interviewee with a copy of the State Teaching Standards for
reference.
5. Start recorder, ask questions.
6. Set the context for interviewee:
a. Think about the feedback you received on the evaluation. I would like you to
reflect upon the changes, if any, you made to your teaching as a result of this
feedback.
b. I would also like you to think about the factors that accounted for your response
to your evaluation.
7. Ask questions below.
8. Thank interviewee for their participation.
9. Assure them that they will receive a copy of the transcripts to review them for
accuracy.
10. Also assure them that they will have access to the de-identified data when the
research is finished.
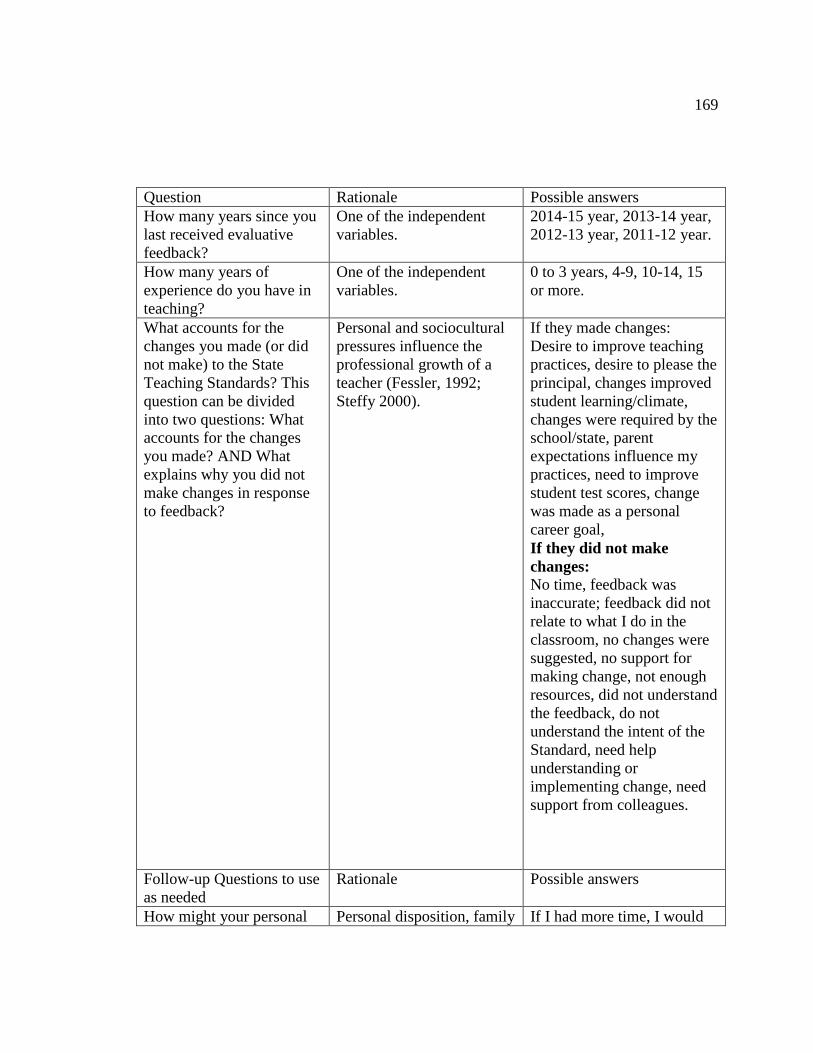
169
Question Rationale Possible answers
How many years since you
last received evaluative
feedback?
One of the independent
variables.
2014-15 year, 2013-14 year,
2012-13 year, 2011-12 year.
How many years of
experience do you have in
teaching?
One of the independent
variables.
0 to 3 years, 4-9, 10-14, 15
or more.
What accounts for the
changes you made (or did
not make) to the State
Teaching Standards? This
question can be divided
into two questions: What
accounts for the changes
you made? AND What
explains why you did not
make changes in response
to feedback?
Personal and sociocultural
pressures influence the
professional growth of a
teacher (Fessler, 1992;
Steffy 2000).
If they made changes:
Desire to improve teaching
practices, desire to please the
principal, changes improved
student learning/climate,
changes were required by the
school/state, parent
expectations influence my
practices, need to improve
student test scores, change
was made as a personal
career goal,
If they did not make
changes:
No time, feedback was
inaccurate; feedback did not
relate to what I do in the
classroom, no changes were
suggested, no support for
making change, not enough
resources, did not understand
the feedback, do not
understand the intent of the
Standard, need help
understanding or
implementing change, need
support from colleagues.
Follow-up Questions to use
as needed
Rationale Possible answers
How might your personal Personal disposition, family If I had more time, I would

170
life situation (family
obligations, hobbies) have
affected how you
responded to evaluative
feedback?
obligations, personal
health, outside interests,
and aspirations influence
the professional growth of a
teacher (Fessler, 1992)
attend workshops or
conferences. I barely have
time to get what is expected
of me done, so innovating is
out of the question.
How did your personal
career goals influence your
response to the feedback?
Teachers in the professional
stage of teaching are
characterized by having a
commitment to growth
(Steffy, 2000).
I want to be a good teacher,
so I make changes every day.
How did the culture of the
school influence how you
responded to the
evaluations? In other
words, how might school
rules, administrative
management, public trust,
or professional
organizations have
influenced your response?
Organizational culture
influences the professional
growth of a teacher
(Fessler, 1992).
We are supported (not
supported) by our
administrator in making
changes. We are required to
use student test scores in
planning curricula. Parents
expect that the curriculum is
individualized and rigorous.
Would like the school to
support leave time for
attending conferences.
How much of a role did
student test scores or other
measures of achievement
influence your response to
the evaluation?
Organizational influences
such as student test scores
affect the professional
growth of a teacher
(Fessler, 1992).
Test scores are
important/unimportant in
changing my practices.
How much of a role did
interaction with colleagues
play in how you responded
to evaluative feedback?
Teachers in the apprentice
stage rely on collegial
feedback (Steffy, 2000).
Collegial interactions
promote my professional
growth. I do not have any
collegial interactions that
relate to what I do in the
classroom.
How much of a role did
parental expectations play
in how you made changes
to your practice?
Pressure from community
members influence teachers
actions in the classroom
(Fessler, 1992). Teachers in
the wind down stage are
weary of dealing with
outside expectations
(Fessler, 1992).
Parents expect that the
curriculum is individualized
and rigorous.
Some parents are interested,
others do not care.
The school board is/is not a
factor in how I operate in the
classroom.
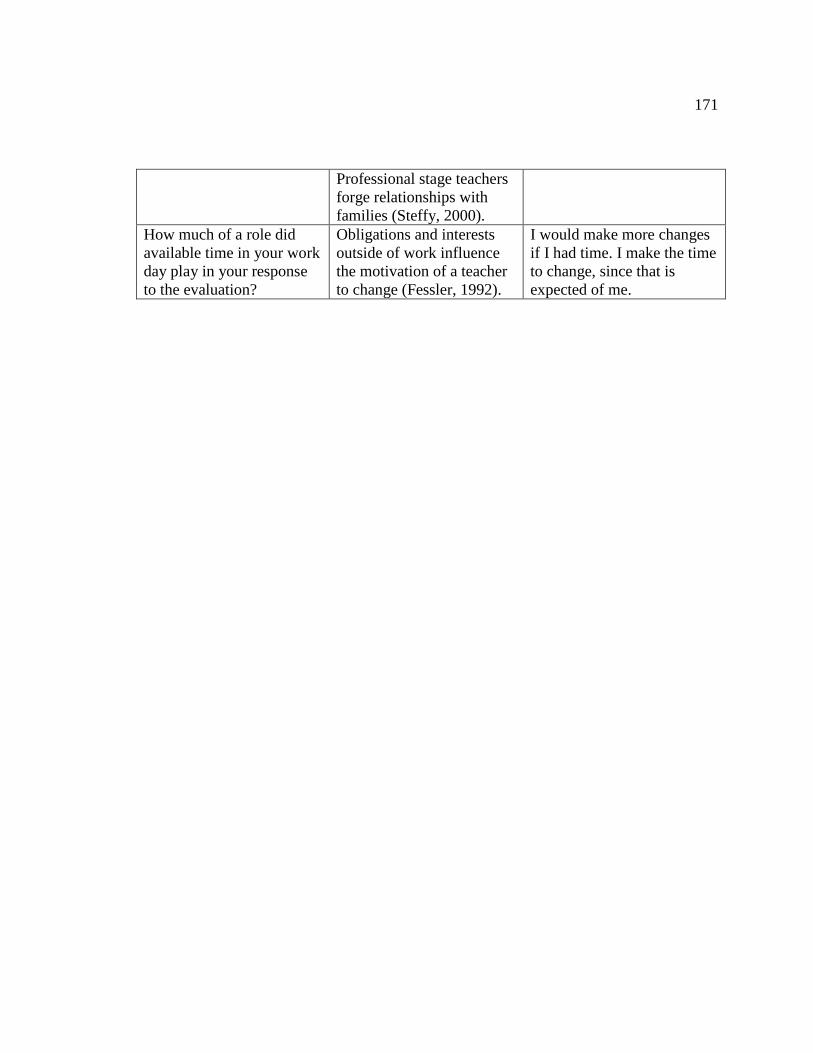
171
Professional stage teachers
forge relationships with
families (Steffy, 2000).
How much of a role did
available time in your work
day play in your response
to the evaluation?
Obligations and interests
outside of work influence
the motivation of a teacher
to change (Fessler, 1992).
I would make more changes
if I had time. I make the time
to change, since that is
expected of me.

172
Appendix D. Consent Form for Interviews
Dear Colleague,
I am asking if you would consent to an interview about what influences the changes you
make to your teaching in response to feedback from administrators. This interview will
be conducted in private and all responses will remain strictly confidential. This research
project is part of my doctoral work in Curriculum, Instruction, and Assessment at Walden
University. The interview should take about 1 hour of your time.
A survey sent online to other Iowa teachers will provide information about what teaching
practices are changed and to what extent. The interviews should add to this information
by accounting for factors that influence changes you make to your teaching. The results
of the survey and interviews will help in the continued assessment of Iowa’s evaluation
practices and policies. This data should help improve evaluations that will lead to
improved teaching practices, and student learning.
Again, your responses will be kept completely confidential in my final report.
Participation in this survey is voluntary. You may stop the interview at any time or
decline to answer any questions at any time. The conversation will be digitally recorded
for the purposes of accurately recording responses. No one will have access to the digital
recordings except me. You will be given an opportunity to review the transcripts of our
conversation prior to its inclusion in the study
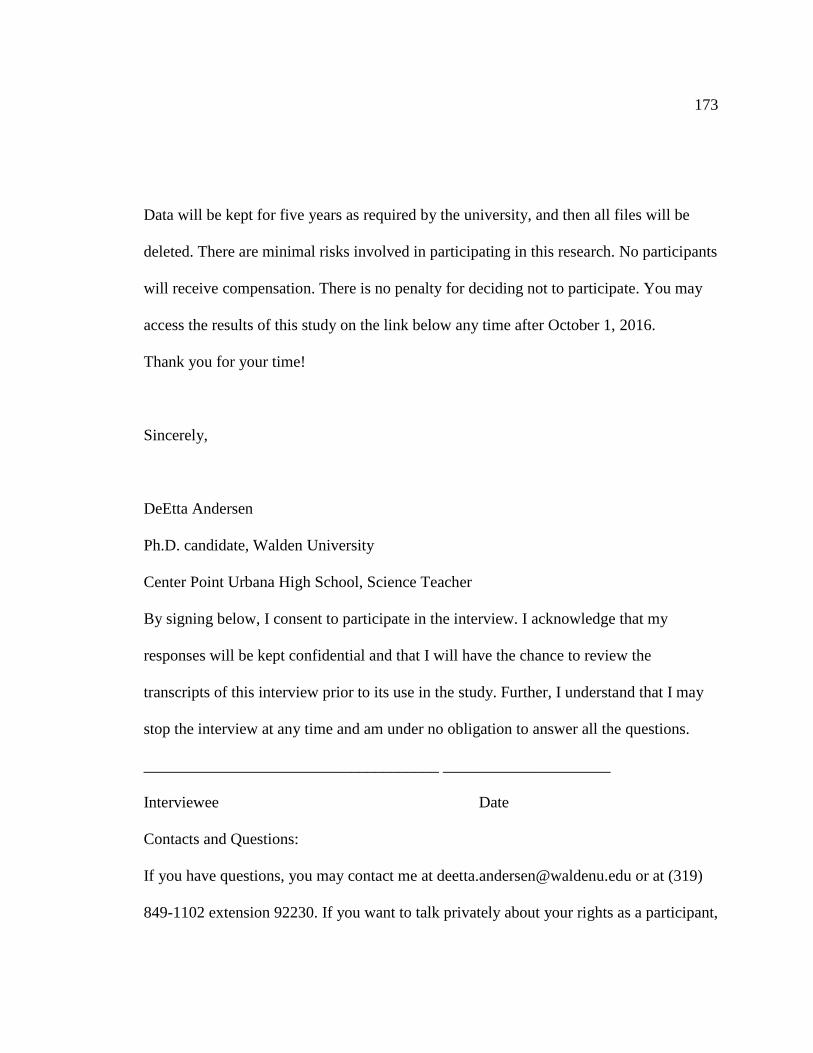
173
Data will be kept for five years as required by the university, and then all files will be
deleted. There are minimal risks involved in participating in this research. No participants
will receive compensation. There is no penalty for deciding not to participate. You may
access the results of this study on the link below any time after October 1, 2016.
Thank you for your time!
Sincerely,
DeEtta Andersen
Ph.D. candidate, Walden University
Center Point Urbana High School, Science Teacher
By signing below, I consent to participate in the interview. I acknowledge that my
responses will be kept confidential and that I will have the chance to review the
transcripts of this interview prior to its use in the study. Further, I understand that I may
stop the interview at any time and am under no obligation to answer all the questions.
_____________________________________ _____________________
Interviewee Date
Contacts and Questions:
If you have questions, you may contact me at [email protected] or at (319)
849-1102 extension 92230. If you want to talk privately about your rights as a participant,
174
you can call Dr. Leilani Endicott at Walden University. Her phone number is 1-612-312-
1210. Walden University’s approval number for this study is 12-29-15-0310539, and it
expires on 12/28/2016. Please save this consent form for your records.