evaporation flows in a bright kernel of a x1.6 … · evaporation flows in a bright kernel of a...
TRANSCRIPT
EVAPORATION FLOWS IN A BRIGHT KERNEL OF A X1.6 FLARE OBSERVED ON 2014 OCTOBER 22 BY IRIS, HINODE, AND RHESSI
Kyoung-Sun Lee1, Shinsuke Imada2, Kyoko Watanabe3, Yumi Bamba1,2
1Hinode team, ISAS/JAXA, 2 STELAB, Nagoya University, 3 Solar-C group, NAOJ
IRIS workshop 4
Solar flare – Models & observations 1. Introduction
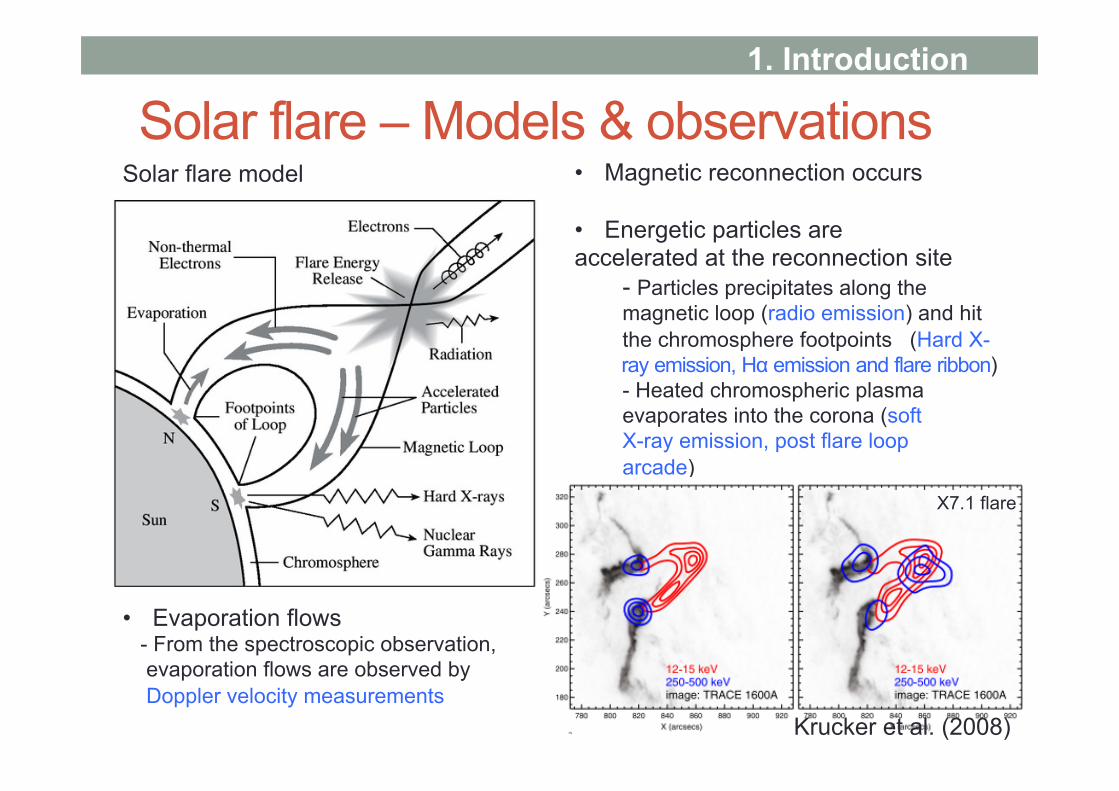
• Evaporation flows - From the spectroscopic observation, evaporation flows are observed by Doppler velocity measurements
• Magnetic reconnection occurs • Energetic particles are accelerated at the reconnection site
- Particles precipitates along the magnetic loop (radio emission) and hit the chromosphere footpoints (Hard X- ray emission, Hα emission and flare ribbon) - Heated chromospheric plasma evaporates into the corona (soft X-ray emission, post flare loop arcade)
Krucker et al. (2008)
X7.1 flare
Solar flare model
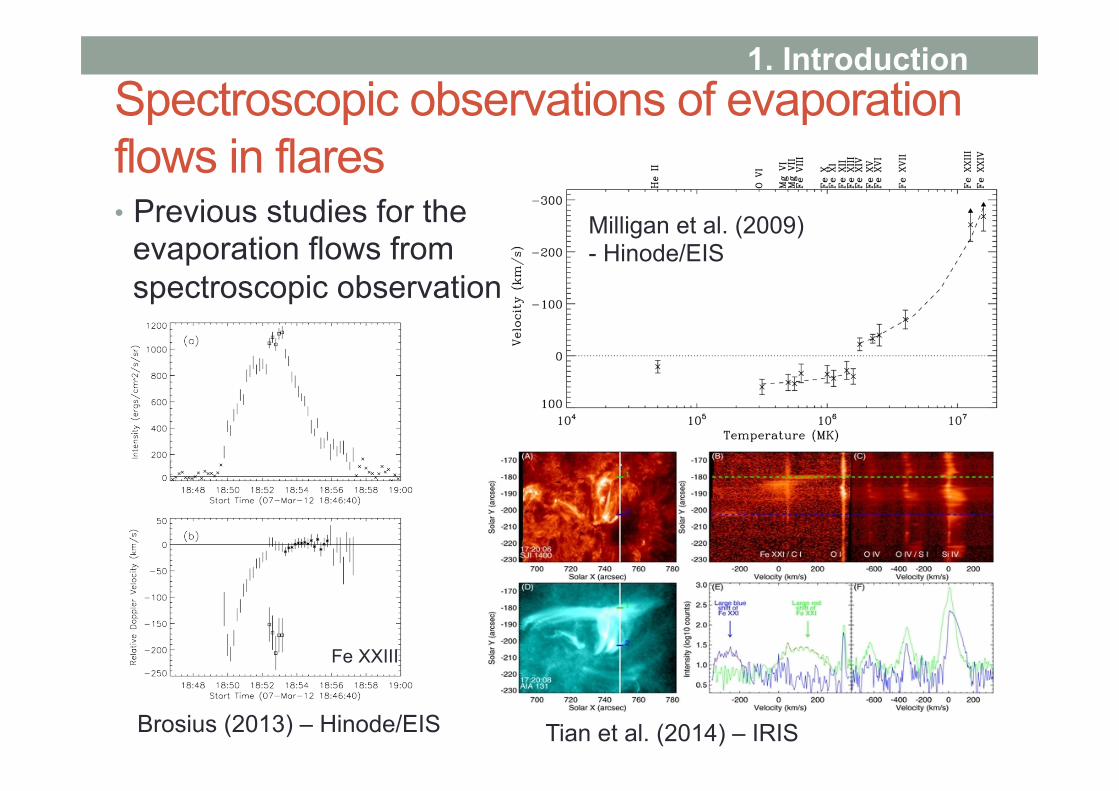
Spectroscopic observations of evaporation flows in flares • Previous studies for the
evaporation flows from spectroscopic observation
1. Introduction
Brosius (2013) – Hinode/EIS
Milligan et al. (2009) - Hinode/EIS
Tian et al. (2014) – IRIS
Fe XXIII

2. Observation X1.6 flare on 2014 October 22 (AR12192 ) - Simultaneous observation of IRIS, Hinode, SDO, and RHESSI HESSI Observing Summary Count Rates, Corrected
13:50 14:00 14:10 14:20 14:30 14:40Start Time (22-Oct-14 13:41:02)
10-1
100
101
102
103
104
105
Cor
rect
ed C
ount
Rat
e (s
-1 d
etec
tor-1
)
Det 1,3,93 - 6 keV6 - 12 keV12 - 25 keV25 - 50 keV50 - 100 keV100 - 300 keV300 - 800 keV800 - 7000 keV7000 - 20000 keV

Bright kernels in the flare 2. Observation
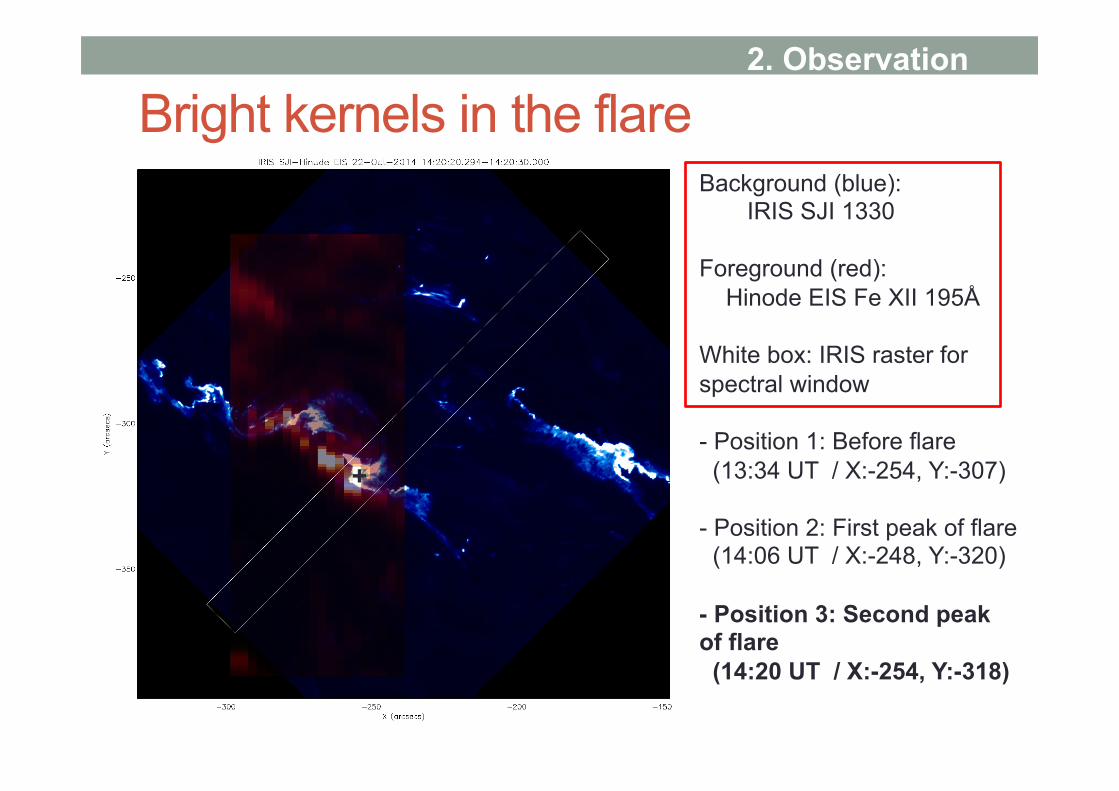
Background (blue): IRIS SJI 1330
Foreground (red): Hinode EIS Fe XII 195Å White box: IRIS raster for spectral window

Bright kernels in the flare 2. Observation
Background (blue): IRIS SJI 1330
Foreground (red): Hinode EIS Fe XII 195Å White box: IRIS raster for spectral window - Position 1: Before flare (13:34 UT / X:-254, Y:-307)
+

Bright kernels in the flare 2. Observation
Background (blue): IRIS SJI 1330
Foreground (red): Hinode EIS Fe XII 195Å White box: IRIS raster for spectral window - Position 1: Before flare (13:34 UT / X:-254, Y:-307) - Position 2: flare starts (14:06 UT / X:-248, Y:-320)
+
Bright kernels in the flare 2. Observation
Background (blue): IRIS SJI 1330
Foreground (red): Hinode EIS Fe XII 195Å White box: IRIS raster for spectral window - Position 1: Before flare (13:34 UT / X:-254, Y:-307) - Position 2: First peak of flare (14:06 UT / X:-248, Y:-320) - Position 3: Second peak of flare (14:20 UT / X:-254, Y:-318)
+

IRIS (single Gaussian) IRIS (double Gaussian) + EIS (single Gaussian) + EIS (double Gaussian)
Doppler velocity variation with formation temperatures – combination of IRIS and EIS
3. Results (1)
Blue shift
red shift
Explosive evaporation
Before flare (13:34 UT)
1st peak of the Flare (14:06 UT)
2nd peak of the Flare (14:24 UT)

a ~13:34 : brightening before the flare starts (cooler line shows blue shift) b ~14:06 : flare starts, impulsive phase (1st peak of the X-ray emission and white light flare occurring time) c ~14:30 : flare peak at the GOES X-ray curve (2nd peak of the X-ray emission and hotter emission intensity enhancement) d and e ~14:43, decay phase (sevral peaks of the intensity enhancement)
a b c d e
He II
O V
Fe X
Fe XII
Fe XIV
Fe XIV
Fe XV
Fe XVI
Fe XXIII
Fe XXIV
Temporal variation of the plasma properties – Intensity, Doppler velocity, and line width
3. Results (1)
• IRIS (O I, Si IV, Fe XXI) – Position 1 – EIS Intensity a b c d e

Temporal variation of the plasma properties – Intensity, Doppler velocity, and line width
• IRIS (O I, Si IV, Fe XXI) – Position 2 – EIS Intensity
3. Results (1)
He II
O V
Fe X
Fe XII
Fe XIV
Fe XIV
Fe XV
Fe XVI
Fe XXIII
Fe XXIV b c d e b c d e

Temporal variation of the plasma properties – Intensity, Doppler velocity, and line width
• IRIS (O I, Si IV, Fe XXI) – Position 3 – EIS Intensity
3. Results (1)
He II
O V
Fe X
Fe XII
Fe XIV
Fe XIV
Fe XV
Fe XVI
Fe XXIII
Fe XXIV b c d e b c d e

Temporal variation of the HXR and SXR emission from the RHESSI
3. Results (3)
HXR (30-100 keV)
SXR (12-25 keV)
Red contour: SXR, Blue contour: HXR HXR peak – cooler line intensity SXR peak – hotter line intensity

Spectroscopic view of the evaporated flows in the bright kernels in the flare
• Temporal evolution of the Doppler velocities at the bright kernel with different spectral lines • Before the flare – Blue shift at the bright kernel at the most spectral lines • During the impulsive phase (1st peak)
• Explosive evaporation flows (EIS + IRIS) - cooler emission: red shift (~100km/s) - hotter emission: blue shift (~ 300-400 km/s) • Intensity enhancement at the lower temperature (O I & Si IV)
- impact of non-thermal particle - O I emission doesn’t have significant Doppler velocity variation - Si IV shows red shifted emission
• Strong blue shift without intensity enhancement at the hotter emission (Fe XXI) • Decay phase (2nd peak)
• Intensity enhancement of the hotter emissions - evaporation flows and thermal emission
• Several peak of the Doppler velocity and intensity - multiple reconnection? • Continuous blue shift (hotter lines) and red shift (cooler lines)
4. Discussion (1)
Intensity variation of the bright kernel and a relation with HXR and SXR from RHESSI • Intensity variation with time and different spectral lines
• Cooler emission shows sharp intensity peak before the enhancement of the hotter emission - White light flare - O I intensity enhancement
• Intensity enhancement of the spectral lines a little delay with increasing temperature
• Temporal variation of the RHESSI HXR and SXR • The peak of HXR emission (30-100 keV) is observed at the start of the
flare - White light flare occurring time – Chromospheric line intensity enhancement -> non-thermal particle
• There are two peak of SXR emission (12-25 keV) are observed (1st: HXR peak, 2nd: ~18 min later)
- Around the timing of 2nd peak, we observed intensity enhancement of the hotter emission (coronal lines) -> thermal emission
4. Discussion (1)

• We observed X1.6 flare on 2014 October 22 using IRIS+HINODE+RHESSI.
• High temporal resolution and wide temperature coverage - IRIS (8 sparse slit scan) : 15 s for an each slit, 2 min for a scan raster - Temperature coverage form combined IRIS and EIS observation : log T ~ 4.5 – 7.2
• From the Doppler velocity measurements, we observed the explosive evaporation at the flare bright kernel.
• We investigated the temporal evolution of the intensity, Doppler velocity using the combined observation of the IRIS and EIS - Impulsive phase: strong blue shift at the hotter lines (weak intensity enhancement)
and red shift at cooler lines (intensity enhancement).
• HXR related with white light flare and chromospheric line intensity enhancement and SXR related with hotter spectral line intensity enhancement.
• We plan to measure the density variation with time and different region to understand the evaporation process with the intensity variation.
5. Summary

THANK YOU