evaporation variability of nam co lake in the tibetan ...snr.unl.edu/szilagyi/jh_lake_16.pdf ·...
TRANSCRIPT

Journal of Hydrology 537 (2016) 27–35
Contents lists available at ScienceDirect
Journal of Hydrology
journal homepage: www.elsevier .com/ locate / jhydrol
Evaporation variability of Nam Co Lake in the Tibetan Plateau and its rolein recent rapid lake expansion
http://dx.doi.org/10.1016/j.jhydrol.2016.03.0300022-1694/� 2016 Elsevier B.V. All rights reserved.
⇑ Corresponding authors at: Institute of Tibetan Plateau Research, ChineseAcademy of Sciences, Building 3, Courtyard 16, Lincui Road, Chaoyang District,Beijing 100101, China.
E-mail addresses: [email protected] (N. Ma), [email protected] (Y. Zhang).
Ning Ma a,b,c,⇑, Jozsef Szilagyi d,e, Guo-Yue Niu b, Yinsheng Zhang a,f,⇑, Teng Zhang a,c, Binbin Wang a,Yanhong Wug
aKey Laboratory of Tibetan Environment Changes and Land Surface Processes, Institute of Tibetan Plateau Research, Chinese Academy of Sciences, Beijing, ChinabDepartment of Hydrology and Water Resources, University of Arizona, Tucson, AZ, USAcUniversity of Chinese Academy of Sciences, Beijing, ChinadDepartment of Hydraulic and Water Resources Engineering, Budapest University of Technology and Economics, Budapest, Hungarye School of Natural Resources, University of Nebraska-Lincoln, Lincoln, NE, USAfCAS Center for Excellence in Tibetan Plateau Earth Sciences, Beijing, ChinagKey Laboratory of Digital Earth Science, Institute of Remote Sensing and Digital Earth, Chinese Academy of Sciences, Beijing, China
a r t i c l e i n f o
Article history:Received 3 January 2016Received in revised form 17 February 2016Accepted 15 March 2016Available online 22 March 2016This manuscript was handled by GeoffSyme, Editor-in-Chief
Keywords:Lake evaporationLake expansionCRLE modelWind speedNam Co LakeTibetan Plateau
s u m m a r y
Previous studies have shown that the majority of the lakes in the Tibetan Plateau (TP) started to expandrapidly since the late 1990s. However, the causes are still not well known. For Nam Co, being a closed lakewith no outflow, evaporation (EL) over the lake surface is the only way water may leave the lake.Therefore, quantifying EL is key for investigating the mechanism of lake expansion in the TP. EL can bequantified by Penman- and/or bulk-transfer-type models, requiring only net radiation, temperature,humidity and wind speed for inputs. However, interpolation of wind speed data may be laden with greatuncertainty due to extremely sparse ground meteorological observations, the highly heterogeneous land-scape and lake-land breeze effects. Here, evaporation of Nam Co Lake was investigated within the 1979–2012 period at a monthly time-scale using the complementary relationship lake evaporation (CRLE)model which does not require wind speed data. Validations by in-situ observations of E601B pan evapo-ration rates at the shore of Nam Co Lake as well as measured EL over an adjacent small lake using eddycovariance technique suggest that CRLE is capable of simulating EL well since it implicitly considers windeffects on evaporation via its vapor transfer coefficient. The multi-year average of annual evaporation ofNam Co Lake is 635 mm. From 1979 to 2012, annual evaporation of Nam Co Lake expressed a very slightdecreasing trend. However, a more significant decrease in EL occurred during 1998–2008 at a rate of�12 mm yr�1. Based on water-level readings, this significant decrease in lake evaporation was foundto be responsible for approximately 4% of the reported rapid water level increase and areal expansionof Nam Co Lake during the same period.
� 2016 Elsevier B.V. All rights reserved.
1. Introduction
With more than a thousand lakes having a total free-water areaof ca. 41,800 km2, the Tibetan Plateau (TP) boasts the greatest con-centration of high-altitude inland lakes in the world (Ma et al.,2011). These lakes form the headwaters of many large river basinsof Asia and present themselves as important indicators of waterresource availability during the ongoing climate change. Numerousstudies have shown that the lakes of the inner Tibetan Plateau (iTP)
(Fig. 1) have expanded substantially since the 1990s (Wu and Zhu,2008; Zhu et al., 2010; Meng et al., 2011; Y. Zhang et al., 2011; B.Zhang et al., 2011; G. Zhang et al., 2011; Lei et al., 2012, 2013;Song et al., 2014; Wan et al., 2014; Wu et al., 2014) in contrast tothe slight decline in lake volumes in the Himalayan region of South-ern TP (Lei et al., 2014; Song et al., 2014). During the same periodthe glaciers in the iTP have significantly retreated (Yao et al.,2012) and precipitation rates have increased to some extent(Yang et al., 2014; Gao et al., 2015). Song et al. (2014) and Leiet al. (2014) found that the spatial patterns of precipitation variabil-ity are consistent with the observed changes in lake area across theentire TP, suggesting that precipitation variations play a dominantrole in lake-area changes. However, basin-scale investigations overLinggo Co (Lei et al., 2012), Nam Co (Zhu et al., 2010) and Siling Co
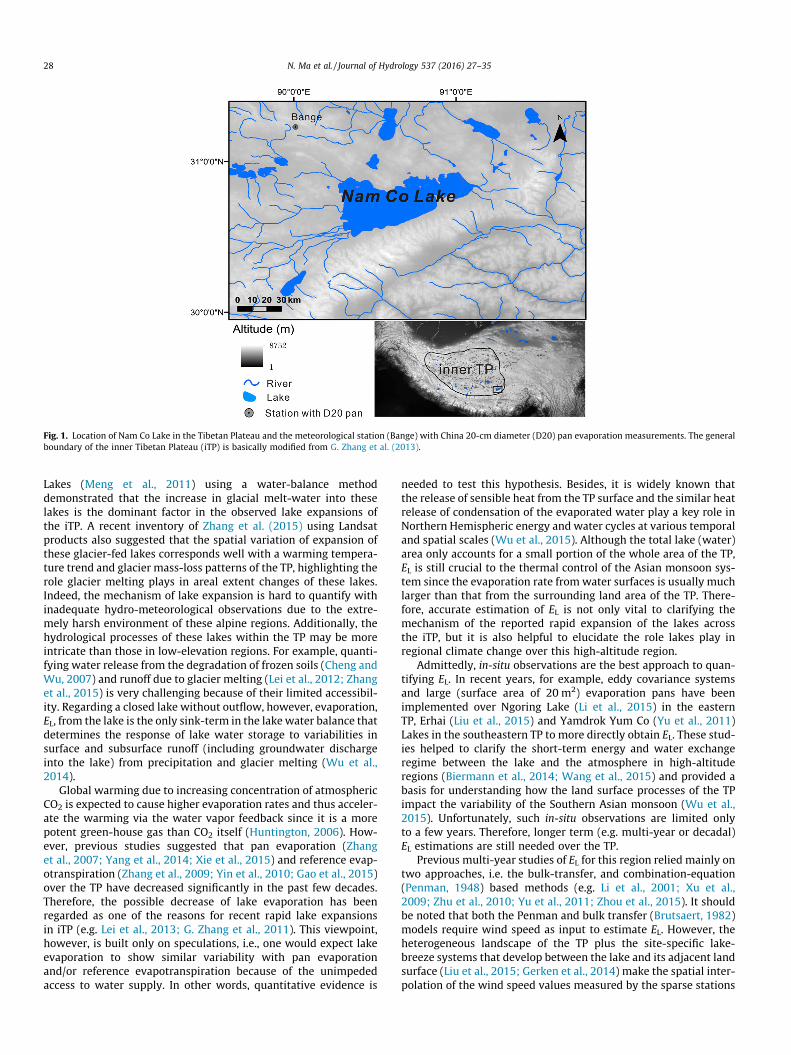
Fig. 1. Location of Nam Co Lake in the Tibetan Plateau and the meteorological station (Bange) with China 20-cm diameter (D20) pan evaporation measurements. The generalboundary of the inner Tibetan Plateau (iTP) is basically modified from G. Zhang et al. (2013).
28 N. Ma et al. / Journal of Hydrology 537 (2016) 27–35
Lakes (Meng et al., 2011) using a water-balance methoddemonstrated that the increase in glacial melt-water into theselakes is the dominant factor in the observed lake expansions ofthe iTP. A recent inventory of Zhang et al. (2015) using Landsatproducts also suggested that the spatial variation of expansion ofthese glacier-fed lakes corresponds well with a warming tempera-ture trend and glacier mass-loss patterns of the TP, highlighting therole glacier melting plays in areal extent changes of these lakes.Indeed, the mechanism of lake expansion is hard to quantify withinadequate hydro-meteorological observations due to the extre-mely harsh environment of these alpine regions. Additionally, thehydrological processes of these lakes within the TP may be moreintricate than those in low-elevation regions. For example, quanti-fying water release from the degradation of frozen soils (Cheng andWu, 2007) and runoff due to glacier melting (Lei et al., 2012; Zhanget al., 2015) is very challenging because of their limited accessibil-ity. Regarding a closed lake without outflow, however, evaporation,EL, from the lake is the only sink-term in the lake water balance thatdetermines the response of lake water storage to variabilities insurface and subsurface runoff (including groundwater dischargeinto the lake) from precipitation and glacier melting (Wu et al.,2014).
Global warming due to increasing concentration of atmosphericCO2 is expected to cause higher evaporation rates and thus acceler-ate the warming via the water vapor feedback since it is a morepotent green-house gas than CO2 itself (Huntington, 2006). How-ever, previous studies suggested that pan evaporation (Zhanget al., 2007; Yang et al., 2014; Xie et al., 2015) and reference evap-otranspiration (Zhang et al., 2009; Yin et al., 2010; Gao et al., 2015)over the TP have decreased significantly in the past few decades.Therefore, the possible decrease of lake evaporation has beenregarded as one of the reasons for recent rapid lake expansionsin iTP (e.g. Lei et al., 2013; G. Zhang et al., 2011). This viewpoint,however, is built only on speculations, i.e., one would expect lakeevaporation to show similar variability with pan evaporationand/or reference evapotranspiration because of the unimpededaccess to water supply. In other words, quantitative evidence is
needed to test this hypothesis. Besides, it is widely known thatthe release of sensible heat from the TP surface and the similar heatrelease of condensation of the evaporated water play a key role inNorthern Hemispheric energy and water cycles at various temporaland spatial scales (Wu et al., 2015). Although the total lake (water)area only accounts for a small portion of the whole area of the TP,EL is still crucial to the thermal control of the Asian monsoon sys-tem since the evaporation rate fromwater surfaces is usually muchlarger than that from the surrounding land area of the TP. There-fore, accurate estimation of EL is not only vital to clarifying themechanism of the reported rapid expansion of the lakes acrossthe iTP, but it is also helpful to elucidate the role lakes play inregional climate change over this high-altitude region.
Admittedly, in-situ observations are the best approach to quan-tifying EL. In recent years, for example, eddy covariance systemsand large (surface area of 20 m2) evaporation pans have beenimplemented over Ngoring Lake (Li et al., 2015) in the easternTP, Erhai (Liu et al., 2015) and Yamdrok Yum Co (Yu et al., 2011)Lakes in the southeastern TP to more directly obtain EL. These stud-ies helped to clarify the short-term energy and water exchangeregime between the lake and the atmosphere in high-altituderegions (Biermann et al., 2014; Wang et al., 2015) and provided abasis for understanding how the land surface processes of the TPimpact the variability of the Southern Asian monsoon (Wu et al.,2015). Unfortunately, such in-situ observations are limited onlyto a few years. Therefore, longer term (e.g. multi-year or decadal)EL estimations are still needed over the TP.
Previous multi-year studies of EL for this region relied mainly ontwo approaches, i.e. the bulk-transfer, and combination-equation(Penman, 1948) based methods (e.g. Li et al., 2001; Xu et al.,2009; Zhu et al., 2010; Yu et al., 2011; Zhou et al., 2015). It shouldbe noted that both the Penman and bulk transfer (Brutsaert, 1982)models require wind speed as input to estimate EL. However, theheterogeneous landscape of the TP plus the site-specific lake-breeze systems that develop between the lake and its adjacent landsurface (Liu et al., 2015; Gerken et al., 2014) make the spatial inter-polation of the wind speed values measured by the sparse stations

N. Ma et al. / Journal of Hydrology 537 (2016) 27–35 29
of the China Meteorological Administration (CMA) laden withhigher uncertainty when compared with other metrological vari-ables, e.g. air temperature and solar radiation. Consequently, lakeevaporation models not requiring wind speed data may be prefer-able. In addition, previous studies mainly used data from meteoro-logical stations at varying distances to the lakes to run the models.This may also lead to additional uncertainties if the estimationapproach requires measurements over the lake due to the differ-ences in surface and thermodynamic properties of the free watersurface and the surrounding land (Szilagyi, 2008). Therefore, appli-cation of gridded meteorological data from grid-points locatedright above the lakes is preferable.
With an elevation of 4724 m above sea level (asl) [2009 databased on Y. Zhang et al. (2011)], Nam Co Lake is the highest largelake in the world. Remote-sensing based studies indicated thatthe lake expanded substantially since the 1970s to date (e.g. Leiet al., 2013; Zhu et al., 2010; Y. Zhang et al., 2011). In addition toquantifying the contribution of glacier-melting and precipitationto such areal-extent change, a more accurate estimation of EL is stillneeded to an improved understanding of the mechanism of expan-sion. For example, Zhu et al. (2010) previously indicated that adecline of �30.7 mm in the multi-year averaged EL value betweenthe periods of 1992–2004 and 1971–1991 might contribute largelyto the expansion of Nam Co Lake. Additionally, evaluation of anexisting EL estimation model that does not require wind data maybe of interest to the scientific community for revealing long-termvariations and/or trends in lake evaporation rates in such ahydro-meteorologically important but sparsely populated regionas the TP. In the present study, the grid-based China MeteorologicalForcing Dataset (CFMD) (He and Yang, 2011) and the complemen-tary relationship lake evaporation (CRLE) model (Morton, 1983a,1983b, 1986) were employed to estimate EL over Nam Co Lake inthe TP. The objectives of the present study are: (1) assessing theperformance of the CRLE model in estimating lake evaporation ofhigh-elevation lakes; (2) quantifying the temporal variability of ELat Nam Co Lake and its role in the recent rapid expansion of lakesurface area since the late 1990s. The present research differs fromprevious lake evaporation studies of the TP (Li et al., 2001; Xu et al.,2009; Zhu et al., 2010; Yu et al., 2011; B. Zhang et al., 2011; Wuet al., 2014) by followings: (i) the gridded meteorological datalocated above the lake area was used as forcing to avoid the impactof the land environment; (ii) the CRLE model which does not needwind speed data as input was used to estimate EL, thereby expectedto avoid uncertainties in wind speed required by the Penman and/or bulk transfer models; (iii) the simulated EL rates were validatedby observed E601B pan coefficient values on an annual scale as wellas eddy-covariance-measured evaporation rates from an adjacentlake on a monthly scale.
2. Materials and methods
2.1. Regional setting
Located in the northern foot of the Nyenchen Tanglha Mountainof the TP, Nam Co is a closed, semi-brackish lake (Wang et al., 2009)(Fig. 1). The lake is about 75 km long from east to west and 45 kmwide from north to south. With an area of ca. 2013 km2 [2009 databased on Y. Zhang et al. (2011)], it is the second largest lake in Tibetlocated in the Nam Co Lake Basin between 89�210–91�230E and 29�560–31�700N with a total watershed area of about 10,610 km2
(B. Zhang et al., 2011). The main water supply to Nam Co Lake isprecipitation and glacier meltwater. There are approximately 60streams to flow into Nam Co Lake (Wang et al., 2009). The glaciermeltwater mainly originates from the modern glacier on theNyenchen Tanglha Mountain in the southeastern part of the basin.
With a semi-arid sub-frigid monsoon climate, the mean annualtemperature of the basin is about 0 �C, and the mean annual precip-itation is approximately 450 mm (Zhu et al., 2010).
2.2. Data
In this study the gridded China Meteorological Forcing Dataset(CFMD) which was developed by the Institute of Tibetan PlateauResearch, Chinese Academy of Sciences (He and Yang, 2011) wasemployed as lake-evaporation model input. CFMD contains near-surface air temperature, air pressure, wind speed, specific humid-ity, precipitation, downward shortwave as well as downward long-wave radiation. CFMD with a temporal resolution of 3 h covers the1979–2012 time-period at a spatial resolution of 0.1�. It was con-structed by merging direct measurements at 740 CMAmeteorolog-ical stations with (a) Global Land Data Assimilation System(GLDAS); (b) GEWEX Surface Radiation Budget (GEWEX-SRB),and; (c) Tropical Rainfall Measuring Mission (TRMM) precipitationdata (He and Yang, 2011). In a simulation of land surface temper-atures over the arid region of China, Chen et al. (2011) demon-strated that the use of CMFD as model input was able to improvethe Noah land surface model (Ek et al., 2003) results by reducingthe mean bias by 2 �C from validations against MODIS daytime sur-face temperature data. Recently, Zhou et al. (2015) comparedCFMD data with in-situ measurements of the CMA meteorologicalstations across the iTP. They suggested the following correctionsto reduce systematic errors in the CFMD values, i.e.
TaCFMD-cor ¼ TaCFMD þ 3 �C ð1Þ
qCFMD-cor ¼ 1:1 � qCFMD ð2Þ
SCFMD-cor ¼ 0:8654 � SCFMD ð3Þwhere Ta, q, and S are near-surface air temperature, specific humid-ity, and downward shortwave radiation, respectively. The subscriptCFMD and CFMD-cor denote the original and corrected CFMD data,respectively. In this study the grid points of CFMD located rightabove the lake area of Nam Co were extracted and the resultingTa, q, and S values corrected as shown above. While CRLE does notrequire wind speed records, such data of CFMD were also collectedto analyze the relationship between simulated EL and different mea-sured meteorological variables, including wind speed (while it maybear some uncertainties as mentioned above, we just used it forcomparisons).
For comparison of the trend in simulated EL with that in panevaporation, the daily China 20 cm diameter (D20) pan evapora-tion (Epan) and precipitation data during 1979–2012 from a CMAmeteorological station, Bange, in the vicinity of Nam Co Lake, wereemployed. The Bange station (Fig. 1) is located about 50 km to thenorthwest of Nam Co Lake. Partial model validation using a pancoefficient was based on daily E601B pan evaporation data oftwo other CMA stations, Maduo and Dali, during 2011–2012. Thesetwo stations situated in the relative vicinity of Ngoring Lake(4274 m asl) in the eastern TP and Erhai Lake (1978 m asl) in thesoutheastern TP, respectively (see Section 3.1).
2.3. Model description
There are numerous studies that investigated the performanceof different models of open water evaporation (e.g. Winter et al.,1995; Sadek et al., 1997; Rosenberry et al., 2007; Majidi et al.,2015). While the methods that rely solely on air temperatureand/or radiation data, e.g. those of Turc (1961), Hargreaves(1975) and Makkink (1957), can estimate wet surface evaporation,they primarily lack a rigorous physical basis and explicit consider-ation of subsurface heat storage, significant for deep lakes. The lat-

30 N. Ma et al. / Journal of Hydrology 537 (2016) 27–35
ter deficiency is also true for the widely employed physically-based Penman- and bulk-transfer-type methods, which have alsobeen proven to be sensitive to wind speed data (Rosenberryet al., 2007; Majidi et al., 2015), hindering their applicability inthe TP since the heterogeneous landscape and the sparse data col-lection network make it very difficult to obtain accurate windspeed data for a given lake.
The CRLE model was developed by Morton (1983a, 1983b,1986) when he revised the symmetric complementary relationship(CR) of evaporation by Bouchet (1963) for estimating monthly ELover lakes with time-varying water-column depth. The primaryadvantage of CRLE is that it does not need locally calibrated coeffi-cients nor wind speed data. In this way, it may be superior to thosemodels that rely on detailed observational data to calibrate theirparameter values. For example, while the bulk transfer-type mod-els do not need net radiation as input, their performance dependshighly on explicit parameterization of the transfer coefficientsusing accurate momentum and water vapor roughness lengths aswell as atmospheric stability data (Verburg and Antenucci, 2010;Wang et al., 2015), a great challenge in remote areas. In addition,CRLE explicitly takes into account month-to-month changes insubsurface heat storage by linearly routing the absorbed solar radi-ation via a hypothetical heat reservoir with delay times and stor-age constants related to the depth and salinity of the lake. Testedover 30 lakes in the United States, Andersen and Jobson (1982)demonstrated that EL derived from CRLE was overall consistentwith previous results of Kohler et al. (1955) who used the panevaporation method to estimate lake evaporation. Sadek et al.(1997) evaluated the performances of the Penman, bulk transferand CRLE models in simulating evaporation of the High AswanDam reservoir in Egypt and they found that the CRLE modelshowed the best agreement with the water budget method.
Prior to the application of the CR, originally developed for actualareal evapotranspiration estimation, one needs to determine theappropriate CR pattern (i.e. symmetric or asymmetric) (Szilagyi,2007; Ma et al., 2015a) based on the type of potential evaporationrates applied. Such a determination may rely on calibrating either aproportionality coefficient (Kahler and Brutsaert, 2006; Szilagyi,2015) or certain components (Ma et al., 2015a) within the CR the-ory. The avenue of Morton’s (1983a) method belongs to the latterapproach. Specifically, by introducing the concept of ‘‘equilibriumtemperature” (Tp) to calculate the potential evaporation (EP-CRLE)and the wet-environment (EW-CRLE) evaporation rates, Morton(1983a) proposed a symmetric CR model. Here, Tp (�C) refers tothe temperature at which Morton’s (1983a) energy budget andmass transfer methods produce the same potential evaporationrate from a small moist surface, i.e.
EP�CRLE ¼ 1kfQW � ½cf t þ 4erðTp þ 273:15Þ3�ðTp � TaÞg ð4Þ
EP�CRLE ¼ 1k½f tðep � eaÞ� ð5Þ
where k is the latent heat of vaporization (J kg�1), QW is the avail-able energy at the evaporating surface at air temperature(Wm�2), c the psychrometric constant (kPa �C�1), e the surfaceemissivity (taken as 0.97), r the Stefan–Boltzmann constant(5.67 � 10�8 Wm�2 K�4), ep (kPa) the saturation vapor pressure atTp, and ea (kPa) the measured actual vapor pressure at Ta. ft(Wm�2 kPa�1) is the vapor transfer coefficient, which is a functionof the dimensionless air stability factor, f, i.e.
f t ¼ ðps=pÞ0:5f z=f ð6Þwhere ps and p are atmospheric pressure at sea and lake surfacelevels, respectively. fz is an empirical constant (= 250Wm�2 kPa�1).For the inverse of f, Morton (1983a) derived
1=f ¼ 0:28ð1þ ep=eoÞ þ DQw=½cðps=pÞ0:5bof zðeo � epÞ� ð7Þwhere bo is another empirical constant (= 1.12), D (kPa �C�1) theslope of the saturation vapor pressure curve at Ta and eo (kPa) thesaturation vapor pressure at Ta. By equating (4) and (5), Tp can besolved through iterations (see Morton (1983a), pages 64–65).
The wet-environment evaporation under the equilibrium tem-perature is then calculated as
EW�CRLE ¼ 1k
b1 þ b2Dp
Dp þ cQWP
� �ð8Þ
where b1 and b2 are constants having default values of 13 Wm�2
and 1.12, respectively (Morton, 1983a). It should be noted that b1accounts for energy advection and is significant only during seasonsof very low net radiation. Ma et al. (2015b) argued that it should betaken as zero in the summer season to improve the performance ofMorton’s model in the TP, thus b1 = 0 in the present study. Dp (kPa�C�1) is the slope of the saturation vapor pressure curve at Tp andQWP (Wm�2) the available energy for an evaporating surface atTp. In particular, the ultimate goal of Morton’s (1983a) ‘‘equilibriumtemperature” is to build a symmetrical complementary model forestimating areal evaporation via the CR theory, and the EW-CRLE
based on this equilibrium temperature (Eq. (8)) is regarded as thewet-surface evaporation rate (Morton, 1986). The connection ofthe CRLE model to the CR is via employing the Tp value for the esti-mation of the wet-environment evaporation rate. The availableenergy, QWP, for evaporation over the lake surface in Eq. (8),includes the heat storage change (DSH) of the lake calculated by arouting method (Morton, 1986). Within this procedure, the netshortwave radiation received by the lake surface in the first monthof the simulation period is set as the initial value of DSH to itera-tively solve for consecutive DSH values (see Morton (1986), page376 for more details) for a year when the model is restarted twomore times with the last value of DSH. While the assumption thatheat storage in the first month equals the net shortwave radiationis arbitrary, the error quickly dissipates as the iteration convergesin a few steps, similar to an arbitrary initial storage condition of alinear storage element employed for flow routing (Morton, 1986;Szilagyi and Szollosi-Nagy, 2010).
The CRLE model was designed for a monthly time-step. Theforcing inputs are monthly mean air temperature, relative humid-ity (calculated via the specific humidity data) and sunshine dura-tion hours. In the original CRLE model the downward shortwaveradiation is estimated via the sunshine duration hours (McMahonet al., 2013). As CFMD contains the downward shortwave radiationdata, we modified the model to use it directly. However, estimationof the net longwave radiation in the CRLE still requires sunshinedurations and the actual water vapor pressure, therefore thescheme of Yin et al. (2013) was applied to calculate the sunshinedurations from the measured downward shortwave radiation dataof CFMD. In addition, the model also requires the mean lake depthand salinity as inputs. Based on Wang et al.’s (2009) extensive sur-vey in Nam Co Lake, the mean lake depth in 2008 was set at 55 m.Then a monthly time series of average lake depth for 1979–2012was constructed from relative water level changes between 1976and 2010 as documented by Lei et al. (2013). The salinity of NamCo Lake was set as a fixed value of 1.7 g L�1 according to Wanget al. (2009).
Sublimation from the lake ice may be considered negligible dueto very low temperatures in the winter. Lake evaporation rateswere estimated for the ice-free periods which were determinedwith the help of the daily minimum (Tmin) and maximum (Tmax)air temperature values. Specifically, the 3 h temporal resolutionof the CFMD’s air temperature values made it possible to considerTa at 06:00 and 15:00 to represent Tmin and Tmax, respectively.When Tmin > 0 �C occurred over the first consecutive three days

N. Ma et al. / Journal of Hydrology 537 (2016) 27–35 31
during the first half of the year, then the fourth day was consideredas the start of the ice-free period. Similarly, when Tmax < 0 �C tookplace over the first consecutive three days during the second half ofthe year, then the last day before this 3-day period was consideredas the end of the ice-free period. The so-determined ice-free peri-ods were overall consistent with the results of Zhang et al.(2014a). For months with partial ice-free periods, the ‘‘monthly”evaporation rates were downscaled by the length of the ice-freeperiod.
3. Results and discussions
3.1. Model validation
Zhou et al. (2013) conducted an in-situ E601B pan evaporationstudy at the shore of Nam Co Lake during 2007–2011. Their obser-vations were mainly carried out from mid-May to mid-October ineach year (see the Table 4 in Zhou et al. (2013) for specific dates).The E601B pan is made of fiberglass with a depth of 68.7 cm and adiameter of 61.8 cm (Ma et al., 2015a). Unlike the CMA D20 above-ground pan, the E601B pan was buried in the soil with its orifice30 cm above the ground surface. Therefore, the E601B pan belongsto the sunken-pan category according to the World MeteorologicalOrganization (WMO) classifications (Xiong et al., 2012). Wesummed the CRLE-derived EL estimates during the same periodof Zhou et al.’s (2013) observations. As seen in Fig. 2, the CRLE-simulated EL values display an interannual variation very similarto that of the E601B-measured Epan values but at a lower evapora-tion rate. The reason for the lower lake evaporation rates is two-fold. (i) While the E601B pan was buried in the soil to reduce thesolar radiation intercepted by its sidewall, the evaporating area isstill only 3000 cm2. Therefore, local energy advection around thepan enhanced its evaporation rate in comparison to that of the lakewith a surface area several magnitudes larger (Ma et al., 2015a). (ii)The heat storage of the pan water displays greater diurnal varia-tion, thereby affecting its evaporation rate, as was highlighted byRoderick et al. (2009).
There exists a rich literature investigating the ratio of lakeevaporation to pan evaporation (called pan coefficient) since the1950s. For instance, it is widely reported that the mean annualratio of EL in North America to the U.S. class-A pan evaporation rateis approximately 0.7 (Kohler et al., 1955; Lapworth, 1965). From
Fig. 2. Lake evaporation (EL) simulated by CRLE and pan evaporation (Epan)measured by Zhou et al. (2013) using an E601B sunken pan at the shore of NamCo Lake. Note that EL for each year in this figure was recalculated based on the dates(mainly from mid-May to mid-October) of Zhou et al. (2013) since their dates didnot cover the whole ice-free period.
in-situ observations over Neusiedl Lake with a surface area of320 km2 in Austria, Neuwirth (1973) indicated a pan coefficientvalue within the range of 0.70–0.75 from May to October, withan average of 0.72, while using a class-A pan. Also, Morton(1986) compared CRLE-simulated annual EL over 16 lakes in NorthAmerica and Africa with class-A pan evaporation rates and foundthe former 0.69 times that of the latter on average. The diameterand depth of the US class-A pan are 120.7 cm and 25.4 cm, respec-tively. It belongs to the above-ground pan category since it isplaced on a 3–5 cm high hollow wooden platform. This wayclass-A pans suffer a significant sidewall effect due to solar radia-tion (i.e. shortwave radiation is intercepted by the side of thepan) (Riley, 1966). The energy balance experiment of Lim et al.(2013) using the class-A pan also suggested that the extra radiationat the sidewall is an important factor that affects the pan coeffi-cient. Under the same environmental conditions, evaporation ratesfrom an above-ground pan are expected to be larger than thosefrom a sunken pan. Therefore, the pan coefficient of a class-A panshould be slightly lower than that of an E601B pan. Using eddycovariance instrumentation, Li et al. (2015) and Liu et al. (2015)carried out EL observations during the ice-free periods over Ngor-ing Lake in eastern TP (from 2011 to 2012) and Erhai Lake in south-eastern TP (only in 2012), respectively. For validation, wecalculated the ratio of their observed EL to the E601B pan evapora-tion at the corresponding nearest CMA station (i.e. Maduo stationfor Ngoring Lake and Dali for Erhai Lake) in the same period. Theresults show that the ratios are between 0.75 (2011) and 0.77(2012) for Ngoring Lake and 0.93 (2012) for Erhai Lake, respec-tively. In the present study, the ratio of Nam Co Lake evaporationto that of the E601B pan of Zhou et al. (2013) ranges from 0.76to 0.85 in Fig. 2 with an average of 0.83. Taking possible spatial dif-ferences in climate across the TP into consideration, the E601B pancoefficients obtained for Nam Co Lake indicate that the annual ELvalues of the CRLE of the present study are reasonable.
For validation at a monthly scale, we used data of Wang et al.(2015) who implemented eddy covariance instruments in the sum-mer of 2012 over a small lake (surface area of ca. 1 km2) locatedonly 1 km to the southeast of Nam Co Lake (see Fig. 1 in Wanget al. (2015) for specific location of this adjacent small lake). ForJuly and August of 2012, they obtained monthly evaporation ratesof 105.7 and 123.3 mm, respectively. During the same period, theCRLE-simulated EL rates over Nam Co Lake were 110.6 and122.0 mm, respectively, which are very close to Wang et al.(2015)’s observed values. This comparison suggests that the CRLEmodel is able to simulate EL accurately over Nam Co Lake on amonthly scale.
3.2. Model sensitivity analysis
To check CRLE’s sensitivity to its input variables (i.e. downwardshortwave radiation, air temperature and relative humidity), eachtime series was systematically disturbed by a constant ±10% whilekeeping the other two variables unchanged during model runs. Asseen in Table 1, the CRLE is most sensitive to downward shortwaveradiation, i.e. a 10% increase would lead to an about 14.6% increasein annual EL. This is followed by air temperature where a 10%
Table 1Relative change in the mean annual EL value due to ±10% changes in the input variablewhile leaving the other two inputs unchanged.
Input variable �10% change ofinput (%)
+10% change ofinput (%)
Downward shortwave radiation �14.1 14.6Air temperature �2.4 1.7Relative humidity 0.1 �1.1
32 N. Ma et al. / Journal of Hydrology 537 (2016) 27–35
decrease resulted in a 2.4% decrease in annual EL. CRLE is the leastsensitive to the relative humidity value since a 10% variation onlyresulted in �1% change of the simulated annual lake evaporation.Similar sensitivity analysis by Vallet-Coulomba et al. (2001) forthe Penman model suggested that a 10% change in solar radiation,air temperature and relative humidity would lead to 11.2%, 4.8%and 2.9% variation for the simulated evaporation rates over LakeZiway, Ethiopia, respectively, indicating an overall sensitivity lar-ger than that of CRLE.
Fig. 4. Standardized values of annual air temperature (Ta), precipitation (Prec),downward shortwave radiation (S), wind speed (U), vapor pressure deficit (VPD)over Nam Co Lake (1979–2012). The precipitation data is from Bange station.
3.3. Evaporation variability of Nam Co Lake
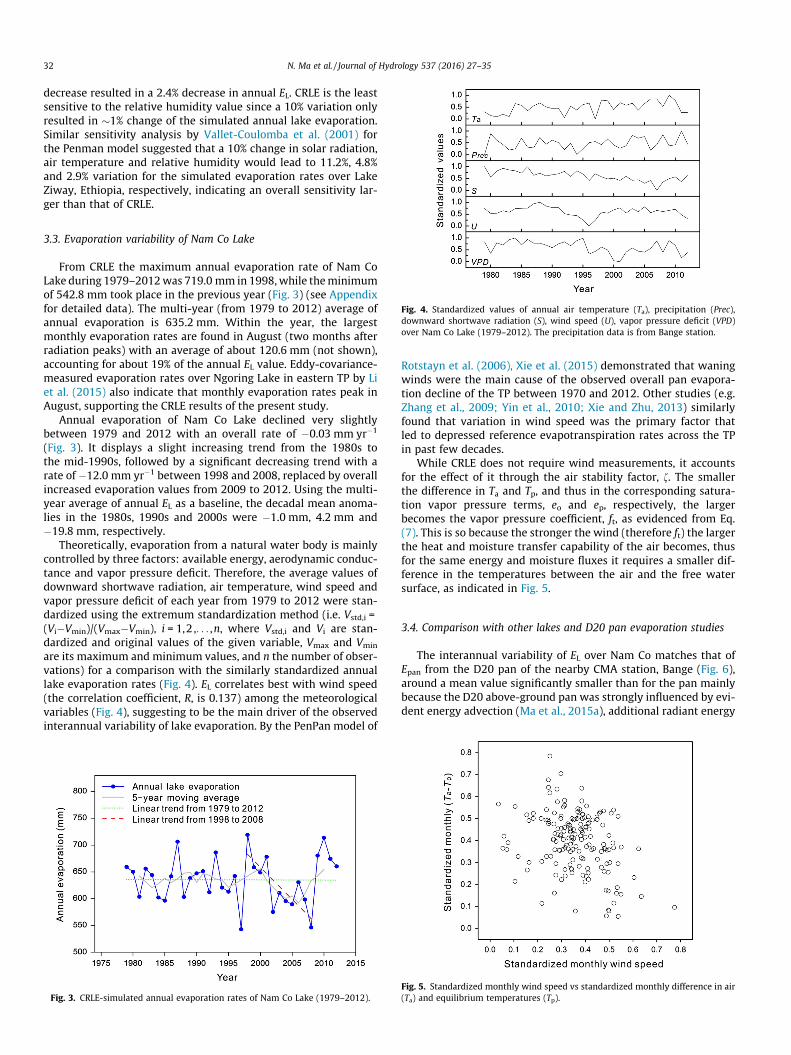
From CRLE the maximum annual evaporation rate of Nam CoLake during 1979–2012was 719.0 mm in 1998,while theminimumof 542.8 mm took place in the previous year (Fig. 3) (see Appendixfor detailed data). The multi-year (from 1979 to 2012) average ofannual evaporation is 635.2 mm. Within the year, the largestmonthly evaporation rates are found in August (two months afterradiation peaks) with an average of about 120.6 mm (not shown),accounting for about 19% of the annual EL value. Eddy-covariance-measured evaporation rates over Ngoring Lake in eastern TP by Liet al. (2015) also indicate that monthly evaporation rates peak inAugust, supporting the CRLE results of the present study.
Annual evaporation of Nam Co Lake declined very slightlybetween 1979 and 2012 with an overall rate of �0.03 mm yr�1
(Fig. 3). It displays a slight increasing trend from the 1980s tothe mid-1990s, followed by a significant decreasing trend with arate of �12.0 mm yr�1 between 1998 and 2008, replaced by overallincreased evaporation values from 2009 to 2012. Using the multi-year average of annual EL as a baseline, the decadal mean anoma-lies in the 1980s, 1990s and 2000s were �1.0 mm, 4.2 mm and�19.8 mm, respectively.
Theoretically, evaporation from a natural water body is mainlycontrolled by three factors: available energy, aerodynamic conduc-tance and vapor pressure deficit. Therefore, the average values ofdownward shortwave radiation, air temperature, wind speed andvapor pressure deficit of each year from 1979 to 2012 were stan-dardized using the extremum standardization method (i.e. Vstd,i =(Vi�Vmin)/(Vmax�Vmin), i = 1,2 ,. . . ,n, where Vstd,i and Vi are stan-dardized and original values of the given variable, Vmax and Vmin
are its maximum and minimum values, and n the number of obser-vations) for a comparison with the similarly standardized annuallake evaporation rates (Fig. 4). EL correlates best with wind speed(the correlation coefficient, R, is 0.137) among the meteorologicalvariables (Fig. 4), suggesting to be the main driver of the observedinterannual variability of lake evaporation. By the PenPan model of
Fig. 3. CRLE-simulated annual evaporation rates of Nam Co Lake (1979–2012).
Rotstayn et al. (2006), Xie et al. (2015) demonstrated that waningwinds were the main cause of the observed overall pan evapora-tion decline of the TP between 1970 and 2012. Other studies (e.g.Zhang et al., 2009; Yin et al., 2010; Xie and Zhu, 2013) similarlyfound that variation in wind speed was the primary factor thatled to depressed reference evapotranspiration rates across the TPin past few decades.
While CRLE does not require wind measurements, it accountsfor the effect of it through the air stability factor, f. The smallerthe difference in Ta and Tp, and thus in the corresponding satura-tion vapor pressure terms, eo and ep, respectively, the largerbecomes the vapor pressure coefficient, ft, as evidenced from Eq.(7). This is so because the stronger the wind (therefore ft) the largerthe heat and moisture transfer capability of the air becomes, thusfor the same energy and moisture fluxes it requires a smaller dif-ference in the temperatures between the air and the free watersurface, as indicated in Fig. 5.
3.4. Comparison with other lakes and D20 pan evaporation studies
The interannual variability of EL over Nam Co matches that ofEpan from the D20 pan of the nearby CMA station, Bange (Fig. 6),around a mean value significantly smaller than for the pan mainlybecause the D20 above-ground pan was strongly influenced by evi-dent energy advection (Ma et al., 2015a), additional radiant energy
Fig. 5. Standardized monthly wind speed vs standardized monthly difference in air(Ta) and equilibrium temperatures (Tp).

Fig. 6. Estimates of lake evaporation in the Tibetan Plateau. Yamdrok Yum Co Lakeis from Yu et al. (2011) by a bulk transfer model. Siling Co Lake is from Zhou et al.(2015) by the Penman model. Zigetang Co Lake is from Li et al. (2001) also by thePenman model. Nam Co Lake is from (a) Wu et al. (2014) by the Penman–Monteithmodel; (b) CRLE model of the present study. The Bange D20 data are from the ChinaD20 above-ground pan of CMA meteorological station and are the accumulation ofdaily values according to the dates of ice-periods of Nam Co Lake in every year.
Fig. 7. Annual change in (a) lake area, and; (b) water level of Nam Co Lake. Therelative water level data is from Lei et al. (2013).
N. Ma et al. / Journal of Hydrology 537 (2016) 27–35 33
intercepted by the pan’s sidewall (Lim et al., 2013; Xiong et al.,2012), and diurnal variation of heat storage in the pan water(Roderick et al., 2009). Note that in addition to its obvious ‘‘sidewalleffect”, the area of D20 pan is only 314.2 cm2, roughly 0.1 times ofthe area of E601B pan, the evaporation rate of the former is there-fore expected to be much larger than that of the latter, as was high-lighted by Xiong et al. (2012) and also shown in Figs. 2 and 6.
Despite not using wind speed as input, the CRLE-simulated ELvalues overall compare well with those of the modified Penman–Monteith model (Wu et al., 2014) (Fig. 6) with R = 0.439. The twomeans are 632.3 and 655.5 mm, respectively for the common1980–2010 period. It should be noted however that some differ-ence in the results of the two models did occur in some yearswhich may be caused by different model physics. Taking the ELestimates of Wu et al. (2014) during 2007–2010 as an example,its inter-annual variability in this period was obviously inconsis-tent with that of the E601B pan evaporation rates (see Fig. 2) atthe shore of Nam Co Lake measured by Zhou et al. (2013), indicat-ing some challenges for the Penman–Monteith model when esti-mating evaporation rates of Nam Co Lake.
Regarding a spatial comparison, it can be seen that annual ELvalues over different lakes display obvious differences due mainlyto differences in elevation. That is, elevation of Yamdrok Yum Co,Siling Co, Zigetang Co, and Nam Co Lakes are 4441, 4535, 4575,and 4724 m asl, respectively. Mean annual evaporation from theselakes decrease with increasing elevation (Fig. 6). Temporal variabil-ity of EL for Zigetang Co Lake (Li et al., 2001) is similar to that ofNam Co Lake, displaying an overall increasing trend during the1980s–1990s period. These two lakes also behaved consistentlywith the overall increasing evaporation trend of the D20 pan fromadjacent CMA station, Bange, during the same period (Fig. 6).Although the EL values of Siling Co Lake (Zhou et al., 2015) wereonly available from 2003 to 2012, it also showed similar trendswith the CRLE-simulated values of Nam Co Lake. With regard toYamdrok Yum Co Lake (Yu et al., 2011), evaporation increasedslightly from the late 1970s to late 1980s, but decreased graduallyafterwards. Note that Yamdrok Yum Co Lake is located in thesoutheastern TP, while the other three lakes are situated in theinner TP. Hence the differences in EL trends may be attributableto differences in the manifestation of local climate variability,among other possible factors.
3.5. The role of interannual EL variability in recent rapid expansion ofNam Co Lake
To investigate what possible role the modeled EL variation playsin the expansion of Nam Co Lake, a synthesis of available studies(Chen et al., 2009; Kropácek et al., 2012; Lin et al., 2012; Maet al., 2012; Shao et al., 2007; Wan et al., 2014; Wu and Zhu,2008; Y. Zhang et al., 2011; B. Zhang et al., 2011, 2013; Zhanget al., 2014b; Zhu et al., 2010) on recent lake-area change is pre-sented in Fig. 7a. Despite differences in remote sensing data sourceand image processing applied by different studies, all researchreported a rapid expansion of Nam Co Lake from the late 1990sto late 2000s (Fig. 7a). However, the contributing factors are stilldebated. Zhu et al. (2010) stated that glacier meltwater con-tributed the most to the water storage increase of the lake,whereas Ma et al. (2012) maintained that an increase in precipita-tion is the main reason for the expansion. While an exact determi-nation of the water balance of Nam Co Lake is beyond the scope ofthe present study, the significant decrease in the annual EL valuesof Nam Co Lake (see Fig. 3) during this period may indeed be one ofthe factors contributing to this rapid expansion.
Nam Co Lake is a closed lake with no outlet (Fig. 1). As the areaof Nam Co Lake is about 2000 km2, the incremental increase ofabout 60 km2 (Fig. 7a) in lake area from the late 1990s to the late2000s only accounts for ca. 3% of the total area. Therefore, for agiven relatively short time interval, t (e.g. 1998–2008 as shownbelow), the change of water level (H) can be assumed as (Wuet al., 2014)

34 N. Ma et al. / Journal of Hydrology 537 (2016) 27–35
dHdt
¼ dPdt
þ dRg
dtþ dRs
dtþ dG
dt� dEL
dtþ e ð9Þ
where P is precipitation over the lake surface, Rg glacier/snow melt-water runoff, Rs non-glacial/snow runoff, G net groundwaterrecharge to the lake, and e a possible random error term.
From current bathymetric investigations and information of his-torical shoreline positions, Lei et al. (2013) reconstructed the rela-tive water level variation in Nam Co Lake from 1979 to 2010(Fig. 7b). Similar to the changes of lake area in Fig. 7a, thewater levelalso increased rapidly and significantly with a rate of 0.281 m yr�1
during the period of 1998–2008. In the same period, annual EL ofNam Co Lake decreasedwith a rate of�12 mm yr�1 (Fig. 3), indicat-ing that about 4% of the rapid expansion of Nam Co Lake may beattributed to the decrease of EL during the same period.
4. Conclusions
In this paper the CRLE model was run with gridded meteorolog-ical data input to simulate the free water evaporation of Nam CoLake during ice-free periods. Results indicate that lake evaporationin a highly heterogeneous landscape can be estimated by the modelwithout requiring wind data. This is because CRLE implicitly con-siders the effect of wind on evaporation through the calculationof a vapor transfer coefficient. This property of CRLE reported hereis of significance in a harsh environment (i.e. Tibetan Plateau)where ground meteorological observations are sparse and largeuncertainties in spatial interpolation of the wind speed data exist.
The 34-year average of free water evaporation of Nam Co Lake is635 mm yr�1. Annual evaporation rates overall decreased slightlyduring the 1979–2012 period, while interannual variability ismainly attributed to similar variability in wind speed. A significantdecrease in annual lake evaporation was witnessed for the 1998–2008 period with a rate of �12 mm yr�1 which is thought to beresponsible for about 4% of the recent rapid expansion of Nam CoLake.
Acknowledgements
The CFMD data is developed by Data Assimilation and ModelingCenter for Tibetan Multi-spheres, Institute of Tibetan PlateauResearch, Chinese Academy of Sciences and can be accessed fromCold and Arid Regions Science Data Center at Lanzhou (http://westdc.westgis.ac.cn). The D20 pan evaporation and precipitationdata of Bange station as well as E601B pan evaporation data ofMaduo and Dali stations are provided by China MeteorologicalAdministration. We thank Dr. Murray Peel for sharing the originalcode of CRLE model. We also thank the three anonymous reviewersfor their helpful comments that lead to a much improved manu-script. This research was funded by the National Natural ScienceFoundation of China (41190082) and the Strategic PriorityResearch Program (B) of CAS (XDB03030206). The financial supportfrom National Natural Science Foundation of China (41430748) isalso acknowledged. Ning Ma thanks the funding support fromChina Scholarship Council (201504910657).
Appendix A. Supplementary material
Supplementary data associated with this article can be found, inthe online version, at http://dx.doi.org/10.1016/j.jhydrol.2016.03.030.
References
Andersen, M.E., Jobson, H.E., 1982. Comparison of techniques for estimating annuallake evaporation using climatological data. Water Resour. Res. 18 (3), 630–636.
Biermann, T., Babel, W., Ma, W., Chen, X., Thiem, E., Ma, Y., Foken, T., 2014. Turbulentflux observations and modelling over a shallow lake and a wet grassland in theNam Co basin, Tibetan Plateau. Theor. Appl. Climatol. 116, 301–316.
Bouchet, R.J., 1963. Evapotranspiration réelle et potentielle, signification climatique.Int. Assoc. Sci. Hydrol. Publ. 62, 134–142.
Brutsaert, W., 1982. Evaporation into the Atmosphere: Theory, History andApplications. Springer, New York, p. 299.
Chen, F., Kang, S., Zhang, Y., You, Q., 2009. Glaciers and lake change in response toclimate change in the Nam Co basin. Tibet. J. Mount. Sci. 27, 641–647 (InChinese with English Abstract).
Chen, Y., Yang, K., He, J., Qin, J., Shi, J., Du, J., He, Q., 2011. Improving land surfacetemperature modeling for dry land of China. J. Geophys. Res. Atmos. 116 (D20).http://dx.doi.org/10.1029/2011JD015921.
Cheng, G., Wu, T., 2007. Responses of permafrost to climate change and theirenvironmental significance, Qinghai-Tibet Plateau. J. Geophys. Res. 112 (F2).http://dx.doi.org/10.1029/2006jf000631.
Ek, M.B., Mitchell, K.E., Lin, Y., Rogers, E., Grunmann, P., Koren, V., Gayno, G., Tarpley,J.D., 2003. Implementation of Noah land surface model advances in the NationalCenters for Environmental Prediction operational mesoscale Eta model. J.Geophys. Res. 108 (D22). http://dx.doi.org/10.1029/2002jd003296.
Gao, Y., Li, X., Ruby Leung, L., Chen, D., Xu, J., 2015. Aridity changes in the TibetanPlateau in a warming climate. Environ. Res. Lett. 10 (3), 034013. http://dx.doi.org/10.1088/1748-9326/10/3/034013.
Gerken, T., Biermann, T., Babel, W., Herzog, M., Ma, Y., Foken, T., Graf, H.-F., 2014. Amodelling investigation into lake-breeze development and convectiontriggering in the Nam Co Lake basin, Tibetan Plateau. Theor. Appl. Climatol.117 (1–2), 149–167.
Hargreaves, G.H., 1975. Moisture availability and crop production. Trans. ASAE 18,980–984.
He, J., Yang, K., 2011. China Meteorological Forcing Dataset. Cold and Arid RegionsScience Data Center, Lanzhou, China. http://dx.doi.org/10.3972/westdc.002.2014.db.
Huntington, T.G., 2006. Evidence for intensification of the global water cycle:review and synthesis. J. Hydrol. 319 (1–4), 83–95.
Kahler, D.M., Brutsaert, W., 2006. Complementary relationship between dailyevaporation in the environment and pan evaporation. Water Resour. Res. 42,W05413. http://dx.doi.org/10.1029/2005WR004541.
Kohler, M., Nordenson, T., Fox, W., 1955. Evaporation from Pans and Lakes: USWeather Bureau Research Paper 38. US Weather Bureau, Washington, DC.
Kropácek, J., Braun, A., Kang, S., Feng, C., Ye, Q., Hochschild, V., 2012. Analysis of lakelevel changes in Nam Co in central Tibet utilizing synergistic satellite altimetryand optical imagery. Int. J. Appl. Earth Obs. Geoinf. 17, 3–11.
Lapworth, C.F., 1965. Evaporation from a reservoir near London. J. Inst. WaterEnviron. Manage. 19, 163–181.
Lei, Y., Yang, K., Wang, B., Sheng, Y., Bird, B.W., Zhang, G., Tian, L., 2014. Response ofinland lake dynamics over the Tibetan Plateau to climate change. ClimateChange 125 (2), 281–290.
Lei, Y., Yao, T., Bird, B.W., Yang, K., Zhai, J., Sheng, Y., 2013. Coherent lake growth onthe central Tibetan Plateau since the 1970s: characterization and attribution. J.Hydrol. 483, 61–67.
Lei, Y., Yao, T., Yi, C., Wang, W., Sheng, Y., Li, J., Joswiak, D., 2012. Glacier mass lossinduced the rapid growth of Linggo Co on the central Tibetan Plateau. J. Glaciol.58 (207), 177–184.
Li, W., Li, S., Pu, P., 2001. Estimates of plateau lake evaporation: a case study of ZigeTang Co. J. Lake Sci. 13, 227–232 (In Chinese with English Abstract).
Li, Z., Lyu, S., Ao, Y., Wen, L., Zhao, L., Wang, S., 2015. Long-term energy flux andradiation balance observations over Lake Ngoring, Tibetan Plateau. Atmos. Res.155, 13–25.
Lim, W.H., Roderick, M.L., Hobbins, M.T., Wong, S.C., Farquhar, G.D., 2013. Theenergy balance of a US Class A evaporation pan. Agric. Forest Meteorol. 182–183, 314–331.
Lin, N., Shen, W., Zhang, H., Li, H., 2012. Correlation degree analysis ofmeteorological elements and dynamic remote sensing of alpine lakes in Naquregion of Tibet in the past 35 years. J. Ecol. Rural Environ. 28, 231–237 (InChinese with English Abstract).
Liu, H., Feng, J., Sun, J., Wang, L., Xu, A., 2015. Eddy covariance measurements ofwater vapor and CO2 fluxes above the Erhai Lake. Sci. China Earth Sci. 58 (3),317–328.
Ma, N., Zhang, Y., Szilagyi, J., Guo, Y., Zhai, J., Gao, H., 2015a. Evaluating thecomplementary relationship of evapotranspiration in the alpine steppe of theTibetan Plateau. Water Resour. Res. 51 (2), 1069–1083.
Ma, N., Zhang, Y., Xu, C.-Y., Szilagyi, J., 2015b. Modeling actual evapotranspirationwith routine meteorological variables in the data-scarce region of the TibetanPlateau: comparisons and implications. J. Geophys. Res. Biogeosci. 120 (8),1638–1657.
Ma, R., Yang, G., Duan, H., Jiang, J., Wang, S., Feng, X., Li, A., Kong, F., Xue, B., Wu, J., Li,S., 2011. China’s lakes at present: number, area and spatial distribution. Sci.China Earth Sci. 54 (2), 283–289.
Ma, Y., Yi, C., Wu, J., 2012. Lake surface expansion of Nam Co during 1970–2009:evidence of satellite remote sensing and cause analysis. J. Glaciol. Geocryol. 34,81–88 (In Chinese with English Abstract).
Majidi, M., Alizadeh, A., Farid, A., Vazifedoust, M., 2015. Estimating evaporationfrom lakes and reservoirs under limited data condition in a semi-arid region.Water Resour. Manage. 29 (10), 3711–3733.
Makkink, G.F., 1957. Testing the Penman formula by means of lysimeters. J. Inst.Water Eng. 11, 277–288.
N. Ma et al. / Journal of Hydrology 537 (2016) 27–35 35
McMahon, T., Peel, M., Lowe, L., Srikanthan, R., McVicar, T., 2013. Estimating actual,potential, reference crop and pan evaporation using standard meteorologicaldata: a pragmatic synthesis. Hydrol. Earth Syst. Sci. 17, 1331–1363.
Meng, K., Shi, X., Wang, E., Liu, F., 2011. High-altitude salt lake elevation changesand glacial ablation in Central Tibet, 2000–2010. Chin. Sci. Bull. 57 (5), 525–534.
Morton, F.I., 1983a. Operational estimates of areal evapotranspiration and theirsignificance to the science and practice of hydrology. J. Hydrol. 66 (1–4), 1–76.
Morton, F.I., 1983b. Operational estimates of lake evaporation. J. Hydrol. 66, 77–100.Morton, F.I., 1986. Practical estimates of lake evaporation. J. Clim. Appl. Meteorol. 25
(3), 371–387.Neuwirth, F., 1973. Experiences with evaporation pans at a shallow steppe-lake in
Austria. In: Proceedings of the International Symposium on the Hydrology ofLakes, Helsinki, 23–27 July 1973. Int. Assoc. Sci. Hydrol. Publ..
Penman, H.L., 1948. Natural evaporation from open water, bare soil and grass. Proc.R. Soc. Lond. Ser. A 193, 120–145.
Riley, J.J., 1966. The heat balance of class A evaporation pan. Water Resour. Res. 2(2), 223–226.
Roderick, M.L., Hobbins, M.T., Farquhar, G.D., 2009. Pan evaporation trends and theterrestrial water balance. I. Principles and observations. Geogr. Compass 3 (2),746–760.
Rosenberry, D.O., Winter, T.C., Buso, D.C., Likens, G.E., 2007. Comparison of 15evaporation methods applied to a small mountain lake in the northeastern USA.J. Hydrol. 340 (3–4), 149–166.
Rotstayn, L.D., Roderick, M.L., Farquhar, G.D., 2006. A simple pan-evaporation modelfor analysis of climate simulations: evaluation over Australia. Geophys. Res.Lett. 33 (17). http://dx.doi.org/10.1029/2006gl027114.
Sadek, M.F., Shahin, M.M., Stigter, C.J., 1997. Evaporation from the reservoir of theHigh Aswan Dam, Egypt: a new comparison of relevant methods with limiteddata. Theor. Appl. Climatol. 56 (1), 57–66.
Shao, Z., Zhu, D., Meng, X., Zheng, D., 2007. Characteristics of the change of majorlakes on the Qinghai-Tibet Plateau in the last 25 years. Geol. Bull. China 26,1633–1645 (In Chinese with English Abstract).
Song, C., Huang, B., Richards, K., Ke, L., Phan, V.H., 2014. Accelerated lake expansionon the Tibetan Plateau in the 2000s: induced by glacial melting or otherprocesses? Water Resour. Res. 50, 3170–3186.
Szilagyi, J., 2007. On the inherent asymmetric nature of the complementaryrelationship of evaporation. Geophys. Res. Lett. 34 (2). http://dx.doi.org/10.1029/2006GL028708.
Szilagyi, J., 2008. Comment on ‘‘Comparison of 15 evaporation models applied to asmall mountain lake in the northeastern USA” by D.O. Rosenberry, T.C. Winter,D.C. Buso, and G.E. Likens [J. Hydrol. 340(3–4) (2007) 149–166]. J. Hydrol. 348(3–4), 564–565.
Szilagyi, J., 2015. Complementary-relationship-based 30-year normals (1981–2010)of monthly latent heat fluxes across the contiguous United States. WaterResour. Res. 51, 9367–9377.
Szilagyi, J., Szollosi-Nagy, A., 2010. Recursive Streamflow Forecasting: A State-SpaceApproach. CRC Press, Taylor & Francis, pp. 212, ISBN 978-0-415-56901-9.
Turc, L., 1961. Estimation of irrigation water requirements, potentialevapotranspiration: a simple climatic formula evolved up to date. Ann Agron.12, 13–49.
Vallet-Coulomba, C., Legessea, D., Gassea, F., Travic, Y., Chernet, T., 2001. Lakeevaporation estimates in tropical Africa (Lake Ziway, Ethiopia). J. Hydrol. 245(1–4), 1–18.
Verburg, P., Antenucci, J.P., 2010. Persistent unstable atmospheric boundary layerenhances sensible and latent heat loss in a tropical great lake: Lake Tanganyika.J. Geophys. Res. 115 (D11). http://dx.doi.org/10.1029/2009jd012839.
Wan, W., Xiao, P., Feng, X., Li, H., Ma, R., Duan, H., Zhao, L., 2014. Monitoring lakechanges of Qinghai-Tibetan Plateau over the past 30 years using satelliteremote sensing data. Chin. Sci. Bull. 59 (10), 1021–1035.
Wang, B., Ma, Y., Chen, X., Ma, W., Su, Z., Menenti, M., 2015. Observation andsimulation of lake-air heat and water transfer processes in a high-altitudeshallow lake on the Tibetan Plateau. J. Geophys. Res. Atmos. 120 (24), 12327–12344.
Wang, J., Zhu, L., Daut, G., Ju, J., Lin, X., Wang, Y., Zhen, X., 2009. Investigation ofbathymetry and water quality of Lake Nam Co, the largest lake on the centralTibetan Plateau, China. Limnol. 10 (2), 149–158.
Winter, T.C., Rosenberry, D.O., Sturrock, A.M., 1995. Evaluation of 11 equations fordetermining evaporation for a Small Lake in the North Central United States.Water Resour. Res. 31 (4), 983–993.
Wu, G., Duan, A., Liu, Y., Mao, J., Ren, R., Bao, Q., He, B., Liu, B., Hu, W., 2015. TibetanPlateau climate dynamics: recent research progress and outlook. Nat. Sci. Rev. 2,100–116.
Wu, Y., Zheng, H., Zhang, B., Chen, D., Lei, L., 2014. Long-term changes of lake leveland water budget in the Nam Co lake basin, central Tibetan Plateau. J.Hydrometeorol. 15 (3), 1312–1322.
Wu, Y., Zhu, L., 2008. The response of lake-glacier variations to climate change inNam Co Catchment, central Tibetan Plateau, during 1970–2000. J. Geogr. Sci. 18(2), 177–189.
Xie, H., Zhu, X., 2013. Reference evapotranspiration trends and their sensitivity toclimatic change on the Tibetan Plateau (1970–2009). Hydrol. Process. 27 (25),3685–3693.
Xie, H., Zhu, X., Yuan, D.-Y., 2015. Pan evaporation modelling and changingattribution analysis on the Tibetan Plateau (1970–2012). Hydrol. Process. 29 (9),2164–2177.
Xiong, A., Liao, J., Xu, B., 2012. Reconstruction of a daily large-pan evaporationdataset over China. J. Appl. Meteorol. Climatol. 51 (7), 1265–1275.
Xu, J., Yu, S., Liu, J., Haginoya, S., Ishigooka, Y., Kuwagata, T., Hara, M., Yasunari, T.,2009. The implication of heat and water balance changes in a lake basin on theTibetan Plateau. Hydrol. Res. Lett. 3, 1–5.
Yang, K., Wu, H., Qin, J., Lin, C., Tang, W., Chen, Y., 2014. Recent climate changes overthe Tibetan Plateau and their impacts on energy and water cycle: a review.Glob. Planet. Change 112, 79–91.
Yao, T., Thompson, L.G., Yang, W., Yu, W., Gao, Y., Guo, X., Yang, X., Duan, K., Zhao, H.,Xu, B., Pu, J., Lu, A., Xiang, Y., Kattel, D.B., Joswiak, D., 2012. Different glacierstatus with atmospheric circulations in Tibetan Plateau and surroundings. Nat.Clim. Change 2, 663–667.
Yin, Y., Wu, S., Dai, E., 2010. Determining factors in potential evapotranspirationchanges over China in the period 1971–2008. Chin. Sci. Bull. 55 (29), 3329–3337.
Yin, Y., Wu, S., Zhao, D., Zheng, D., Pan, T., 2013. Modeled effects of climate changeon actual evapotranspiration in different eco-geographical regions in theTibetan Plateau. J. Geogr. Sci. 23 (2), 195–207.
Yu, S., Liu, J., Xu, J., Wang, H., 2011. Evaporation and energy balance estimatesover a large inland lake in the Tibet-Himalaya. Environ. Earth Sci. 64 (4),1169–1176.
Zhang, Y., Yao, T., Ma, Y., 2011. Climatic changes have led to significant expansion ofendorheic lakes in Xizang (Tibet) since 1995. Sci. Cold Arid Reg. 3 (6), 463–467.
Zhang, B., Wu, Y., Zhu, L., Wang, J., Li, J., Chen, D., 2011. Estimation and trenddetection of water storage at Nam Co Lake, central Tibetan Plateau. J. Hydrol.405 (1–2), 161–170.
Zhang, G., Xie, H., Kang, S., Yi, D., Ackley, S.F., 2011. Monitoring lake level changes onthe Tibetan Plateau using ICESat altimetry data (2003–2009). Remote Sens.Environ. 115 (7), 1733–1742.
Zhang, B., Wu, Y., Lei, L., Li, J., Liu, L., Chen, D., Wang, J., 2013. Monitoringchanges of snow cover, lake and vegetation phenology in Nam Co Lake Basin(Tibetan Plateau) using remote sensing (2000–2009). J. Great Lakes Res. 39,224–233.
Zhang, G., Yao, T., Xie, H., Kang, S., Lei, Y., 2013. Increased mass over the TibetanPlateau: from lakes or glaciers? Geophys. Res. Lett. 40, 2125–2130.
Zhang, G., Yao, T., Xie, H., Qin, J., Ye, Q., Dai, Y., Guo, R., 2014a. Estimating surfacetemperature changes of lakes in the Tibetan Plateau using MODIS LST data. J.Geophys. Res. Atmos. 119 (14), 8552–8567.
Zhang, G., Yao, T., Xie, H., Zhang, K., Zhu, F., 2014b. Lakes’ state and abundanceacross the Tibetan Plateau. Chin. Sci. Bull. 59 (24), 3010–3021.
Zhang, G., Yao, T., Xie, H., Wang, W., Yang, W., 2015. An inventory of glacial lakes inthe Third Pole region and their changes in response to global warming. Glob.Planet. Change 131, 148–157.
Zhang, X., Ren, Y., Yin, Z.-Y., Lin, Z., Zheng, D., 2009. Spatial and temporal variationpatterns of reference evapotranspiration across the Qinghai-Tibetan Plateauduring 1971–2004. J. Geophys. Res. 114 (D15). http://dx.doi.org/10.1029/2009jd011753.
Zhang, Y., Liu, C., Tang, Y., Yang, Y., 2007. Trends in pan evaporation and referenceand actual evapotranspiration across the Tibetan Plateau. J. Geophys. Res. 112(D12110). http://dx.doi.org/10.1029/2006JD008161.
Zhou, J., Wang, L., Zhang, Y., Guo, Y., Li, X., Liu, W., 2015. Exploring the water storagechanges in the largest lake (Selin Co) over the Tibetan Plateau during 2003–2012 from a basin-wide hydrological modeling. Water Resour. Res. 51, 8060–8086.
Zhou, S., Kang, S., Chen, F., Joswiak, D.R., 2013. Water balance observations revealsignificant subsurface water seepage from Lake Nam Co, south-central TibetanPlateau. J. Hydrol. 491, 89–99.
Zhu, L., Xie, M., Wu, Y., 2010. Quantitative analysis of lake area variations and theinfluence factors from 1971 to 2004 in the Nam Co basin of the Tibetan Plateau.Chin. Sci. Bull. 55 (13), 1294–1303.